Long-range detection of hydroacoustic signals from … · Long-range detection of hydroacoustic...
16
Long-range detection of hydroacoustic signals from large icebergs in the Ross Sea, Antarctica Jacques Talandier a , Olivier Hyvernaud b , Emile A. Okal c ; , Pierre-Franck Piserchia a a De ¤partement Analyse et Surveillance de l’Environnement, Commissariat a ' l’Energie Atomique, B.P. 12, F-91680 Bruye 'res-le-Cha “tel, France b Laboratoire de De ¤tection et Ge ¤ophysique, Commissariat a ' l’Energie Atomique, B.P. 640, F-98713 Papeete, Tahiti, French Polynesia c Department of Geological Sciences, Northwestern University, Evanston, IL 60208, USA Abstract Hydroacoustic signals detected in late 2000 by seismic stations in Polynesia are shown to originate from huge icebergs which at the time were drifting in the Ross Sea after calving off the Ross Ice Shelf. The signals present a broad variety of spectral characteristics, most of them featuring prominent eigenfrequencies in the 4^7 Hz range, often complemented by overtones. Most epicenters, obtained by combining observations of distant hydroacoustic and regional seismic records, follow the spatio^temporal evolution of the drift of iceberg B-15B. Most of the signals are generated during a 36-day time window when it is speculated that B-15B collided with smaller icebergs or was scraping the ocean floor on the shallow continental shelf. We speculate on the possible physical nature of the resonator generating the signals, which could correspond to an elastic mode of the iceberg, or to the oscillation of fluid-filled cracks in the ice. ȣ 2002 Elsevier Science B.V. All rights reserved. Keywords: acoustical methods; seismic waves; icebergs 1. Introduction We report in this paper the detection by the Polynesian Seismic Network (Re ¤seau Sismique Polyne ¤sien; hereafter RSP) of hydroacoustic sig- nals (T phases) originating from huge icebergs which were drifting in the Ross Sea in Late 2000, after calving o¡ the Ross Ice Shelf around May 2000. The signals o¡er a broad variety of spectral characteristics and the exact nature of their sources remains speculative. However, their locations, obtained from a combination of distant T phases and of seismic waves recorded at land- based Antarctic stations, correlate perfectly with the positions of the bergs, as tracked by satellite imagery, thus clearly associating the acoustic sources with mechanical processes inside the ice- bergs. In the context of the monitoring of the Comprehensive Nuclear-Test Ban Treaty (CTBT), these events provide new insight into the nature of sources contributing energy into the hydroacous- tic spectrum. They further illustrate the powerful synergy achieved by combining datasets of a dif- ferent nature, i.e. regional seismic waves and T phases recorded at island stations. 0012-821X / 02 / $ ^ see front matter ȣ 2002 Elsevier Science B.V. All rights reserved. PII:S0012-821X(02)00867-1 * Corresponding author. Tel.: +1-847-491-3238; Fax: +1-847-491-8060. E-mail address: [email protected] (E.A. Okal). Earth and Planetary Science Letters 203 (2002) 519^534 www.elsevier.com/locate/epsl
Transcript of Long-range detection of hydroacoustic signals from … · Long-range detection of hydroacoustic...
Long-range detection of hydroacoustic signals fromlarge icebergs in the Ross Sea, Antarctica
Jacques Talandier a, Olivier Hyvernaud b, Emile A. Okal c;�,Pierre-Franck Piserchia a
a De¤partement Analyse et Surveillance de l’Environnement, Commissariat a' l’Energie Atomique, B.P. 12,F-91680 Bruye'res-le-Cha“tel, France
b Laboratoire de De¤tection et Ge¤ophysique, Commissariat a' l’Energie Atomique, B.P. 640, F-98713 Papeete, Tahiti, French Polynesiac Department of Geological Sciences, Northwestern University, Evanston, IL 60208, USA
Abstract
Hydroacoustic signals detected in late 2000 by seismic stations in Polynesia are shown to originate from hugeicebergs which at the time were drifting in the Ross Sea after calving off the Ross Ice Shelf. The signals present abroad variety of spectral characteristics, most of them featuring prominent eigenfrequencies in the 4^7 Hz range, oftencomplemented by overtones. Most epicenters, obtained by combining observations of distant hydroacoustic andregional seismic records, follow the spatio^temporal evolution of the drift of iceberg B-15B. Most of the signals aregenerated during a 36-day time window when it is speculated that B-15B collided with smaller icebergs or wasscraping the ocean floor on the shallow continental shelf. We speculate on the possible physical nature of theresonator generating the signals, which could correspond to an elastic mode of the iceberg, or to the oscillation offluid-filled cracks in the ice.4 2002 Elsevier Science B.V. All rights reserved.
Keywords: acoustical methods; seismic waves; icebergs
1. Introduction
We report in this paper the detection by thePolynesian Seismic Network (Re¤seau SismiquePolyne¤sien; hereafter RSP) of hydroacoustic sig-nals (T phases) originating from huge icebergswhich were drifting in the Ross Sea in Late2000, after calving o¡ the Ross Ice Shelf aroundMay 2000. The signals o¡er a broad variety ofspectral characteristics and the exact nature of
their sources remains speculative. However, theirlocations, obtained from a combination of distantT phases and of seismic waves recorded at land-based Antarctic stations, correlate perfectly withthe positions of the bergs, as tracked by satelliteimagery, thus clearly associating the acousticsources with mechanical processes inside the ice-bergs. In the context of the monitoring of theComprehensive Nuclear-Test Ban Treaty (CTBT),these events provide new insight into the nature ofsources contributing energy into the hydroacous-tic spectrum. They further illustrate the powerfulsynergy achieved by combining datasets of a dif-ferent nature, i.e. regional seismic waves and Tphases recorded at island stations.
0012-821X / 02 / $ ^ see front matter 4 2002 Elsevier Science B.V. All rights reserved.PII: S 0 0 1 2 - 8 2 1 X ( 0 2 ) 0 0 8 6 7 - 1
* Corresponding author. Tel. : +1-847-491-3238;Fax: +1-847-491-8060.E-mail address: [email protected] (E.A. Okal).
EPSL 6386 25-9-02 Cyaan Magenta Geel Zwart
Earth and Planetary Science Letters 203 (2002) 519^534
www.elsevier.com/locate/epsl

The RSP has been described in many previouspublications [1]. The operation, at its sites, of re-cording channels equipped with ¢lters boostingmagni¢cation in the 2^10 Hz range [2] helped in-troduce the concept of the T-phase stations latermandated by the CTBT [3]. The detection capa-bilities of the RSP were highlighted during theHollister swarm of 1991^1993, leading Talandierand Okal [4] to the identi¢cation of a major vol-canic edi¢ce linking the Paci¢c^Antarctic Ridgeto the Louisville Ridge, later discovered and sur-veyed by Ge¤li et al. [5], during a cruise of the N/OL’Atalante.
2. Detection
2.1. General characteristics of the signals
Starting in August 2000, the RSP stations atTubuai (TBI), Vaihoa (VAH), Taravao (TVO),and Rikitea (RKT) detected irregular activityoriginating from the Southern Ocean. We reporthere on a group of 13 sequences (hereafter the‘Ross Events’) with most of the activity concen-trated in November and December 2000. Theirprincipal properties are listed in Table 1, andFig. 1A^D shows representative spectrograms ofsignals recorded at VAH, a station located on thesouthern shore of the atoll of Rangiroa. In suchconditions, the acoustic-to-seismic conversion isparticularly e⁄cient [6], and given the shortpost-conversion path (not exceeding 100 m), theseismic signal at the T-phase station is essentiallyequivalent to the acoustic one inside the SOFAR,within the frequency window of interest(29 f9 16 Hz). The examples shown documenta remarkable variability among events. In mostinstances, the energy is concentrated at one orseveral prominent frequencies, which suggeststhat its source must involve the oscillation ofsome kind of resonator, a model also supportedby the often long duration of the signals, e.g.Event 4, which lasted for 3 h. However, somesequences feature signi¢cantly broader spectra(e.g. Event 12), and some, like Event 2 (Fig.1A), last no more than 2 min. In addition, thefrequency of the largely monochromatic signals
does £uctuate with time, a property already ob-served during the Hollister swarm [4], with someof the Ross events featuring more substantial var-iations of frequency with time (e.g. Event 7, seebelow, Section 4), which give the spectrograms acontorted, ‘snake-shaped’ aspect. Finally, severalsequences end with singular signals exhibiting anincrease of frequency with time (suggestive of theshrinking of the resonator), which can be slowand gradual (Event 4) or fast and abrupt (Event3, Fig. 1B). Event 13 (Fig. 1D) terminates througha complex evolution of prominent frequencieswith time, featuring several episodes of frequencydecrease, a property termed ‘gliding’ and identi-¢ed during episodes of volcanic tremor [7], whichin general terms would suggest a geometrical ex-pansion of the resonator [8].
2.2. Detection of T phases at other sites
A systematic e¡ort was made to complementthe RSP dataset with records at other Paci¢c seis-mic stations (Fig. 2). When available, the IRISstation at Rarotonga (RAR) provided increasedazimuthal aperture; it was, however, inoperativefrom 04 to 18 December 2000. Unfortunately, noother seismic station could contribute T-phase sig-nals, and this for a variety of reasons, which wedeem important to discuss, as they give insightinto the performance of seismic stations as hydro-acoustic detectors, notably in the context of themonitoring of the CTBT. These include blockage(by the large Campbell Plateau and New Zealand)at Noumea (NOUC), by the Samoa Islands atJohnston (JOHN), and by Rangiroa and the Tua-motu Plateau at the ocean-bottom observatoryH2O, where neither a seismic nor a pressure sig-nal could be detected; unfavorable station loca-tions involving long post-conversion seismic pathsat Tasmania University (TAU), Kipapa (KIP)and Christmas (XMAS); a probable combinationof those two e¡ects at Van Inlet (VIB), blockedby the Tuamotu Plateau east of VAH (Fig. 2B);and a high level of background noise at the smallisland of Pitcairn (PTCN). Finally, no signal wasidenti¢ed at Easter Island (RPN), where T-phasedetection has been previously recognized as irreg-ular [9^11]. In this respect, and despite the gener-
EPSL 6386 25-9-02 Cyaan Magenta Geel Zwart
J. Talandier et al. / Earth and Planetary Science Letters 203 (2002) 519^534520

Table 1Principal characteristics of the 13 events studied
Number Date and time Epicenter Duration Peak-to-peakvelocity at VAH
Remarks
D M (J) (‡S) (‡E) (min) (Wm/s)
1 15 AUG (228)22:28:18.6
78.21 3168.61 1.3 1.23 Edge of Ross Ice Shelf. No data at RAR, RKT.Monochromatic signal (3.5 Hz) with overtones;sharp impulsive beginning.
2 08 NOV (313)22:18:31.3
72.10 170.16 2 2.18 Borchgrevink Land. Relatively monochromatic;frequency £uctuates; no overtones.
3 12 NOV (317)01:13:26.6
75.76 3175.75 8 0.62 Central Ross Sea. Generally weak at Antarcticstations. Narrow spectrum centered around 4 Hz.Strong ¢nal pu¡ with frequency increasing withtime.
4 12 NOV (317)06:00^09:00
75.8 3175.8 3 h 0.24 Central Ross Sea. Only traces in Polynesia(except VAH); no signal at SBA and Erebus.Long signal, generally monochromatic (2.5^4 Hz),with frequency £uctuations but few overtones.
5 14 NOV (319)01:01:56.6
75.92 3175.60 3 0.81 Central Ross Sea. No data: Erebus; no signal:SBA. Relatively broad spectrum on acousticrecords. Dominant frequency 2.5 Hz at VNDA.
6 19 NOV (324)W02:30
75.8 3175.8 10 0.42 No signal: RSP except VAH. No data: Erebus,SBA. Broad spectrum (2^16 Hz). Assumed insame area as Events 3^5, based on times atVNDA and VAH.
7 21 NOV (326)15:22
75.8 3175.8 10 0.24 No signal: Polynesia except VAH. No data:Erebus, SBA. Fluctuation of dominant f, leadingto ‘snake-shaped’ spectrogram. Assumed at samelocation as Events 4^6, based on VNDA andVAH times.
8 22 NOV (327)21:32:13.0
75.85 3176.28 10 0.34 Central Ross Sea. No data: Erebus, SBA. Samegeneral characteristics as Event 7.
9 05 DEC (340)03:21:19.8
75.08 3177.75 8 0.30 Central Ross Sea. No data: Erebus; no signal:SBA. Broad spectrum (2^10 Hz), with dominantf= 2.9 Hz. Final sequence with sharply increasingfrequency.
10 05 DEC (340)W20:46
75.1 3177.8 15 0.32 Noisy record; broad spectrum (2^10 Hz), withtwo sequences; assumed to share location ofEvent 9.
11 15 DEC (350)03:16:14
74.4 3178.4 10 0.44 Central Ross Sea. No signal: SBA. Broad spectra(2^12 Hz); weak correlation of acoustic andseismic records.
12 18 DEC (353)09:56:29.1
74.82 3178.68 8 0.42 Central Ross Sea. Two parts; ¢rst short (30 s)with impulsive start; second emergent and long(150 s). Broad spectrum.
13 14 JAN (014)2001 17:36:10
67.0 141.5 7 1.31 O¡ Oates or George V coasts. No signal: RKT;all Antarctic stations. Relatively broad spectrumwith dominant f at 4, 5.5 and 7 Hz; ¢rstsequence ends abruptly, followed by short (60 s)pu¡, with spectrogram showing several lines ofstrongly decreasing frequencies (gliding). Locationonly tentative.
EPSL 6386 25-9-02 Cyaan Magenta Geel Zwart
J. Talandier et al. / Earth and Planetary Science Letters 203 (2002) 519^534 521

EPSL 6386 25-9-02 Cyaan Magenta Geel Zwart
J. Talandier et al. / Earth and Planetary Science Letters 203 (2002) 519^534522

ally low level of the signals involved (at most afew Wm/s at VAH), these observations stress, ifneed be, the importance of deploying T-phase sta-tions on atolls (VAH) or on volcanic edi¢cesfringed by coral reefs (RKT, RAR, TBI), whosesteep slopes act to optimize the acoustic-to-seis-mic conversion [6].
3. Location
3.1. Location from hydroacoustic records
The principal events in the sequence were ¢rstlocated using the techniques developed during theHollister swarm [4] : whenever possible, impulsivearrival times of sharp sub-events were used; intheir absence, di¡erential travel-times betweenstations were determined by cross-correlating the£uctuations with time of the frequency of mono-chromatic T waves. After implementing stationcorrections in order to compensate for the post-conversion land path traveled as a seismic wave atthe receiver [6], the locations of the sources wereinverted using the seasonally adjusted, laterallyvarying model of acoustic velocities of Levitus etal. [12]. The technique is enhanced by a MonteCarlo algorithm which injects Gaussian noiseinto the dataset of arrival times [13] ; in thepresent study, we use a conservative standard de-viation cG = 4 s, and iterate the process 500 times.A best-¢tting ellipse is then computed for the re-sulting cluster of epicenters.
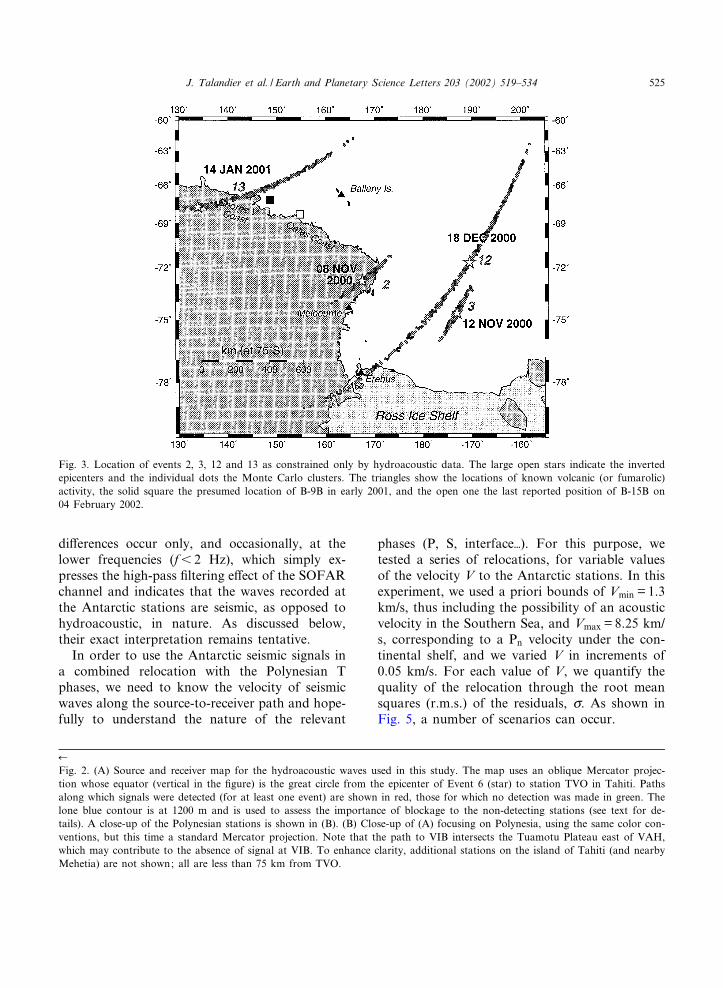
Representative results of this preliminary e¡ortare shown in Fig. 3. In all cases, the epicenterslocate in the general area of the Ross Sea, and ofthe Borchgrevink and George V coasts of Antarc-
tica, but the limited azimuthal coverage providedby the band of available stations (at most 30‡)results in weak resolution of epicentral distance.In general, we obtain meaningful constraintswhen the dataset includes the lateral stationsRAR and RKT (e.g. Events 2 and 3; azimuthwindow: 27‡); distance becomes exceedingly un-constrained when either one is unavailable(Events 12 and 13; azimuth window: 11^16‡);and the location cannot converge in the absenceof both RAR and RKT, the azimuthal windowhaving then shrunk to no more than 2‡ (e.g. Event1). Nevertheless, several statistically distinctgroups can be identi¢ed, with Events 2 and 13along the coasts, while the remaining epicenterslocate in the center of the Ross Sea.
3.2. Seismic records at Antarctic stations
In view of these preliminary results, we con-ducted a systematic search for additional recordsof conventional seismic waves at Antarctic sta-tions. We were able to identify signals at theIRIS station at Scott Base (SBA), at the GTSNstation Vanda (VNDA), and at stations of theMount Erebus Volcanic Observatory on Ross Is-land (MEVO; courtesy of Dr. Richard Aster). Wewere unable to detect any signal at the IRIS sta-tion at the South Pole (SPA), nor at the moredistant stations Casey (CASY; IRIS) and Du-mont d’Urville (DRV; Geoscope), along the coastof East Antarctica (Fig. 2A).
As shown in Fig. 4, the spectral characteristicsof the Polynesian T phases and of the seismicphases at Antarctic stations often exhibit a spec-tacular similarity, leaving no possible doubt thatthey were generated by the same events. Major
6
Fig. 1. (A) T-phase record of Event 2 at Vaihoa. The ¢gure is composed of three frames: The bottom one shows a 160-s time se-ries of the ground velocity (in black), high-pass-¢ltered for fv 2 Hz. The frame at the right is a plot of the amplitude spectrumof the high-pass-¢ltered ground velocity record. The main color frame is a spectrogram representation of the distribution of spec-tral amplitude in the record, as a function of time and frequency. The color-coding is logarithmic, with the key (in dB relative tothe most energetic pixel) given at bottom right. White pixels correspond to spectral amplitudes below 340 dB. Note the impul-sive start of the signal and the slow, contained, £uctuation of the prominent frequency with time. (B) Same as (A) for Event 3.The time series is now 600 s long. Note the singular signal ending the sequence, featuring an increase of frequency with time.(C) Same as (A) for Event 9. Note the relative complexity of the spectrum and the trend towards an increase in frequency at theend of the main pulse (400 s into the signal). (D) Same as (A) for Event 13. Note the complex character of the spectrogram, es-pecially in the ¢nal phases of the pulse, where the eigenfrequency tends to decrease with time (‘gliding’).
EPSL 6386 25-9-02 Cyaan Magenta Geel Zwart
J. Talandier et al. / Earth and Planetary Science Letters 203 (2002) 519^534 523

EPSL 6386 25-9-02 Cyaan Magenta Geel Zwart
J. Talandier et al. / Earth and Planetary Science Letters 203 (2002) 519^534524
di¡erences occur only, and occasionally, at thelower frequencies (f6 2 Hz), which simply ex-presses the high-pass ¢ltering e¡ect of the SOFARchannel and indicates that the waves recorded atthe Antarctic stations are seismic, as opposed tohydroacoustic, in nature. As discussed below,their exact interpretation remains tentative.
In order to use the Antarctic seismic signals ina combined relocation with the Polynesian Tphases, we need to know the velocity of seismicwaves along the source-to-receiver path and hope-fully to understand the nature of the relevant
phases (P, S, interfaceT). For this purpose, wetested a series of relocations, for variable valuesof the velocity V to the Antarctic stations. In thisexperiment, we used a priori bounds of Vmin = 1.3km/s, thus including the possibility of an acousticvelocity in the Southern Sea, and Vmax = 8.25 km/s, corresponding to a Pn velocity under the con-tinental shelf, and we varied V in increments of0.05 km/s. For each value of V, we quantify thequality of the relocation through the root meansquares (r.m.s.) of the residuals, c. As shown inFig. 5, a number of scenarios can occur.
Fig. 3. Location of events 2, 3, 12 and 13 as constrained only by hydroacoustic data. The large open stars indicate the invertedepicenters and the individual dots the Monte Carlo clusters. The triangles show the locations of known volcanic (or fumarolic)activity, the solid square the presumed location of B-9B in early 2001, and the open one the last reported position of B-15B on04 February 2002.
6
Fig. 2. (A) Source and receiver map for the hydroacoustic waves used in this study. The map uses an oblique Mercator projec-tion whose equator (vertical in the ¢gure) is the great circle from the epicenter of Event 6 (star) to station TVO in Tahiti. Pathsalong which signals were detected (for at least one event) are shown in red, those for which no detection was made in green. Thelone blue contour is at 1200 m and is used to assess the importance of blockage to the non-detecting stations (see text for de-tails). A close-up of the Polynesian stations is shown in (B). (B) Close-up of (A) focusing on Polynesia, using the same color con-ventions, but this time a standard Mercator projection. Note that the path to VIB intersects the Tuamotu Plateau east of VAH,which may contribute to the absence of signal at VIB. To enhance clarity, additional stations on the island of Tahiti (and nearbyMehetia) are not shown; all are less than 75 km from TVO.
EPSL 6386 25-9-02 Cyaan Magenta Geel Zwart
J. Talandier et al. / Earth and Planetary Science Letters 203 (2002) 519^534 525

If only one station is available in Antarctica(Events 5, 8 and 9), V cannot be resolved, for itsimply trades o¡ with the position of the sourcealong the major axis of the cluster of hydroacous-tic locations. However, in the presence of severalAntarctic seismic data (Events 3, 11 and 12), their
relative times e¡ectively resolve V and thus allowrelocation with an acceptable c, of generally lessthan 1.5 s. In all such cases, we can reject prop-agation as a conventional acoustic wave in water(VWVmin) and in most cases, as a conventional Pphase (either in the crust, VW6 km/s, or as Pn
Fig. 4. Comparison of spectrograms from acoustic and seismic records from Event 7 at VAH (T phase; top) and at VNDA (seis-mic phase; bottom). Note the excellent correlation between the two spectra.
EPSL 6386 25-9-02 Cyaan Magenta Geel Zwart
J. Talandier et al. / Earth and Planetary Science Letters 203 (2002) 519^534526

under the Mohorovic›ic¤ discontinuity, VWVmax).Rather, the best-¢tting value V is in those casesVopt = 3.7 X 0.2 km/s.
The only exception to this pattern is Event 2(08 November 2000), for which Fig. 5 shows thatc remains acceptable (less than 2 s) even forV=Vmax, although the best-¢tting value is indeedV= 3.9 km/s, within the general range for the oth-er events. This is because, in the particular geom-etry of Event 2, all possible T-phase epicenters(Fig. 3) are practically equidistant from VNDA
and the SBA^MEVO group, which provides es-sentially no resolution of V.
The interpretation of Vopt is not straightfor-ward and remains somewhat unresolved. On theone hand, it matches the velocity of P waves inrecrystallized ice [14,15]. However, and even forEvent 1, which may have occurred on the RossIce Shelf or at its boundary (see below), this in-terpretation is improbable, since the ice shelf is300 m thick, i.e. less than 1/5 of the longest wave-lengths recorded in Antarctica. For the other
Fig. 5. Quality of combined seismic^hydroacoustic relocations for variable values of the seismic velocity V to the seismic re-ceivers. For each event considered, we vary V from Vmin = 1.3 to Vmax = 8.25 km/s, and attempt to relocate the event. The opensymbols correspond to events for which only one Antarctic station is available (VNDA). In the case of Event 1, the relocationfails for Vv 5.1 km/s or V9 3 km/s.
EPSL 6386 25-9-02 Cyaan Magenta Geel Zwart
J. Talandier et al. / Earth and Planetary Science Letters 203 (2002) 519^534 527

events farther North, satellite imagery disprovesthe existence of a continuous layer of thick icealong the path to VNDA in the western part ofthe Ross Sea Basin (a shallow layer of sea ice,typically only a few meters thick, is totally trans-parent at the relevant frequencies).
Rather, we propose to interpret the arrivals atVopt = 3.7 km/s as Lg wavetrains, generally inter-preted as shear energy trapped in the continentalcrust (e.g. [16,17]).
As documented, for example by Bouchon [18]and Campillo et al. [19], Lg can be the ¢rst prom-inent arrival at regional distances in conditionswhere P arrivals do not emerge from noise, inparticular for shallow crustal dislocation sources.Also, Lg energy can propagate e⁄ciently at fre-quencies of a few Hz [18] and is distributedamong the three components of ground motion,a property that we veri¢ed on a few availablethree-component records at VNDA. Furthermore,the value of Vopt falls in the range of predictedand observed Lg velocities at the relevant frequen-cies [20]. Finally, we will see that the epicentrallocations of the Ross Sea events are on the con-tinental shelf or at its boundaries, so that Lg
wavetrains would not be blocked by transit overan oceanic path [21]. Note that we did not at-tempt to assign a magnitude mbLg [22] to ourevents, given the singular character of their largelymonochromatic spectra.
Despite our inability to identify the nature ofthe seismic phases recorded at Antarctic stations,we used the optimized velocity Vopt = 3.7 km/s forall seismic phases at Antarctic stations, to locatethe Ross events from a combined dataset ofacoustic and seismic arrival times.
3.3. Results
Out of the 13 sequences investigated, we obtainseven very well constrained locations, with semi-major axes of W25 km for the Monte Carlo el-lipses (Events 2, 3, 5, 8, 10, 11 and 12), and twopoorly resolved ones (Events 1 and 13). The re-maining sequences (Events 4, 6, 7 and 9) are givententative locations based on their temporal asso-ciation with well located events. Fig. 6 shows thatall epicenters, except Events 1, 2 and 13, fall in the
center of the Ross Sea. The location of Event 13(Fig. 1D), which was recorded neither by the Ant-arctic stations nor by RKT, could not be im-proved beyond the estimate obtained from Poly-nesian T phases (Fig. 3). Event 1 (15 August2000) has a large uncertainty, but lies signi¢cantlySouth of the November^December group. As forEvent 2 (08 November 2000), it has a well con-strained epicenter just South of Cape Adare onthe Borchgrevink Coast.
4. Discussion
4.1. Volcanism?
Because of our previous experience with theHollister swarm [4], we ¢rst attempted to interpretthe Ross signals as expressing volcanic activity.However, all nine located events cannot share acommon epicenter. This is well documented bythe Monte Carlo ellipses in Fig. 6, and was con-¢rmed by a formal attempt at inverting the fulldataset of arrival times for a common epicenterand distinct origin times. This resulted in unac-ceptable residuals of more than 1 min, evenamong Polynesian stations, and regardless of thevalue chosen for the Antarctic stations’ velocityV, a result expected from the large separationbetween individual hydroacoustic Monte Carloclusters (Fig. 3). We conclude that the source ofthe Ross Sea events moved with time in a SE toNW direction (with the exception of Event 2).Their spatio^temporal evolution is in sharp con-trast with our previous experience of long-rangehydroacoustic detection at volcanic sites such asMacdonald Seamount [23] and Hollister Ridge[4], and it strongly argues against a volcanic ori-gin for the Ross Sea events.
To further eliminate this interpretation, we ex-plored the quality of residuals when constrainingthe sources at either of the three known sites ofvolcanic (or fumarolic) activity in the area: Ere-bus (77.6‡S; 167.2‡E), Melbourne (74.35‡S;164.70‡E) and the Balleny Islands (66‡S; 163‡E).In all cases tested, r.m.s. residuals exceeding sev-eral minutes made these locations unacceptable.In the case of Event 12, for example, Erebus
EPSL 6386 25-9-02 Cyaan Magenta Geel Zwart
J. Talandier et al. / Earth and Planetary Science Letters 203 (2002) 519^534528

was a legitimate epicenter on the basis of the RSPhydroacoustic data alone (Fig. 3), but the inclu-sion of the Antarctic dataset leads to a discrep-ancy of more than 9 min between Polynesian andAntarctic stations, this result being essentially in-dependent of V because of the proximity of Ere-bus to SBA, MEVO, and to a large extent,VNDA. We reject volcanism as a source of theRoss Sea events, since even an uncharted volcanicsource would have had to move hundreds of kilo-
meters across the Ross Sea over a period of a fewweeks.
4.2. Correlation with icebergs
We propose that the sources of the Ross Seaevents lie within very large icebergs, documentedto have calved o¡ the Ross Ice Shelf in the (north-ern) Spring of 2000, and which were driftingacross the Ross Sea in a NNW direction during
Fig. 6. Final epicenters obtained by joint inversion of T-phase and seismic data. The individual epicenters are shown as black sol-id dots and the associated Monte Carlo ellipses are shaded (see color key at right; Event numbers in italics). The position ofB-15B is shown schematically at a number of dates from August 2000 to January 2001 (color-keyed; legend at top). Positions ofthe smaller iceberg B-17 are also shown at a few critical times until Late November 2000, when it breaks up into pieces followingits collision with B-15B. The paths of the two icebergs are also shown continuously by the dotted (B-15B) and dashed (B-17)lines. The upward-pointing triangles show the global network seismic stations VNDA and SBA, the downward-pointing ones theMEVO network on Ross Island. The dark blue region schematizes the portion of the shelf which calved o¡ and eventually gaverise to the B-15 and B-17 series. The projection is equidistant azimuthal centered at the South Pole.
EPSL 6386 25-9-02 Cyaan Magenta Geel Zwart
J. Talandier et al. / Earth and Planetary Science Letters 203 (2002) 519^534 529

the later part of the year. We base our interpre-tation on the dataset of reported coordinates andinfrared satellite photographs available from theweb site of the University of Wisconsin’s Antarc-tic Meteorological Research Center [24].
Around March^April 2000, Iceberg B-15 (oftruly gigantic proportions ^ 300 km by 40 km)and the smaller B-17 to the east calved o¡ theshelf around 78‡S, between 177 and 165‡W. By15 August 2000, the date of Event 1, B-15 hadbroken into two principal pieces, B-15A andB-15B, and several smaller ones (Fig. 7). Amongthose, B-15A then hugs the northern rim of theice shelf, and eventually spends several monthsstuck between Ross, Beaufort and Franklin Is-lands, while the slightly smaller B-15B (still a mas-sive unit at 135 km by 40 km) takes a northerlypath towards the center of the Ross Sea, at anaverage drift velocity of 4 km/day (or 5 cm/s).Fig. 6 plots the positions of B-15B and B-17 ata number of dates between November 2000 andJanuary 2001. During that time, B-15B engages ina large rotation, collides with B-17 in early No-vember 2000, calves o¡ a further small fragment,B-15F, on its west side, some time between 14 and29 November 2000, and frees itself from B-17 asthe latter breaks into pieces around 30 December2000. By 05 January 2001, B-15B has taken anorthwesterly direction, rounds Cape Adareabout 03 May 2001 (it has then broken into two
parts), and then progresses along the Oates Coast,where it currently (February 2002) lies around155‡E [25].
Fig. 6 shows a spectacular correlation betweenthe epicenters of Events 3, 5, 8, 10, 11 and 12 (andhence presumably of the intervening Events 4, 6, 7and 9) and the location of B-15B and B-17. Inparticular, the spatio^temporal evolution fromthe SSE group of epicenters (3, 5, 8) in Novemberto the NNW one (10, 11, 12) in December mimicsthe drift and rotation of B-15B. In the case of therelatively poorly located Event 1 (on 15 August2000), the northern end of its large Monte Carloellipse similarly intersects the position of B-15Bon that same day.
We cannot propose any similarly compellingassociation with icebergs for the remaining Events2 and 13. We note, however, that the relevantportions of the Borchgrevink and George Vcoasts feature numerous ice tongues, protrudinginto the ocean, and from which substantial ice-bergs calve o¡ regularly. For example, in thecase of Event 13 (poorly located on the basis ofonly a depleted set of hydroacoustic data), thecluster of Monte Carlo epicenters intersects thecoast in the vicinity of the Mertz and Ninnis Gla-cier tongues, the latter (68‡S; 148‡E) having dis-integrated in January 2000 through calving o¡two large (but not gigantic) icebergs. We haveno information on the drift of these fragmentsafter April 2000. Alternatively, we note the pres-ence of the veteran, very large iceberg B-9B (2900km2), which was stationary at 67.2‡S; 148.6‡E(solid square in Fig. 3) between 06 November2000 and 26 January 2001. Given the poor qualityof Event 13’s location, we cannot rule out that itssource was B-9B.
We could ¢nd no information on possible ice-bergs in the vicinity of Epicenter 2 (08 November2000); we note, however, its proximity to themouth of Tucker Glacier in Borchgrevink Coast.
4.3. Possible triggering mechanisms
We focus henceforth on the remarkable clusterof events (1, 3^12) which correlate with the posi-tion of B-15B as it drifts northwards across theRoss Sea. As discussed below, we can o¡er only
Fig. 7. Satellite image of B-15A and B-15B taken by theDMSP-F14 satellite on 10 August 2000 (courtesy of M. Laz-zara). This view looks NNE from the Ross Ice Shelf into theRoss Sea. The total length of B-15B is 135 km. After [24].
EPSL 6386 25-9-02 Cyaan Magenta Geel Zwart
J. Talandier et al. / Earth and Planetary Science Letters 203 (2002) 519^534530

vague speculation as to the nature of the eventstaking place inside the icebergs and generating thehydroacoustic and seismic signals studied. What-ever these phenomena may be, it is remarkablethat they take place only during a small part ofthe long drift of B-15B from the Ross Ice Shelf toCape Adare and beyond, namely during a 36-daywindow and over a distance of less than 200 km(with the exception of Event 1, farther south). Inparticular, B-15B becomes silent after 18 Decem-ber 2000, and during its 4-month voyage to CapeAdare. We know of no prominent bathymetricfeature which would explain this pattern throughhydroacoustic blockage along the path to Polyne-sia. Rather, B-15B’s silence must re£ect the cessa-tion of the physical source process.
Possible mechanisms for the excitation of anoscillator that would be geographically (or tem-porally) controlled include collisions with otherice masses and rubbing on the sea £oor. Wenote in particular that the activity in B-15B startson 12 November 2000, a time when it has collidedwith the more easterly B-17, and ceases after 18December 2000. A possible scenario would thencorrelate the Ross Sea events with the collisionbetween B-15B and B-17, which lasted at least1 month, until B-17 broke into pieces at the endof December. Another scenario would invoke fric-tion on the £oor of the Ross Sea, as a mechanismcontrolling the mechanical sources in the icebergs.Bathymetric coverage of the Ross Sea is scarce,especially since the relevant area lies outside thesouthern limit (72‡S) of the satellite altimetry da-tabase [26]. However, the northern portion ofB-15B’s path (traveled westwards after 01 January2001) most probably lies over deep water, whereasits southern portion (traveled northwards) is overthe continental shelf. We can only speculate as tothe presence of large seamounts or other under-water structures, against which the iceberg couldhave rubbed, but the spatio^temporal distributionof the Ross Sea events would be in very generalagreement with this scenario. We also note thatsigni¢cant iceberg furrows have been documentedon the sea £oor, including around Antarctica, atdepths as great as 400^500 m [27,28], making itlegitimate to assume that motion over the conti-nental shelf at similar depths would occasionally
involve scraping against bathymetric features. Fi-nally, as shown by Campillo et al. [19], a super-¢cial source (such as an iceberg scraping theocean £oor) will excite Lg most e⁄ciently, where-as the excitation of Pg would be relatively insen-sitive to depth; these properties would lead natu-rally to Lg being the prominent seismic phase forsources exciting the solid Earth at the water^crustinterface.
4.4. Speculation about the possible nature of theresonators
Regarding the physical nature of the sources ofthe Ross Sea signals, the pre-eminence of distinc-tive frequencies (typically 4 Hz) in many spectra(occasionally with harmonics) suggests the oscil-lation of a resonator. In this respect, our sourcesdi¡er signi¢cantly from the ‘icequakes’ widely ob-served at seismic stations deployed on ice. Thelatter correspond to the failure of cracks in theice, under stresses induced either thermally or bythe slow £ow of the ice [29]. Being essentially in-stantaneous sources, they are characterized byshort durations and a broad spectrum featuringhigh frequencies [30]. Even the so-called ‘low-fre-quency icequakes’, attributed to calving o¡ iceblocks from glaciers [31] and occasionally featur-ing a monochromatic spectrum [32], are of muchshorter duration than the Ross events.
To investigate more in detail the spectral char-acteristics (eigenfrequency and quality factor Q)of a representative signal, we selected the VAHrecord from Event 4 (on 12 November 2000) be-cause of its exceptional duration (3 h). We use arunning window of 81.9 s duration (4096 sam-ples), o¡set 10 s at a time. At each step, wethen identify the frequency f0 at which the spec-tral amplitude X(f) reaches its maximum, whichwe interpret as the eigenfrequency of the resona-tor, and we ¢t a resonance curve of the form:
X rðf Þ ¼Affiffiffiffiffiffiffiffiffiffiffiffiffiffiffiffiffiffiffiffiffiffiffiffiffiffiffiffiffiffiffiffi
ðf3f 0Þ2 þ Z2f 2
0
Q2
s ð1Þ
to the shape of the spectral amplitude X(f) in thefrequency interval I {f030.125 Hz9 f9 f0+0.125
EPSL 6386 25-9-02 Cyaan Magenta Geel Zwart
J. Talandier et al. / Earth and Planetary Science Letters 203 (2002) 519^534 531

Hz}. We keep track of the amplitude X(f0) of thespectral peak, and of the quality of ¢t QUAL ofthe resonance curve (1) to the observed spectralline, which we de¢ne as the inverse of the r.m.s.residual c between X(f) and Xr(f) over the intervalI, scaled by the maximum spectral amplitude:QUAL=X(f0)/c. We retain only values of Q forthose windows where X(f0) is at least 40% of itsmaximum value and for which the parameterQUAL is at least 10, which leaves a total of 41Q values. The two frames in Fig. 8 show the var-iation of f0 and Q as a function of time t, taken atthe center of the running window.
While f0 can remain remarkably constant overintervals of time of a few minutes (see Fig. 1), Fig.8a shows that it varies signi¢cantly on a time scaleof tens of minutes. Changes in f0 can be continu-ous (e.g. the ‘gliding’ observed at the start of therecord), or sharp and stepwise, the windows withstronger and cleaner signals being more stable infrequency. This would require the presence of sev-eral oscillators, some of them capable of an evo-lution with time of their eigenfrequency, which inturn most probably expresses an evolution oftheir dimension.
The quality factors Q of the resonators range
between 100 and 650, with an inverse averagevalue of 250. This value is much greater thantypically reported for the sources of volcanictremor (Q= 5^10; [33]) or even during the Hollis-ter swarms (Q= 20^50; [4]), which constitutes anadditional strong argument against a volcanic ori-gin for the Ross Sea signals. The attenuation ofseismic waves in ice was studied in the Greenlandice¢eld by Langleben [34], who reported a fall-o¡coe⁄cient c1 = 4.45U1032 dB m31 kHz31, equiv-alent to Q= 166, and in sea ice by Kohnen [35],who gives a slope of attenuation with frequencyq= 0.56U1035 m31 Hz31, equivalent to Q= 175.Note, however, that these values were measuredat considerably higher frequencies in both studiesand on longitudinal waves in the latter.
Speculating further on the possible physical na-ture of the resonator, we note the approximatedimensions of B-15B: 135 km by 40 km, and wetake its thickness as at least 300 m, based on anestimation of the emerged fraction from airbornephotographs [24], and of the thickness of the RossIce Shelf from seismic soundings [15]. We canthen eliminate gravitational oscillations as thesource of the signals, since the bobbing frequencyof the iceberg on the sea would be on the order of30 mHz (conversely, the observed frequency of4 Hz would correspond to a thickness of only1.7 cm); rolling and pitching eigenfrequencieswould also be much lower than observed ^ onthe order of 20 mHz.
Rather, the frequencies observed could repre-sent various eigenmodes of oscillation of the ice-berg. For example, in the case of a 300-m thick icelayer, the eigenfrequency of a vertical shear modewould be 3.07 Hz (using a shear velocity L= 1.84km/s, corresponding to a Poisson ratio of 0.34).The eigenfrequency of a fundamental ‘Crary’mode [36,37] (essentially a shear wave propagat-ing horizontally with a phase velocity equal to theP velocity K) would be 3.51 Hz for the ice sheet ina vacuum; it could be a¡ected by the presence ofwater [37], but its order of magnitude would re-main in general agreement with the resonance fre-quencies observed in our signals. This interpreta-tion would be particularly likely under theassumption that the ice mass is set in resonanceby scraping the ocean £oor, or rubbing against
Fig. 8. Evolution of spectral properties with time duringEvent 4. (a) Frequency f0 at maximum of spectral amplitude.(b) Values of Q retained by application of the thresholds dis-cussed in text.
EPSL 6386 25-9-02 Cyaan Magenta Geel Zwart
J. Talandier et al. / Earth and Planetary Science Letters 203 (2002) 519^534532

another ice mass; it could also explain the pres-ence of harmonics, since several modes would beexcited by a source essentially similar to hitting abell, and resulting in musical ‘richness’. However,under this scenario, the iceberg would resonate ata set of discrete, well de¢ned pitches, and theobserved continuous £uctuation of eigenfrequencywith time would be di⁄cult to explain.
Another scenario would involve the resonanceof a £uid-¢lled cavity in a mode comparable tothe oscillation of magma within a ¢ssure in avolcanic system [33], the eigenfrequencies ofsuch as a resonator being complex functions ofits size and shape, and of the impedance contrastbetween the £uid ¢lling the crack and the sur-rounding medium [8]. In the case of icebergs,the £uid would have to be water, but the almostcertain presence of air bubbles could greatly re-duce its sound speed, making ‘resonance at longperiod [T] possible in a short crack’ [8]. By anal-ogy with models for volcanic tremor, it is esti-mated that cracks of dekametric size may justifythe range of observed frequencies ^ typically from2 to 7 Hz for the fundamental [8]. Furthermore,this scenario would explain the observed £uctua-tions of frequency with time, as both the dimen-sion of the resonator and the supply of air bub-bles could be expected to vary with timecontinuously, for example during ¢lling or empty-ing of the £uid in the crack. A catastrophic run-away failure of the crack may explain the ¢nalstages of evolution observed in Fig. 1B (whenthe crack may shrink and eventually close), orFig. 1D (if the crack opens fully and potentiallyan ice chunk separates). These interpretations re-main of course highly speculative at this point.
5. Conclusions
We have documented prolonged episodes of hy-droacoustic activity in the Ross Sea during themonths of August^December 2000. By combiningdatasets of T phases recorded in Polynesia withregional seismic phases recorded at Antarctic sta-tions, we obtain epicentral locations correlatingsystematically with the position of large icebergs,speci¢cally B-15B and B-17, which were drifting
in the Ross Sea at that time, and thus we con-clude that the signals originated at or inside theicebergs. Despite a broad variability in the spec-tral characteristics of the Ross events, they cannotbe compared to seismic sources previously identi-¢ed and analyzed in the ice environment, such asicequakes and calving events. Rather, our obser-vations de¢ne a new kind of source capable ofcontributing hydroacoustic energy to the SOFARchannel over extended periods of time. The pres-ence of preferential frequencies in the 3^7 Hzrange (often associated with overtones) clearly im-plicates the resonance of an oscillator, whose ex-act nature presently eludes us. In the context ofthe use of hydroacoustic waves for monitoring ofthe CTBT, it is clear that a deeper investigation ofthe phenomena involved is warranted; a possibleavenue would involve the direct deployment ofportable seismic stations on massive icebergsknown to be calving o¡ the major Antarctic iceshelves, most recently C-19 in May 2002 [24].
Acknowledgements
We thank Rick Aster for providing the Erebusnetwork data, Bernard Chouet, Michel Bouchonand Michel Vallon for discussion, and JackieCaplan-Aucherbach and another reviewer forhelpful comments. Matthew Lazzara kindly pro-vided a customized version of Fig. 7. Maps weredrawn using the GMT software of Wessel andSmith [38]. This research was supported at North-western University by the Department of Defenseunder Contract DTRA01-C-0065.
References
[1] E.A. Okal, J. Talandier, K.A. Sverdrup, T.H. Jordan,Seismicity and tectonic stress in the Southcentral Paci¢c,J. Geophys. Res. 85 (1980) 6479^6495.
[2] J. Talandier, G.T. Kuster, Seismicity and submarine vol-canic activity in French Polynesia, J. Geophys. Res. 81(1976) 936^948.
[3] E.A. Okal, T-phase stations for the International Moni-toring System of the Comprehensive Nuclear-Test BanTreaty: A global perspective, Seismol. Res. Lett. 72(2001) 186^196.
[4] J. Talandier, E.A. Okal, Monochromatic T waves from
EPSL 6386 25-9-02 Cyaan Magenta Geel Zwart
J. Talandier et al. / Earth and Planetary Science Letters 203 (2002) 519^534 533

underwater volcanoes in the Paci¢c Ocean: Ringing wit-nesses to geyser processes?, Bull. Seismol. Soc. Am. 86(1996) 1529^1544.
[5] L. Ge¤li, D. Aslanian, J.-L. Olivet, I. Vlastelic¤, L. Dosso,H. Guillou, H. Bougault, Location of Louisville hotspotand origin of Hollister Ridge: Geophysical constraints,Earth Planet. Sci. Lett. 164 (1998) 31^40.
[6] J. Talandier, E.A. Okal, On the mechanism of conversionof seismic waves to and from T waves in the vicinity ofisland shores, Bull. Seismol. Soc. Am. 88 (1998) 621^632.
[7] M.T. Hagerty, S.Y. Schwartz, M.A. Garce¤s, M. Protti,Analysis of seismic and acoustic observations at ArenalVolcano, Costa Rica, 1995^1997, J. Volcan. Geotherm.Res. 101 (2000) 27^65.
[8] B. Chouet, New methods and future trends in seismolog-ical volcano monitoring, in: R. Scarpa, R.I. Tilling (Eds.),Monitoring and Mitigation of Volcano Hazards, Spring-er, Berlin, 1996, pp. 23^97.
[9] E.A. Okal, J. Talandier, T waves from the great 1994Bolivian deep earthquake in relation to channeling ofS wave energy up the slab, J. Geophys. Res. 102 (1997)27421^27437.
[10] E.A. Okal, P.-J. Alasset, O. Hyvernaud, F. Schindele¤, Thede¢cient T waves of tsunami earthquakes, Geophys. J.Int., in press.
[11] D. Reymond, O. Hyvernaud, J. Talandier, E.A. Okal,T-wave detection of two underwater explosions o¡ Hawaiion April 13, 2000, Bull. Seismol. Soc. Am., submitted.
[12] S. Levitus, T.P. Boyer, J. Antonov, R. Burgett, M.E.Conkright, World Ocean Atlas 1994, NOAA/NESDIS,Silver Springs, MD, 1994.
[13] M.E. Wysession, E.A. Okal, K.L. Miller, Intraplate seis-micity of the Paci¢c Basin, 1913^1988, Pure Appl. Geo-phys. 135 (1991) 261^359.
[14] E. Thiel, N.A. Ostenso, Seismic studies on Antarctic iceshelves, Geophysics 26 (1961) 706^715.
[15] B.C. Beaudoin, U.S. ten Brink, T.A. Stern, Characteristicsand processing of seismic data collected on thick, £oatingice: Results from the Ross Ice Shelf, Antarctica, Geo-physics 57 (1992) 1359^1372.
[16] F. Press, M. Ewing, Two slow surface waves across NorthAmerica, Bull. Seismol. Soc. Am. 42 (1952) 219^228.
[17] L. Knopo¡, Interpretation of Lg, Geophys. J. Roy. As-tron. Soc. 33 (1973) 387^402.
[18] M. Bouchon, The complete synthesis of seismic crustalphases at regional distances, J. Geophys. Res. 87 (1982)1735^1741.
[19] M. Campillo, M. Bouchon, B. Massinon, Theoreticalstudy of the excitation, spectral characteristics, and geo-metrical attenuation of regional seismic phases, Bull. Seis-mol. Soc. Am. 74 (1984) 79^90.
[20] M. Cara, J.B. Minster, Multi-mode analysis of Rayleigh-type Lg , Bull. Seismol. Soc. Am. 71 (1981) 973^984.
[21] L. Knopo¡, R.G. Mitchel, E.G. Kausel, F. Schwab, Asearch for the oceanic Lg phase, Geophys. J. Roy. Astron.Soc. 56 (1979) 211^218.
[22] O.W. Nuttli, Seismic wave attenuation and magnituderelation for Eastern North America, J. Geophys. Res.78 (1973) 876^885.
[23] J. Talandier, E.A. Okal, Crises sismiques au volcan Mac-donald (Oce¤an Paci¢que Sud), C.R. Acad. Sci. Paris Se¤r.II 295 (1982) 195^200.
[24] Antarctic Meteorological Research Center, http://amrc.ssec.wisc.edu, Univ. Wisconsin, Madison, WI, 2002.
[25] National Ocean and Atmospheric Administration, http://www.noaanews.noaa.gov/stories/s862.htm, U.S. Dept. ofCommerce, 2002.
[26] W.H.F. Smith, D.T. Sandwell, Bathymetric predictionfrom dense satellite altimetry and sparse shipboard ba-thymetry, J. Geophys. Res. 99 (1994) 21803^21824.
[27] I.McK. Harris, P.G. Jollymore, Iceberg furrow marks onthe continental shelf Northeast of Belle Isle, Newfound-land, Can. J. Earth Sci. 11 (1974) 443^452.
[28] P.W. Barnes, R. Lien, Icebergs rework shelf sediments to500 m o¡ Antarctica, Geology 16 (1988) 1130^1133.
[29] K.G. Neave, J.C. Savage, Icequakes on the Athabascaglacier, J. Geophys. Res. 75 (1970) 1351^1362.
[30] C. Sinadinovski, K. Muirhead, S. Spiliopoulos, D. Jespen,E¡ective discrimination of icequakes on seismic recordsfrom Mawson station, Phys. Earth Planet. Inter. 113(1999) 203^211.
[31] A. Qamar, Calving: A source of low-frequency seismicsignals from Columbia Glacier, Alaska, J. Geophys.Res. 93 (1988) 6615^6623.
[32] D. VanWormer, E. Berg, Seismic evidence for glacier mo-tion, J. Glaciol. 12 (1973) 259^265.
[33] K. Aki, M. Fehler, S. Das, Source mechanism of volcanictremor; £uid-driven crack models and their application tothe 1963 Kilauea eruption, J. Volcanol. Geotherm. Res. 2(1977) 259^287.
[34] M.P. Langleben, Attenuation of sound in sea ice, 10^500kHz, J. Glaciol. 8 (1969) 399^406.
[35] H. Kohnen, Uº ber die Absorption elastischer longitu-dinaler Wellen im Eis, Polarforschung 39 (1970) 269^275.
[36] M. Ewing, A.P. Crary, Propagation of elastic waves inice, II, Physics 5 (1934) 181^184.
[37] F. Press, M. Ewing, Propagation of elastic waves in a£oating ice sheet, Trans. AGU 32 (1951) 673^678.
[38] P. Wessel, W.H.F. Smith, Free software helps map anddisplay data, EOS Trans. AGU 72 (1991) 441 and 445^446.
EPSL 6386 25-9-02 Cyaan Magenta Geel Zwart
J. Talandier et al. / Earth and Planetary Science Letters 203 (2002) 519^534534