Long Eaton Tender Submission
86
TENDER SUBMISSION FOR LONDON OFFICE BUILDINGS GROUP Report submitted as a part of K13IDM on 13/5/2015 4183047 | 4187823 | 4186893
description
As a part of our 3rd year Services design module, we were invited to apply for tender for designing the services of a theoretical office block, including systems for Ventilation, Vertical Transport and Fire prevention. The tender application consisted of a written report supported by a short verbal presentation to a panel of judges and a poster summarising the tender details. We secured the highest mark of all 'companies', winning the tender from the 'client'.This is a copy of our winning report
Transcript of Long Eaton Tender Submission

TENDER SUBMISSION FOR LONDON OFFICE BUILDINGS GROUP
Report submitted as a part of K13IDM on 13/5/2015
4183047 | 4187823 | 4186893

i Tender Submission | K13IDM

EXECUTIVE SUMMARY ii
Long Eaton Services Consultants have been tasked by London Office
Buildings with designing the services for a new office block. The
proposed building stands 10 storeys tall, with 9 floors of open plan
offices. Heating, cooling and ventilation systems were to be specified,
whilst considering potential enhancements to the building’s performance.
The building’s vertical transport systems and fire protection were to be
assessed to ensure the building complies with Approved Document B and
British Standards 5655-6.
It was decided that a VAV Air Conditioning System would best suit the
needs of the building. Peak heating and cooling requirements were
determined as 482kW and 432kW respectively, with an annual energy
consumption of 1.16 GWh and carbon footprint of 305 tonnes p.a.
Inspection of the building’s fire exits found breaches of regulation;
appropriate solutions have been devised incorporating additional means
of escape. The vertical transport system more than adequately serves
the building, obtaining an ‘excellent’ service standard.
Installing triple glazing and additional insulation reduced energy
consumption and carbon emissions by 21%. Though environmentally
sound, they are not financially viable, as it would take 50 years to break
even.
Smaller savings of 1-2% could be attained by providing total solar shading
and additional thermal mass. Due to their minimal capital costs, they
provide immediate financial gains.
To achieve the greatest savings in energy consumption and carbon
emissions, all proposed changes should be implemented simultaneously.
Not only will LOB see net financial benefits, but will also help minimise
their impact on the environment.
(249)
EXECUTIVE SUMMARY

iii Tender Submission | K13IDM

NOMENCLATURE iv
Symbol Definition Unit
Q Heat Gains W
Also : Flow Rate (distinguished in text) 𝑚3/𝑠
λ Thermal Conductance W/K
A Area m2
U U-value W/m2K
φ Lag h
θ Hour of incidence h
f Decrement Factor [dimensionless]
Also Correction factor (distinguished in text) [dimensionless]
G G-Value [dimensionless]
T Temperature K or ℃
H Mean solar cooling load at incident hour W/m2
Also Height m
η Solar exposure ratio %
W Width m
xs Shadow x-component m
ys Shadow y-component m
R Overhang m
n Wall-solar azimuth angle °
a Altitude °
ρ Air density kg/m3
c Air specific heat capacity W/kgK
V Volume flow rate m3/s
𝐍 Air Change Rate h−1
𝐕 Volume m3
f3 Intermittence factor [dimensionless]
HDD Number of heat degree days [dimensionless]
m Mass flow rate kg/s
g Moisture content Kg/kg
M Mixing point %
RH Relative humidity %
h Specific enthalpy kJ/kg
β Contact factor of cooling coil [dimensionless]
p Pressure Pa
µ Fan efficiency %
t Time h
u Velocity m/s
C Hueretic constant [dimensionless]
x Throw m
L Total lift flight m
v Speed m/s
n Lift capacity [dimensionless]
N Number of lift cars [dimensionless]
RTT Round trip time s
ζ Component loss factor [dimensionless]
NOMENCLATURE

v Tender Submission | K13IDM
1 INTRODUCTION 2
2 BUILDING INFORMATION 4
2.1 Zoning 5 2.2 Occupancy 7 2.3 Building Fabric 8
3 EXTREME CONDITIONS: HEATING SEASON 10
3.1 Casual Heat Gains 10 3.2 Solar Heat Gains 10 3.3 Fabric Losses 11 3.4 Ventilation Losses 12 3.5 Local Enviornmental Conditions 13
4 EXTREME CONDITIONS: COOLING SEASON 16
4.1 Fabric Losses 17 4.2 Solar Gains 18 4.3 Ventilation Heat Transfer 20
5 BOILER PLANT 22
5.1 Sizing the Boiler 22 5.2 Annual Running Costs and Carbon Emissions 24
6 AIR CONDITIONING SYSTEM (ACS) 26
6.1 Sizing System 26 6.2 Air conditioning system specification 28 6.3 Annual Running Costs 31
7 VENTILATION 34
7.1 Design Criteria 34 7.2 duct configuration 34 7.3 Fans 37 7.4 supply diffuser choice 39
8 SENSITIVITY ANALYSIS 42
8.1 Potential Changes 42 8.2 Comparison of Changes 43 8.3 Reccommendations 44
9 FIRE PROTECTION 46
9.1 Horizontal Escape 46 9.2 Vertical Escape 48 9.3 Compartmentalisation of spaces 48 9.4 Protection of Ventilation Openings 49 9.5 Location of Fire-fighting servces 50
10 VERTICAL TRANSPORT 52
10.1 System Mechanics 53 10.2 Firefighting Lifts 55 10.3 Quality of service assessment 55
11 CONCLUSIONS 58
12 BACK MATTER I
12.1 References I 12.2 Appendix A I 12.3 Appendix B VI 12.4 Appendix C XII
CONTENTS

FIGURES vi
Figure 2-1: Proposed Building 4
Figure 2-2: Zoning arrangements 5
Figure 2-3: Exploded Building Iso 6
Figure 2-4: Occupancy Schedule 7
Figure 3-1: Fabric heat transfer 11
Figure 3-2: Graph to show ventilation and infiltration losses 13
Figure 4-1:Internal Gains Schedule 16
Figure 4-2: Effect of lag and decrement on heat transfer 17
Figure 4-3: Overhang providing solar shading on glazed surfaces (orange) 19
Figure 4-4: Range of Ventilation heat transfer for each Month 20
Figure 5-1: Graph showing pre-heat times prior to occupancy, [6] 22
Figure 5-2: Graph to show number of heating degree-days, CIBSE Guide A 24
Figure 6-1: Monthly peak sensible heat gains 26
Figure 6-2: Air Conditioning complete Psychometric Process 27
Figure 6-3: Fan Assisted VAV system schematic 29
Figure 7-1: Duct Layout in Plan 35
Figure 7-2: Supply Duct layout in Section 35
Figure 7-3: Supply Index Run 36
Figure 8-1: Comparison of changes 44
Figure 9-1: Typical office floor, not meeting maximum travel distances 47
Figure 9-2: Typical office floor, meeting maximum travel distances 47
Figure 9-3: Entrance floor, not meeting maximum travel distances 47
Figure 9-4: Entrance floor, not meeting maximum travel distances 47
Figure 9-5: Compartment floor configuration, meeting approved
document Bs guidelines. 49
Figure 9-6: Pipe sleeving, taken from Approved Document B, [12] 49
Figure 9-7: ground floor sprinkler system 50
Figure 9-8: Office floor sprinkler system 50
Figure 10-1: Exploded View of Building Showing Lifts 52
Figure 10-2: Plan of Lift Showing Dimensions around Car as given in CIBSE
Guide D 0 53
Figure 10-3: Comparison of Side Opening and Two-Speed Centre Opening
Doors 53
Figure 10-4: Single Wrap Pulley System 54
FIGURES

vii Tender Submission | K13IDM
Table 2-1: Building Geometry 4
Table 2-2: Zone Dimensions Ground Floor 6
Table 2-3: Zone Dimensions Typical Floor 6
Table 2-4: Zone Occupancy 7
Table 2-5: Fabric Properties 8
Table 2-6: Wall and Glazing Areas 8
Table 3-1: Casual Internal Heat Gains 10
Table 3-2: Fabric Properties 11
Table 3-3: Equation 1 parameters 11
Table 3-4: Ventilation Requirements 12
Table 4-1: Internal Gains 16
Table 4-2: Equation 4-1 parameters 17
Table 4-3: Material properties 17
Table 4-4: Equation 4-2 parameters 18
Table 4-5: Glazing parameters 18
Table 4-6: Peak solar cooling loads 18
Table 4-7: Equation 4-3 and 4-4 parameters 19
Table 4-8: Effect of Shading on Peak Solar Cooling loads 20
Table 4-9: Equation 4-5 parameters 20
Table 5-1: Equation 5-1 Parameters 22
Table 5-2: Building Specifications calculated in section 3.5 22
Table 5-3: Fuel Prices, taken from Table 12 SAP 2012, [4] 24
Table 6-1: Peak Cooling Loads 26
Table 6-2: Psychometric properties of air 27
Table 6-3: Factors to consider when specifying an ACS 28
Table 6-4: VAV system components 29
Table 6-5: Advantages and Disadvantages of a VAV system 30
Table 6-6: Three approaches to estimate ACS cooling load 31
Table 7-1: Ventilation Requirements 34
Table 7-2: Total extract for each sanitary zone 36
Table 7-3: Pressure Drop over Index Run 37
Table 7-4: Equation Parameters 38
Table 7-5: Fan and energy characteristics 38
Table 7-6: Supply Diffuser Sizing 39
Table 8-1: U-value comparison of Part L requirement and ACEB Gold
Standard 42
Table 8-2: Comparing performance of double glazing vs triple glazing 42
Table 8-3: Effect of increasing thermal mass 43
Table 8-4: Comparison of changes 43
Table 8-5: Recommendations 44
Table 9-1 Maximum travel distances, taken from Approved Document B,
[12] 46
TABLES

TABLES viii
Table 9-2: Number of routes required, taken from Approved Document B,
[12] 46
Table 9-3: Minimum exit widths, Approved document B, [12] 48
Table 9-4: Compartment regulations, Approved document B, [12] 48
Table 9-5: Maximum sprinkler distances, BSEN pg 77 , [13], [14] 50
Table 10-1: Lift Shaft Dimensions 52
Table 10-2: Breakdown of Car Capacity 53
Table 10-3: System specification 55
Table 10-4: Lift Calculations for Quality of Service 55
Table 12-1: Weather data used for Heating Season Calculations, taken
from CIBSE Guide J, Table 5.36 I
Table 12-2: Fabric gains/Losses (Wall, Roof, Glazing) II
Table 12-3: Total fabric gains/losses. (Wall, roof, glazing, Floor) III
Table 12-4: Plant Sizing IV
Table 12-5: Heating Degree Days, taken from CIBSE Guide A, Table 2.23 IV
Table 12-6: Annual Energy Consumption and Carbon Emissions, using
data from SAAP Building Regulations 2010, Table 12. V
Table 12-7: South Wall heat transfer (W) Example of Quasi-Dynamic Heat
transfer calculation VI
Table 12-8: Total Fabric heat transfer (W) VII
Table 12-9: Ventilation Heat transfer (W) VIII
Table 12-10: West Glazing unshaded solar gain (W) Example of solar
cooling load IX
Table 12-11: West glazing shaded solar gain (W) Example of solar cooling
load IX
Table 12-12: Total Solar Gains accounting for shading (W) X
Table 12-13: Total Sensible Heat transfer (W) XI
Table 12-14: Total pressure drop along pipes and method XII
Table 12-15: Total Pressure loss calculations XIII

1 Tender Submission | K13IDM

INTRODUCTION 2
Long Eaton Services Consultants would like to thank London Office
Buildings for the invitation to apply for tender for designing the services
of their newly proposed office block.
A requirement of the tender document was that consultants should
design the heating, cooling and ventilation systems for the 10-storey
building.
It was also requested that the plans should be examined to identify any
potential issues that exist. Areas of particular concern were the fire-safety
and vertical transportation systems that could potentially be in breach of
UK Building Regulations.
The primary aims of this report are:
To evaluate the thermal performance of the building to
determine peak heating and cooling loads.
To appropriately size the building’s boiler and air conditioning
systems capable of meeting these demands.
To quantify a series of potential improvements to evaluate their
economical and environmental feasibility.
To ensure that the building conforms to Approved Document B of
the UK Building Regulations with regards to fire protection.
To ensure that the proposed vertical transport systems are
capable of meeting the building’s requirements.
(178)
1 INTRODUCTION

3 Tender Submission | K13IDM

BUILDING INFORMATION 4
The building under investigation is a 10- storey office block that is
situated in London at the junction between City Road and King George
Street. Of the 10 storeys, floors one to nine are open plan offices, whilst
the ground floor serves as an entrance foyer. There is also a basement in
the building, and a services block on the roof. Since they both lie are
outside of the thermal envelope, neither and are considered in this
report.
Figure 2-1: Proposed Building
Table 2-1: Building Geometry
Parameter Value Unit
Height 37.8 m
Ground Floor to Ceiling 4.2 m
Typical Floor to Ceiling 3.6 m
Depth 19.7 m
Width 50.0 m
Volume 36674 m3
Envelope Area 6450 m2
Wall Area 5331 m2
Roof Area 985 m2
Ground Area 852 m2
Exposed Floor 133 m2
Surface Area: Volume 0.18 m-1
Usable Floor Space 9717 m2
Floors 10 (dimensionless)
Ground Floors 1 (dimensionless)
Typical Floors 9 (dimensionless)
2 BUILDING INFORMATION
5 Tender Submission | K13IDM
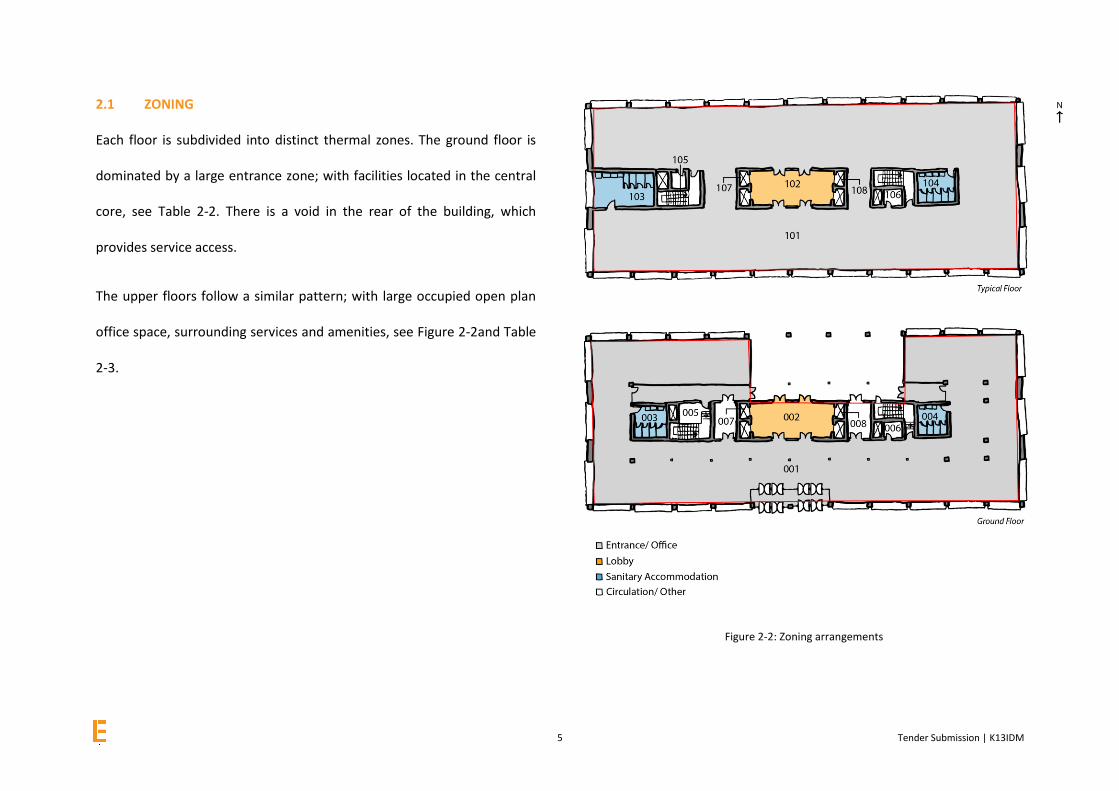
2.1 ZONING
Each floor is subdivided into distinct thermal zones. The ground floor is
dominated by a large entrance zone; with facilities located in the central
core, see Table 2-2. There is a void in the rear of the building, which
provides service access.
The upper floors follow a similar pattern; with large occupied open plan
office space, surrounding services and amenities, see Figure 2-2and Table
2-3.
Figure 2-2: Zoning arrangements

BUILDING INFORMATION 6
Table 2-2: Zone Dimensions Ground Floor
Code Zone Width (m) Depth (m) Area (m2) Volume (m
3)
001 Entrance 50.0 19.7 689.8* 2897.2
002 Lobby 9.0 4.5 40.5 170.1
003 Male WC 3.0 4.5 13.5 56.7
004 Female WC 3.0 4.5 13.5 56.7
005 Circulation [W] 8.6 4.5 38.7 162.5
006 Circulation [E] 8.6 4.5 38.7 162.5
007 Lifts [W] 1.9 4.5 8.6 35.9
008 Lifts [E] 1.9 4.5 8.6 35.9
Total 851.8 3577.6
*Area defined as total floor area not accounted for in other zones inc. services void.
Table 2-3: Zone Dimensions Typical Floor
Code Zone Width (m) Depth (m) Area (m2) Volume (m
3)
101 Office 50.0 19.7 793.8* 2857.5
102 Lobby 9.0 4.5 40.5 145.8
103 Male WC 7.5 4.5 33.8 121.5
104 Female WC 5.0 4.5 22.5 81.0
105 Circulation [W] 8.6 4.5 38.7 139.3
106 Circulation [E] 8.6 4.5 38.7 139.3
107 Lifts [W] 1.9 4.5 8.6 30.8
108 Lifts [E] 1.9 4.5 8.6 30.8
Total 985.0 3546.0
*Area defined as total floor area not accounted for in other zones
Figure 2-3: Exploded Building Iso

7 Tender Submission | K13IDM
2.2 OCCUPANCY
The occupancy for each zone in shown in Table 2 4. The total occupancy
for the building is 722 people, only 11 of whom are most in the office.
The occupancy profile is modelled on a typical 09:00 to 17:00 working
day, see Figure 2-4. To simulate gradual arrival and departure of
occupants it increases/decreases incrementally over the course of three
hours. Occupancy also drops to have capacity during lunch hours.
Figure 2-4: Occupancy Schedule
Table 2-4: Zone Occupancy
Code Zone Area (m2) Occupancy Density
(m2/person)
Occupancy (people)
001 Entrance 689.8 0* 0
002 Lobby 40.5 4† 11
003 Male WC 13.5 0 0
004 Female WC 13.5 0 0
005 Circulation [W] 38.7 0 0
006 Circulation [E] 38.7 0 0
007 Lifts [W] 8.6 0 0
008 Lifts [E] 8.6 0 0
101 Office 793.8 10 79
102 Lobby 40.5 0 0
103 Male WC 33.8 0 0
104 Female WC 22.5 0 0
105 Circulation [W] 38.7 0 0
106 Circulation [E] 38.7 0 0
107 Lifts [W] 8.6 0 0
108 Lifts [E] 8.6 0 0
*Occupancy specified as 0 as occupancy in entrance specified under lobby
†Occupancy Density specified using CIBSE guide A Table 6.2 for a Hotel Lobby [1]
0
0.25
0.5
0.75
1
1 2 3 4 5 6 7 8 9 101112131415161718192021222324Pro
po
rtio
n o
f p
eak
Occ
up
ancy
Hour number (hours)

BUILDING INFORMATION 8
2.3 BUILDING FABRIC
The building is assumed to be thermally lightweight. The dimensions and
U-values for each element of the building fabric are shown in Table 2-5.
The U-values comply to the limiting standards given in building
regulations document L2 [2]. The wall and glazing areas for each façade
are shown in Table 2-6
Table 2-5: Fabric Properties
Surface Construction Limiting U-Value (W/m
2K)
Surface Area
(m2)
Roof Waterproof roof covering, 35mm polyurethane insulation, vapour control layer, 19mm timber decking, unventilated airspace, 12.5 mm plasterboard
0.25 985
Wall 105mm brick, 50mm airspace, 19mm plywood sheathing, 95mm studding, 12.5mm plasterboard.
0.35 2432
Floor 10 m carpet, 19mm timber on100 mm joists, 100mm mineral fibre insulation between joists, 12mm cementitious building board on underside.
0.25 985
Glazing Double Glazing in aluminium frames 2.2 2762
Vehicle Access Doors
Metal roller doors 1.5 138
Table 2-6: Wall and Glazing Areas
Wall Glazing Ratios Wall total area (m2) Wall area (m2) Glazing Area (m2)
Wall N 61% 1814 713 1101
Wall E 34% 745 488 256
Wall S 61% 1890 743 1147
Wall W 34% 745 488 256
INFILTRATION
The infiltration rate is set at the standard value of 0.4𝑎𝑐ℎ−1 throughout
the building [1]. The resulting air permeability is 2.17𝑚3/ℎ/𝑚2*. This
outperforms best practice guidelines, predominantly due to the large
surface are to volume ratio of the building. In reality, the air leakage
would likely be higher, closer to 5𝑚3/ℎ/𝑚2.
(347)

9 Tender Submission | K13IDM

EXTREME CONDITIONS: HEATING SEASON 10
The building’s thermal performance is analysed to determine its heating
load and size its boiler. Heat is lost via convection due to ventilation and
conduction from the buildings fabric.
3.1 CASUAL HEAT GAINS
People, lighting and equipment generate internal heat gains, calculated
using CIBSE Guide A [1] for each zone totalling 24.6 kW, see Table 3-1.
Though not accounted for in plant sizing, casual heat gains effectively
reduce the heating requirement of the building and boiler.
3.2 SOLAR HEAT GAINS
Solar gains are not considered when assessing the building’s heating load.
This is because the peak-heating load is calculated for the worst-case
scenario, no solar exposure. Building form and orientation could be
considered to optimise the influence of solar gains.
Table 3-1: Casual Internal Heat Gains
Zone Floor Area (m
2)
QOcc, sensible (W)
QLighting, sensible (W)
QEquip, sensible (W)
Total Sensible Gains (W)
Entrance 689.8 - 10347 10347 10347 Lobby 40.5 825 405 405 405 Sanitary Accom. ♂
13.5 - - - -
Sanitary Accom. ♀
13.5 - - - -
Circulation [W]
38.7 - - - -
Circulation [E]
38.7 - - - -
Lifts [W] 8.55 - - - - Lifts [E] 8.55 - - - - Office 793.75 5530 7937 7937 7937 Lobby 40.5 - 405 405 405 Sanitary Accom. ♂
33.75 - - - -
Sanitary Accom. ♀
22.5 - - - -
Circulation [W]
38.7 - - - -
Circulation [E]
38.7 - - - -
Lifts [W] 8.55 - - - - Lifts [E] 8.55 - - - -
Total 50595 85834 109181 245611
3 EXTREME CONDITIONS: HEATING SEASON
11 Tender Submission | K13IDM
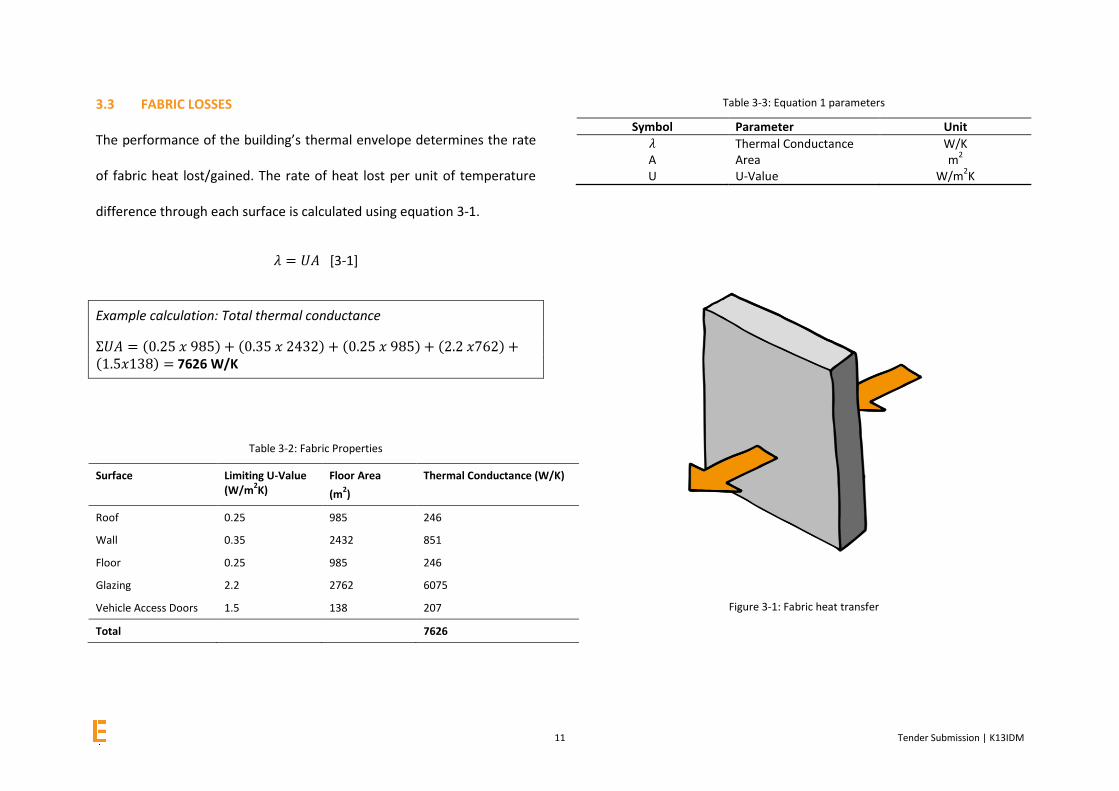
3.3 FABRIC LOSSES
The performance of the building’s thermal envelope determines the rate
of fabric heat lost/gained. The rate of heat lost per unit of temperature
difference through each surface is calculated using equation 3-1.
𝜆 = 𝑈𝐴 [3-1]
Example calculation: Total thermal conductance
Σ𝑈𝐴 = (0.25 𝑥 985) + (0.35 𝑥 2432) + (0.25 𝑥 985) + (2.2 𝑥762) +(1.5𝑥138) = 7626 W/K
Table 3-2: Fabric Properties
Surface Limiting U-Value (W/m
2K)
Floor Area
(m2)
Thermal Conductance (W/K)
Roof 0.25 985 246
Wall 0.35 2432 851
Floor 0.25 985 246
Glazing 2.2 2762 6075
Vehicle Access Doors 1.5 138 207
Total 7626
Table 3-3: Equation 1 parameters
Symbol Parameter Unit
𝜆 Thermal Conductance W/K A Area m
2
U U-Value W/m2K
Figure 3-1: Fabric heat transfer

EXTREME CONDITIONS: HEATING SEASON 12
3.4 VENTILATION LOSSES
Ventilation requirements for each zone were approximated using table
1.5, CIBSE Guide A [1], seen in Table 3-4. Ventilation provides fresh air to
the occupants, removing pollutants. Infiltration, via adventitious
openings, has also been considered.
Table 3-4: Ventilation Requirements
Example Calculation: Ventilation requirements for the Office
Ventilation: 79 people x 10 L/s = 790 L/s = 0.79 m3/s
Infiltration: 0.4 a𝑐ℎ−1 x 2857.5 m3 = 1143 m3/h = 0.3175 m3/s
Zone Floor Area
(𝒎𝟐)
Volume (𝒎𝟑) Occupancy (people)
Ventilation Rate
Required per person
(L/s)
Total ventilation rate per person per
zone (L/s)
Total ventilation
rate per zone (L/s)
Total ventilation
rate per
zone (𝒎𝟑/s)
Infiltration
(a𝒄𝒉−𝟏)
Infiltration
rate (𝒎𝟑/h)
Infiltration rate
(𝒎𝟑/s)
Entrance 689.8 2897.16 0 0 0 0.4 1158.864 0.321906667
Lobby 40.5 170.1 11 10 110 110 0.11 0.4 68.04 0.0189
Male WC 13.5 56.7 0 0 0 0.4 22.68 0.0063
Female WC 13.5 56.7 0 0 0 0.4 22.68 0.0063
Circulation [W] 38.7 162.54 0 0 0 0.4 65.016 0.01806
Circulation [E] 38.7 162.54 0 0 0 0.4 65.016 0.01806
Lifts [W] 8.55 35.91 0 0 0 0.4 14.364 0.00399
Lifts [E] 8.55 35.91 0 0 0 0.4 14.364 0.00399
Office 793.75 2857.5 79 10 790 790 0.79 0.4 1143 0.3175
Lobby 40.5 145.8 0 0 0 0.4 58.32 0.0162
Male WC 33.75 121.5 0 0 0 0.4 48.6 0.0135
Female WC 22.5 81 0 0 0 0.4 32.4 0.009
Circulation [W] 38.7 139.32 0 0 0 0.4 55.728 0.01548
Circulation [E] 38.7 139.32 0 0 0 0.4 55.728 0.01548
Lifts [W] 8.55 30.78 0 0 0 0.4 12.312 0.00342
Lifts [E] 8.55 30.78 0 0 0 0.4 12.312 0.00342
Total 35491 7220 7.22 3.94

13 Tender Submission | K13IDM
Ventilation requirements state that 7.22 𝑚3/s of air is needed for the
building. With infiltration set at 0.4 a𝑐ℎ−1 per zone, it results in a net loss
of 3.9𝑚3/s of air. Figure 3-2 shows infiltration making up 35% of the
ventilation losses.
Figure 3-2: Graph to show ventilation and infiltration losses
Example Calculation: Total Air Change Rate for whole building
7.22 𝑚3/s + 3.9𝑚3/s = 11.2 𝑚3/s x 3600 = 40188.6 𝑚3/h
40188.6 𝑚3/h / 35491 40188.6 𝑚3 = 1.13 𝒂𝒄𝒉−𝟏
3.5 LOCAL ENVIORNMENTAL CONDITIONS
The annual external temperatures in London for each hour of the day,
each month of the year are used to calculate the buildings peak-heating
load. Appendix B details the weather data. The internal design
temperatures for winter and summer, were 22˚ and 23˚ respectively,
taken from CIBSE Guide A, table 1.5.
(272)
65%
35%
Ventilation
Infiltration

EXTREME CONDITIONS: HEATING SEASON 14

15 Tender Submission | K13IDM

EXTREME CONDITIONS: COOLING SEASON 16
The internal gains are estimated using heat gain densities specific to a
zone’s function (Table 6.3, CIBSE Guide A [1]) and are compiled in Table
4-1. The gains operate proportionally to the occupancy schedule.
Table 4-1: Internal Gains
Figure 4-1:Internal Gains Schedule
0
100
200
300
1 2 3 4 5 6 7 8 9 10 11 12 13 14 15 16 17 18 19 20 21 22 23 24
Cas
ual
He
at G
ain
s (k
W)
Hour
SensibleLatent
4 EXTREME CONDITIONS: COOLING SEASON
Zone Floor Area (m
2)
Occupancy (persons)
Sensible heat gains per
person (W)
Latent heat gains per
person (W)
Lighting gain, Area Weighted
(W/m2)
Equipment gains, Area Weighted
(W/m2)
QOcc, sensible
(W)
QOcc, latent
(W)
QLighting, sensible
(W)
QEquip, sensible
(W)
Total Sensible
Gains (W)
Total Latent
Gains (W)
Entrance 689.8 0 - - 15 - - - 10347 0 10347 0
Lobby 40.5 11 75 55 10 5 825 605 405 202 1432 605
Sanitary Accom. ♂ 13.5 0 - - - - - - - 0 0 0
Sanitary Accom. ♀ 13.5 0 - - - - - - - 0 0 0
Circulation [W] 38.7 0 - - - - - - - 0 0 0
Circulation [E] 38.7 0 - - - - - - - 0 0 0
Lifts [W] 8.55 0 - - - - - - - 0 0 0
Lifts [E] 8.55 0 - - - - - - - 0 0 0
Office 793.75 79 70 45 10 15 5530 3555 7937 11906 25374 3555
Lobby 40.5 0 - - 10 5 - - 405 202 608 0
Sanitary Accom. ♂ 33.75 0 - - - - - - - 0 0 0
Sanitary Accom. ♀ 22.5 0 - - - - - - - 0 0 0
Circulation [W] 38.7 0 - - - - - - - 0 0 0
Circulation [E] 38.7 0 - - - - - - - 0 0 0
Lifts [W] 8.55 0 - - - - - - - 0 0 0
Lifts [E] 8.55 0 - - - - - - - 0 0 0
Total 50595 50595 85834 109181 245611 32600

17 Tender Submission | K13IDM
4.1 FABRIC LOSSES
Fabric losses are calculated using quasi-dynamic calculations (equation 4-
1) that take into account both a time lag and decrement in the transfer of
heat through the building’s fabric, (Figure 4-2). These values are
approximated using construction of comparable performance in table
3.49 CIBSE guide A.
𝑄𝜃+𝜑 = 𝐴𝑈(𝑇𝑒𝑚 − 𝑇𝑟𝑜𝑜𝑚) + 𝐴𝑈(𝑇𝑒0 − 𝑇𝑒𝑚)𝑓 [4-1]
Figure 4-2: Effect of lag and decrement on heat transfer
Example Calculation – Transfer through West Wall on June 21st at 17:00 For a west facing light coloured wall 𝑇𝑒0 = 19.2 & 𝑇𝑒𝑚 = 22.5 , 𝑇𝑟𝑜𝑜𝑚
𝑠𝑢𝑚𝑚𝑒𝑟 = 23 [2].
𝑄17:00 = 488 × 0.35(22.5 − 23) + 488 × 0.35(19.2 − 22.5) × 0.21
𝑄17:00 = −204𝑊
Table 4-2: Equation 4-1 parameters
Symbol Parameter Unit
𝑄𝜃+𝜑 Heat transfer at time 𝑡 = 𝜃 + 𝜑 𝑊
𝐴 Area 𝑚2
𝑈 U-value 𝑊/𝑚2𝐾
𝜑 Lag ℎ
𝜃 Hour of incidence ℎ
𝑓 Decrement Factor [𝑑𝑖𝑚𝑒𝑛𝑠𝑖𝑜𝑛𝑙𝑒𝑠𝑠]
𝑇𝑒𝑚 Mean sol-air temperature ℃
𝑇𝑒0 Room air temperature ℃
𝑇𝑒𝑚 Sol-air temperature at time 𝑡 = 𝜃 ℃
Table 4-3: Material properties
Surface U-Value (W/m2K) Area (m
2) f φ Colour
Wall North 0.35 713 0.21 9 Light
Wall East 0.35 488 0.21 9 Light
Wall South 0.35 743 0.21 9 Light
Wall West 0.35 488 0.21 9 Light
Glazing North 2.20 1101 - 0 -
Glazing East 2.20 256 - 0 -
Glazing South 2.2 1147 - 0 -
Glazing West 2.2 256 - 0 -
Roof 0.25 985 0.15 10 Dark
Exposed Floor 0.25 133 0.15 9 Light
Access Doors (delivery void) 1.5 138 1.00 1 Light
Calculations for hourly heat transfers for all surfaces can be found in Appendix B.

EXTREME CONDITIONS: COOLING SEASON 18
4.2 SOLAR GAINS
Solar gains though an un-shaded glazed surface are calculated using
Equation 4-2, where each parameter is defined by the building’s location
(London), response factor (fast), and the window’s glazing type and
orientation (Table 4-5).
𝑄𝑠𝑜𝑙𝑎𝑟 = 𝐴 × 𝐻 × 𝐺 × 𝑓 [4-2]
Example calculation – East façade glazing at 14:30 on September 4th
For an East facing surface in SE England at 14:30 on Sep 4th, 𝐻 is 132W/
m2 [3].
𝑄𝑠𝑜𝑙𝑎𝑟, 𝐸𝑎𝑠𝑡14:30,𝑆𝑒𝑝 4𝑡ℎ
= 256m2 × 132𝑊/𝑚2 × 0.41 × 0.50
𝑄𝑠𝑜𝑙𝑎𝑟, 𝐸𝑎𝑠𝑡14:30,𝑆𝑒𝑝 4𝑡ℎ
= 6927W
The shortcoming using this approach is that no solar cooling loads are
provided outside of 07:30 to 17:30. This is not too significant as they
would fall outside of the office’s operational times. They would also be
far smaller than solar gains inside the working day, making it highly
improbable that they would affect the peak cooling load of the building.
Table 4-4: Equation 4-2 parameters
Symbol Parameter Unit
𝑄𝑠𝑜𝑙𝑎𝑟 Solar heat gain 𝑊
𝐴 Area 𝑚2
𝐺 G-Value [𝑑𝑖𝑚𝑒𝑛𝑠𝑖𝑜𝑛𝑙𝑒𝑠𝑠]
𝑓 Correction factor [𝑑𝑖𝑚𝑒𝑛𝑠𝑖𝑜𝑛𝑙𝑒𝑠𝑠]
𝐻 Mean solar cooling load at incident hour 𝑊/𝑚2
Table 4-5: Glazing parameters
Window Azimuth (°) Area (m2) Glazing type G f
Glazing North 0 1101 Clear/reflective 0.41[3] 0.50 [3]
Glazing East 90 256 Clear/reflective 0.41 0.50
Glazing South 180 1147 Clear/reflective 0.41 0.50
Glazing West 270 256 Clear/reflective 0.41 0.50
Table 4-6: Peak solar cooling loads
Glazing Peak solar cooling load (W) Date Time
Whole Building 154495 April 28th 12:30
of which North 34772 June 21st 12:30 and 13:30
of which East 30432 June 21st 08:30
of which South 133124 November 4th 12:30
of which West 30379 June 21st 17:30
Ground Floor 35313 April 28th 12:30
Typical Floor 13242 April 28th 12:30
Calculations for full hourly solar gains for all glazed surfaces can be found in Appendix B.

19 Tender Submission | K13IDM
SOLAR SHADING
Recesses cause solar shading on the building’s windows, the extent of
which is calculated using equation 4-3. The portion of glazing in shade
receives no direct sunlight and is recalculated as a north facing window.
Where:
η =(𝑊𝑤 − 𝑥𝑠) × (𝐻𝑤 − 𝑦𝑠)
𝑊𝑤 × 𝐻𝑤
𝑥𝑠 = 𝑅 × tan 𝑛 and 𝑦𝑠 = 𝑅 × sec 𝑛 × tan 𝑎
[4-3]
The adjusted solar gain through a window is:
𝑄𝑠ℎ𝑎𝑑𝑒𝑑 = 𝜂 × 𝑄𝑢𝑛𝑠ℎ𝑎𝑑𝑒𝑑 + (1 − 𝜂) × 𝑄𝑁𝑜𝑟𝑡ℎ [4-4]
Figure 4-3: Overhang providing solar shading on glazed surfaces (orange)
Example – Window on South façade glazing at 14:30 on September 4th
𝑄𝑢𝑛𝑠ℎ𝑎𝑑𝑒𝑑 = 103253𝑊, 𝑄𝑁𝑜𝑟𝑡ℎ = 18515𝑊, 𝑎 = 37°, 𝑛 = 49°, 𝑊𝑊 =3.85𝑚, 𝐻𝑤 = 1.50𝑚 and 𝑅 = 0.5𝑚.
𝑥𝑠 = 0.5𝑚 × tan 49° = 0.58𝑚, 𝑦𝑠 = 0.5𝑚 × sec 49° × tan 37° = 0.57𝑚
η =(3.85 − 0.58) × (1.5 − 0.57)
3.85 × 1.50= 53%
Therefore the cooling load accommodating for shading is:
𝑄𝑠ℎ𝑎𝑑𝑒𝑑 = 53% × 103253𝑊 + 47% × 18515𝑊 = 63426𝑊
Table 4-7: Equation 4-3 and 4-4 parameters
Symbol Parameter Unit
𝐴 Area 𝑚2
𝜂 Solar exposure ratio %
𝑊𝑤 Window width 𝑚
𝐻𝑤 Window Height 𝑚
𝑥𝑠 Shadow x-component 𝑚
𝑦𝑠 Shadow y-component 𝑚
𝑅 Overhang 𝑚
𝑛 Wall-solar azimuth angle °
𝑎 Altitude °
𝑄𝑠ℎ𝑎𝑑𝑒𝑑 Solar gain of window accounting for shading 𝑊
𝑄𝑢𝑛𝑠ℎ𝑎𝑑𝑒𝑑 Solar gain of window without shading 𝑊
𝑄𝑁𝑜𝑟𝑡ℎ Solar gain of identical window facing North 𝑊
EXTREME CONDITIONS: COOLING SEASON 20
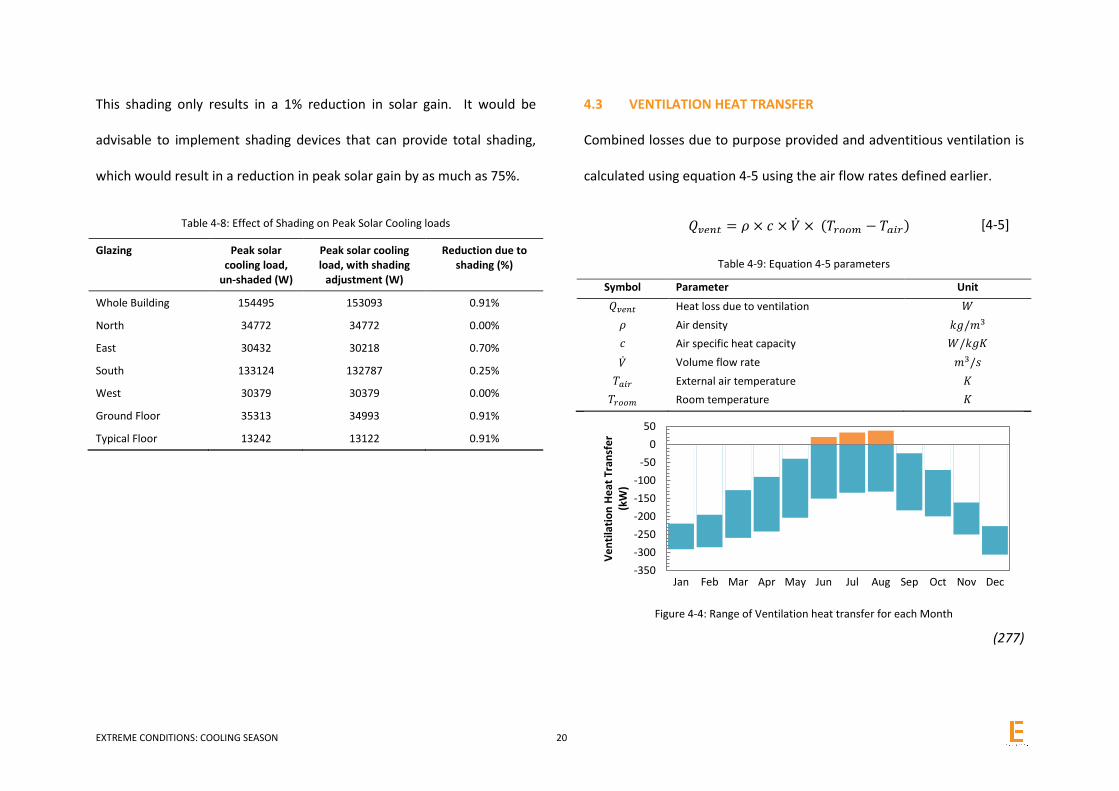
This shading only results in a 1% reduction in solar gain. It would be
advisable to implement shading devices that can provide total shading,
which would result in a reduction in peak solar gain by as much as 75%.
Table 4-8: Effect of Shading on Peak Solar Cooling loads
Glazing Peak solar cooling load,
un-shaded (W)
Peak solar cooling load, with shading
adjustment (W)
Reduction due to shading (%)
Whole Building 154495 153093 0.91%
North 34772 34772 0.00%
East 30432 30218 0.70%
South 133124 132787 0.25%
West 30379 30379 0.00%
Ground Floor 35313 34993 0.91%
Typical Floor 13242 13122 0.91%
4.3 VENTILATION HEAT TRANSFER
Combined losses due to purpose provided and adventitious ventilation is
calculated using equation 4-5 using the air flow rates defined earlier.
𝑄𝑣𝑒𝑛𝑡 = 𝜌 × 𝑐 × �� × (𝑇𝑟𝑜𝑜𝑚 − 𝑇𝑎𝑖𝑟) [4-5]
Table 4-9: Equation 4-5 parameters
Symbol Parameter Unit
𝑄𝑣𝑒𝑛𝑡 Heat loss due to ventilation 𝑊
𝜌 Air density 𝑘𝑔/𝑚3
𝑐 Air specific heat capacity 𝑊/𝑘𝑔𝐾
�� Volume flow rate 𝑚3/𝑠
𝑇𝑎𝑖𝑟 External air temperature 𝐾
𝑇𝑟𝑜𝑜𝑚 Room temperature 𝐾
Figure 4-4: Range of Ventilation heat transfer for each Month
(277)
-350
-300
-250
-200
-150
-100
-50
0
50
Jan Feb Mar Apr May Jun Jul Aug Sep Oct Nov Dec
Ve
nti
lati
on
He
at T
ran
sfe
r (k
W)

21 Tender Submission | K13IDM

BOILER PLANT 22
5.1 SIZING THE BOILER
The building’s boiler can be sized using the steady state equation
(equation 5-1). Heating systems are designed to heat the building when
unoccupied with no casual/solar gains, see Figure 5-1
Figure 5-1: Graph showing pre-heat times prior to occupancy, [6]
Qd = [Σ 𝑈𝐴 + 0.33𝑁𝑉](𝑇𝑖 − 𝑇𝑑𝑜) [5-1]
Table 5-1: Equation 5-1 Parameters
Symbol Parameter Unit
𝐔 U-Value 𝑤/𝑚2K
𝑨 Area 𝑚2
𝑵 Air Change Rate ℎ−1
𝑽 Building Volume 𝑚3
𝑻𝐼 Design Inside Temperature ˚C
𝑻𝒅𝒐 Design Outside Temperature ˚C
Using the internal design temperatures and weather data from CIBSE
Guide J, the annual energy demand is calculated using equation 5-1 and
Table 5-2.
Table 5-2: Building Specifications calculated in section 3.5
𝚺𝑼𝑨
(W/K)
N
(𝒂𝒄𝒉−𝟏)
V
(𝒎𝟑)
7626 1.13 36674
5 BOILER PLANT

23 Tender Submission | K13IDM
The peak-heating load occurs in December between 06:00 and 07:00.
Example Calculation: Peak heating load
Qd = 7626 + 0.33 𝑥 1.13 𝑥 36674𝑉](22−— 0.4)
= -482075 W of heat energy lost
Peak Heating load = 482075 W = 482 kW
Heating systems are designed to meet the maximum heating load likely to
occur. However, additional capacity is needed to overcome thermal
inertia so that the building may reach an operational temperature
quickly.
The required boiler capacity is calculated by applying an intermittence
factor,𝑓3,that takes into account the thermal response of the building and
the hours of plant operation (equation 5-3).
𝑃𝑒𝑎𝑘 ℎ𝑒𝑎𝑡𝑖𝑛𝑔 𝑙𝑜𝑎𝑑 = 𝑓3 𝑥 𝑠𝑝𝑎𝑐𝑒 ℎ𝑒𝑎𝑡 𝑙𝑜𝑎𝑑 [5-3]
Table 1.11 in CIBSE Guide B, [3], recommends plant size ratios according
to heating periods. The boiler must operate for 16 hours, to serve the 14
hours of occupancy and two additional hours of pre-heating, requiring an
𝑓3 value of 1.2 .
Example Calculation: Actual Peak Heating load
1.2 x 482075 = 578490 W
= 578 kW

BOILER PLANT 24
5.2 ANNUAL RUNNING COSTS AND CARBON EMISSIONS
The annual energy consumption of the heating system is calculated to
estimate its running costs and carbon emissions. This is done by
estimating the number of heating degree-days for which the external
temperature is below a base temperature, 15.5˚C taken from CIBSE guide
A[1]. Figure 5-2 shows the HDD for London for an average year.
Figure 5-2: Graph to show number of heating degree-days, CIBSE Guide A
Equation 5-4 shows the amount of heat lost in one year.
𝑄𝑦 = 24(Σ 𝑈𝐴 + 0.33𝑁𝑉)HDD [5-4]
Example Calculation: Heat lost in one year
𝑄𝑦 = 24(7626 + 0.33 𝑥 1.13 𝑥 36674𝑉)1936
= 988504 kWh of energy lost
Table 5-3 states the costs and carbon emissions per kWh.
Table 5-3: Fuel Prices, taken from Table 12 SAP 2012, [4]
Fuel Unit price (p/kWh) Emissions (kg CO2 per kWh)
Mains Gas 3.48 0.216
Example Calculation: Annual Cost
= 988 504 x 3.48=£34,399 p.a
Example Calculation: Annual carbon emissions
= 988 504 x 0.216 = 213 516 kg of carbon
= 214 tonnes CO2
(245)
0
50
100
150
200
250
300
350
Nu
mb
er
of
He
atin
g D
egr
ee
Day
s
Months of the Year

25 Tender Submission | K13IDM

AIR CONDITIONING SYSTEM (ACS) 26
6.1 SIZING SYSTEM
The ACS must be capable of offsetting both the peak sensible and latent
heat gains in the building, coinciding at 14:00- 15:00 on August 4th.
Table 6-1: Peak Cooling Loads
Type Load Date Time
Sensible 443.0kW August 4th 14:00 – 15:00
Latent 32.6kW Every day 9:00 – 13:00 and 14:00 – 17:00
Figure 6-1: Monthly peak sensible heat gains
AIR PROPERTIES
The sensible cooling load is used in conjunction with equation 6-1 to
determine the mass flow rate of supply air.
𝑄𝑠𝑒𝑛𝑠𝑖𝑏𝑙𝑒 = �� × 𝑐 × Δ𝑇𝑅−𝑆 [6-1]
To calculate the mass flow rate the temperature difference between the
supply and room (Δ𝑇𝑅−𝑆 ) must be specified, in this case as 9°𝐶 ,
recommended by Roy Jones of Gilberts [5].
Higher values of 𝛥𝑇𝑅−𝑆 may be used, reducing the required air supply rate. This may be
necessary if the diffusers specified are incapable of meeting design requirements at higher
air supply velocities.
�� = 𝑄𝑠𝑒𝑛𝑠𝑖𝑏𝑙𝑒/(𝑐 × Δ𝑇𝑅−𝑆 )
�� = 443.0𝑘𝑊/(1.02𝑘𝐽/𝑘𝑔𝐾 × 9°𝐶) = 48.3𝑘𝑔/𝑠
To find the properties of air at the supply point of the system, both
𝑇𝑑𝑟𝑦 𝑏𝑢𝑙𝑏 and 𝑅𝐻 must be fixed. 𝑇𝑑𝑟𝑦 𝑏𝑢𝑙𝑏 is calculated as 𝑇𝑅,𝑑𝑏 − ∆𝑇𝑅−𝑆
(23 − 9 = 14°𝐶) whilst RH is pre-set at a typical value of 95% [6].
443.0 kW
32.6kW 0
100
200
300
400
500
Jan Feb Mar Apr May Jun Jul Aug Sep Oct Nov Dec
Pe
ak H
eat
Gai
n (
kW)
Sensible
Latent
6 AIR CONDITIONING SYSTEM (ACS)

27 Tender Submission | K13IDM
The room air’s properties can be found by using 𝑇𝑅 combined with the
room moisture content (𝑔𝑟), calculated with the building’s latent gains:
𝑄𝑙𝑎𝑡𝑒𝑛𝑡 = 𝑚 × 𝐿 × Δ𝑔𝑅−𝑆 ∴ Δ𝑔𝑅−𝑆 = 𝑄𝑙𝑎𝑡𝑒𝑛𝑡/��𝐿
Δ𝑔𝑅−𝑆 = 32.6𝑘𝑊/(48.3𝑘𝑔/𝑠 × 2450𝑘𝐽/𝑘𝑔) = 0.00027𝑘𝑔/𝑘𝑔
Allowing for calculation of 𝑔𝑅 = 𝑔𝑆 + Δ𝑔𝑅−𝑆
𝑔𝑅 = 0.00946 + 0.00027 = 0.009743𝑘𝑔/𝑘𝑔
CONDITIONING PROCESS
The ACS in the building uses recirculation to reduce energy consumption.
To find the mixing point:
𝑀 = 100% − ��𝑓𝑟𝑒𝑠ℎ 𝑎𝑖𝑟/��𝑐𝑜𝑜𝑙𝑖𝑛𝑔
= 100% −7.22𝑚3/𝑠
39.8𝑚3/𝑠 = 81.9%
Where the volume flow rate of cooling air (��𝑐𝑜𝑜𝑙𝑖𝑛𝑔) is calculated from the
mass flow rate (��) derived above, using the specific volume of air (𝑣 ) at
the supply. ��𝑐𝑜𝑜𝑙𝑖𝑛𝑔 = �� × 𝑣 = 47.1𝑘𝑔/𝑠 × 0.825𝑚3/𝑘𝑔 = 7.22𝑚3/𝑠
Figure 6-2: Air Conditioning complete Psychometric Process
Table 6-2: Psychometric properties of air
Parameter Symbol Unit Air at Point:
Outside Supply Room Mixing
Dry Bulb Temperature 𝑇𝑑𝑟𝑦 𝑏𝑢𝑙𝑏 °𝐶 25.8* 14.0 23.0† 23.5
Wet bulb Temperature 𝑇𝑤𝑒𝑡 𝑏𝑢𝑙𝑏 °𝐶 16.7* 13.8 17.3 17.50
Relative Humidity 𝑅𝐻 % 39.3%* 95.0% 55.0% 55.5%
Specific Enthalpy ℎ 𝑘𝐽/𝑘𝑔 46.6* 38.0 47.6 49.0
Moisture Content 𝑔 𝑘𝑔/𝑘𝑔 0.00813* 0.00946 0.009743 0.00944
* Obtained from CIBSE Guide J design day data, August 4th
14:00-15:00

AIR CONDITIONING SYSTEM (ACS) 28
APPARATUS DEW POINT
The Apparatus Dew Point (ADP) of the cooling coil is marked on Figure 6-2
at 13.3°C. The contact factor of the cooling coil can also be
determined 𝛽 =𝑀→𝑆
𝑀→𝐴𝐷𝑃 = 0.92.
PLANT SIZING
To ensure the ACS can cool the building if the cooling load were ever to
exceed the peak design load, a Plant Size Ratio (𝑃𝑆𝑅) is employed, at a
typical value of 1.2.
𝑄𝑐𝑜𝑜𝑙𝑖𝑛𝑔 = �� × (ℎ𝑀 − ℎ𝑆)
= 48.3𝑘𝑔/𝑠 × (49.0𝑘𝐽/𝑘𝑔 − 38.0𝑘𝐽/𝑘𝑔) = 530.8𝑘𝑊
𝑄𝑃𝑙𝑎𝑛𝑡 = 𝑄𝐶𝑜𝑜𝑙𝑖𝑛𝑔 × 𝑃𝑆𝑅
= 530.8𝑘𝑊 × 1.2 = 637.0𝑘𝑊
6.2 AIR CONDITIONING SYSTEM SPECIFICATION
Natural ventilation is the preferred method of cooling a building for
environmental and financial reasons. However, natural ventilation
cannot disperse as much heat as mechanical systems. CIBSE recommend
any buildings with sensible gains of over 40𝑊/𝑚2 to employ mechanical
ACS’s. The building’s sensible gains are 44.4𝑊/𝑚2, implying it requires a
mechanical cooling system.
Table 6-3: Factors to consider when specifying an ACS
Factor Reason
Comfort The ability of the ACS to meet the variable requirements of the occupants is paramount to ensure that the workforce function effectively.
Financial If LOB intends to retain and operate the building it would be advisable to install a more efficient ACS, as the reduced maintenance and energy costs will make the greater capital investment worthwhile.
Control Since the cooling demand of the building varies greatly throughout the day, the ACS must be able to operate under a variable schedule. This prevents the ACS being active when it is not necessary, minimising energy use and environmental impact.
Noise Production
Noise production should adhere to an acceptable volume defined by occupants
Environmental CO2 production and energy consumption should be minimised by selecting an efficient ACS.
29 Tender Submission | K13IDM
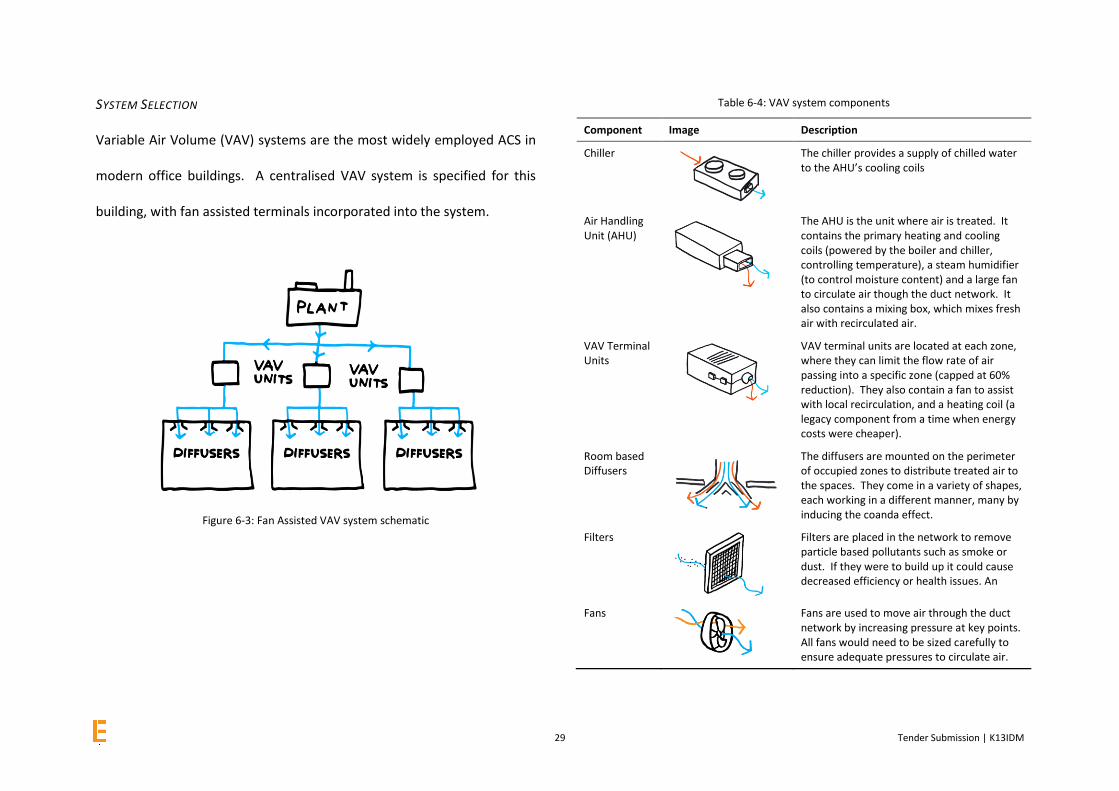
SYSTEM SELECTION
Variable Air Volume (VAV) systems are the most widely employed ACS in
modern office buildings. A centralised VAV system is specified for this
building, with fan assisted terminals incorporated into the system.
Figure 6-3: Fan Assisted VAV system schematic
Table 6-4: VAV system components
Component Image Description
Chiller
The chiller provides a supply of chilled water to the AHU’s cooling coils
Air Handling Unit (AHU)
The AHU is the unit where air is treated. It contains the primary heating and cooling coils (powered by the boiler and chiller, controlling temperature), a steam humidifier (to control moisture content) and a large fan to circulate air though the duct network. It also contains a mixing box, which mixes fresh air with recirculated air.
VAV Terminal Units
VAV terminal units are located at each zone, where they can limit the flow rate of air passing into a specific zone (capped at 60% reduction). They also contain a fan to assist with local recirculation, and a heating coil (a legacy component from a time when energy costs were cheaper).
Room based Diffusers
The diffusers are mounted on the perimeter of occupied zones to distribute treated air to the spaces. They come in a variety of shapes, each working in a different manner, many by inducing the coanda effect.
Filters
Filters are placed in the network to remove particle based pollutants such as smoke or dust. If they were to build up it could cause decreased efficiency or health issues. An
Fans
Fans are used to move air through the duct network by increasing pressure at key points. All fans would need to be sized carefully to ensure adequate pressures to circulate air.

AIR CONDITIONING SYSTEM (ACS) 30
Table 6-5: Advantages and Disadvantages of a VAV system
Advantages Disadvantages
Good temperature control is achieved by thermoregulatory devices in VAV terminal units
Uneven heating or cooling requirements can be met by varying air flow rates at each zone’s VAV terminal unit. Perimeter zones will generally have a greater cooling load than core zones. (e.g. 𝑄𝑜𝑓𝑓𝑖𝑐𝑒 > 𝑄𝑐𝑖𝑟𝑐𝑢𝑙𝑎𝑡𝑖𝑜𝑛)
Very flexible system is able to accommodate any future changes in AC requirement
Fan assisted VAV units allow for zone by zone control of air flow rates, with up to 60% throttling of the system volume flow rate minimising energy wasting.
Recirculation can be employed easily within the terminal units, improving the efficiency of the ACS.
Fan assistance ensures proper mixing, preventing air dumping.
Fresh air is supplied in the system, so no additional ventilation system is required.
The complex system contains numerous components, and requires substantial maintenance.
A large plant room must be available to house the large boilers, chiller and AHU. Sufficient void space must also be available within the ceilings of the building to accommodate the large ducts that circulate treated air.
Requires careful planning and design of system as well as quality commissioning to ensure it functions correctly
Excess noise could occur if the fan assisted VAV terminal units are not acoustically insulated from occupied spaces.
Implementation of fan-assisted terminal units will increase capital and maintenance costs.
CONTROL
The ACS should be controlled via a schedule that is refined with feedback
from post-occupancy evaluation. Intuitive devices with partial local
control should also be employed, operated by occupants for real time
comfort adjustments. This should be through either real or perceived
control (e.g. thermostats and fan controls; or false switches).

31 Tender Submission | K13IDM
6.3 ANNUAL RUNNING COSTS
Table 6-6: Three approaches to estimate ACS cooling load
Estimation 1 Estimation 2 Estimation 3
𝑆𝑦𝑠𝑡𝑒𝑚 𝑃𝑟𝑖𝑐𝑒 = 𝐶𝑜𝑠𝑡 𝑝𝑒𝑟 𝑚2 × 𝑓𝑙𝑜𝑜𝑟 𝑎𝑟𝑒𝑎
𝐶𝑂2 𝑒𝑚𝑖𝑠𝑠𝑖𝑜𝑛𝑠𝑒 = 𝐸𝑚𝑖𝑠𝑠𝑖𝑜𝑛 𝑝𝑒𝑟 𝑚2 × 𝑓𝑙𝑜𝑜𝑟 𝑎𝑟𝑒𝑎
Using general operational costs from CIBSE Guide F Table 7.5
Centralised VAV system assumption:
Building occupied floor area: 9717𝑚2
CO2 emission: 40𝑘𝑔/𝑚2𝑝. 𝑎
Running Cost: £2.40/𝑚2𝑝. 𝑎
𝐸𝑛𝑒𝑟𝑔𝑦 𝑑𝑒𝑚𝑎𝑛𝑑 = 𝐸𝑛𝑒𝑟𝑔𝑦 𝑢𝑠𝑒 𝑝𝑒𝑟 𝑚2 × 𝑓𝑙𝑜𝑜𝑟 𝑎𝑟𝑒𝑎
Using general energy demand costs from CIBSE Guide B Table 2.2
Type 3 (standard air-conditioned office) cooling load:
Building occupied floor area: 9717𝑚2
Energy Consumption: 31𝑘𝑊ℎ/𝑚2𝑝. 𝑎
𝑇𝑀,𝑚𝑎𝑥 =𝑉𝑜𝑇𝑜 + 𝑉𝑟𝑇𝑟
𝑉𝑡=
7.22 × 25.8 + 32.6 × 23
39.8= 23.5°𝐶
Δ𝑇𝑀−𝑆,𝑚𝑎𝑥 = 𝑇𝑀,𝑚𝑎𝑥 − 𝑇𝑠 = 23.5 − 14.0 = 9.5°𝐶
𝑄𝑐𝑜𝑜𝑙,𝑎𝑣𝑒 = 𝑉𝑇 × 𝜌 × 𝑐 × (Δ𝑇𝑎𝑣𝑒 × 70.7%)
= 39.8 × 1.21 × 1020 × (9.5°𝐶 × 70.7%) = 330.9𝑘𝑊
𝑡𝑐𝑜𝑜𝑙 = 11.49% × 8760ℎ𝑟/𝑦𝑟 = 1007ℎ𝑟𝑠
Using method to calculate the annual energy consumption based on peak cooling demand, as described by Chadderton.
Find the peak temperature of mixed (𝑇𝑀,𝑚𝑎𝑥) air prior to
cooling (based on volume flow rates of outdoor air (𝑉𝑜), recirculated air (𝑉𝑟) and total air (𝑉𝑡) and the design outdoor temp (𝑇𝑂) and recirculation Temperature (𝑇𝑟).
Finding the average cooling required (Δ𝑇𝑎𝑣𝑒) required.
Assuming sinusoidal fluctuation in outdoor air temperature finds the mean mixed air temperature 𝑇𝑀,𝑎𝑣𝑒 by multiplying
𝑇𝑚𝑎𝑥by 70.7%. The average cooling power (𝑄𝑐𝑜𝑜𝑙,𝑎𝑣𝑒) of
the ACS can then be determined with the total volume flow rate of air, air density (𝜌) and specific heat capacity of air (𝑐).
Hours of operation (𝑡𝑐𝑜𝑜𝑙) are determined as any time when 𝑇𝑟𝑜𝑜𝑚 < 𝑇𝑒𝑥𝑡𝑒𝑟𝑛𝑎𝑙. The number is determined based on the proportion of hours during summer (CIBSE Guide A Table 2.13) that exceeds 𝑇𝑟𝑜𝑜𝑚, multiplied by hours in a year.
The annual energy can then be calculated as 𝑃𝑜𝑤𝑒𝑟 ×𝑇𝑖𝑚𝑒 × 𝐶𝑂𝑃. (Chadderton recommends 2.50 in cases where value is not specified)
Data provided is for 1992 cost so by applying inflation, according to the bank of England, the corrected running cost
is £4.43/𝑚2𝑝. 𝑎
† Energy load is converted to monetary value/ CO2 emission load using standard conversion factors as provided by the
energy savings trust, 1kWh = £0.1319 and 0.519kgCO2, dated 2015
Energy
Price
CO2
n/a
£43,045 p.a
388.7 tonnes p.a
301,227 kWh p.a
£42,322 p.a †
147.6 tonnes p.a †
133,215 kWh p.a
£17,571 p.a †
69.1 tonnes p.a †

AIR CONDITIONING SYSTEM (ACS) 32
The three approaches predict significantly different cost and CO2
emissions. However the costs are of a comparable magnitude, implying
an annual cost of £20-40,000 for cooling.
The CO2 emissions are far less coherent, with the older approach (1)
predicting carbon emissions over 500% higher than the modern approach
(3). This is potentially due to the increase in renewable electricity
production since 1992, reducing the amount of CO2 produced per kWh.
It would be expected that Estimation 3 would be most accurate, as it is
derived from the actual building’s performance, as opposed to generic
area-weighted assumptions. The only way to evaluate expenses
accurately would be by examining the building once it is in service.
(477)

33 Tender Submission | K13IDM

VENTILATION 34
7.1 DESIGN CRITERIA
To ensure that the ventilation system will adhere to Approved Document
F [9] it must:
Supply adequate fresh air
Supply the total air required for heating and cooling to occupied
zones
Ensure mixing of air
Not produce excessive noise
Provide extraction in sanitary accommodations
Table 7-1: Ventilation Requirements
Parameter Offices Lobby
Required Fresh Airflow Rate per Floor (m3/s) 0.79 0.11
Mixing Ratio [dimensionless] 0.82 0.82
Total Airflow Rate Per Floor (m3/s) 3.57 0.50
Number of Diffusers Per Floor [dimensionless] 8 2
Airflow per Diffuser (m3/s) 0.45 0.25
Throw length (m) 7 4.5
Sound Level dbA * 30 24
*from gilberts curved blade grills documentation [8]. Must not exceed 30 dbA in office
buildings. Can be reduced using more adjustable blades
7.2 DUCT CONFIGURATION
The primary vertical ductwork can be housed in the existing services
shafts. By dividing the system into two symmetrical networks pressure
losses are reduced.
The ducts to the supply diffusers will run within the ceiling void, see
Figure 7-1 and 7-2
7 VENTILATION

35 Tender Submission | K13IDM
Figure 7-1: Duct Layout in Plan
Figure 7-2: Supply Duct layout in Section
SANITARY AND NON-SANITARY ACCOMMODATION
The ventilation in the sanitary accommodations uses local extraction. The
zone is depressurised to avoid any mixing with air in non-sanitary zones
Approved document F [9] specifies the requirement for this is an
intermittent air extract of 6 L/s per WC or Urinal. The total extract for
each zone is shown Table 7-2.The supply air is drawn from other
ventilated zones.

VENTILATION 36
Table 7-2: Total extract for each sanitary zone
Sanitary Accommodation Configuration Total Extract for Zone (L/s)
Ground Floor Male 1 WC 2 Urinals 18
Ground Floor Female 3 WCs 18
Typical Floor Male 4 WCs 3 Urinals 42
Typical Floor Female 5 WCs 30
SUPPLY INDEX RUN
The supply index run shown in Figure 7-3 runs from the plant room to the
furthest supply terminal on the first floor (not the ground floor as
terminals are only located in the central core, close to the main riser).
Figure 7-3: Supply Index Run

37 Tender Submission | K13IDM
SUPPLY INDEX RUN PRESSURE DROP
The total pressure loss over the index run is a combination of the
pressure loss along the pipes due to friction and the pressure loss over
components.
The pressure loss along pipes is given by:
Δp = λ −1
2ρ𝑐2 [7-1]
Where λ is the friction factor found using chart 4.2 in CIBSE Guide C, ρ is
the density of air (1.2 kg/m3) and c is the specific heat capacity of air (1.0
kJ/kg.K). [10]
∆𝑝 = ζ 1
2ρ𝑐2 [7-2]
Where ζ is the component loss factor obtained from tables in CIBSE Guide
C Chapter 4.
The results of these calculations are found in Table 7-3 and detailed in
depth in Appendix C.
Table 7-3: Pressure Drop over Index Run
Parameter Value Unit
Pressure loss along Pipes (Friction)*
40.21 Pa
Pressure loss over components*
103.58 Pa
Total pressure drop over index run
143.79 Pa
Found using method CIBSE Guide B [3] and values from CIBSE Guide C [10] for breakdown
please see appendix C
7.3 FANS
The energy consumption of the system fans is calculated using the
method given in CIBSE Guide B chapter 3 [3]:
𝐴𝑖𝑟 𝑃𝑜𝑤𝑒𝑟 = 𝑄𝑇∆𝑝 [7-3]
𝐴𝑖𝑟 𝑃𝑜𝑤𝑒𝑟 = 16.3 × 143.79 = 2343𝑊
The electrical power required based on the fan’s efficiency (90% [6])
𝐸𝑙𝑒𝑐𝑡𝑟𝑖𝑐 𝑃𝑜𝑤𝑒𝑟 =𝐴𝑖𝑟 𝑃𝑜𝑤𝑒𝑟
𝜇 [7-4]

VENTILATION 38
Each fan’s energy consumption is given by:
𝐸𝑛𝑒𝑟𝑔𝑦 𝐶𝑜𝑛𝑠𝑢𝑚𝑝𝑡𝑖𝑜𝑛 = 𝑡𝑜𝑝𝐸𝑙𝑒𝑐𝑡𝑟𝑖𝑐 𝑃𝑜𝑤𝑒𝑟 [7-5]
Table 7-4: Equation Parameters
Term Definition
top operational time
(17 hours a day during warm up period and occupation, week days)
QT total flow rate (16.30 m/s)
Δp total pressure loss over the index circuit
System Calculations
Electric Power = 2343/0.9
= 2604W
Top= 17hours*240days
= 4080hrs
Therefore
Energy consumption = 4080*2.604
= 42491 kWhrs
There are four fans in the building; two supply and two extract. The total
energy consumption and a summary of data in this section are given in
Table 7-5
Table 7-5: Fan and energy characteristics
Parameter Value Unit
Total Pressure Drop 143.79 Pa
Air power 2,343 W
Fan Efficiency 90% [percentage]
Electric Power 2,604 W
Operational Time 4080 hr
Energy Consumption Fan 10,623 kWhr
Number of Fans 4 [dimensionless]
Total Electric Power 10,414.56 W
Total Energy Consumption 42,491 kWhr

39 Tender Submission | K13IDM
7.4 SUPPLY DIFFUSER CHOICE
The supply diffusers are situated in the ceiling due to the duct placement
and to take advantage of the coanda effect They are sized using equation
7-6.
𝑈𝑚𝑎𝑥 =𝐶𝑄
𝑥𝐴𝑒0.5 and𝐴𝑒 = 0.6𝐴𝑜 [7-6]
Table 7-6: Supply Diffuser Sizing
Term Definition Offices Lobby
Umax Umax (m/s) 0.25 0.25
C Hueretic Constant 5.5 5.5
x Throw (m) 7 4.5
Q Flow Rate (m3/s) 0.45 0.25
Ae Effective Area Opening (m2) 1.96 1.47
Ao Area Diffuser (m2) 3.27 2.46
Example calculation (office diffuser)
Ae = ((5.5*0.45)/(7*0.25))2 = 1.96m2
Ao = 1.96/0.6 = 3.27m2

VENTILATION 40

41 Tender Submission | K13IDM
SENSITIVITY ANALYSIS 42
Reductions in the building’s energy consumption and carbon emissions
can be achieved by making a series of changes to the building’s geometry
and thermal envelope.
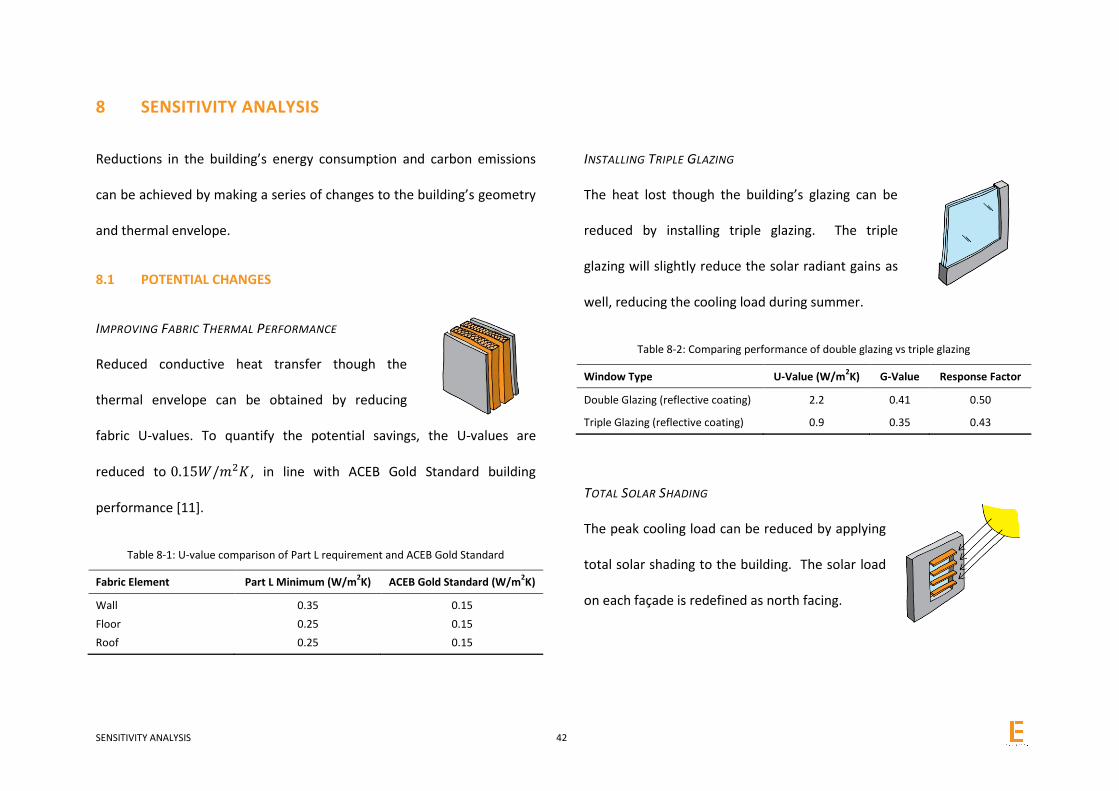
8.1 POTENTIAL CHANGES
IMPROVING FABRIC THERMAL PERFORMANCE
Reduced conductive heat transfer though the
thermal envelope can be obtained by reducing
fabric U-values. To quantify the potential savings, the U-values are
reduced to 0.15𝑊/𝑚2𝐾 , in line with ACEB Gold Standard building
performance [11].
Table 8-1: U-value comparison of Part L requirement and ACEB Gold Standard
Fabric Element Part L Minimum (W/m2K) ACEB Gold Standard (W/m
2K)
Wall
Floor
Roof
0.35
0.25
0.25
0.15
0.15
0.15
INSTALLING TRIPLE GLAZING
The heat lost though the building’s glazing can be
reduced by installing triple glazing. The triple
glazing will slightly reduce the solar radiant gains as
well, reducing the cooling load during summer.
Table 8-2: Comparing performance of double glazing vs triple glazing
Window Type U-Value (W/m2K) G-Value Response Factor
Double Glazing (reflective coating) 2.2 0.41 0.50
Triple Glazing (reflective coating) 0.9 0.35 0.43
TOTAL SOLAR SHADING
The peak cooling load can be reduced by applying
total solar shading to the building. The solar load
on each façade is redefined as north facing.
8 SENSITIVITY ANALYSIS

43 Tender Submission | K13IDM
INCREASING THERMAL MASS
The effect of environmental changes can be offset
by increasing the thermal mass of the building;
changing it to a slow response building.
Table 8-3: Effect of increasing thermal mass
Building Element Lag, φ (hrs) Decrement Factor, f Response Factor
Fast Slow Fast Slow Fast Slow
Wall 5 9 0.58 0.21 - -
Roof 2 10 0.93 0.15 - -
Floor 2 9 0.91 0.15 - -
Vehicle Access Doors
1 1 1 1 - -
Glazing - - - - 0.50 0.43
8.2 COMPARISON OF CHANGES
Table 8-4: Comparison of changes
Alteration Affects Heating Load?
Affects Cooling Load?
Affects Ventilation
Load
Energy Demand
(kWh)
Saving (%)
CO2 Emissions (Tonnes)
Saving (%)
Original n/a n/a n/a 1164210 - 305 -
Triple Glazing
✓ ✓ ✓ 960134 18.0% 249 18.0%
Fabric U-values
✓ ✓ ✓ 1130812 3.0% 297 3.0%
Total Solar Shading
✓ ✓ 1137502 2.0% 291 5.0%
Increase Thermal Mass
✓ ✓ 1150135 1.0% 301 1.0%
Net effect 925,295 21.0% 241 21.0%
Note: Each of the changes only alters the sensible loads, not the latent loads, resulting in a
different room ratio. This slightly alters the psychometric process for the air conditioning
cycle. However, the changes in enthalpies are so small that the margin of error incurred
becomes negligible (<1%) when considering the inaccuracies in the original calculations.
The heating load is far greater than the cooling load. Changes that affect
only the cooling load of the building will therefore have a lesser impact
on the total energy demand, but comparatively high financial savings due
to the relative expense of electricity compared to gas.

SENSITIVITY ANALYSIS 44
8.3 RECCOMMENDATIONS
Table 8-5: Recommendations
Alteration Energy Saving (%)
CO2 Saving (%)
Feasibility
Triple Glazing 18.00% 18.00% By installing triple glazing, upwards of £8000 p.a could be saved. The expense of the upgrade is around £500,000 making the payback around 50 years [4]. Financially, it may not be in LOB’s best interests if they want a quick return on their investment. It would however be environmentally beneficial as significant amounts of energy and CO2 can be saved.
Fabric U-values 3.00% 3.00% A saving of around £1500 p.a. could be attained by adding insulation to the walls roof and floors. The payback time of such an upgrade would be in the region of 50 years [11]. Other elements of the building’s fabric could also be improved, seeing comparable benefits.
Total Solar Shading
2.00% 5.00% Up to £2000 p.a. could be saved by adding solar shading. Shading should definitely be implemented, either by adding louvres or increasing window recesses, as there are minimal capital costs for such modifications (an effective shading device should overhang the windows by 2.8m).
Increase Thermal Mass
1.00% 1.00% The response time of the building should be increased to save energy and money at no additional capital cost. Free night cooling could also be employed to further increase energy savings.
From an environmental standpoint all the above changes should be
made. However, it is only cost effective to employ most of the changes if
LOB plan to operate the building for 50 years to see payback on their
additional investment.
Figure 8-1: Comparison of changes
(226)

45 Tender Submission | K13IDM

FIRE PROTECTION 46
The building is assessed for fire protection, to ensure that it conforms to
Approved Document B of the UK Building Regulations. It must be
protected from the effects of heat, using fire resistant construction, and
protect occupants from smoke, using compartmentalisation.
9.1 HORIZONTAL ESCAPE
Escape routes and travel distances are assed. Maximum travel distances
from any point on a floor to that storey’s exit can be seen in Table 9-1.
Table 9-1 Maximum travel distances, taken from Approved Document B, [12]
Room Primary Direction (m) Secondary Direction (m)
Office (Floors 1-10) 18 45 Entrance (Ground floor) 18 45
For each upper floor there are two means of horizontal escape, and three
for the ground floor. Table 9-2 shows that the current conditions meet
required standards.
Table 9-2: Number of routes required, taken from Approved Document B, [12]
Floor Number of People Required number of exit routes
Office 79 2 Entrance 11 1
Figures 9-1 to 9-4 show the available exits and 18m travel routes from the
office and entrance floors respectively. Not all areas of the floor are
within 18m of a fire exit; so additional doors will need to be fitted to
meet the minimum guidelines.
Inner rooms such as the sanitary accommodation, must also adhere to
the guidelines, and open directly onto the access floor.
9 FIRE PROTECTION

47 Tender Submission | K13IDM
Figure 9-1: Typical office floor, not meeting maximum travel distances
Figure 9-2: Typical office floor, meeting maximum travel distances
Figure 9-3: Entrance floor, not meeting maximum travel distances
Figure 9-4: Entrance floor, not meeting maximum travel distances

FIRE PROTECTION 48
9.2 VERTICAL ESCAPE
Stair carrying capacities and widths are assessed. Table 9-3 shows the
minimum escape widths required. A fire may prevent one of the exits
from being used so all exit widths must adhere to these guidelines.
Table 9-3: Minimum exit widths, Approved document B, [12]
Floor Number of People Exit Width (mm)
Office 79 850 Entrance 11 750
Since the office is open plan, all staircases must be capable of
simultaneous evacuation.
Example Calculation: Width of Stairs, using table 7 Approved Document B
79 people x 9 upper floors = 711 people
711 people = 1400mm width of stairs required
9.3 COMPARTMENTALISATION OF SPACES
To control the spread of fire the internal spaces are compartmentalised,
separated by fire resistant walls and floors. The number of compartments
depends on:
Building use
Building height
Availability of a sprinkler system
Table 9-4 shows that the building requires all storeys to be separated by
compartment floors, but compartment walls will not be necessary. Figure
9-5 shows the configuration.
Table 9-4: Compartment regulations, Approved document B, [12]
Maximum Total Height without compartment floors (m)
Maximum Floor Area without compartment
walls (𝒎𝟐)
Guidelines 30 2000 LOB 37.5 985

49 Tender Submission | K13IDM
Figure 9-5: Compartment floor configuration, meeting approved document Bs guidelines.
9.4 PROTECTION OF VENTILATION OPENINGS
In some cases ventilation openings breach the dividers that separate
adjacent fire compartments. They need to be protected so the fire barrier
remains intact. They can be protected by:
Fire dampers
Fire-resisting enclosures
Fire resisting ductwork
Fire dampers should be installed around the openings with sufficient
tolerance to allow access for maintenance and room for expansion in the
heat of a fire. Pipes below 160mm internal diameter, that penetrate
through the fire-separating compartments will require sleeving of non-
combustible pipe, see Figure 9-6.
Figure 9-6: Pipe sleeving, taken from Approved Document B, [12]

FIRE PROTECTION 50
9.5 LOCATION OF FIRE-FIGHTING SERVCES
Hydrants, hoses, risers and sprinklers must be suitably placed to assist fire
fighters in time of need. Fire mains with valves must be installed within
the building so that fire fighters can connect hoses for water rapidly. The
fire fighting shafts and necessary escape stairs must be equipped with fire
mains. The mains can be ‘dry’ type due to the building being less than
50m tall.
A sprinkler system must be installed throughout the building since it is
taller than 30m. These systems ensure occupant safety and reduce fire
damage. Table 9-5 sets out the standards for a sprinkler system, and
Figures 9-7 and 9-8 shows an appropriate configuration for the building.
Table 9-5: Maximum sprinkler distances, BSEN pg 77 , [13], [14]
Hazard Class
Space required below roof and ceiling sprinklers (m)
Maximum area per
sprinkler (𝒎𝟐)
Maximum distances between sprinklers (m)
Ordinary 0.5 12 4
Figure 9-7: ground floor sprinkler system
Figure 9-8: Office floor sprinkler system
The main sprinkler riser should be placed centrally with primary pipelines
running horizontally across each floor.
(484)

51 Tender Submission | K13IDM

VERTICAL TRANSPORT 52
The building is served by four lift shafts, two on either side of the lobby.
The dimensions of each shaft are shown in Table 10-1. The building’s lift
to floor ratio of 1:2.5 places it in the excellent quality of service category
according to British standards lifts and lift services section 6.4.5 [16].
Table 10-1: Lift Shaft Dimensions
Figure 10-1: Exploded View of Building Showing Lifts
10 VERTICAL TRANSPORT
Parameter Value Unit
Width 0.95 m
Depth 4.5 m
Height 37.8 m
Area 4.3 m2
Volume 161.6 m3
53 Tender Submission | K13IDM
10.1 SYSTEM MECHANICS
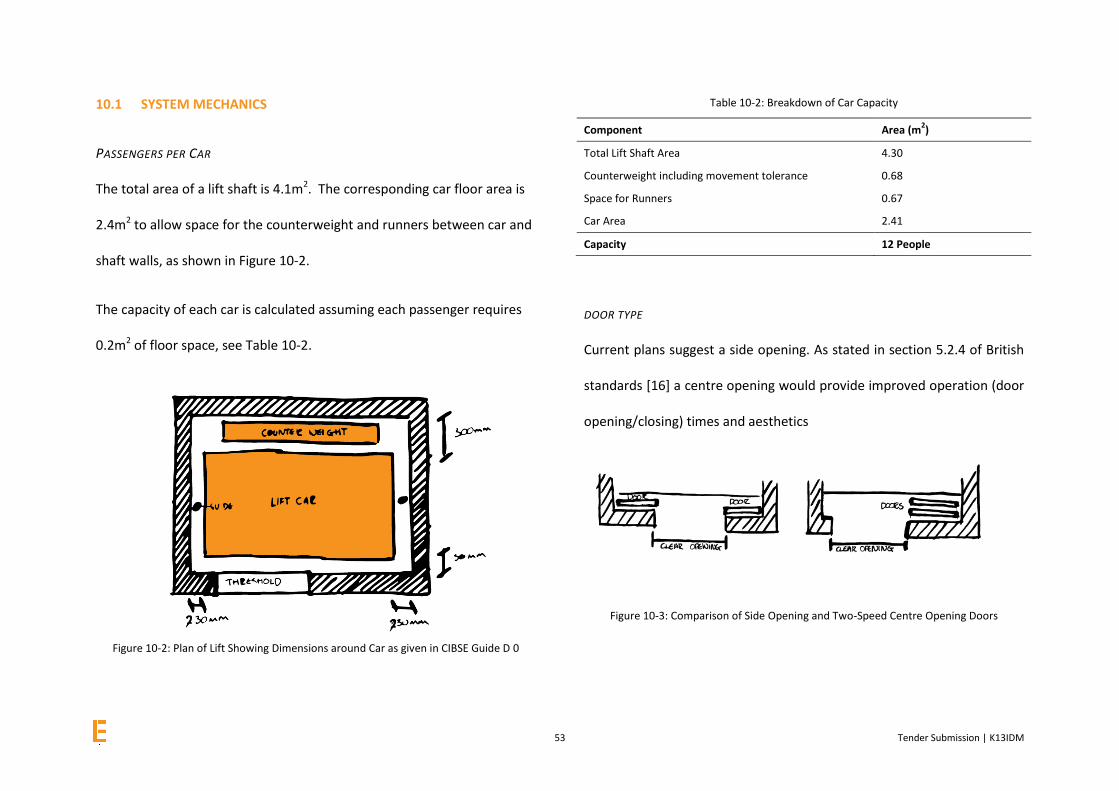
PASSENGERS PER CAR
The total area of a lift shaft is 4.1m2. The corresponding car floor area is
2.4m2 to allow space for the counterweight and runners between car and
shaft walls, as shown in Figure 10-2.
The capacity of each car is calculated assuming each passenger requires
0.2m2 of floor space, see Table 10-2.
Figure 10-2: Plan of Lift Showing Dimensions around Car as given in CIBSE Guide D 0
Table 10-2: Breakdown of Car Capacity
Component Area (m2)
Total Lift Shaft Area 4.30
Counterweight including movement tolerance 0.68
Space for Runners 0.67
Car Area 2.41
Capacity 12 People
DOOR TYPE
Current plans suggest a side opening. As stated in section 5.2.4 of British
standards [16] a centre opening would provide improved operation (door
opening/closing) times and aesthetics
Figure 10-3: Comparison of Side Opening and Two-Speed Centre Opening Doors

VERTICAL TRANSPORT 54
ROPING MECHANISM
The roping mechanism is housed at the top of the building to allow the
load to act directly downwards. Since the lifts only have a capacity of 12
a single wrap pulley system can be used. This is the most economical and
efficient system.
Figure 10-4: Single Wrap Pulley System
CAR SPEED
The recommended car speed for a building 37m tall is 2.5 m/s, as
specified in table 6 of British standards lifts and lift services document
[16].
DESIGN CONSIDERATIONS FOR THE DISABLED
Lift is essential in this building for disabled access as it over one story. The
distance from a lift to the furthest point away from a lift is about 30m this
is well under the maximum walking distance limit of 45m [16] and so
allows for any deviation from the direct route due to, for example,
furniture layout.

55 Tender Submission | K13IDM
10.2 FIREFIGHTING LIFTS
Fire-fighting lifts are a requirement for the transportation of the disabled
in the event of a fire. These lifts must be situated within the fire-fighting
shaft enclosed by a fire resistant structure that also contains stairs.
All buildings with over 900m^2 must have two fire-fighting lifts installed.
However if a sprinkler system is in place, one lift is sufficient, providing
the entire floor area is within 60m of the lift shaft. [16].
10.3 QUALITY OF SERVICE ASSESSMENT
The round trip calculations are shown in Table 10-4. Table 10-3 collates
relevant values already established. 116 people can be carried by the
system in five minutes, well above the recommended 87. The maximum
waiting time of 31.1s puts the system in the excellent category for quality
of service. [16]
Table 10-3: System specification
Starting Values
No. of Stories 10
People Above Ground 722 Total Occupancy
Floor Height (m) 3.6 (typical) 4.2 (ground)
Total Lift Flight L (m) 33 4.2+8*3.6
Door Width w (m) 1
Door Speed vd (m/s) 0.4 typical CIBSE guide d
Lift Capacity n 12
Lift Speed v (m/s) 2.5
Number of Cars N 4
Aim (people in 5 minutes) 87 12% population in five minutes (CIbSE Guide D)
Table 10-4: Lift Calculations for Quality of Service
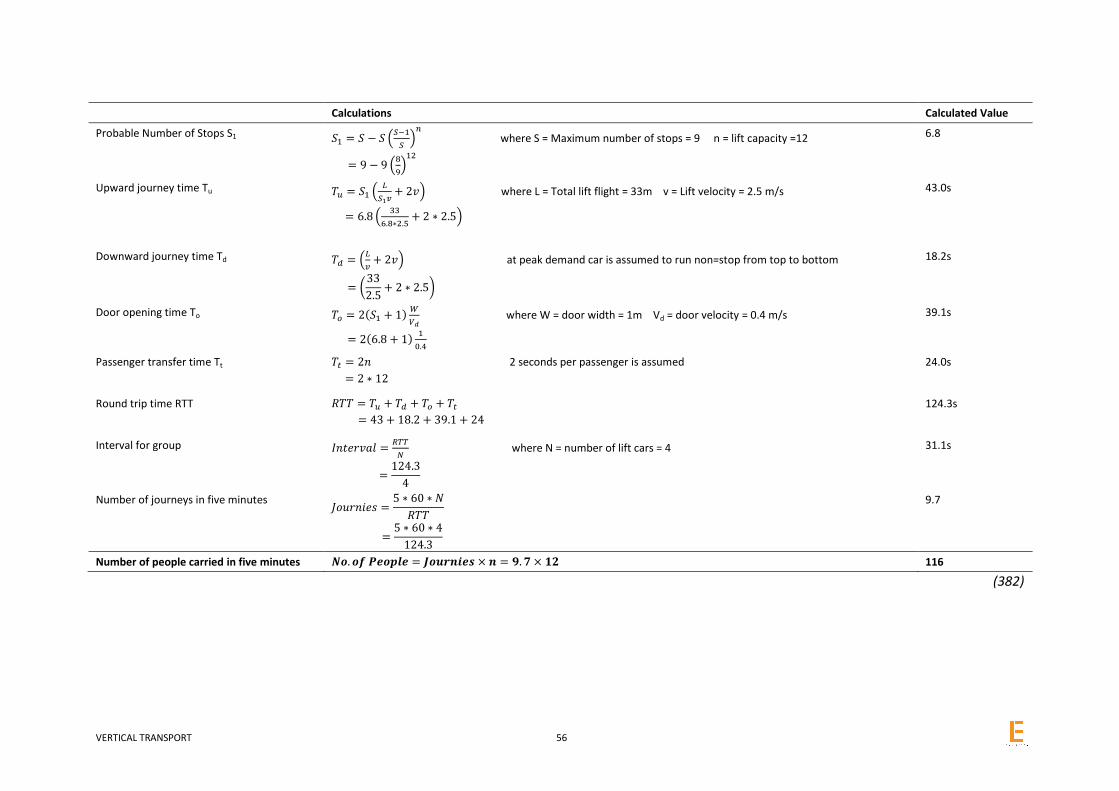
VERTICAL TRANSPORT 56
(382)
Calculations Calculated Value
Probable Number of Stops S1 𝑆1 = 𝑆 − 𝑆 (𝑆−1
𝑆)
𝑛 where S = Maximum number of stops = 9 n = lift capacity =12
= 9 − 9 (8
9)
12
6.8
Upward journey time Tu 𝑇𝑢 = 𝑆1 (𝐿
𝑆1𝑣+ 2𝑣) where L = Total lift flight = 33m v = Lift velocity = 2.5 m/s
= 6.8 (33
6.8∗2.5+ 2 ∗ 2.5)
43.0s
Downward journey time Td
= (33
2.5+ 2 ∗ 2.5)
𝑇𝑑 = (𝐿
𝑣+ 2𝑣) at peak demand car is assumed to run non=stop from top to bottom 18.2s
Door opening time To 𝑇𝑜 = 2(𝑆1 + 1)𝑊
𝑉𝑑 where W = door width = 1m Vd = door velocity = 0.4 m/s
= 2(6.8 + 1)1
0.4
39.1s
Passenger transfer time Tt 𝑇𝑡 = 2𝑛 2 seconds per passenger is assumed
= 2 ∗ 12
24.0s
Round trip time RTT
= 43 + 18.2 + 39.1 + 24
𝑅𝑇𝑇 = 𝑇𝑢 + 𝑇𝑑 + 𝑇𝑜 + 𝑇𝑡 124.3s
Interval for group
=124.3
4
𝐼𝑛𝑡𝑒𝑟𝑣𝑎𝑙 =𝑅𝑇𝑇
𝑁 where N = number of lift cars = 4 31.1s
Number of journeys in five minutes 𝐽𝑜𝑢𝑟𝑛𝑖𝑒𝑠 =
5 ∗ 60 ∗ 𝑁
𝑅𝑇𝑇
=5 ∗ 60 ∗ 4
124.3
9.7
Number of people carried in five minutes 𝑵𝒐. 𝒐𝒇 𝑷𝒆𝒐𝒑𝒍𝒆 = 𝑱𝒐𝒖𝒓𝒏𝒊𝒆𝒔 × 𝒏 = 𝟗. 𝟕 × 𝟏𝟐 116

57 Tender Submission | K13IDM

CONCLUSIONS 58
The key findings from this investigation are:
The peak-heating load for the building is 482 kW, occurring
between 06:00 and 07:00, December 4th. This requires a boiler
plant size of 578 kW capable of meeting peak requirements.
The peak-cooling load for the building is 443 kW, occurring
between 14:00 and 15:00, August 4th. This requires an air
conditioning system of 637 kW.
The series of potential improvements included altering:
o Fabric properties
o Glazing type
o Shading
o Thermal mass
The two changes that save the greatest amount of energy and
𝐶𝑂2 are installing triple glazing windows and upgrading the fabric
in line with ACEB Gold Standard regulations. They are however
less financially viable as they will take 50 years to see a financial
return.
In the short-term total solar shading and increased thermal mass
have less effect on energy and 𝐶𝑂2 savings, between 1 and 5%,
however they are more financially feasible.
The building does not conform to Approved Document B of the
UK Building Regulations with regards to fire protection, when
meeting maximum horizontal travel distances. Additional fire
doors must be implemented to rectify this.
It was seen that the current configuration of proposed vertical
transport system more than capable of meeting the building’s
requirements, putting the building into the ‘excellent’ category
according to British Standards for lifts and lift services.
(230)
11 CONCLUSIONS

59 Tender Submission | K13IDM

CONCLUSIONS 60

I Tender Submission | K13IDM
12.1 REFERENCES
[1] CIBSE. Guide A: Environmental Design. 2006
[2] HM Government. Approved Document L2: Conservation of Fuel
and Power in New Buildings Other than Dwellings (Building
Regulation). 2010
[3] CIBSE. Guide B: Heating, ventilating, air conditioning and
refrigeration. 2005
[4] BRE. The Government’s Standard Assessment Procedure for
Energy Rating of Dwellings. 2012
[5] R. Jones. Gilberts. Guest Lecture at the University of
Nottingham. 2015
[6] B. Jones. Air Conditioning Lecture notes. University of
Nottingham. 2015
[7] D. Oughton. Faber & Kell's Heating & Air-conditioning of
Buildings. 2008
[8] Gilberts. Series G curved blade Grilles. 2012
[9] HM Government. Approved Document F: Ventilation (Building
Regulations). 2000
[10] CIBSE. Guide C: Reference Data. 2007
[11] AECB. CarbonLite Program Guidance. 2009
[12] HM Government. Approved Document B volume 2: Fire Safety
– Buildings other than dwelling houses (Building Regulations).
2010
[13] British Standard. BS EN 12845:2004 +A2:2009: Fixed
firefighting systems – Automatic sprinkler systems – Design,
installation and maintenance. 2004, 2009.
[14] British Automatic Fire Sprinkler Association (BAFSA). Using
Sprinkler Systems in Buildings and Structures, Compliance with
Current Fire Safety Guidance. 2011
[15] CIBSE. Guide J: Weather, solar and illuminance data. 2002
[16] BSI Standards Publishing. BS 5655-6 Lifts and Lift Services. 2011
CIBSE. Guide D: Transportation in buildings. 2010
12 BACK MATTER

BACK MATTER II

I Tender Submission | K13IDM
12.2 APPENDIX A
Table 12-1: Weather data used for Heating Season Calculations, taken from CIBSE Guide J, Table 5.36
Hour January 29th
February 26th
March 29th April 28th May 29th June 21st July 4th August 4th September 4th
October 4th November 4th
December 4th
1 2.5 2.3 4.8 7.1 9.8 13.9 14.8 15.7 11.6 9 5.2 1.3
2 2 2 4.3 6.4 9.2 13.1 14.2 15 11.1 8.6 5 1.1
3 1.9 1.9 4.1 6 8.7 12.4 13.6 14.4 10.4 8.2 4.5 0.7
4 1.4 1.5 3.5 5.6 8.3 12 13.2 13.9 9.9 7.8 4.3 0.2
5 1.2 1.4 3.2 5.3 8.1 12.2 13.3 13.4 9.6 7.5 3.9 0
6 0.9 1.2 3 5.7 9.2 13.3 14.3 14 9.6 7.4 3.7 -0.2
7 0.7 1.1 3.2 7.4 10.9 15 15.9 15.6 10.6 7.8 3.7 -0.4
8 0.7 1.4 4.6 9.4 12.7 16.8 17.7 17.4 12.7 9.2 3.9 -0.3
9 1.2 2.5 6.6 11.1 14.4 18.5 19.5 19.4 15.1 11.4 5.4 -0.1
10 2.3 3.8 8.2 12.8 16 20.1 21 21.2 17.2 13.4 7 1.2
11 3.7 5.2 9.7 14.3 17.4 21.5 22.5 22.6 18.6 14.8 8.4 2.7
12 4.7 6.3 11.1 15.2 18.4 22.7 23.4 23.9 19.6 15.9 9.5 4
13 5.5 7.1 12.1 16 19.3 23.6 24.2 24.8 20.4 16.4 9.9 4.9
14 5.9 7.7 12.6 16.4 19.8 24.4 24.8 25.4 21 16.6 10.2 5.4
15 5.8 7.7 12.7 16.4 20.1 24.5 25.3 25.8 21.2 16.8 10 5.1
16 5.3 7.2 12.6 16.1 20 24.4 25.4 25.7 21.1 15.9 9.1 4.1
17 4.3 6.1 12.1 15.5 19.6 24.2 25 25.2 20.5 14.9 7.9 3.3
18 3.7 5 10.9 14.6 18.8 23.5 24.4 24.3 19.4 13.6 7.3 2.7
19 3.3 4.4 9.7 13.2 17.4 22.5 23.3 23 18 12.8 6.7 2.2
20 3 3.8 8.6 11.8 15.7 20.9 21.7 21.3 16.6 11.9 6.3 1.8
21 2.7 3.3 7.7 10.8 14.3 19.3 20.1 20 15.4 11.1 5.9 1.6
22 2.2 3 6.8 9.7 13.1 17.9 18.9 18.9 14.4 10.5 5.7 1.4
23 1.8 2.7 5.8 9.1 12.1 16.8 17.5 18 13.5 9.8 5.4 1.1
24 1.8 2.5 5.6 8.3 11.4 15.7 16.7 17.1 12.9 9.5 5 0.7
Average 2.9 3.8 7.6 11.0 14.4 18.7 19.6 19.8 15.4 11.7 6.4 1.9

BACK MATTER II
Table 12-2: Fabric gains/Losses (Wall, Roof, Glazing)
Hour January February March April May June July August September October November December
1 -415929 -420195 -366871 -339142 -281552 -194100 -174904 -155707 -243159 -277286 -358339 -441525
2 -426594 -426594 -377536 -354073 -294350 -211164 -187701 -170638 -253823 -285818 -362605 -445791
3 -428727 -428727 -381802 -362605 -305015 -226095 -200499 -183435 -268754 -294350 -373270 -454323
4 -439392 -437259 -394600 -371137 -313547 -234627 -209031 -194100 -279419 -302882 -377536 -464988
5 -443658 -439392 -400998 -377536 -317813 -230361 -206898 -204765 -285818 -309281 -386068 -469253
6 -450057 -443658 -405264 -369004 -294350 -206898 -185568 -191967 -285818 -311414 -390334 -473519
7 -454323 -445791 -400998 -332743 -258089 -170638 -151441 -157840 -264488 -302882 -390334 -477785
8 -454323 -439392 -371137 -290084 -219696 -132244 -113047 -119446 -219696 -273020 -386068 -475652
9 -443658 -415929 -328477 -253823 -183435 -95984 -74654 -76787 -168505 -226095 -354073 -471386
10 -420195 -388201 -294350 -217563 -149308 -61856 -42659 -38393 -123712 -183435 -319946 -443658
11 -390334 -358339 -262355 -185568 -119446 -31995 -10665 -8532 -93851 -153574 -290084 -411663
12 -369004 -334876 -232494 -166372 -98117 -6399 8532 19197 -72521 -130111 -266621 -383935
13 -351940 -317813 -211164 -149308 -78920 12798 25596 38393 -55457 -119446 -258089 -364738
14 -343408 -305015 -200499 -140776 -68255 29862 38393 51191 -42659 -115180 -251691 -354073
15 -345541 -305015 -198366 -140776 -61856 31995 49058 59723 -38393 -110914 -255956 -360472
16 -356206 -315680 -200499 -147175 -63989 29862 51191 57590 -40526 -130111 -275153 -381802
17 -377536 -339142 -211164 -159973 -72521 25596 42659 46925 -53324 -151441 -300749 -398865
18 -390334 -362605 -236760 -179170 -89585 10665 29862 27729 -76787 -179170 -313547 -411663
19 -398865 -375403 -262355 -209031 -119446 -10665 6399 0 -106649 -196233 -326344 -422328
20 -405264 -388201 -285818 -238893 -155707 -44792 -27729 -36260 -136510 -215430 -334876 -430860
21 -411663 -398865 -305015 -260222 -185568 -78920 -61856 -63989 -162106 -232494 -343408 -435126
22 -422328 -405264 -324211 -283685 -211164 -108781 -87452 -87452 -183435 -245292 -347674 -439392
23 -430860 -411663 -345541 -296483 -232494 -132244 -117313 -106649 -202632 -260222 -354073 -445791
24 -430860 -415929 -349807 -313547 -247425 -155707 -134377 -125845 -215430 -266621 -362605 -454323
Average -408375 -388289 -306170 -255779 -184235 -91362 -72254 -67544 -161395 -219696 -332477 -429705

III Tender Submission | K13IDM
Table 12-3: Total fabric gains/losses. (Wall, roof, glazing, Floor)
Hour January February March April May June July August September October November December
1 -420006 -424072 -369928 -341483 -283178 -194799 -175412 -156168 -244557 -279480 -361658 -445815
2 -430671 -430471 -380592 -356414 -295976 -211863 -188210 -171099 -255222 -288011 -365924 -450081
3 -432804 -432604 -384858 -364946 -306641 -226794 -201008 -183897 -270153 -296543 -376589 -458613
4 -443469 -441135 -397656 -373478 -315173 -235326 -209540 -194562 -280817 -305075 -380855 -469278
5 -447735 -443268 -404055 -379876 -319439 -231060 -207407 -205227 -287216 -311474 -389387 -473544
6 -454134 -447534 -408321 -371345 -295976 -207597 -186077 -192429 -287216 -313607 -393653 -477809
7 -458400 -449667 -404055 -335084 -259716 -171337 -151949 -158301 -265887 -305075 -393653 -482075 8 -458400 -443268 -374194 -292425 -221322 -132943 -113556 -119908 -221094 -275214 -389387 -479942
9 -447735 -419806 -331534 -256164 -185062 -96683 -75162 -77248 -169903 -228288 -357392 -475677
10 -424272 -392077 -297407 -219904 -150934 -62555 -43168 -38855 -125111 -185629 -323265 -447948
11 -394411 -362216 -265412 -187909 -121073 -32694 -11173 -8993 -95249 -155767 -293403 -415953
12 -373081 -338753 -235550 -168712 -99743 -7098 8023 18735 -73919 -132305 -269941 -388225
13 -356017 -321689 -214221 -151649 -80546 12099 25087 37932 -56856 -121640 -261409 -369028
14 -347485 -308891 -203556 -143117 -69881 29162 37885 50730 -44058 -117374 -255010 -358363
15 -349618 -308891 -201423 -143117 -63483 31295 48550 59262 -39792 -113108 -259276 -364762
16 -360283 -319556 -203556 -149516 -65616 29162 50683 57129 -41925 -132305 -278473 -386092
17 -381613 -343019 -214221 -162313 -74147 24896 42151 46464 -54723 -153634 -304068 -403156
18 -394411 -366482 -239816 -181510 -91211 9966 29353 27267 -78185 -181363 -316866 -415953
19 -402943 -379279 -265412 -211372 -121073 -11364 5890 -461 -108047 -198427 -329664 -426618
20 -409341 -392077 -288875 -241233 -157333 -45492 -28237 -36722 -137908 -217623 -338196 -435150
21 -415740 -402742 -308071 -262563 -187195 -79619 -62365 -64451 -163504 -234687 -346728 -439416
22 -426405 -409141 -327268 -286026 -212790 -109481 -87960 -87913 -184834 -247485 -350994 -443682
23 -434937 -415540 -348598 -298824 -234120 -132943 -117822 -107110 -204031 -262416 -357392 -450081
24 -434937 -419806 -352864 -315887 -249051 -156406 -134886 -126307 -216828 -268815 -365924 -458613
Mean -412452 -392166 -309227 -258119 -185862 -92061 -72763 -68005 -162793 -221889 -335796 -433995

BACK MATTER IV
Table 12-4: Plant Sizing
Peak Heating Load (W) 482075
PSR 1.2
Plant Heating Capacity (W) 578490
Plant Capacity (kW) 578
Table 12-5: Heating Degree Days, taken from CIBSE Guide A, Table 2.23
Month Number of Heating Degree Days
January 314
February 290
March 255
April 192
May 105
June 45
July 16
August 18
September 51
October 124
November 228
December 293
Total 1931

V Tender Submission | K13IDM
Table 12-6: Annual Energy Consumption and Carbon Emissions, using data from SAAP Building Regulations 2010, Table 12.
Parameter Value
Number of Degree Days 1931
Number of hours per day (h) 24
Σ𝑈𝐴 + 0.33NV 1330
Total Energy Used (kWh) 988504
Kg of Carbon per kWh 0.216
Total Carbon Used (Tonnes) 214
Price of Mains Gas per kWh (£) 0.0348
Price of energy used (£) 34, 400
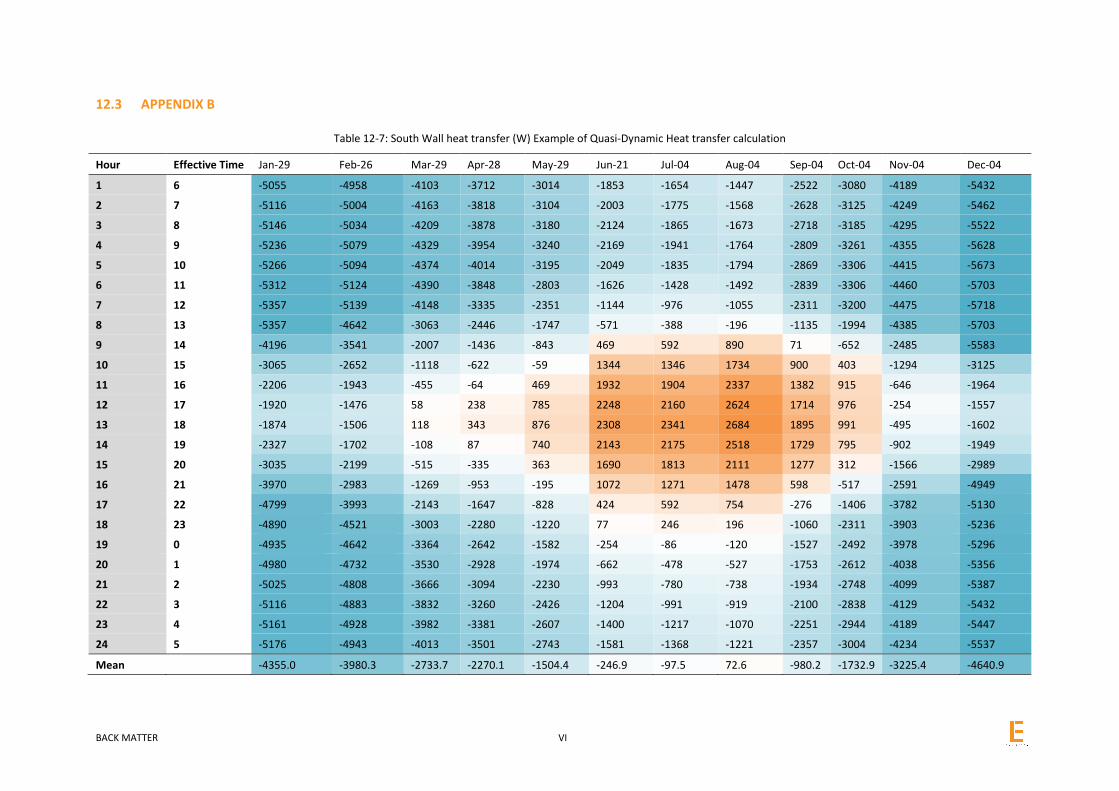
BACK MATTER VI
12.3 APPENDIX B
Table 12-7: South Wall heat transfer (W) Example of Quasi-Dynamic Heat transfer calculation
Hour Effective Time Jan-29 Feb-26 Mar-29 Apr-28 May-29 Jun-21 Jul-04 Aug-04 Sep-04 Oct-04 Nov-04 Dec-04
1 6 -5055 -4958 -4103 -3712 -3014 -1853 -1654 -1447 -2522 -3080 -4189 -5432
2 7 -5116 -5004 -4163 -3818 -3104 -2003 -1775 -1568 -2628 -3125 -4249 -5462
3 8 -5146 -5034 -4209 -3878 -3180 -2124 -1865 -1673 -2718 -3185 -4295 -5522
4 9 -5236 -5079 -4329 -3954 -3240 -2169 -1941 -1764 -2809 -3261 -4355 -5628
5 10 -5266 -5094 -4374 -4014 -3195 -2049 -1835 -1794 -2869 -3306 -4415 -5673
6 11 -5312 -5124 -4390 -3848 -2803 -1626 -1428 -1492 -2839 -3306 -4460 -5703
7 12 -5357 -5139 -4148 -3335 -2351 -1144 -976 -1055 -2311 -3200 -4475 -5718
8 13 -5357 -4642 -3063 -2446 -1747 -571 -388 -196 -1135 -1994 -4385 -5703
9 14 -4196 -3541 -2007 -1436 -843 469 592 890 71 -652 -2485 -5583
10 15 -3065 -2652 -1118 -622 -59 1344 1346 1734 900 403 -1294 -3125
11 16 -2206 -1943 -455 -64 469 1932 1904 2337 1382 915 -646 -1964
12 17 -1920 -1476 58 238 785 2248 2160 2624 1714 976 -254 -1557
13 18 -1874 -1506 118 343 876 2308 2341 2684 1895 991 -495 -1602
14 19 -2327 -1702 -108 87 740 2143 2175 2518 1729 795 -902 -1949
15 20 -3035 -2199 -515 -335 363 1690 1813 2111 1277 312 -1566 -2989
16 21 -3970 -2983 -1269 -953 -195 1072 1271 1478 598 -517 -2591 -4949
17 22 -4799 -3993 -2143 -1647 -828 424 592 754 -276 -1406 -3782 -5130
18 23 -4890 -4521 -3003 -2280 -1220 77 246 196 -1060 -2311 -3903 -5236
19 0 -4935 -4642 -3364 -2642 -1582 -254 -86 -120 -1527 -2492 -3978 -5296
20 1 -4980 -4732 -3530 -2928 -1974 -662 -478 -527 -1753 -2612 -4038 -5356
21 2 -5025 -4808 -3666 -3094 -2230 -993 -780 -738 -1934 -2748 -4099 -5387
22 3 -5116 -4883 -3832 -3260 -2426 -1204 -991 -919 -2100 -2838 -4129 -5432
23 4 -5161 -4928 -3982 -3381 -2607 -1400 -1217 -1070 -2251 -2944 -4189 -5447
24 5 -5176 -4943 -4013 -3501 -2743 -1581 -1368 -1221 -2357 -3004 -4234 -5537
Mean
-4355.0 -3980.3 -2733.7 -2270.1 -1504.4 -246.9 -97.5 72.6 -980.2 -1732.9 -3225.4 -4640.9

VII Tender Submission | K13IDM
Table 12-8: Total Fabric heat transfer (W)
Hour Jan-29 Feb-26 Mar-29 Apr-28 May-29 Jun-21 Jul-04 Aug-04 Sep-04 Oct-04 Nov-04 Dec-04
1 -27958 -26862 -21541 -17888 -13090 -6560 -5617 -5726 -12487 -16725 -23458 -29997
2 -27944 -27178 -22161 -18951 -14568 -8354 -7107 -6996 -13557 -17353 -23648 -30129
3 -28115 -27467 -22920 -20047 -15800 -9764 -8415 -8166 -14484 -17864 -23798 -30160
4 -28408 -27757 -23556 -20706 -16675 -10854 -9435 -9034 -15283 -18393 -24138 -30344
5 -28634 -27921 -23898 -21285 -17331 -11670 -10212 -9834 -15931 -18775 -24447 -30889
6 -28458 -28091 -24487 -22212 -18218 -12429 -11266 -10771 -16736 -19213 -24508 -30787
7 -28793 -28284 -24806 -21915 -16808 -10683 -10269 -10095 -17100 -19462 -24894 -31050
8 -29008 -28455 -24794 -20883 -15250 -8952 -8513 -8900 -16651 -19513 -25140 -31320
9 -29382 -28464 -23660 -18945 -13813 -7373 -6728 -7151 -14507 -18957 -25261 -31625
10 -29277 -27446 -21385 -16940 -11620 -4572 -4111 -4651 -12024 -16872 -24700 -31626
11 -28202 -25755 -19364 -13051 -6489 1251 969 23 -9457 -14435 -23011 -30868
12 -26888 -24312 -16175 -9248 -3516 4532 4023 3421 -4696 -12235 -21318 -29052
13 -25664 -21740 -11926 -6336 -1214 6707 6519 6587 -1080 -7647 -19849 -27645
14 -22725 -18570 -8896 -3823 1044 9021 8816 9125 1815 -4570 -15153 -26519
15 -20520 -16898 -7288 -2334 2481 10420 10359 10556 3497 -2702 -13278 -22054
16 -19628 -16179 -6730 -2140 2914 10745 10751 11006 3768 -2392 -12918 -20856
17 -20234 -16491 -6949 -2807 2426 9935 10124 10360 3158 -3486 -13570 -21642
18 -21102 -17662 -8034 -3711 1591 8969 9341 9302 2254 -4827 -15134 -22665
19 -22051 -18826 -9583 -4905 895 8512 8355 8222 849 -6274 -16387 -23143
20 -23106 -20139 -11542 -6838 -633 6969 6730 6411 -1288 -8096 -17447 -24667
21 -24861 -21714 -13685 -9513 -3740 3509 3914 3520 -3696 -9962 -19359 -28181
22 -26825 -24145 -15720 -11759 -6398 581 1194 835 -5982 -12129 -22175 -28894
23 -27323 -25904 -18584 -13775 -8086 -1133 -636 -1179 -8435 -15175 -22690 -29376
24 -27688 -26467 -20697 -15835 -10005 -2955 -2569 -3186 -11295 -16066 -23095 -29672

BACK MATTER VIII
Table 12-9: Ventilation Heat transfer (W)
Hour Jan-29 Feb-26 Mar-29 Apr-28 May-29 Jun-21 Jul-04 Aug-04 Sep-04 Oct-04 Nov-04 Dec-04
1 -266451 -269183 -235023 -217260 -180367 -124344 -112046 -99748 -155771 -177634 -229557 -282848
2 -273283 -273283 -241855 -226825 -188565 -135275 -120244 -109313 -162603 -183099 -232290 -285580
3 -274649 -274649 -244588 -232290 -195397 -144840 -128443 -117512 -172168 -188565 -239122 -291046
4 -281481 -280115 -252786 -237756 -200863 -150305 -133908 -124344 -179000 -194031 -241855 -297878
5 -284214 -281481 -256886 -241855 -203596 -147573 -132542 -131176 -183099 -198130 -247321 -300611
6 -288313 -284214 -259619 -236389 -188565 -132542 -118878 -122977 -183099 -199496 -250054 -303344
7 -291046 -285580 -256886 -213160 -165336 -109313 -97015 -101115 -169435 -194031 -250054 -306077
8 -291046 -281481 -237756 -185832 -140741 -84718 -72420 -76519 -140741 -174901 -247321 -304710
9 -284214 -266451 -210428 -162603 -117512 -61489 -47824 -49191 -107947 -144840 -226825 -301977
10 -269183 -248687 -188565 -139374 -95649 -39626 -27328 -24595 -79252 -117512 -204962 -284214
11 -250054 -229557 -168069 -118878 -76519 -20496 -6832 -5466 -60122 -98382 -185832 -263718
12 -236389 -214527 -148939 -106580 -62855 -4099 5466 12298 -46458 -83351 -170802 -245954
13 -225458 -203596 -135275 -95649 -50557 8198 16397 24595 -35527 -76519 -165336 -233657
14 -219993 -195397 -128443 -90183 -43725 19130 24595 32794 -27328 -73786 -161237 -226825
15 -221359 -195397 -127076 -90183 -39626 20496 31428 38260 -24595 -71053 -163970 -230924
16 -228191 -202229 -128443 -94283 -40992 19130 32794 36893 -25962 -83351 -176267 -244588
17 -241855 -217260 -135275 -102481 -46458 16397 27328 30061 -34160 -97015 -192664 -255519
18 -250054 -232290 -151672 -114779 -57389 6832 19130 17763 -49191 -114779 -200863 -263718
19 -255519 -240489 -168069 -133908 -76519 -6832 4099 0 -68321 -125710 -209061 -270550
20 -259619 -248687 -183099 -153038 -99748 -28695 -17763 -23229 -87450 -138008 -214527 -276015
21 -263718 -255519 -195397 -166702 -118878 -50557 -39626 -40992 -103847 -148939 -219993 -278748
22 -270550 -259619 -207695 -181733 -135275 -69687 -56023 -56023 -117512 -157138 -222725 -281481
23 -276015 -263718 -221359 -189931 -148939 -84718 -75153 -68321 -129809 -166702 -226825 -285580
24 -276015 -266451 -224092 -200863 -158504 -99748 -86084 -80618 -138008 -170802 -232290 -291046

IX Tender Submission | K13IDM
Table 12-10: West Glazing unshaded solar gain (W) Example of solar cooling load
Hour Jan 29th Feb 26th Mar 29th Apr 28th May 29th Jun 21st Jul 4th Aug 4th Sep 4th Oct 4th Nov 4th Dec 4th
07:30 1051 2365 4573 7253 8935 9723 8830 7043 5203 2838 1314 841
08:30 1367 2786 5308 8094 9671 10354 9566 7779 5887 3364 1629 841
09:30 1787 3416 6044 8777 10302 10880 10091 8462 6517 3994 2102 1261
10:30 2260 4100 6622 9250 10722 11300 10617 8935 7201 4520 2628 1682
11:30 2628 4520 7095 9671 11037 11563 10985 9250 7674 4941 2943 2102
12:30 3311 5308 7884 10459 11721 12194 11616 9934 8304 5729 3627 2628
13:30 4520 6570 9198 11878 12982 13508 12877 11300 9618 7043 4993 3837
14:30 8777 12089 15400 18448 19499 20078 18921 17555 16083 12772 9829 8094
15:30 10039 16030 20445 24440 25439 26122 24545 23126 21444 17029 12351 9723
16:30 8252 15663 22075 27226 28592 29486 27804 25228 23652 17082 11248 5887
17:30 4100 10985 19447 26963 29118 30379 28487 23862 21234 13981 5781 841
PEAK 10039 16030 22075 27226 29118 30379 28487 25228 23652 17082 12351 9723
Table 12-11: West glazing shaded solar gain (W) Example of solar cooling load
Hour Jan 29th Feb 26th Mar 29th Apr 28th May 29th Jun 21st Jul 4th Aug 4th Sep 4th Oct 4th Nov 4th Dec 4th
07:30 1050 2361 4563 7243 8933 9722 8829 7036 5192 2832 1313 841
08:30 1361 2770 5274 8050 9637 10326 9537 7744 5848 3343 1622 839
09:30 1769 3367 5944 8640 10179 10770 9985 8343 6401 3932 2076 1249
10:30 2194 3922 6279 8758 10248 10889 10196 8516 6796 4311 2528 1633
11:30 1970 2996 4362 5781 7201 7936 7463 5939 4520 3101 2011 1545
12:30 3311 5308 7884 10459 11721 12194 11616 9934 8304 5729 3627 2628
13:30 4520 6570 9198 11878 12982 13508 12877 11300 9618 7043 4993 3837
14:30 8777 12089 15400 18448 19499 20078 18921 17555 16083 12772 9829 8094
15:30 10039 16030 20445 24440 25439 26122 24545 23126 21444 17029 12351 9723
16:30 8252 15663 22075 27226 28592 29486 27804 25228 23652 17082 11248 5887
17:30 4100 10985 19447 26963 29118 30379 28487 23862 21234 13981 5781 841
PEAK 10039 16030 22075 27226 29118 30379 28487 25228 23652 17082 12351 9723
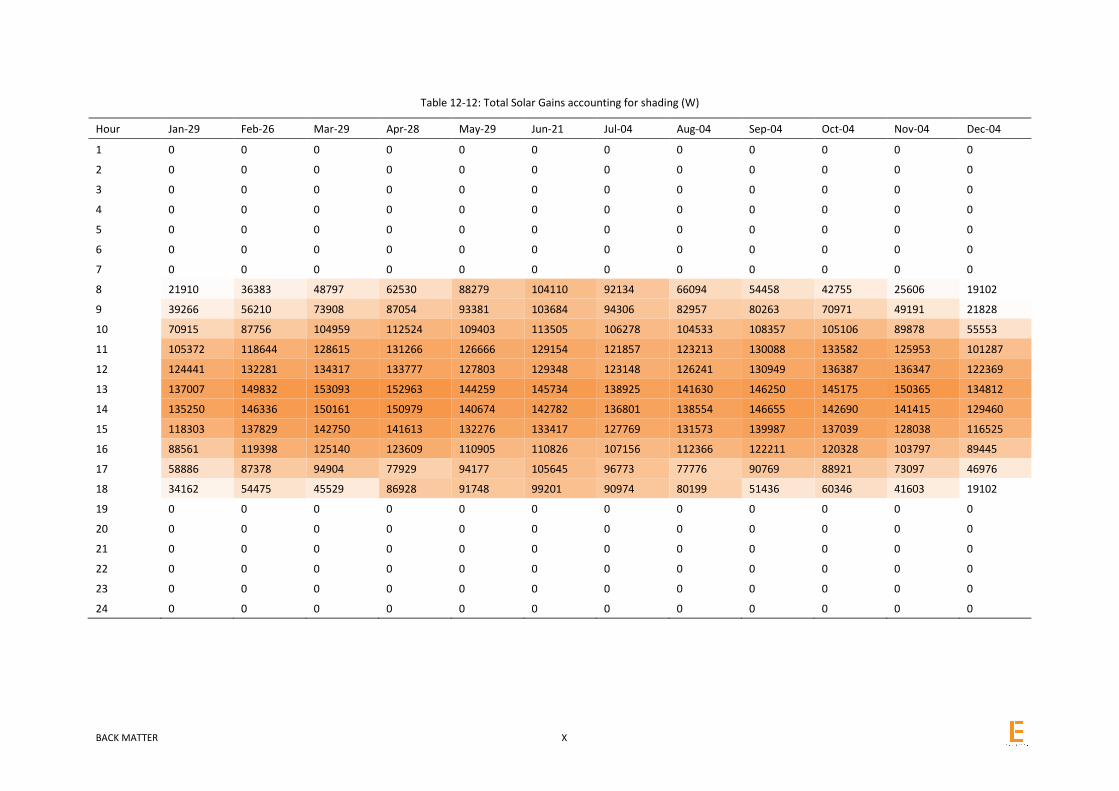
BACK MATTER X
Table 12-12: Total Solar Gains accounting for shading (W)
Hour Jan-29 Feb-26 Mar-29 Apr-28 May-29 Jun-21 Jul-04 Aug-04 Sep-04 Oct-04 Nov-04 Dec-04
1 0 0 0 0 0 0 0 0 0 0 0 0
2 0 0 0 0 0 0 0 0 0 0 0 0
3 0 0 0 0 0 0 0 0 0 0 0 0
4 0 0 0 0 0 0 0 0 0 0 0 0
5 0 0 0 0 0 0 0 0 0 0 0 0
6 0 0 0 0 0 0 0 0 0 0 0 0
7 0 0 0 0 0 0 0 0 0 0 0 0
8 21910 36383 48797 62530 88279 104110 92134 66094 54458 42755 25606 19102
9 39266 56210 73908 87054 93381 103684 94306 82957 80263 70971 49191 21828
10 70915 87756 104959 112524 109403 113505 106278 104533 108357 105106 89878 55553
11 105372 118644 128615 131266 126666 129154 121857 123213 130088 133582 125953 101287
12 124441 132281 134317 133777 127803 129348 123148 126241 130949 136387 136347 122369
13 137007 149832 153093 152963 144259 145734 138925 141630 146250 145175 150365 134812
14 135250 146336 150161 150979 140674 142782 136801 138554 146655 142690 141415 129460
15 118303 137829 142750 141613 132276 133417 127769 131573 139987 137039 128038 116525
16 88561 119398 125140 123609 110905 110826 107156 112366 122211 120328 103797 89445
17 58886 87378 94904 77929 94177 105645 96773 77776 90769 88921 73097 46976
18 34162 54475 45529 86928 91748 99201 90974 80199 51436 60346 41603 19102
19 0 0 0 0 0 0 0 0 0 0 0 0
20 0 0 0 0 0 0 0 0 0 0 0 0
21 0 0 0 0 0 0 0 0 0 0 0 0
22 0 0 0 0 0 0 0 0 0 0 0 0
23 0 0 0 0 0 0 0 0 0 0 0 0
24 0 0 0 0 0 0 0 0 0 0 0 0

XI Tender Submission | K13IDM
Table 12-13: Total Sensible Heat transfer (W)
Hour Jan-29 Feb-26 Mar-29 Apr-28 May-29 Jun-21 Jul-04 Aug-04 Sep-04 Oct-04 Nov-04 Dec-04
1 -412878 -415730 -361061 -331746 -273652 -186189 -167481 -149824 -237517 -273338 -355082 -438604
2 -422734 -421968 -371551 -346626 -286973 -203775 -180814 -164912 -248457 -281863 -359220 -442685
3 -424879 -424231 -376257 -355619 -298075 -219003 -193966 -177925 -263202 -290269 -369239 -450612
4 -435042 -432417 -388737 -364174 -306845 -227988 -202882 -188664 -273871 -298694 -373527 -460665
5 -439215 -434554 -395001 -370675 -311450 -224856 -201685 -199333 -280441 -304998 -381732 -465158
6 -444962 -438673 -399537 -363705 -290623 -203903 -182999 -188427 -281245 -307410 -385741 -469004
7 -387841 -379437 -334506 -268449 -194254 -107196 -89017 -94765 -200467 -238360 -324724 -411812
8 -304744 -275901 -196659 -104005 -7483 95578 101807 69458 -42704 -106618 -234014 -329604
9 -216490 -172966 -69532 17417 94016 191691 202697 188952 94021 26984 -119537 -261832
10 -101619 -53338 56780 139852 205218 297299 308299 309961 227455 164084 14697 -141044
11 -38452 6877 112066 192092 255247 346407 358567 360951 279388 222634 80096 -64943
12 1670 43670 148593 216172 279096 373569 380677 393038 304750 249351 113896 -16383
13 31253 79584 191356 254061 315619 409895 414742 429358 339458 272598 137279 15233
14 -82476 -31704 78519 139681 201357 302244 303953 317859 231796 154333 16141 -101930
15 23614 84267 197495 254609 323123 419057 429139 443010 353563 277303 123497 6485
16 -15106 56686 178469 230876 300212 394818 410893 422280 334085 243136 81851 -39137
17 -65126 2640 138144 172687 275099 384878 391987 377174 290189 190896 26811 -98184
18 -163964 -114551 2594 101613 194641 302248 312158 299371 166836 73915 -79494 -200328
19 -268374 -243436 -129573 -75547 13160 121448 137082 131027 24957 -65072 -195596 -291180
20 -336754 -317995 -214648 -166518 -83328 26919 42472 34257 -66218 -146063 -265954 -362002
21 -405833 -390843 -295960 -250335 -175474 -69527 -53330 -55699 -153717 -225122 -337165 -430867
22 -417667 -399196 -315760 -274294 -201819 -100090 -79738 -80097 -175741 -239133 -343929 -435528
23 -426061 -406876 -338364 -288154 -223247 -123518 -109203 -99876 -195961 -255996 -350366 -441932
24 -426426 -411388 -344425 -306005 -238984 -147053 -126928 -119649 -210664 -262810 -358666 -450124
Peak 31253 84267 197495 254609 323123 419057 429139 443010 353563 277303 137279 15233

BACK MATTER XII
12.4 APPENDIX C
Table 12-14: Total pressure drop along pipes and method
Section of Duct Q (m3/s) Velocity (m/s)* Duct CSA (m2) Duct Diameter (m) Pressure Drop per Unit Length (Pa)† Duct Length (m) Pressure Drop Along Pipe (pa)
1 16.30 10 1.63 1.44 0.5 4 2
2 14.51 10 1.45 1.36 0.6 3.6 2.16
3 12.73 10 1.27 1.27 0.6 3.6 2.16
4 10.95 10 1.09 1.18 0.7 3.6 2.52
5 9.16 10 0.92 1.08 0.8 3.6 2.88
6 7.38 10 0.74 0.97 0.9 3.6 3.24
7 5.60 10 0.56 0.84 1.1 3.6 3.96
8 3.81 10 0.38 0.70 1.4 3.6 5.04
9 2.03 10 0.20 0.51 2 3.6 7.2
10 0.89 4 0.22 0.53 0.35 13 4.55
11 0.45 4 0.11 0.38 0.5 9 4.5
Total Pressure Drop (Pa) 40.21
*values to prevent excessive fan power form CIBSE Guide B 2.3.11.4 [3]
†From Chart 4.2 CIBSE Guide C [10]
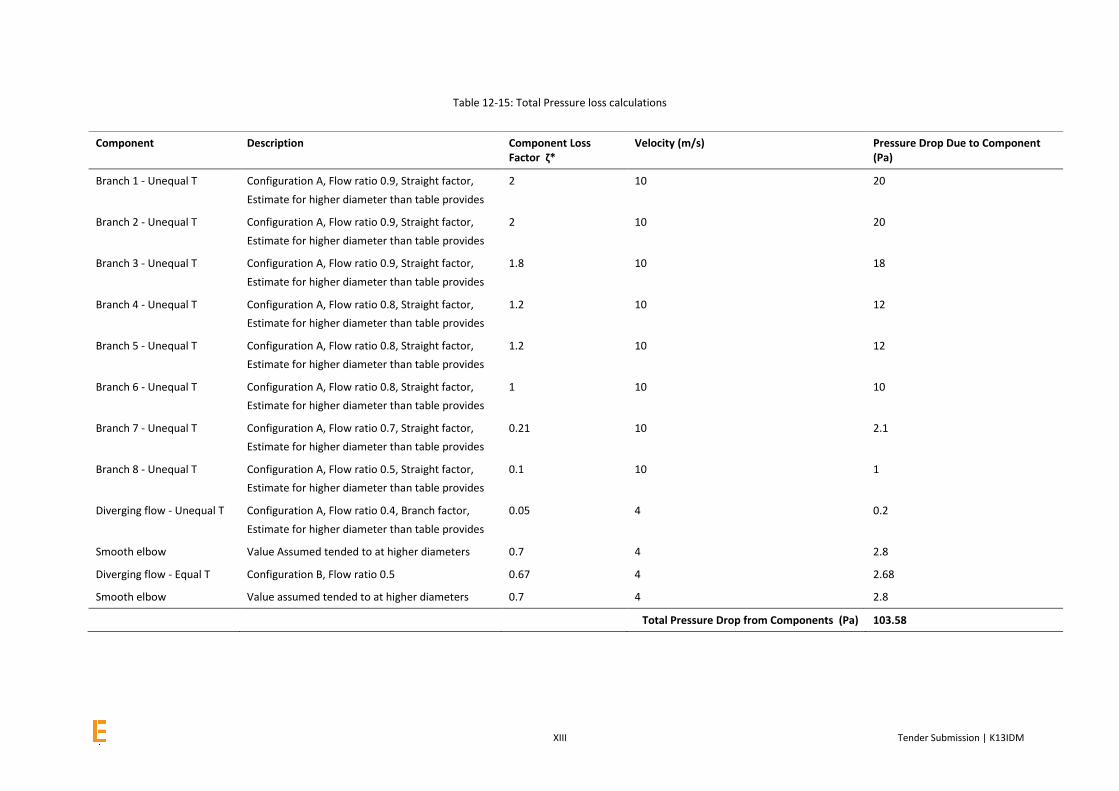
XIII Tender Submission | K13IDM
Table 12-15: Total Pressure loss calculations
Component Description Component Loss Factor ζ*
Velocity (m/s) Pressure Drop Due to Component (Pa)
Branch 1 - Unequal T Configuration A, Flow ratio 0.9, Straight factor,
Estimate for higher diameter than table provides
2 10 20
Branch 2 - Unequal T Configuration A, Flow ratio 0.9, Straight factor,
Estimate for higher diameter than table provides
2 10 20
Branch 3 - Unequal T Configuration A, Flow ratio 0.9, Straight factor,
Estimate for higher diameter than table provides
1.8 10 18
Branch 4 - Unequal T Configuration A, Flow ratio 0.8, Straight factor,
Estimate for higher diameter than table provides
1.2 10 12
Branch 5 - Unequal T Configuration A, Flow ratio 0.8, Straight factor,
Estimate for higher diameter than table provides
1.2 10 12
Branch 6 - Unequal T Configuration A, Flow ratio 0.8, Straight factor,
Estimate for higher diameter than table provides
1 10 10
Branch 7 - Unequal T Configuration A, Flow ratio 0.7, Straight factor,
Estimate for higher diameter than table provides
0.21 10 2.1
Branch 8 - Unequal T Configuration A, Flow ratio 0.5, Straight factor,
Estimate for higher diameter than table provides
0.1 10 1
Diverging flow - Unequal T Configuration A, Flow ratio 0.4, Branch factor,
Estimate for higher diameter than table provides
0.05 4 0.2
Smooth elbow Value Assumed tended to at higher diameters 0.7 4 2.8
Diverging flow - Equal T Configuration B, Flow ratio 0.5 0.67 4 2.68
Smooth elbow Value assumed tended to at higher diameters 0.7 4 2.8
Total Pressure Drop from Components (Pa) 103.58

BACK MATTER XIV

XV Tender Submission | K13IDM