LONG BRIDGE STUDY Bridge Load Capacity Analysis - · PDF fileLong Bridge Load Capacity...
26
DISTRICT DEPARTMENT OF TRANSPORTATION LONG BRIDGE STUDY Bridge Load Capacity Analysis April 2013
Transcript of LONG BRIDGE STUDY Bridge Load Capacity Analysis - · PDF fileLong Bridge Load Capacity...

DISTRICT DEPARTMENT OF TRANSPORTATION
LONG BRIDGE STUDYBridge Load Capacity Analysis
April 2013

Long Bridge Load Capacity Analysis i
Table of Contents
Introduction ........................................................................................................................ 1
1. Analysis & Rating Methodology ............................................................................... 2
2. Assumptions and Material Properties ...................................................................... 4
2.1 1942 Through Girder Spans ................................................................................ 4
2.2 1904 Swing Truss Spans ........................................................................................ 4
2.3 1942 Piles in Piers of Through Girder Spans ...................................................... 4
2.4 1904 Piles in Piers of Through Girder Spans ...................................................... 4
2.5 Soil Bearing Capacity under 1904 Swing Truss Caisson Piers ....................... 4
3. Results and Recommendations ............................................................................... 5
3.1 Swing Truss ............................................................................................................ 5
3.2 Through Girder Span ........................................................................................... 9
Long Bridge Load Capacity Analysis ii
List of Figures Figure 1 – Long Bridge Views: Approach Spans & Swing Truss ................................... 1
List of Tables Table 1 – Swing Truss, Original Design Condition .......................................................... 6 Table 2 – Swing Truss, 1/16” Overall Section Loss ......................................................... 7 Table 3 – Swing Truss Piers,Original Design Condition .................................................. 8 Table 4 – Through Girder, Original Design Condition ................................................ 10 Table 5 – Through Girder, 1/16” Overall Section Loss ................................................ 11 Table 6 – Through Girder Piers,Original Design Condition ........................................ 12

Long Bridge Load Capacity Analysis 1
Introduction Effective evaluation of a bridge requires accurate calculation of its load capacity. To assess the load capacity and serviceability of the Long Bridge, a technical analysis was conducted to load rate a representative through girder span and the two swing truss spans on the bridge. The span selected for the through girder load rating was the longest span at 113 feet in length.
The existing Long Bridge is comprised of 22 through girder spans and a double span swing truss for a total of 24 spans over the Potomac River. The bridge elements were constructed in either 1904 (the swing truss, its piers, and every other pier supporting through girder spans) or 1942 (the through girder spans and the remaining piers). Figure 1 shows the through girder approach spans as well as the main swing span truss over the navigable channel. The through girder spans vary from 85 – 113 feet in length while the two swing truss spans measures 280 feet in total length.
Figure 1 – Long Bridge Views: Approach Spans & Swing Truss
As input to the process of analyzing the structure and computing the load rating, physical characteristics of the structure, including member dimensions and thicknesses, are based on the original 1904 and 1942 design plans. Field measurements of the bridge components were not available to the load raters.

Page left blank intentionally.

Long Bridge Load Capacity Analysis 2
1. Analysis & Rating Methodology All load ratings were determined in accordance with accepted methods in the 2012 Manual for Railway Engineering published by American Railway Engineering and Maintenance-of-Way Association (AREMA). The load ratings were conducted at two levels:
Normal Rating - the load level which can be carried by the existing structure for its expected service life; and
Maximum Rating - recognizes that loads producing stresses higher than design values may be imposed on a structure, however, to reduce the effect of fatigue, these loads should be allowed only infrequently. The AREMA Code permits the engineer to authorize more frequent Maximum Rating loads with the caution that the useful life of the structure will be reduced. If more frequent Maximum Rating loads are contemplated, it is appropriate to conduct more frequent and detailed inspection of the structure.
The analysis and load rating results are documented in a separate document in excess of 1,000 pages and is not included as part of this document. It includes:
1. Calculations of the cross-sectional properties of each member. Incremental scenarios were analyzed for the steel superstructure members to evaluate the effects of aging and corrosion on rating. The initial analysis was per the original design sections with no section loss followed by three additional scenarios that analyzed incremental overall section losses of 1/16, 1/8, and 3/16 inches of loss.
2. Calculations of the dead load, wind load, and breaking load of each member.
3. Superstructure load analysis using SAP2000 software. 4. Substructure load analysis using RC-Pier software. 5. Calculations of load rating of each member. 6. Special spreadsheets to facilitate load rating of truss gusset plates. 7. Calculations of load rating of truss gusset plates.
The rating was expressed in terms of Cooper E, and was calculated at all
Long Bridge Load Capacity Analysis 3
significant locations in the swing truss and through girder span, including their floor systems. Cooper’s E-80 loading, or its alternative loading when governed, was used as the live load.

Long Bridge Load Capacity Analysis 4
2. Assumptions and Material Properties
The key properties of the structure were from the original plans, and per AREMA. However, the properties of the steel could not be positively identified from the original plans. The steel properties of yield strength (Fy) and ultimate strength (Fu) were obtained from the American Institute of Steel Construction Manual, AISC Rehabilitation & Retrofit Guide, A Reference for Historic Shapes & Specifications, as determined by the year of design or fabrication. Accordingly, for Long Bridge the component assumptions were as follows:
2.1 1942 Through Girder Spans
1. Steel Girders & Floor Beam: Fy = 33 ksi, Fu = 66 ksi (Fabricated in 1942)
2. Steel Stringers: Fy = 26 ksi, Fu = 52 ksi (Fabricated in 1904+, reused in 1942 construction)
2.2 1904 Swing Truss Spans
1. Steel in all Locations: Fy = 26 ksi, Fu = 52 ksi
2. Steel in Top Chord Eyebar: Fy = 30 ksi, Fu = 60 ksi
2.3 1942 Piles in Piers of Through Girder Spans
1. Steel H-Piles: 14”x14 ½”@73 pounds/foot with 12,600 psi allowable stress
2.4 1904 Piles in Piers of Through Girder Spans
1. Timber Piles: 12” Diameter with 800 psi allowable stress
2.5 Soil Bearing Capacity under 1904 Swing Truss Caisson Piers
1. Center Pier: 8,000 psf
2. End Piers: 7,500 psf

Page left blank intentionally.

Long Bridge Load Capacity Analysis 5
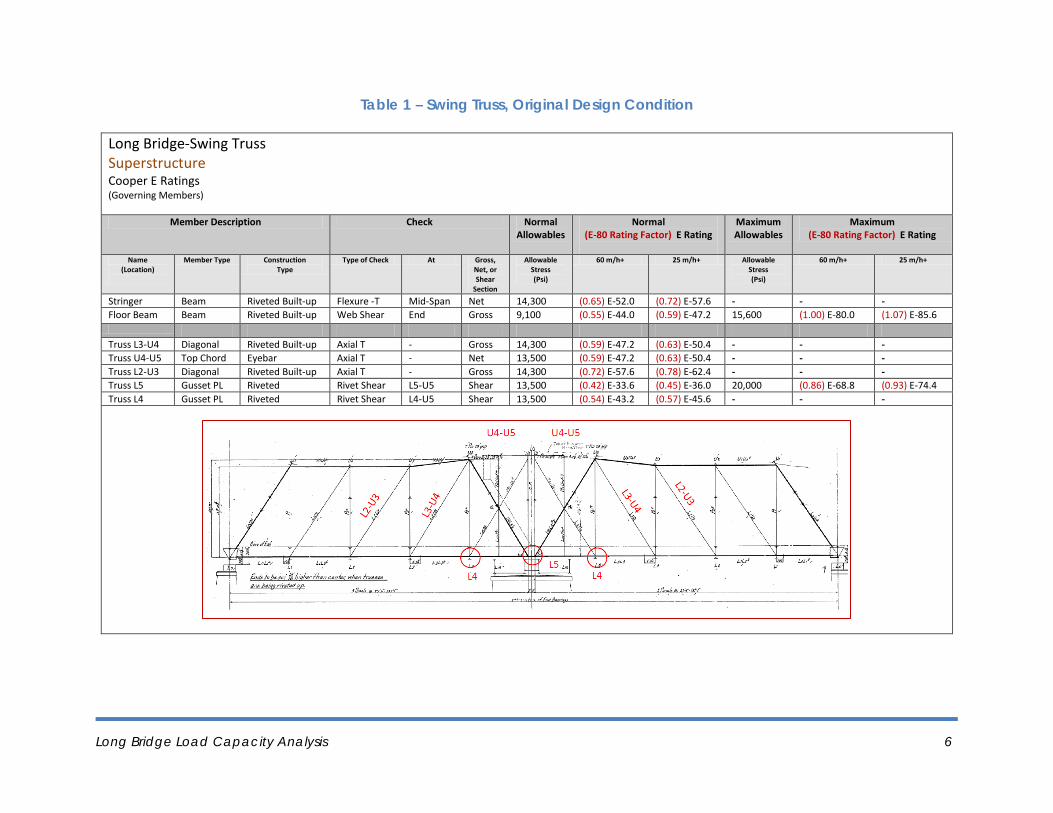
3. Results and Recommendations 3.1 Swing Truss Superstructure (Table 1 – Original Design; Table 2 – 1/16” Loss): These results indicate that the superstructure of the swing truss designed in 1904 rates less than Cooper’s E-80 loading, even in its original condition. The controlling member of the truss, a gusset plates, rates 0.42 (E-34) and 0.45 (E-36) at Normal Rating for train speeds of 60 and 25 miles/hour, respectively. The Maximum Rating for this member is 0.86 (E-69) and 0.93 (E-74) for train speeds of 60 and 25 miles/hour, respectively. However, the rating decreases by an increment of 0.12 for every 1/16” loss of the section, up to 3/16” loss. Assuming 1/16” section loss for the current condition, the truss rates 0.74 (E-59) and 0.80 (E-64) at Maximum Rating.
Recommendation: The structure does not have sufficient capacity for long-term service under the current loads. It is recommended that the controlling members (3 gusset plates, 2 diagonals, and 2 top chords, as shown in the rating tables) be strengthened. More frequent and detailed inspection of all members is recommended. Reduced train speeds are recommended to reduce fatigue effects.
Substructure (Table 3 – Original Design): The substructure of the swing truss consists of solid concrete caissons under the center pier and the two end piers. These concrete caissons in their original condition have capacity for Cooper’s E-80 load. However, their capacity is not quite sufficient under combined Cooper’s E-80 load and longitudinal braking loads. The governing stress mode is the soil bearing capacity under the caissons.
Recommendation: Underwater inspection of the substructure is recommended to determine the existing condition in order to confirm the reported rating, or modify the rating if the condition is different from the assumed condition. Reduced train speeds are recommended to decrease the intensity of braking forces.

Page left blank intentionally.
Long Bridge Load Capacity Analysis 6
Table 1 – Swing Truss, Original Design Condition
Long Bridge-Swing Truss Superstructure Cooper E Ratings (Governing Members)
Member Description Check Normal Allowables
Normal (E-80 Rating Factor) E Rating
Maximum Allowables
Maximum (E-80 Rating Factor) E Rating
Name (Location)
Member Type Construction Type
Type of Check At Gross, Net, or Shear
Section
Allowable Stress (Psi)
60 m/h+ 25 m/h+ Allowable Stress (Psi)
60 m/h+ 25 m/h+
Stringer Beam Riveted Built-up Flexure -T Mid-Span Net 14,300 (0.65) E-52.0 (0.72) E-57.6 - - - Floor Beam Beam Riveted Built-up Web Shear End Gross 9,100 (0.55) E-44.0 (0.59) E-47.2 15,600 (1.00) E-80.0 (1.07) E-85.6 Truss L3-U4 Diagonal Riveted Built-up Axial T - Gross 14,300 (0.59) E-47.2 (0.63) E-50.4 - - - Truss U4-U5 Top Chord Eyebar Axial T - Net 13,500 (0.59) E-47.2 (0.63) E-50.4 - - - Truss L2-U3 Diagonal Riveted Built-up Axial T - Gross 14,300 (0.72) E-57.6 (0.78) E-62.4 - - - Truss L5 Gusset PL Riveted Rivet Shear L5-U5 Shear 13,500 (0.42) E-33.6 (0.45) E-36.0 20,000 (0.86) E-68.8 (0.93) E-74.4 Truss L4 Gusset PL Riveted Rivet Shear L4-U5 Shear 13,500 (0.54) E-43.2 (0.57) E-45.6 - - -

Long Bridge Load Capacity Analysis 7
Table 2 – Swing Truss, 1/16” Overall Section Loss
Long Bridge-Swing Truss Superstructure Cooper E Ratings (Governing Members)
Member Description Check Normal Allowables
Normal (E-80 Rating Factor) E Rating
Maximum Allowables
Maximum (E-80 Rating Factor) E Rating
Name (Location)
Member Type Construction Type
Type of Check At Gross, Net, or Shear
Section
Allowable Stress (Psi)
60 m/h+ 25 m/h+ Allowable Stress (Psi)
60 m/h+ 25 m/h+
Stringer Beam Riveted Built-up Flexure -T Mid-Span Net 14,300 (0.58) E-46.0 (0.65) E-52.0 - - - Floor Beam Beam Riveted Built-up Web Shear End Gross 9,100 (0.47) E-37.0 (0.50) E-40.0 15,600 (0.86) E-68.0 (0.92) E-73.6 Truss L3-U4 Diagonal Riveted Built-up Axial T - Gross 14,300 (0.53) E-42.4 (0.57) E-45.6 - - - Truss U4-U5 Top Chord Eyebar Axial T - Net 13,500 (0.54) E-43.2 (0.58) E-46.4 - - - Truss L2-U3 Diagonal Riveted Built-up Axial T - Gross 14,300 (0.65) E-52.0 (0.70) E-56.0 - - - Truss L5 Gusset PL Riveted Rivet Bearing* L5-U5 Rivet 27,000 (0.34) E-27.2 (0.36) E-28.8 20,000** (0.74) E-59.2 (0.80) E-64.0 Truss L4 Gusset PL Riveted Rivet Shear L4-U5 Rivet 13,500 (0.46) E-36.8 (0.49) E-39.2 - - - *Rivet bearing controls normal rating due to bearing on connected material for section loss **Per AREMA T15-7-1, rivet bearing check disregarded without visible deformation of parts in contact, therefore rivet shear reported.

Long Bridge Load Capacity Analysis 8
Table 3 – Swing Truss Piers, Original Design Condition
Long Bridge-Swing Truss Span Substructure Cooper’ E-80 Stress Effects (Governing Members)
Member Description Check AREMA Group I* Allowables
AREMA Group I Allowable to Actual
Stress Ratio
AREMA Group III** Allowables
AREMA Group III Allowable to Actual Stress
Ratio Name (Location)
Member Type Construction Type
Type of Check Allowable Stress (psf)
Allowable Stress (psf)
Center Pier Caisson Concrete Soil Bearing Stress 8,000 1.09 > 1 : E-80 OK 12,000 0.83 < 1 : E-80 NG End Pier Caisson Concrete Soil Bearing Stress 7,500 1.10 > 1 : E-80 OK 11,300 0.89 < 1 : E-80 NG
*Gravity Loads
**Gravity plus Braking and wind loads

Page left blank intentionally.

Long Bridge Load Capacity Analysis 9
3.2 Through Girder Span Superstructure (Table 4 – As-Built; Table 5 – 1/16” Loss): The superstructure of the through girder span, designed in 1942, also rates less than Cooper’s E-80 loading, even in its original as-built condition. The controlling members are the stringers which rate 0.85 (E-68) in their as-built condition. It is noteworthy that the through girder spans were designed in 1942 for Cooper’s E-65 Loading. The rating for this member decreases about 0.10 for every 1/16” loss of the section, up to 3/16” loss. Assuming 1/16” section loss for the current condition, the current structure rates 0.75 (E-60). These latter ratings are at a Normal Rating level and for a 60 miles/hour train speed. At Maximum Rating for a 60 miles/hour speed, this member’s rating increases to 1.10 (E-88), for 1/16” section loss.
Recommendation: The structure does not have sufficient capacity for long-term service under the current loads. It is recommended that the controlling members and stringers be strengthened. Floor beams also need to be strengthened, but stringers have priority due to the lower rating. Reduced train speeds and more frequent inspections of all members are recommended.
Substructure (Table 6- As-Built): The substructure of a typical through girders span consists of a pier with 1904 timber piles and a pier with 1942 steel piles. Both timber and steel piles in their original as-built condition and under gravity loads have sufficient capacity for Cooper’s E-80 loading. The governing stress mode in this case is the stress in the pile. These piles lack sufficient capacity under longitudinal braking loads, especially the timber piles.
Recommendation: Underwater inspection of both steel and timber piles is recommended to determine the existing condition in order to confirm the reported rating, or modify the rating if the condition is different from the assumed condition. Reduced train speeds are recommended to decrease the braking force effects, especially on timber piles.

Page left blank intentionally.

Long Bridge Load Capacity Analysis 10
Table 4 – Through Girder, Original Design Condition
Long Bridge-Through Girder Span Superstructure Cooper E Ratings (Governing Members)
Member Description Check Normal Allowables
Normal (E-80 Rating Factor) E Rating
Maximum Allowables
Maximum (E-80 Rating Factor) E Rating
Name (Location)
Member Type Construction Type
Type of Check At Gross, Net, or Shear
Section
Allowable Stress (Psi)
60 m/h+ 25 m/h+ Allowable Stress (Psi)
60 m/h+ 25 m/h+
Stringer Beam Riveted Built-up Shear End Web 9,100 (0.85) E-68.0 (0.94) E-75.2 20,800*** (1.26) E-100.8 (1.39) E-111.2 Floor Beam Beam Riveted Built-up Flexure-T Mid-span Net 18,150 (0.87) E-69.6 (0.94) E-75.2 - - - Girder Beam Riveted Built-up Flexure-T Mid-span Net 18,150 (0.95) E-76.0 (1.03) E-82.4 - - - ***Flexure-T controls maximum ratings for stringer
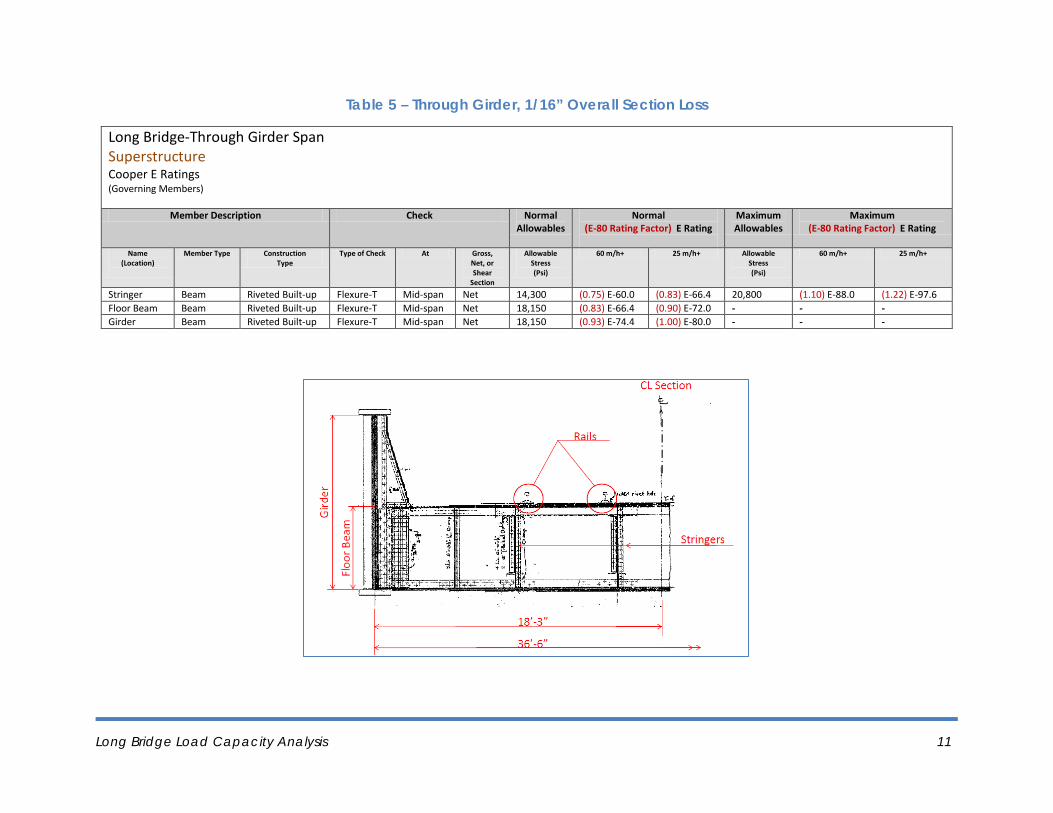
Long Bridge Load Capacity Analysis 11
Table 5 – Through Girder, 1/16” Overall Section Loss
Long Bridge-Through Girder Span Superstructure Cooper E Ratings (Governing Members)
Member Description Check Normal Allowables
Normal (E-80 Rating Factor) E Rating
Maximum Allowables
Maximum (E-80 Rating Factor) E Rating
Name (Location)
Member Type Construction Type
Type of Check At Gross, Net, or Shear
Section
Allowable Stress (Psi)
60 m/h+ 25 m/h+ Allowable Stress (Psi)
60 m/h+ 25 m/h+
Stringer Beam Riveted Built-up Flexure-T Mid-span Net 14,300 (0.75) E-60.0 (0.83) E-66.4 20,800 (1.10) E-88.0 (1.22) E-97.6 Floor Beam Beam Riveted Built-up Flexure-T Mid-span Net 18,150 (0.83) E-66.4 (0.90) E-72.0 - - - Girder Beam Riveted Built-up Flexure-T Mid-span Net 18,150 (0.93) E-74.4 (1.00) E-80.0 - - -

Long Bridge Load Capacity Analysis 12
Table 6 – Through Girder Piers, Original Design Condition
Long Bridge-Through Girder Span Substructure Cooper’ E-80 Stress Effects (Governing Members)
Member Description Check AREMA Group I* Allowables
AREMA Group I Allowable to Actual
Stress Ratio
AREMA Group III** Allowables
AREMA Group III Allowable to Actual Stress
Ratio Name (Location)
Member Type Construction Type
Type of Check Allowable Stress (psi)
Allowable Stress (psi)
Pier (Built 1904) Timber Pile Bearing Pile Axial Stress 800 1.04 > 1 : E-80 OK 1,000 0.32 < 1 : E-80 NG Pier (Built 1942) Steel Pile Bearing Pile Axial Stress 12,600 1.81 > 1 : E-80 OK 15,750 0.89 < 1 : E-80 NG
*Gravity Loads **Gravity plus Braking and wind loads

Page left blank intentionally.

Long Bridge Load Capacity Analysis 13
The Long Bridge capacity analysis and load rating results reported here have been conducted to the highest possible accuracy within the standards of the practice, based on certain assumed conditions for the bridge components in the absence of an inspection.

Page left blank intentionally.


DISTRICT DEPARTMENT OF TRANSPORTATION
LONG BRIDGE STUDYBridge Load Capacity Analysis
District Department of Transportation
Federal Railroad Administration
This material is based upon work supported by the Federal Railroad Administration under the Long Bridge Study American Recovery and Reinvestment Act of 2009 Grant dated December 9, 2011. Any opinions, findings, and conclusions or recommendations expressed in this publication are those of the author(s) and do not necessarily
reflect the view of the Federal Railroad Administration and/or the U.S. Department of Transportation.