Lonestar Resources US, Inc....2 Disclaimer and Forward‐Looking Statements Lonestar Resources US,...
19
Lonestar Resources US, Inc. Third Quarter 2019 Conference Call November 12, 2019
Transcript of Lonestar Resources US, Inc....2 Disclaimer and Forward‐Looking Statements Lonestar Resources US,...

Lonestar Resources US, Inc.Third Quarter 2019 Conference Call
November 12, 2019
2
Disclaimer and Forward‐Looking Statements
Lonestar Resources US, Inc. cautions that this presentation (including oral commentary that accompanies this presentation)contains forward-looking statements, including, but not limited to, statements about performance expectations related to ourassets and technical improvements made thereto; drilling and completion of wells; and other statements regarding ourbusiness strategy and operations. These statements involve substantial known and unknown risks, uncertainties and otherimportant factors that may cause our actual results, levels of activity, performance or achievements to be materially differentfrom the information expressed or implied by these forward-looking statements. These risks and uncertainties include, but arenot limited to, the following: volatility of oil, natural gas and NGL prices, and potential write-down of the carrying values ofcrude oil and natural gas properties; inability to successfully replace proved producing reserves; substantial capitalexpenditures required for exploration, development and exploitation projects; potential liabilities resulting from operatinghazards, natural disasters or other interruptions; risks related using the latest available horizontal drilling and completiontechniques; uncertainties tied to lengthy period of development of identified drilling locations; unexpected delays and costoverrun related to the development of estimated proved undeveloped reserves; concentration risk related to properties, whichare located primarily in the Eagle Ford Shale of South Texas; loss of lease on undeveloped leasehold acreage that may resultfrom lack of development or commercialization; inaccuracies in assumptions made in estimating proved reserves; our limitedcontrol over activities in properties Lonestar does not operate; potential inconsistency between the present value of future netrevenues from our proved reserves and the current market value of our estimated oil and natural gas reserves; risks related toderivative activities; losses resulting from title deficiencies; risks related to health, safety and environmental laws andregulations; additional regulation of hydraulic fracturing; reduced demand for crude oil, natural gas and NGLs resulting fromconservation measures and technological advances; inability to acquire adequate supplies of water for our drilling operationsor to dispose of or recycle the used water economically and in an environmentally safe manner; climate change laws andregulations restricting emissions of “greenhouse gases” that may increase operating costs and reduce demand for the crudeoil and natural gas; fluctuations in the differential between benchmark prices of crude oil and natural gas and the reference orregional index price used to price actual crude oil and natural gas sales; and the other important factors discussed under thecaption “Risk Factors” in our Annual Report on Form 10-K filed with the Securities and Exchange Commission, or the SEC, onMarch 13, 2019, as well as other documents that we may file from time to time with the SEC. We may not actually achieve theplans, intentions or expectations disclosed in our forward-looking statements, and you should not place undue reliance on ourforward-looking statements. Actual results or events could differ materially from the plans, intentions and expectationsdisclosed in the forward-looking statements we make. The forward-looking statements in this presentation represent our viewsas of the date of this presentation. We anticipate that subsequent events and developments will cause our views to change.However, while we may elect to update these forward-looking statements at some point in the future, we have no currentintention of doing so except to the extent required by applicable law. You should, therefore, not rely on these forward-lookingstatements as representing our views as of any date subsequent to the date of this presentation.
This presentation also contains estimates and other statistical data made by independent parties and by us relating to wellperformance, finding and development costs, recycle ratio and other data about our industry. This data involves a number ofassumptions and limitations, and you are cautioned not to give undue weight to such estimates. In addition, projections,assumptions and estimates of our future performance and the future performance of the markets in which we operate arenecessarily subject to a high degree of uncertainty and risk.
3
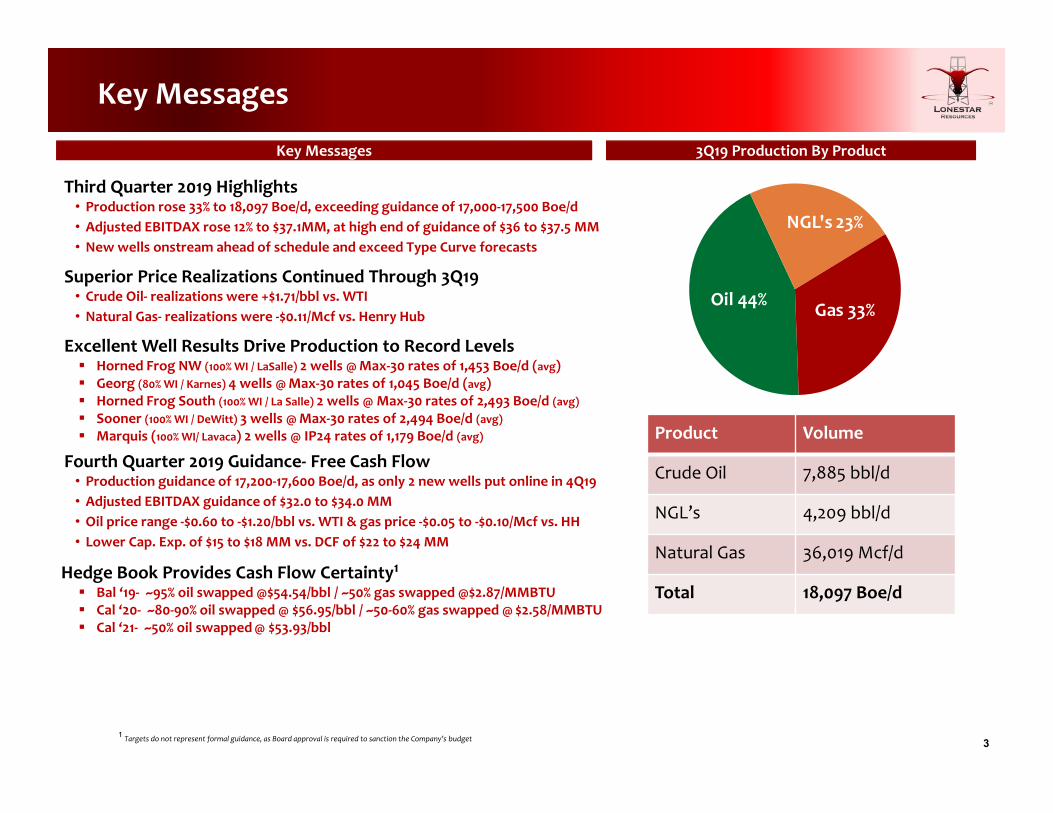
Oil 44%
NGL's 23%
Gas 33%
Key Messages
Third Quarter 2019 Highlights• Production rose 33% to 18,097 Boe/d, exceeding guidance of 17,000‐17,500 Boe/d• Adjusted EBITDAX rose 12% to $37.1MM, at high end of guidance of $36 to $37.5 MM• New wells onstream ahead of schedule and exceed Type Curve forecasts
Superior Price Realizations Continued Through 3Q19• Crude Oil‐ realizations were +$1.71/bbl vs. WTI• Natural Gas‐ realizations were ‐$0.11/Mcf vs. Henry Hub
Excellent Well Results Drive Production to Record Levels Horned Frog NW (100% WI / LaSalle) 2 wells @ Max‐30 rates of 1,453 Boe/d (avg) Georg (80% WI / Karnes) 4 wells @ Max‐30 rates of 1,045 Boe/d (avg) Horned Frog South (100% WI / La Salle) 2 wells @ Max‐30 rates of 2,493 Boe/d (avg) Sooner (100% WI / DeWitt) 3 wells @ Max‐30 rates of 2,494 Boe/d (avg) Marquis (100% WI/ Lavaca) 2 wells @ IP24 rates of 1,179 Boe/d (avg)
Fourth Quarter 2019 Guidance‐ Free Cash Flow• Production guidance of 17,200‐17,600 Boe/d, as only 2 new wells put online in 4Q19• Adjusted EBITDAX guidance of $32.0 to $34.0 MM• Oil price range ‐$0.60 to ‐$1.20/bbl vs. WTI & gas price ‐$0.05 to ‐$0.10/Mcf vs. HH• Lower Cap. Exp. of $15 to $18 MM vs. DCF of $22 to $24 MM
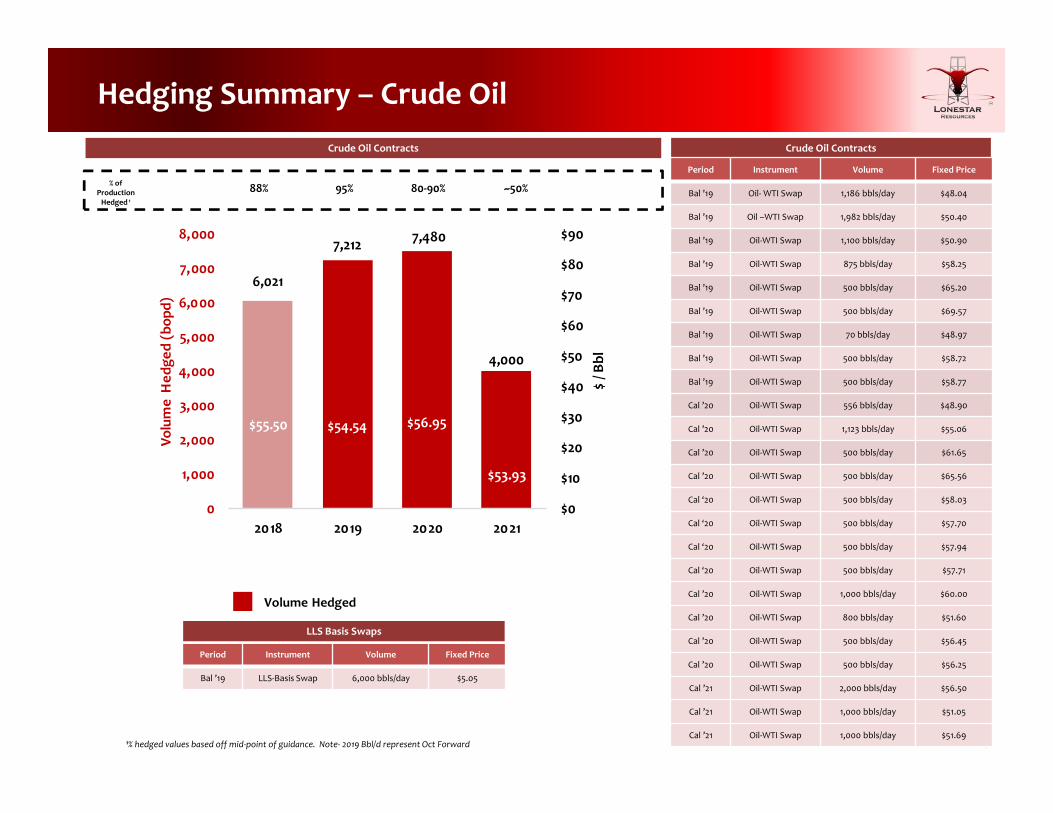
Hedge Book Provides Cash Flow Certainty1 Bal ‘19‐ ~95% oil swapped @$54.54/bbl / ~50% gas swapped @$2.87/MMBTU Cal ‘20‐ ~80‐90% oil swapped @ $56.95/bbl / ~50‐60% gas swapped @ $2.58/MMBTU Cal ‘21‐ ~50% oil swapped@ $53.93/bbl
3Q19 Production By Product3Q19 Production By Product
Product Volume
Crude Oil 7,885 bbl/d
NGL’s 4,209 bbl/d
Natural Gas 36,019 Mcf/d
Total 18,097 Boe/d
Key MessagesKey Messages
1 Targets do not represent formal guidance, as Board approval is required to sanction the Company’s budget
4
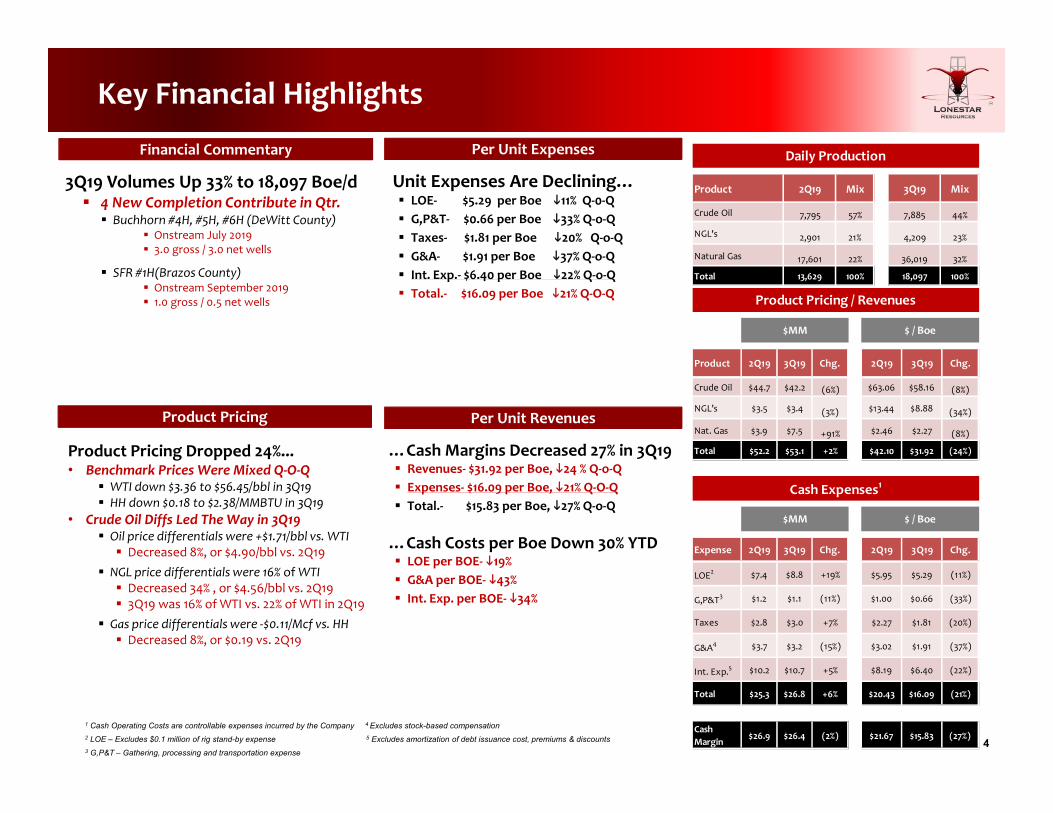
Unit Expenses Are Declining… LOE‐ $5.29 per Boe 11% Q‐0‐Q G,P&T‐ $0.66 per Boe 33% Q‐o‐Q Taxes‐ $1.81 per Boe 20% Q‐o‐Q G&A‐ $1.91 per Boe 37% Q‐o‐Q Int. Exp.‐ $6.40 per Boe 22% Q‐o‐Q Total.‐ $16.09 per Boe 21% Q‐O‐Q
Key Financial Highlights
3Q19 Volumes Up 33% to 18,097 Boe/d 4 New Completion Contribute in Qtr. Buchhorn #4H, #5H, #6H (DeWitt County)
Onstream July 2019 3.0 gross / 3.0 net wells
SFR #1H(Brazos County) Onstream September 2019 1.0 gross / 0.5 net wells
Financial Commentary
…Cash Margins Decreased 27% in 3Q19 Revenues‐ $31.92 per Boe, 24 % Q‐o‐Q Expenses‐ $16.09 per Boe, 21% Q‐O‐Q Total.‐ $15.83 per Boe, 27% Q‐o‐Q
…Cash Costs per Boe Down 30% YTD LOE per BOE‐ 19% G&A per BOE‐ 43% Int. Exp. per BOE‐ 34%
Product Pricing Dropped 24%... • Benchmark Prices Were Mixed Q‐O‐Q
WTI down $3.36 to $56.45/bbl in 3Q19 HH down $0.18 to $2.38/MMBTU in 3Q19
• Crude Oil Diffs Led The Way in 3Q19 Oil price differentials were +$1.71/bbl vs. WTI Decreased 8%, or $4.90/bbl vs. 2Q19
NGL price differentials were 16% of WTI Decreased 34% , or $4.56/bbl vs. 2Q19 3Q19 was 16% of WTI vs. 22% of WTI in 2Q19
Gas price differentials were ‐$0.11/Mcf vs. HH Decreased 8%, or $0.19 vs. 2Q19
Per Unit Expenses
Product Pricing Per Unit Revenues
1 Cash Operating Costs are controllable expenses incurred by the Company 4 Excludes stock-based compensation 2 LOE – Excludes $0.1 million of rig stand-by expense 5 Excludes amortization of debt issuance cost, premiums & discounts3 G,P&T – Gathering, processing and transportation expense
Product 2Q19 Mix 3Q19 Mix
Crude Oil 7,795 57% 7,885 44%
NGL's 2,901 21% 4,209 23%
Natural Gas 17,601 22% 36,019 32%
Total 13,629 100% 18,097 100%
Daily Production
Product 2Q19 3Q19 Chg. 2Q19 3Q19 Chg.
Crude Oil $44.7 $42.2 (6%) $63.06 $58.16 (8%)
NGL’s $3.5 $3.4 (3%) $13.44 $8.88 (34%)
Nat. Gas $3.9 $7.5 +91% $2.46 $2.27 (8%)
Total $52.2 $53.1 +2% $42.10 $31.92 (24%)
Expense 2Q19 3Q19 Chg. 2Q19 3Q19 Chg.
LOE2 $7.4 $8.8 +19% $5.95 $5.29 (11%)
G,P&T3 $1.2 $1.1 (11%) $1.00 $0.66 (33%)
Taxes $2.8 $3.0 +7% $2.27 $1.81 (20%)
G&A4 $3.7 $3.2 (15%) $3.02 $1.91 (37%)
Int. Exp.5 $10.2 $10.7 +5% $8.19 $6.40 (22%)
Total $25.3 $26.8 +6% $20.43 $16.09 (21%)
Cash Margin
$26.9 $26.4 (2%) $21.67 $15.83 (27%)
$MM $ / Boe
Product Pricing / Revenues
$MM $ / Boe
Cash Expenses1
5
Horned Frog Northwest (La Salle County)
Horned Frog NW vs Type Curve Horned Frog NW 210 Day Analysis
Horned Frog NW HighlightsHorned Frog NW Activity Map
LegendEagle Ford2019 WellsAustin Chalk LONE Acreage
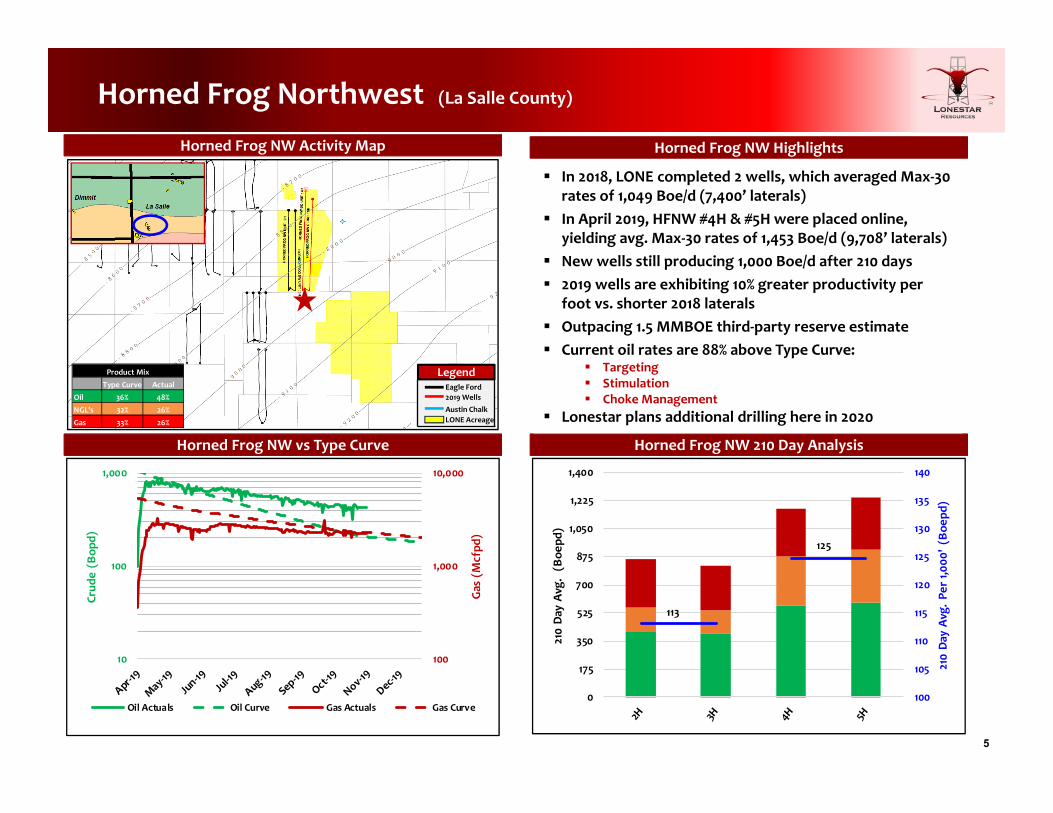
In 2018, LONE completed 2 wells, which averaged Max‐30 rates of 1,049 Boe/d (7,400’ laterals)
In April 2019, HFNW #4H & #5H were placed online, yielding avg. Max‐30 rates of 1,453 Boe/d (9,708’ laterals)
New wells still producing 1,000 Boe/d after 210 days 2019 wells are exhibiting 10% greater productivity per
foot vs. shorter 2018 laterals Outpacing 1.5 MMBOE third‐party reserve estimate Current oil rates are 88% above Type Curve:
Targeting Stimulation Choke Management
Lonestar plans additional drilling here in 2020
113
125
100
105
110
115
120
125
130
135
140
0
175
350
525
700
875
1,050
1,225
1,400
210 Da
y Avg
. Pe
r 1,0
00' (B
oepd
)
210 Da
y Avg
. (Boe
pd)
100
1,000
10,000
10
100
1,000Gas (Mcfpd
)
Crud
e (B
opd)
Oil Actuals Oil Curve Gas Actuals Gas Curve
Type Curve ActualOil 36% 48%NGL's 32% 26%
Gas 33% 26%
Product Mix
6
0
200
400
600
800
1,000
1,200
1,400
1,600
1,800
2,000
0
50
100
150
200
250
300
350
400
450
Oct‐18
Nov‐18
Dec‐18
Jan‐19
Feb‐19
Mar‐19
Apr‐19
May‐19
Jun‐19
Jul‐19
Aug‐19
Sep‐19
Oct‐19
Nov‐19
Nat Gas (Mcfpd
)
Oil (B
opd)
Oil Curve Oil Actuals Gas Curve Gas Actuals
Horned Frog Northwest (No Problem Child!!)
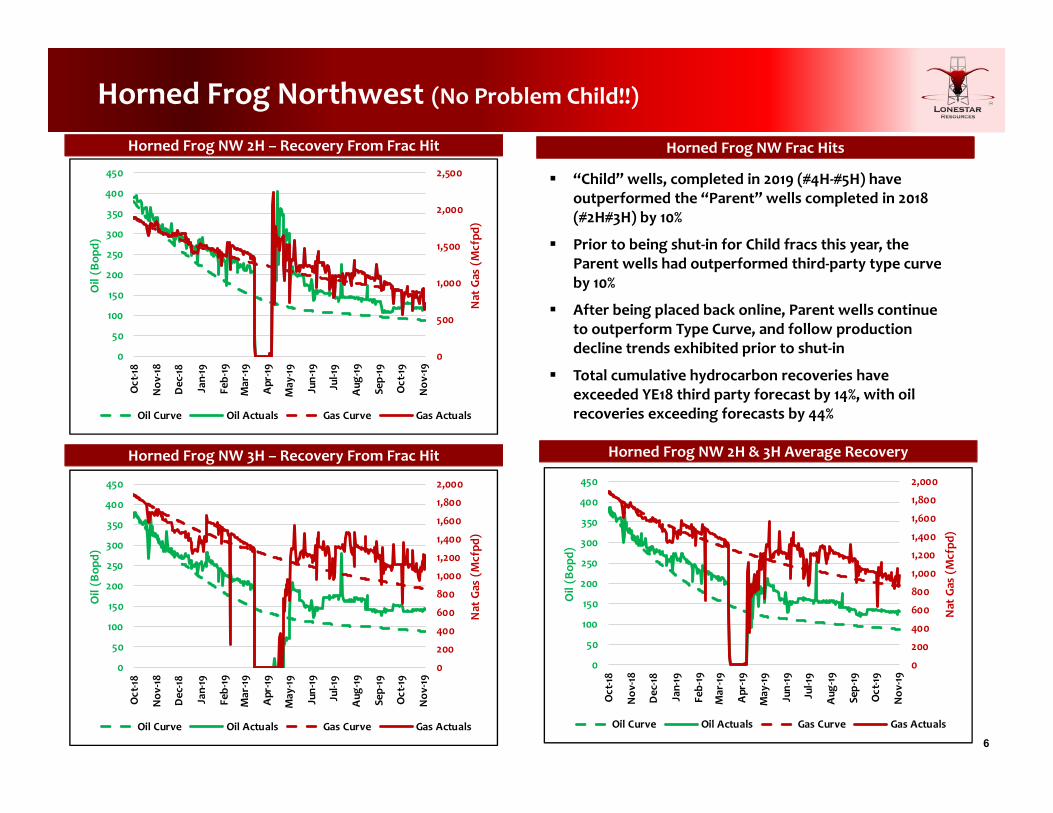
“Child” wells, completed in 2019 (#4H‐#5H) have outperformed the “Parent” wells completed in 2018 (#2H#3H) by 10%
Prior to being shut‐in for Child fracs this year, the Parent wells had outperformed third‐party type curve by 10%
After being placed back online, Parent wells continue to outperform Type Curve, and follow production decline trends exhibited prior to shut‐in
Total cumulative hydrocarbon recoveries have exceeded YE18 third party forecast by 14%, with oil recoveries exceeding forecasts by 44%
Horned Frog NW Frac HitsHorned Frog NW 2H – Recovery From Frac Hit
Horned Frog NW 3H – Recovery From Frac Hit Horned Frog NW 2H & 3H Average Recovery
0
500
1,000
1,500
2,000
2,500
0
50
100
150
200
250
300
350
400
450
Oct‐18
Nov‐18
Dec‐18
Jan‐19
Feb‐19
Mar‐19
Apr‐19
May‐19
Jun‐19
Jul‐19
Aug‐19
Sep‐19
Oct‐19
Nov‐19
Nat Gas (Mcfpd
)
Oil (B
opd)
Oil Curve Oil Actuals Gas Curve Gas Actuals
0
200
400
600
800
1,000
1,200
1,400
1,600
1,800
2,000
0
50
100
150
200
250
300
350
400
450
Oct‐18
Nov‐18
Dec‐18
Jan‐19
Feb‐19
Mar‐19
Apr‐19
May‐19
Jun‐19
Jul‐19
Aug‐19
Sep‐19
Oct‐19
Nov‐19
Nat Gas (Mcfpd
)
Oil (B
opd)
Oil Curve Oil Actuals Gas Curve Gas Actuals
7
Karnes County
Georg 3H‐6H Actuals vs. Type Curve
GEORG #3H‐#6HPlaced into flowback May
2019
Karnes County 150 Day Analysis
Karnes County HighlightsKarnes Co. Activity Map
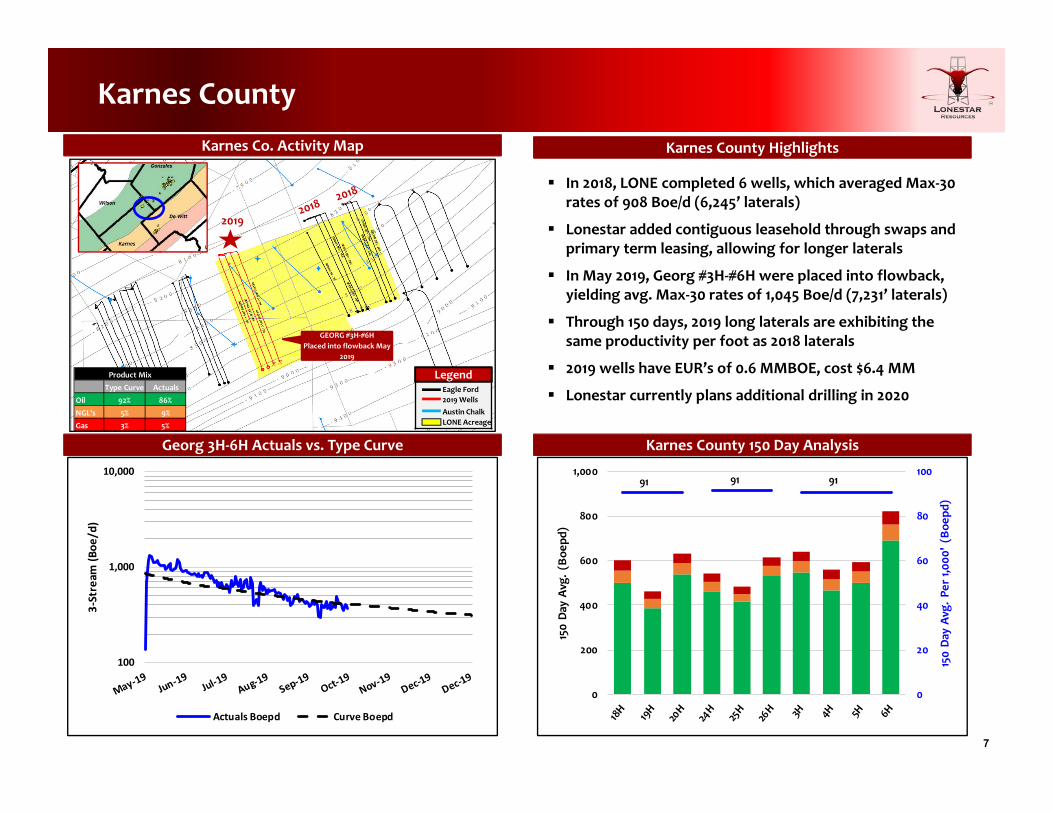
In 2018, LONE completed 6 wells, which averaged Max‐30 rates of 908 Boe/d (6,245’ laterals)
Lonestar added contiguous leasehold through swaps and primary term leasing, allowing for longer laterals
In May 2019, Georg #3H‐#6H were placed into flowback, yielding avg. Max‐30 rates of 1,045 Boe/d (7,231’ laterals)
Through 150 days, 2019 long laterals are exhibiting the same productivity per foot as 2018 laterals
2019 wells have EUR’s of 0.6 MMBOE, cost $6.4 MM
Lonestar currently plans additional drilling in 2020Legend
Eagle Ford2019 WellsAustin Chalk LONE Acreage
91 91 91
0
20
40
60
80
100
0
200
400
600
800
1,000
150 Da
y Av
g. P
er 1,00
0' (Bo
epd)
150 Da
y Av
g. (Bo
epd)
Type Curve Actuals
Oil 92% 86%
NGL's 5% 9%
Gas 3% 5%
Product Mix
100
1,000
10,000
3‐Stream
(Boe
/d)
Actuals Boepd Curve Boepd
2019
8
100
1,000
10,000
100
1,000
10,000Gas (Mcfpd
)
Oil (B
opd)
Oil Actuals Oil Curve Gas Actuals Gas Curve
141
175 177
100
120
140
160
180
200
0
500
1,000
1,500
2,000
2,500
A1H B1H G1H H1H FA1H FB1H
120 Da
y Av
g.Bo
epd Pe
r 1,0
00'
120 Day A
vg. B
oepd
Horned Frog South (La Salle County)
Horned Frog F Pad Wells Outperforming Type Curve Horned Frog South 120 Day Analysis
Horned Frog South HighlightsHorned Frog South Activity Map
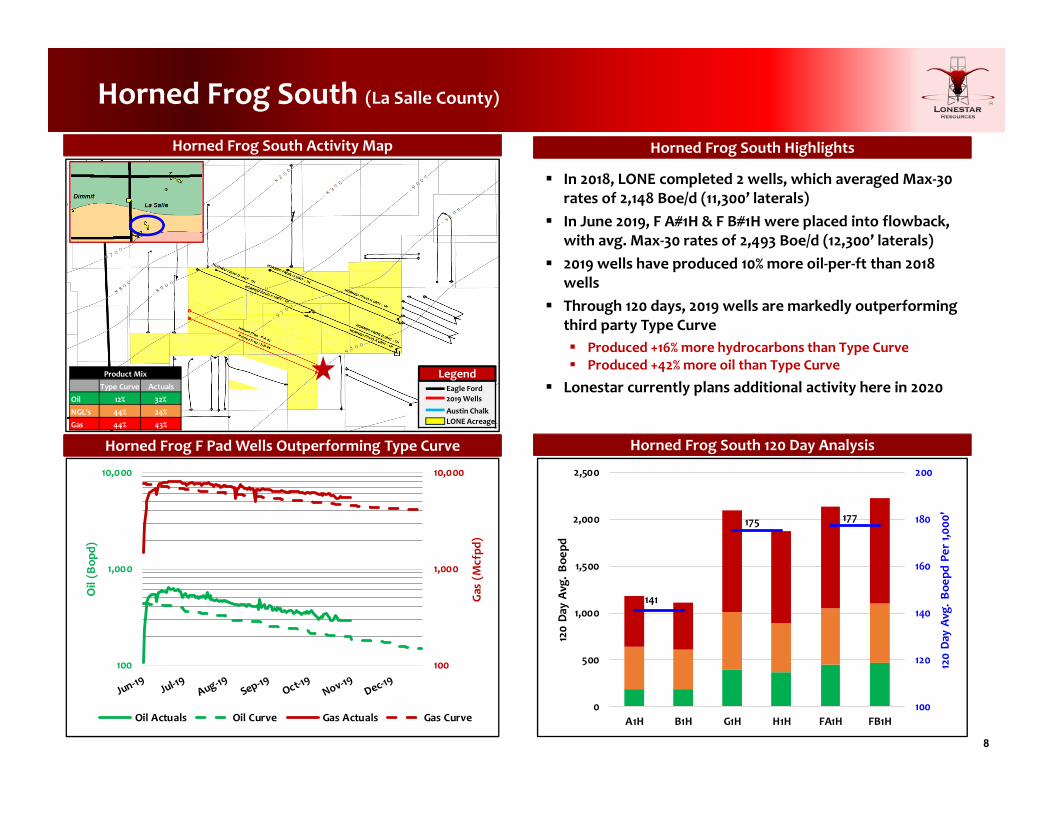
In 2018, LONE completed 2 wells, which averaged Max‐30 rates of 2,148 Boe/d (11,300’ laterals)
In June 2019, F A#1H & F B#1H were placed into flowback, with avg. Max‐30 rates of 2,493 Boe/d (12,300’ laterals)
2019 wells have produced 10% more oil‐per‐ft than 2018 wells
Through 120 days, 2019 wells are markedly outperforming third party Type Curve Produced +16% more hydrocarbons than Type Curve Produced +42% more oil than Type Curve
Lonestar currently plans additional activity here in 2020Legend
Eagle Ford2019 WellsAustin Chalk LONE Acreage
Type Curve Actuals
Oil 12% 32%
NGL's 44% 24%
Gas 44% 43%
Product Mix
9
Sooner (De Witt County)
Geoscience and Leasing Extend Operated Lateral Lengths Sooner Buchhorn #4H‐#6H vs. Offsets
Sooner HighlightsSooner Activity Map
0
1,000
2,000
3,000
4,000
5,000
6,000
7,000
8,000
1H 2H 3H 4H 20H
21H
22H
23H
24H
25H
26H
17H
16H
18H
19H
11H 5H 5H 6H 12H 4H 13H 6H 7H 14H
15H
Late
ral L
engt
h (Ft)
Well
LegendEagle Ford2019 WellsAustin Chalk LONE Acreage
0
500
1,000
1,500
2,000
2,500
3,000
3,500
1 61 121 181 241 301 361
3‐St
ream
Pro
duction
(Boe
/d)
Days On Production
Buchhorn Actuals WDVG Curve
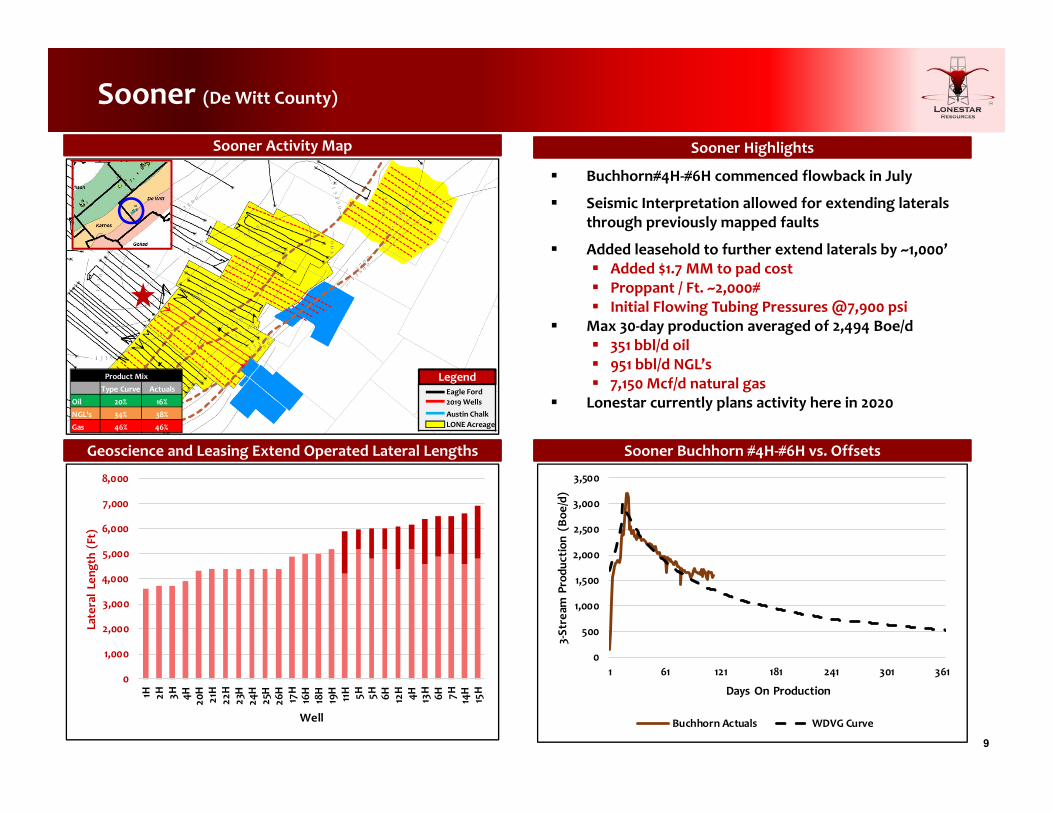
Buchhorn#4H‐#6H commenced flowback in July
Seismic Interpretation allowed for extending laterals through previously mapped faults
Added leasehold to further extend laterals by ~1,000’ Added $1.7 MM to pad cost Proppant / Ft. ~2,000# Initial Flowing Tubing Pressures @7,900 psi
Max 30‐day production averaged of 2,494 Boe/d 351 bbl/d oil 951 bbl/d NGL’s 7,150 Mcf/d natural gas
Lonestar currently plans activity here in 2020Type Curve Actuals
Oil 20% 16%
NGL's 34% 38%
Gas 46% 46%
Product Mix
10
Marquis (Fayette County)
Proved & Probable Location Inventory
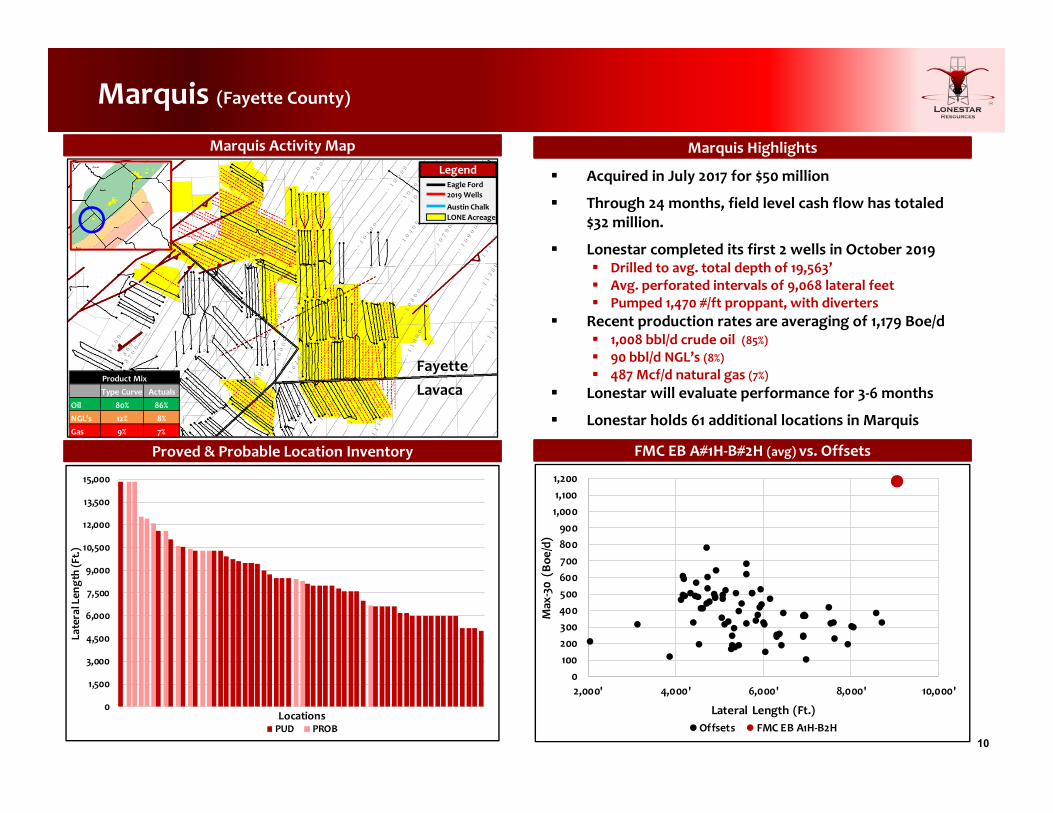
Acquired in July 2017 for $50 million
Through 24 months, field level cash flow has totaled $32 million.
Lonestar completed its first 2 wells in October 2019 Drilled to avg. total depth of 19,563’ Avg. perforated intervals of 9,068 lateral feet Pumped 1,470 #/ft proppant, with diverters
Recent production rates are averaging of 1,179 Boe/d 1,008 bbl/d crude oil (85%) 90 bbl/d NGL’s (8%) 487 Mcf/d natural gas (7%)
Lonestar will evaluate performance for 3‐6 months
Lonestar holds 61 additional locations in Marquis
FMC EB A#1H‐B#2H (avg) vs. Offsets
Marquis HighlightsMarquis Activity Map
0100200300400500600700800900
1,0001,1001,200
2,000' 4,000' 6,000' 8,000' 10,000'
Max‐30
(Boe
/d)
Lateral Length (Ft.)Offsets FMC EB A1H‐B2H
FayetteLavaca
LegendEagle Ford2019 WellsAustin Chalk LONE Acreage
Type Curve Actuals
Oil 80% 86%NGL's 12% 8%Gas 9% 7%
Product Mix
0
1,500
3,000
4,500
6,000
7,500
9,000
10,500
12,000
13,500
15,000
Latera
l Len
gth (Ft.)
LocationsPUD PROB
11
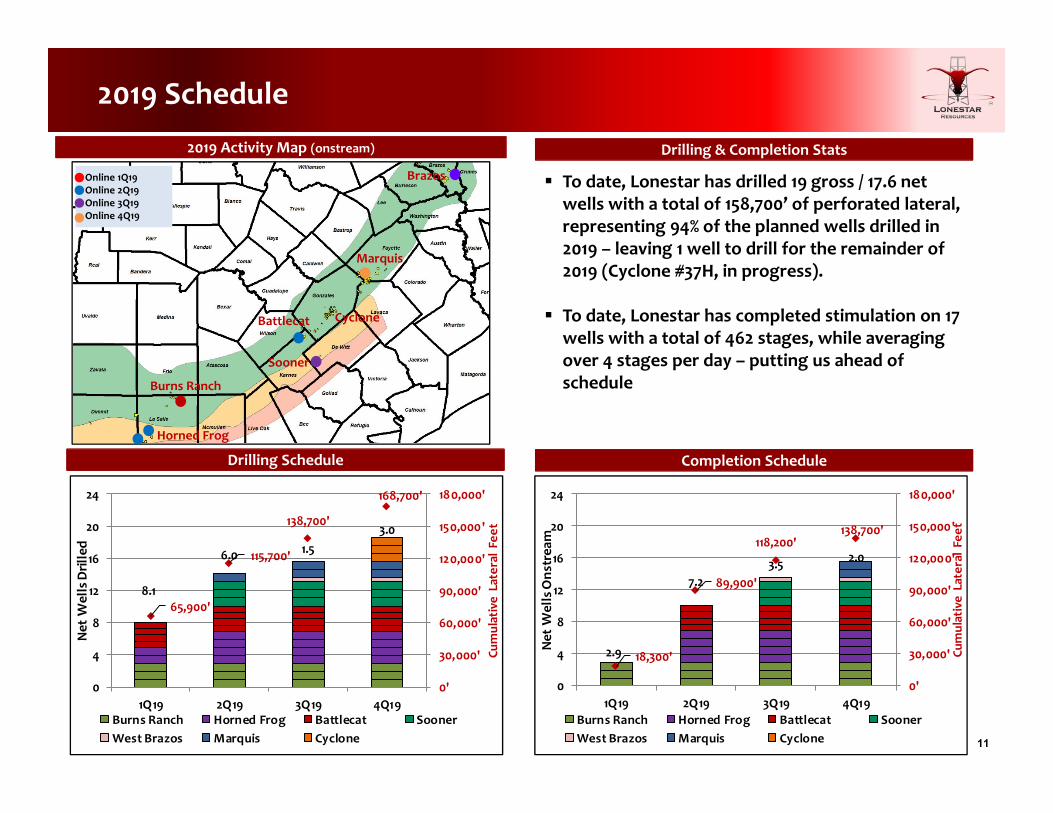
2019 Schedule
Drilling & Completion Stats
Completion Schedule
2019 Activity Map (onstream)
Horned Frog
Burns Ranch
Sooner
Battlecat Cyclone
Marquis
BrazosOnline 1Q19Online 2Q19Online 3Q19Online 4Q19
To date, Lonestar has drilled 19 gross / 17.6 net wells with a total of 158,700’ of perforated lateral, representing 94% of the planned wells drilled in 2019 – leaving 1 well to drill for the remainder of 2019 (Cyclone #37H, in progress).
To date, Lonestar has completed stimulation on 17 wells with a total of 462 stages, while averaging over 4 stages per day – putting us ahead of schedule
Drilling Schedule
8.1
6.0 1.53.0
65,900'
115,700'
138,700'
168,700'
0'
30,000'
60,000'
90,000'
120,000'
150,000'
180,000'
0
4
8
12
16
20
24
1Q19 2Q19 3Q19 4Q19
Cumulative
Late
ral Fe
et
Net W
ells Drilled
Burns Ranch Horned Frog Battlecat SoonerWest Brazos Marquis Cyclone
2.9
7.23.5 2.0
18,300'
89,900'
118,200'138,700'
0'
30,000'
60,000'
90,000'
120,000'
150,000'
180,000'
0
4
8
12
16
20
24
1Q19 2Q19 3Q19 4Q19
Cumulative
Late
ral Fe
et
Net W
ells Ons
trea
m
Burns Ranch Horned Frog Battlecat SoonerWest Brazos Marquis Cyclone
12
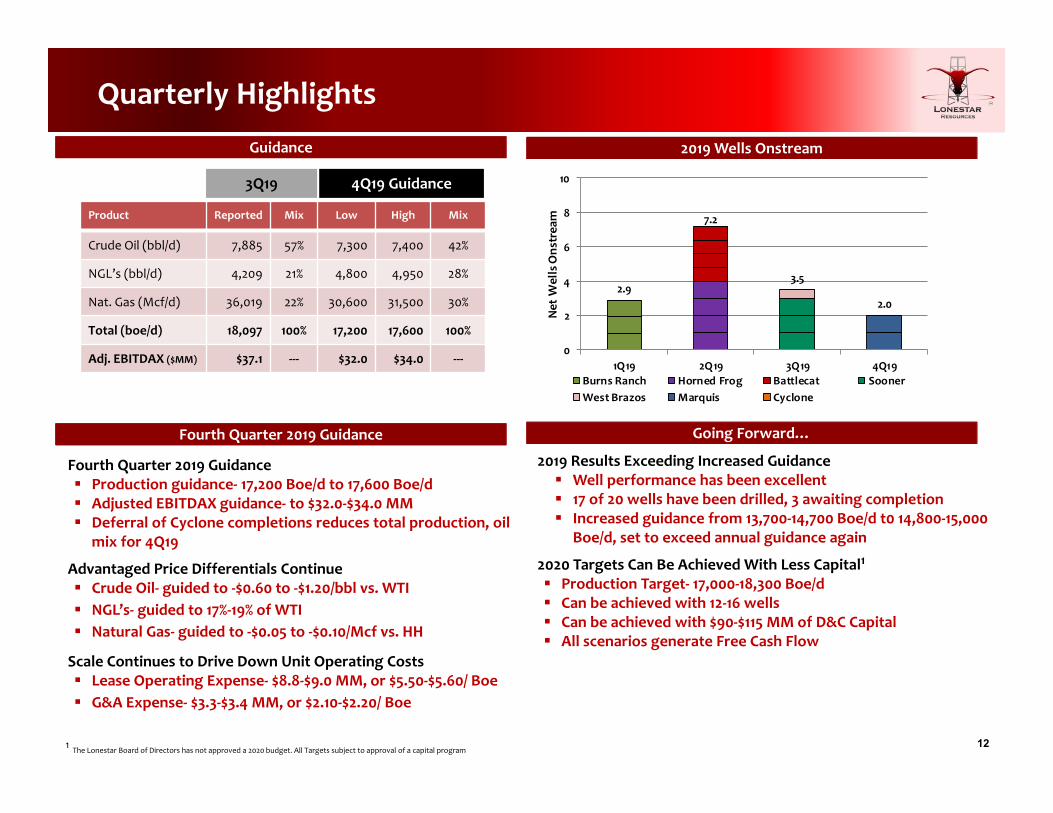
Product Reported Mix Low High Mix
Crude Oil (bbl/d) 7,885 57% 7,300 7,400 42%
NGL’s (bbl/d) 4,209 21% 4,800 4,950 28%
Nat. Gas (Mcf/d) 36,019 22% 30,600 31,500 30%
Total (boe/d) 18,097 100% 17,200 17,600 100%
Adj. EBITDAX ($MM) $37.1 ‐‐‐ $32.0 $34.0 ‐‐‐
Quarterly Highlights
3Q19 4Q19 Guidance
Guidance 2019 Wells Onstream
2019 Results Exceeding Increased Guidance Well performance has been excellent 17 of 20 wells have been drilled, 3 awaiting completion Increased guidance from 13,700‐14,700 Boe/d t0 14,800‐15,000
Boe/d, set to exceed annual guidance again
2020 Targets Can Be Achieved With Less Capital1
Production Target‐ 17,000‐18,300 Boe/d Can be achieved with 12‐16 wells Can be achieved with $90‐$115 MM of D&C Capital All scenarios generate Free Cash Flow
Fourth Quarter 2019 Guidance Production guidance‐ 17,200 Boe/d to 17,600 Boe/d Adjusted EBITDAX guidance‐ to $32.0‐$34.0 MM Deferral of Cyclone completions reduces total production, oil
mix for 4Q19
Advantaged Price Differentials Continue Crude Oil‐ guided to ‐$0.60 to ‐$1.20/bbl vs. WTI NGL’s‐ guided to 17%‐19% of WTI Natural Gas‐ guided to ‐$0.05 to ‐$0.10/Mcf vs. HH
Scale Continues to Drive Down Unit Operating Costs Lease Operating Expense‐ $8.8‐$9.0 MM, or $5.50‐$5.60/ Boe G&A Expense‐ $3.3‐$3.4 MM, or $2.10‐$2.20/ Boe
Fourth Quarter 2019 Guidance Going Forward…
1 The Lonestar Board of Directors has not approved a 2020 budget. All Targets subject to approval of a capital program
2.9
7.2
3.5
2.0
0
2
4
6
8
10
1Q19 2Q19 3Q19 4Q19
Net W
ells Ons
trea
m
Burns Ranch Horned Frog Battlecat SoonerWest Brazos Marquis Cyclone
Lonestar Resources US, Inc.Appendix
14
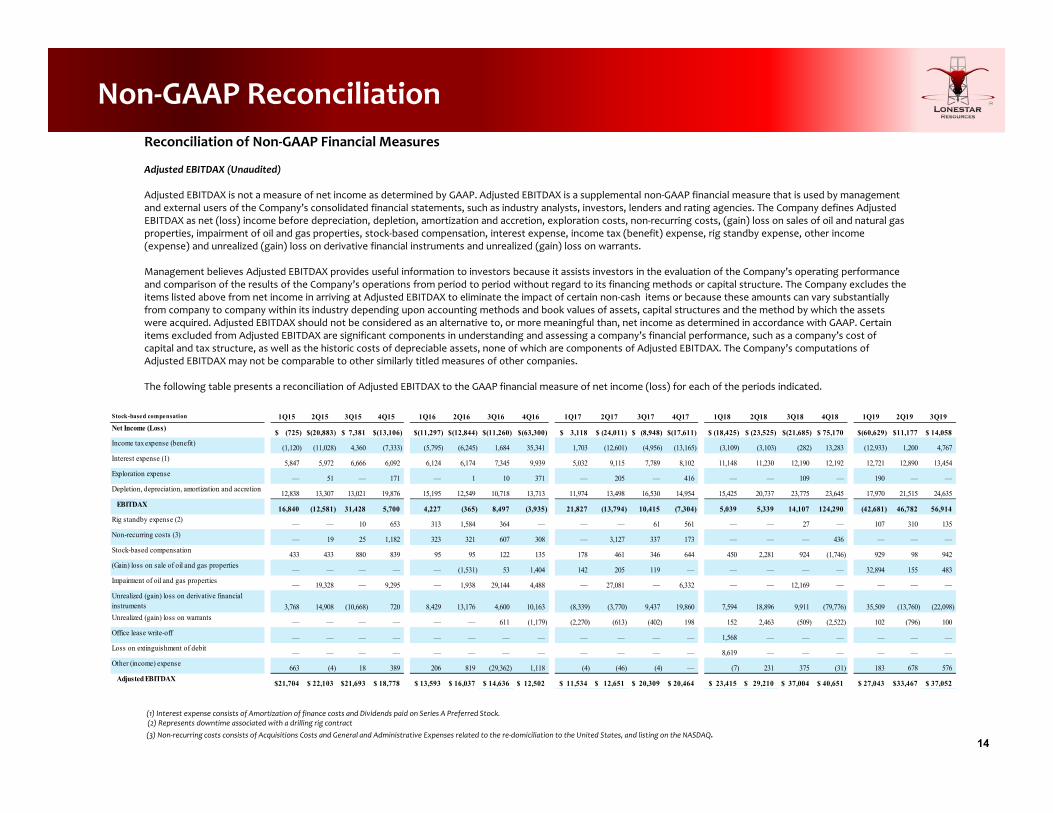
Non‐GAAP ReconciliationReconciliation of Non‐GAAP Financial Measures
Adjusted EBITDAX (Unaudited)
Adjusted EBITDAX is not a measure of net income as determined by GAAP. Adjusted EBITDAX is a supplemental non‐GAAP financial measure that is used by management and external users of the Company’s consolidated financial statements, such as industry analysts, investors, lenders and rating agencies. The Company defines Adjusted EBITDAX as net (loss) income before depreciation, depletion, amortization and accretion, exploration costs, non‐recurring costs, (gain) loss on sales of oil and natural gas properties, impairment of oil and gas properties, stock‐based compensation, interest expense, income tax (benefit) expense, rig standby expense, other income (expense) and unrealized (gain) loss on derivative financial instruments and unrealized (gain) loss on warrants.
Management believes Adjusted EBITDAX provides useful information to investors because it assists investors in the evaluation of the Company’s operating performance and comparison of the results of the Company’s operations from period to period without regard to its financing methods or capital structure. The Company excludes the items listed above from net income in arriving at Adjusted EBITDAX to eliminate the impact of certain non‐cash items or because these amounts can vary substantially from company to company within its industry depending upon accounting methods and book values of assets, capital structures and the method by which the assets were acquired. Adjusted EBITDAX should not be considered as an alternative to, or more meaningful than, net income as determined in accordance with GAAP. Certain items excluded from Adjusted EBITDAX are significant components in understanding and assessing a company’s financial performance, such as a company’s cost of capital and tax structure, as well as the historic costs of depreciable assets, none of which are components of Adjusted EBITDAX. The Company’s computations of Adjusted EBITDAX may not be comparable to other similarly titled measures of other companies.
The following table presents a reconciliation of Adjusted EBITDAX to the GAAP financial measure of net income (loss) for each of the periods indicated.
(1) Interest expense consists of Amortization of finance costs and Dividends paid on Series A Preferred Stock.(2) Represents downtime associated with a drilling rig contract(3) Non‐recurring costs consists of Acquisitions Costs and General and Administrative Expenses related to the re‐domiciliation to the United States, and listing on the NASDAQ.
Stock-based compensation 1Q15 2Q15 3Q15 4Q15 1Q16 2Q16 3Q16 4Q16 1Q17 2Q17 3Q17 4Q17 1Q18 2Q18 3Q18 4Q18 1Q19 2Q19 3Q19Net Income (Loss) (725)$ (20,883)$ 7,381$ (13,106)$ (11,297)$ (12,844)$ (11,260)$ (63,300)$ 3,118$ (24,011)$ (8,948)$ (17,611)$ (18,425)$ (23,525)$ (21,685)$ 75,170$ (60,629)$ 11,177$ 14,058$ Income tax expense (benefit) (1,120) (11,028) 4,360 (7,333) (5,795) (6,245) 1,684 35,341 1,703 (12,601) (4,956) (13,165) (3,109) (3,103) (282) 13,283 (12,933) 1,200 4,767Interest expense (1) 5,847 5,972 6,666 6,092 6,124 6,174 7,345 9,939 5,032 9,115 7,789 8,102 11,148 11,230 12,190 12,192 12,721 12,890 13,454Exploration expense — 51 — 171 — 1 10 371 — 205 — 416 — — 109 — 190 — —Depletion, depreciation, amortization and accretion 12,838 13,307 13,021 19,876 15,195 12,549 10,718 13,713 11,974 13,498 16,530 14,954 15,425 20,737 23,775 23,645 17,970 21,515 24,635
EBITDAX 16,840 (12,581) 31,428 5,700 4,227 (365) 8,497 (3,935) 21,827 (13,794) 10,415 (7,304) 5,039 5,339 14,107 124,290 (42,681) 46,782 56,914Rig standby expense (2) — — 10 653 313 1,584 364 — — — 61 561 — — 27 — 107 310 135Non-recurring costs (3) — 19 25 1,182 323 321 607 308 — 3,127 337 173 — — — 436 — — —Stock-based compensation 433 433 880 839 95 95 122 135 178 461 346 644 450 2,281 924 (1,746) 929 98 942(Gain) loss on sale of oil and gas properties — — — — — (1,531) 53 1,404 142 205 119 — — — — — 32,894 155 483Impairment of oil and gas properties — 19,328 — 9,295 — 1,938 29,144 4,488 — 27,081 — 6,332 — — 12,169 — — — —Unrealized (gain) loss on derivative financial instruments 3,768 14,908 (10,668) 720 8,429 13,176 4,600 10,163 (8,339) (3,770) 9,437 19,860 7,594 18,896 9,911 (79,776) 35,509 (13,760) (22,098)Unrealized (gain) loss on warrants — — — — — — 611 (1,179) (2,270) (613) (402) 198 152 2,463 (509) (2,522) 102 (796) 100Office lease write-off — — — — — — — — — — — — 1,568 — — — — — —Loss on extinguishment of debit — — — — — — — — — — — — 8,619 — — — — — —Other (income) expense 663 (4) 18 389 206 819 (29,362) 1,118 (4) (46) (4) — (7) 231 375 (31) 183 678 576
Adjusted EBITDAX 21,704$ 22,103$ 21,693$ 18,778$ 13,593$ 16,037$ 14,636$ 12,502$ 11,534$ 12,651$ 20,309$ 20,464$ 23,415$ 29,210$ 37,004$ 40,651$ 27,043$ 33,467$ 37,052$
15
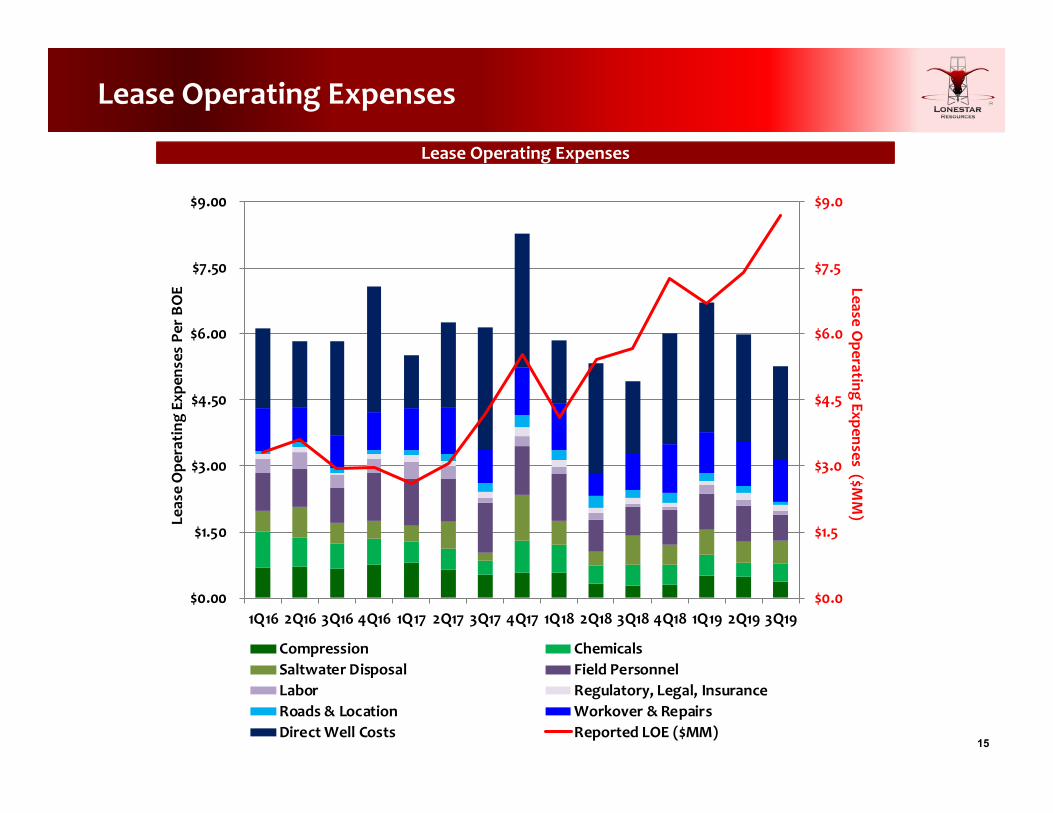
Lease Operating Expenses
Lease Operating ExpensesLease Operating Expenses
$0.0
$1.5
$3.0
$4.5
$6.0
$7.5
$9.0
$0.00
$1.50
$3.00
$4.50
$6.00
$7.50
$9.00
1Q16 2Q16 3Q16 4Q16 1Q17 2Q17 3Q17 4Q17 1Q18 2Q18 3Q18 4Q18 1Q19 2Q19 3Q19
Lease Operating Expenses ($M
M)
Leas
e Ope
rating Exp
ense
s Pe
r BOE
Compression ChemicalsSaltwater Disposal Field PersonnelLabor Regulatory, Legal, InsuranceRoads & Location Workover & RepairsDirect Well Costs Reported LOE ($MM)
16
0
2,000
4,000
6,000
8,000
10,000
12,000
14,000
16,000
18,000
Prod
uction (Bo
e/d)
Western EFS Central EFS Eastern EFS Conventional
‐
2,000
4,000
6,000
8,000
10,000
12,000
14,000
16,000
18,000
Prod
uction (Boe
/d)
Crude Oil Natural Gas Liquids Natural Gas
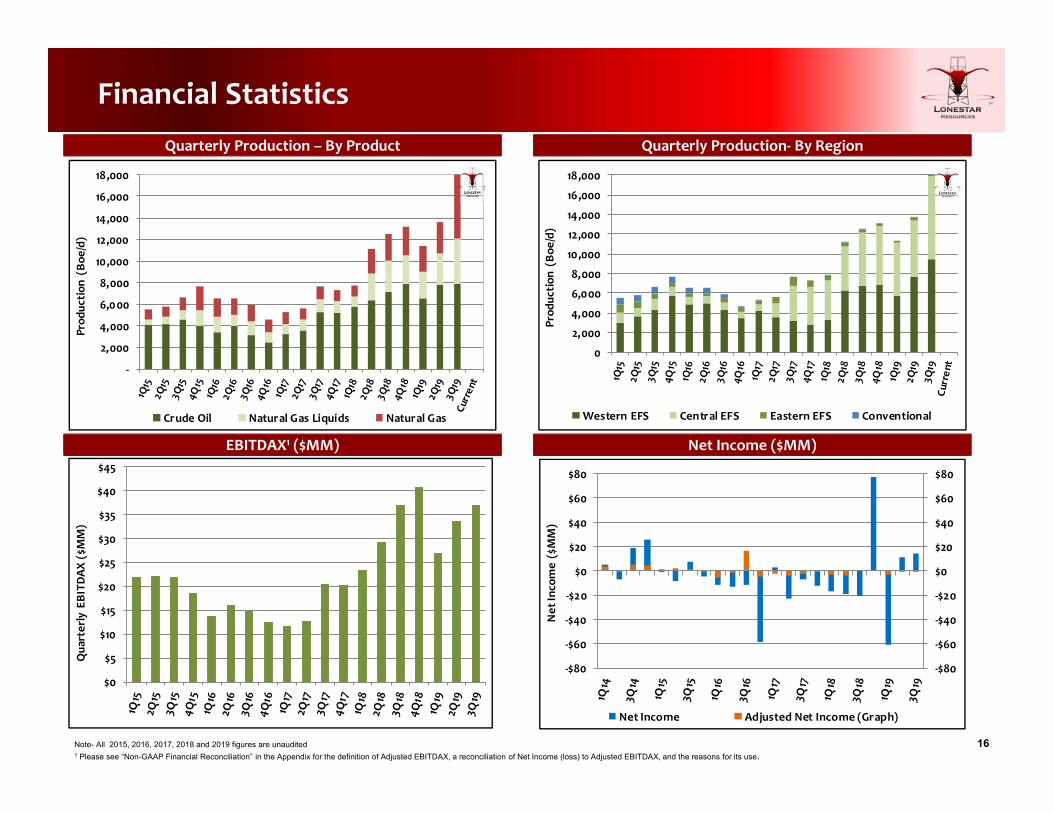
Financial Statistics
EBITDAX1 ($MM) Net Income ($MM)
Quarterly Production‐ By RegionQuarterly Production – By Product
Note- All 2015, 2016, 2017, 2018 and 2019 figures are unaudited1 Please see “Non-GAAP Financial Reconciliation” in the Appendix for the definition of Adjusted EBITDAX, a reconciliation of Net Income (loss) to Adjusted EBITDAX, and the reasons for its use.
$0
$5
$10
$15
$20
$25
$30
$35
$40
$45
Qua
rter
ly E
BITD
AX ($M
M)
‐$80
‐$60
‐$40
‐$20
$0
$20
$40
$60
$80
‐$80
‐$60
‐$40
‐$20
$0
$20
$40
$60
$80
Net In
come ($MM)
Net Income Adjusted Net Income (Graph)
17
0
2
4
6
8
10
12
14
0
200
400
600
800
1,000
1Q15
2Q15
3Q15
4Q15
1Q16
2Q16
3Q16
4Q16
1Q17
2Q17
3Q17
4Q17
1Q18
2Q18
3Q18
4Q18
1Q19
2Q19
3Q19
Curren
t
Eagle Fo
rd W
ell C
ount
Prod
uctio
n (B
oe/d)
Crude Oil Natural Gas Liquids Natural Gas
0
20
40
60
80
100
120
140
160
180
0
1,000
2,000
3,000
4,000
5,000
6,000
7,000
8,000
9,000
1Q15
2Q15
3Q15
4Q15
1Q16
2Q16
3Q16
4Q16
1Q17
2Q17
3Q17
4Q17
1Q18
2Q18
3Q18
4Q18
1Q19
2Q19
3Q19
Curren
t
Eagle Fo
rd W
ell C
ount
Prod
uctio
n (B
oe/d)
Crude Oil Natural Gas Liquids Natural Gas
0
10
20
30
40
50
60
‐
2,000
4,000
6,000
8,000
10,000
1Q15
2Q15
3Q15
4Q15
1Q16
2Q16
3Q16
4Q16
1Q17
2Q17
3Q17
4Q17
1Q18
2Q18
3Q18
4Q18
1Q19
2Q19
3Q19
Curren
t
Eagle Fo
rd W
ell C
ount
Prod
uction (Boe
/d)
Crude Oil Natural Gas Liquids Natural Gas
0
50
100
150
200
250
‐
2,000
4,000
6,000
8,000
10,000
12,000
14,000
16,000
18,000
1Q15
2Q15
3Q15
4Q15
1Q16
2Q16
3Q16
4Q16
1Q17
2Q17
3Q17
4Q17
1Q18
2Q18
3Q18
4Q18
1Q19
2Q19
3Q19
Curren
t
Eagle Fo
rd W
ell C
ount
Prod
uctio
n (B
oe/d)
Crude Oil Natural Gas Liquids Natural Gas
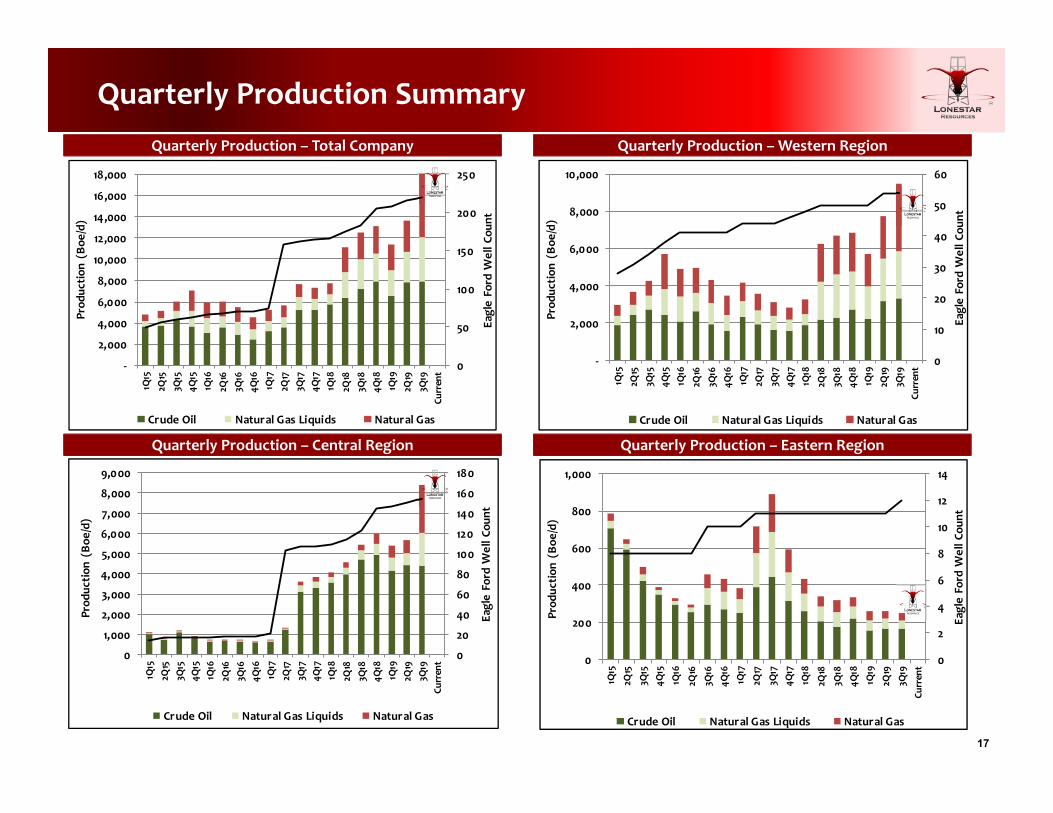
Quarterly Production Summary
Quarterly Production – Central Region Quarterly Production – Eastern Region
Quarterly Production – Western RegionQuarterly Production – Total Company
18
Hedging Summary – Crude OilCrude Oil Contracts
Period Instrument Volume Fixed Price
Bal ’19 LLS‐Basis Swap 6,000 bbls/day $5.05
LLS Basis Swaps
Crude Oil Contracts
% of Production Hedged 1
Volume Hedged
1% hedged values based off mid‐point of guidance. Note‐ 2019 Bbl/d represent Oct Forward
88% 95% 80‐90%
Period Instrument Volume Fixed Price
Bal ’19 Oil‐WTI Swap 1,186 bbls/day $48.04
Bal ’19 Oil –WTI Swap 1,982 bbls/day $50.40
Bal ’19 Oil‐WTI Swap 1,100 bbls/day $50.90
Bal ’19 Oil‐WTI Swap 875 bbls/day $58.25
Bal ’19 Oil‐WTI Swap 500 bbls/day $65.20
Bal ’19 Oil‐WTI Swap 500 bbls/day $69.57
Bal ’19 Oil‐WTI Swap 70 bbls/day $48.97
Bal ’19 Oil‐WTI Swap 500 bbls/day $58.72
Bal ’19 Oil‐WTI Swap 500 bbls/day $58.77
Cal ’20 Oil‐WTI Swap 556 bbls/day $48.90
Cal ’20 Oil‐WTI Swap 1,123 bbls/day $55.06
Cal ’20 Oil‐WTI Swap 500 bbls/day $61.65
Cal ’20 Oil‐WTI Swap 500 bbls/day $65.56
Cal ‘20 Oil‐WTI Swap 500 bbls/day $58.03
Cal ‘20 Oil‐WTI Swap 500 bbls/day $57.70
Cal ‘20 Oil‐WTI Swap 500 bbls/day $57.94
Cal ‘20 Oil‐WTI Swap 500 bbls/day $57.71
Cal ’20 Oil‐WTI Swap 1,000 bbls/day $60.00
Cal ’20 Oil‐WTI Swap 800 bbls/day $51.60
Cal ’20 Oil‐WTI Swap 500 bbls/day $56.45
Cal ’20 Oil‐WTI Swap 500 bbls/day $56.25
Cal ’21 Oil‐WTI Swap 2,000 bbls/day $56.50
Cal ’21 Oil‐WTI Swap 1,000 bbls/day $51.05
Cal ’21 Oil‐WTI Swap 1,000 bbls/day $51.69
~50%
6,021
7,212 7,480
4,000
$55.50 $54.54 $56.95
$53.93
$0
$10
$20
$30
$40
$50
$60
$70
$80
$90
0
1,000
2,000
3,000
4,000
5,000
6,000
7,000
8,000
2018 2019 2020 2021
$ / B
bl
Volume
Hed
ged (b
opd)
19
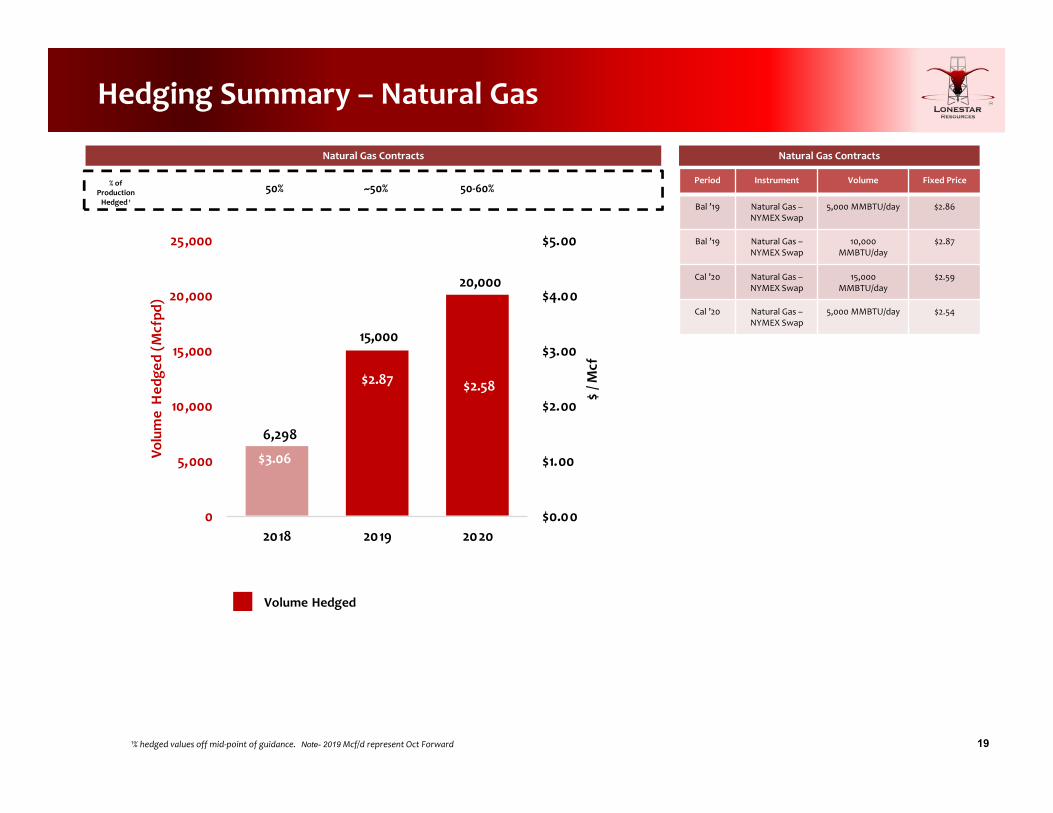
Hedging Summary – Natural Gas
Natural Gas ContractsNatural Gas Contracts
% of Production Hedged 1
1% hedged values off mid‐point of guidance. Note- 2019 Mcf/d represent Oct Forward
50% ~50%Period Instrument Volume Fixed Price
Bal ’19 Natural Gas –NYMEX Swap
5,000 MMBTU/day $2.86
Bal ’19 Natural Gas –NYMEX Swap
10,000 MMBTU/day
$2.87
Cal ’20 Natural Gas –NYMEX Swap
15,000 MMBTU/day
$2.59
Cal ’20 Natural Gas –NYMEX Swap
5,000 MMBTU/day $2.54
Volume Hedged
50‐60%
6,298
15,000
20,000
$3.06
$2.87 $2.58
$0.00
$1.00
$2.00
$3.00
$4.00
$5.00
0
5,000
10,000
15,000
20,000
25,000
2018 2019 2020
$ / M
cf
Volume
Hed
ged (M
cfpd
)