London's Crossrail Scheme - its evolution, governance, financing and challenges
30
Institute for Transport Studies FACULTY OF ENVIRONMENT London’s Crossrail Scheme- its evolution, governance, financing and challenges Workshop on transport investment – London, Paris and New York 22 nd March 2017 Tom Worsley Visiting Fellow
-
Upload
institute-for-transport-studies-its -
Category
Environment
-
view
67 -
download
3
Transcript of London's Crossrail Scheme - its evolution, governance, financing and challenges

Institute for Transport StudiesFACULTY OF ENVIRONMENT
London’s Crossrail Scheme- its evolution, governance, financing and challenges
Workshop on transport investment – London, Paris and New York 22nd March 2017
Tom Worsley Visiting Fellow

Outline of Presentation• London’s Crossrail scheme – brief description
• The long evolution of Crossrail:– CLRS and decision not to proceed
– A deviation - Transport and the economy - evidence of transport ‘s contribution to economic growth
– Crossrail after 2000
• Changes to institutions and economic appraisal methods
• The case for Crossrail strengthened
• Funding and financing
• Governance
• Crossrail 2 - a new proposal for the 2030s
• Conclusions
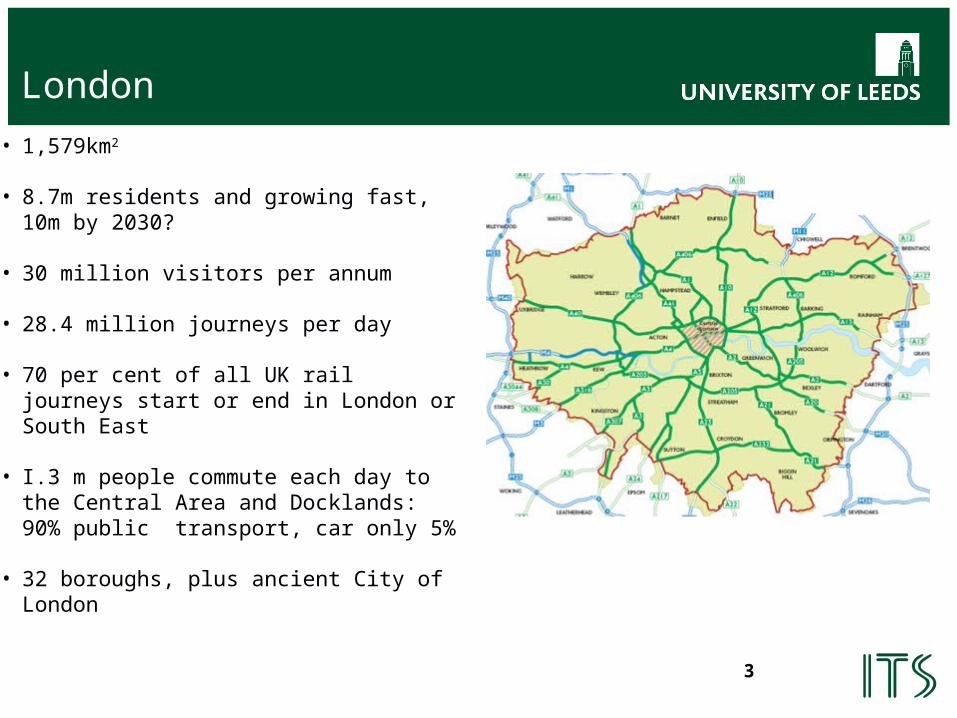
London• 1,579km2
• 8.7m residents and growing fast, 10m by 2030?
• 30 million visitors per annum
• 28.4 million journeys per day
• 70 per cent of all UK rail journeys start or end in London or South East
• I.3 m people commute each day to the Central Area and Docklands: 90% public transport, car only 5%
• 32 boroughs, plus ancient City of London
3

4
Route of Crossrail• Joins Great Western suburban services to Great Eastern
and to South Eastern in Thames Gateway development area with Heathrow link
• 2x21km new tunnels through Central London – 7 Central London stations, all with interchange
• 2xnin Thames Gateway development areak shopping districts (West End), financial districts (City of London, Canary Wharf) and Heathrow Airport

Key Facts• First cross-city suburban rail link in London: will increase Central Area
rail capacity by 10%
• 9 stations rebuilt and 28 upgraded
• 24 trains per hour in each direction during peak
• Tunnelling completed 2016: first new trains delivered
• Construction started 2009: open end 2018
• Journey times: Liverpool St - Heathrow 23 mins(55 now), Paddington - Canary Wharf 14 mins (30 now)
5

Evolution of the Crossrail scheme – 60 years gestation
1944 Abercrombie PlanPost war redevelopment of London – two new tube lines proposed – Victoria line opened 1969
1974 London Rail Study Government report. Proposed east – west link between Paddington and Liverpool St stations, noting success of such schemes in Paris and Munich. Cost £300m – no funding
1980 British Rail Discussion Paper North-south cross London link for inter-city trains
1987-9 Central London Rail StudyJoint study by Central Government, British Rail and London Regional Transport

Economic Appraisal at the time of CLRS
• Cost benefit analysis well established in UK as a means of providing transport decision makers (ministers, parliament and local government) with information to help prioritise and accept/reject options
• Treasury Green Book supplemented by Transport Department’s COBA
• Mainly use was for highways and some local tram/bus infrastructure: until c2000 rail demand was flat and investment concerned with minimum full life cost replacement of assets, with enhancements (eg new better rolling stock) being justified against revenue from selective increases in fares.
• CBA influential in establishing public interest in the case of land purchase for schemes and value for money to Parliament
• Methods subjected to external expert scrutiny and advice by Standing Advisory Committee on Trunk Road Assessment (SACTRA)

Central London Rail Study 1989
• The Problem - Overcrowding in Central London and at main line terminus interchange stations.
• Two broad sets of solutions: – New deep level limited capacity underground (tube) lines
– Cross London links joining existing suburban lines either side of London with large diameter tunnels
• Cross London links delivered bigger reduction in crowding and had higher benefit:cost ratios.
• Best options – East- West Crossrail and a North-South scheme, linking Euston with Victoria. Chelsea-Hackney, a north east – south west tube sized route was also short-listed

Measuring and valuing the costs and benefits: CLRS• Transport model: changes in the volume and quality of travel
• LTS and RAILPLAN – Fixed employment, fixed trip totals - route, mode and destination choice allowed to change. Model estimated changes in Generalised Costs and contained GC elasticities for response to new travel cost matrix.
• Valuing of the benefits/costs of an option compared with ‘base case in terms of;
• Time savings, including rail crowding and road congestion reduction – mode shift effect
• Other journey quality – stations, interchange
• Additional rail revenues
• Changes in costs, including infrastructure and taxes – transport user, operators and government

Central London Rail Study (1989) and E-W Crossrail
• Benefit cost ratio – 1.6:1 – low when compared with inter-urban roads
• High cost scheme – infrastructure costs of £ 870m 1988 prices (£2.0bn today)
• Government assessment of Study:– Further needed work on funding - beneficiaries were fare paying
London rail passengers, who should pay
– Contributions should be forthcoming from property owners and developers
– Possible government subsidy for road congestion relief.
• 1990 recession – decline in commuting – Parliament rejected the scheme in 1994 - no further work undertaken

Status of the Crossrail Scheme in the 1990s
• High capital cost – only modest benefits
• No easy resolution of funding problem:– London had introduced zonal fares in mid 1980s
• No good reason for large public subsidy:– Main beneficiaries rail passengers in London
– No evidence of benefits to rest of UK
• No scheme ‘champion’
• Many policy ‘diversions’– Privatisation of British Rail
– Jubilee Line Extension to Docklands under construction

Transport and the Economy
• SACTRA (1999) Report ‘Transport and the Economy’
• Reviewed links between transport investment and the economy
• Identified inadequacies in conventional CBA:– Positive externalities from transport – urban agglomeration benefits
- Knowledge transfer and spill-overs
- Sharing – public goods
- Matching - people, jobs, products, firms, goods – more efficient markets
– Changes in the location of economic activity – successful cities attract innovation, specialisation and skills
• DfT programme of research

Identification and Quantification of Wider Economic Impacts
• Benefits additional to conventional Transport User Benefits– Agglomeration effects
• Effective density – accessibility, employment density and productivity
– Static – increasing accessibility raised productivity
– Dynamic – increasing accessibility leads to change in the location of activity towards more productive places, further increasing productivity
– Labour supply effects
• Lower transport costs increases labour market participation
• Move to more productive jobs – creating dynamic agglomeration

Relevance of Wider Benefits to Transport Policy
• An increase in BCRs of urban schemes relative to highways– ‘Value for Money’, defined in terms of the BCR, an important
influence on decisions
• Evidence of transport’s role in increasing productivity and contributing to higher economic growth– No other Government Department could produce evidence of their
spending having such a direct link to productivity

London 1990-2000 – Governance, Institutions and Reform
• Between 1986 and 2000 there was no central strategic planning body for London - Thatcher abolished the GLC
• London Regional Transport (1986-2000) directly controlled by Central Government
• New governance structure with powers devolved from Central Government set up in 2000
• Greater London Authority – elected body responsible for planning and strategy headed by Mayor
• Transport for London reports to the GLA – the 32 boroughs transport powers limited to local roads

Crossrail – post 2000
• 2000 Government’s Transport Ten Year Plan included Crossrail
• 2002 CLRL established by SRA and TfL: New business case
• 2005 Montagu review of Business Case to ensure deliverability and funding
• 2005 Updated business case – WEBs
• 2007 Go ahead in Government’s annual Spending Review
• 2007-10 Supplementary Business Rate
• 2005-8 Crossrail Bill/royal assent
• 2009 Start of works

What had Changed?• Institutions
– Mayor of London to act as ‘champion’ from 2000 with responsibility fro Transport for London
– Blair Government ambitions – 10 Year Transport Plan (mostly unrealised)
– New powers enabling Mayor to raise additional tax on property and to negotiate a levy on developers
– Strategic Rail Authority to provide strategic direction for the now privatised railway from 1999
• Economic Appraisal– Implementation of Wider Economic Benefits guidance;
• Increased the BCR to acceptable levels
• Demonstrated link between Crossrail and economic growth – UK economy gains, not only London rail passengers
• Location of GDP effects mapped to London boroughs to provide evidence for the business rate (tax) supplement

WEBs and Crossrail
• Conventional BCR 1.9:1
• Static agglomeration benefits raised this to 3.1:1
• Move to More Productive Jobs – dynamic agglomeration– No LUTI or other model available
– Simple, transparent approach:
• Time series cordon data showed peak period crowding a constraint on growth and ‘attainable’ levels of crowding
• Analysis of employment densities showed other cities’ CBD more jobs per km² than London
• Assumption – new capacity would fill up to ‘attainable’ levels over time with between 26k and 70k workers moving from elsewhere
• BCR increased to 3.5 for low jobs move assumption

Composition of Crossrail benefits post Wider ImpactsCategory of Benefit Benefits £bn 2002 prices
DfT TfLPublic transport users; commuting and leisure
6.1
Public transport users - business 4.1
Road users; commuting and leisure 1.6
Road users; business 0.6
Indirect tax change -1.4
Total transport user benefits 11.0 15.5Static Agglomeration 3.1
Move to more productive jobs 2.0
Labour force participation 0.8
Imperfect competition 0.5
Total Wider Impacts 6.4 7.0-18.0

Realising Crossrail’s Wider Benefits
• Pressure by London businesses from mid-1990s for better public transport – London First business based lobby group proposed local funding
• Importance of ‘fairness’ – no special subsidy for London
• Powers delegated to London’s mayor to add a supplementary charge on the business rate (BRS) of 2% on the rateable value – broadly a 4% increase in tax paid
• Wider impacts modelling showed where by zone businesses would benefit from increased access to labour and higher productivity – most of London gains some benefits
• Special Crossrail BRS imposed from 2010

Crossrail Funding £ billion
• Central Government 4.7
• Business– Business Rates Supplement 4.1– Developer Contributions 1.1
• Fare payer 4.9
• Total scheme cost 14.8
• “On time, on budget”, Terry Morgan, Chairman

Crossrail Funding – details of London’s contribution
• Business Rates Supplement
- Supplement of 2p per £ of rateable value for larger business premises (occupation tax on commercial property) - approximately a 4% increase in the tax
• Developer contributions – £1.1 billion – from new buildings
- Community Infrastructure Levy (CIL) and
developer contributions £0.6 billion
- City of London / BAA (Heathrow) £0.5 billion
• Plus over station development, say £0.5 billion, treated as reduced costs

Crossrail: Governance for Delivery

Crossrail Governance – why it worked
• Joint sponsor board to align the two sponsors’ interests – outputs and constraints
• Sponsors requirements set out in Project Delivery Agreement, which gives certainty of funding
• CRL – delivery agent – separate from sponsors
• CRL board responsible for overseeing/incentivising delivery, challenges sponsors wanting change, reports 6 monthly to sponsors
• Private sector tendering/contracting practices used by CRL – experience from CTRL
• CRL consults industry and works with local stakeholders/interest groups but no contractual relationship
• Risks of cost overruns – first tranche of any overrun from TfL’s contingency, next from DfT’s and risk sharing with contractors

Governance: Train and Infrastructure Operations
• Infrastructure operated and maintained by Transport for London
• Train service operated by the MTR Corporation under a £1.4bn 8 year (plus 2 more optional years) management contract drawn up by TfL through competitive tender– Transfer to of existing services operated under DfT franchise to TfL
– Services specified by TfL
– Revenue risk with TfL – all revenues paid to TfL
– Performance objectives with penalties and bonuses
• Conventional arrangement for TfL Overground (but underground operated directly by TfL) – all other GB rail franchised with revenue risk (usually) taken by operator

Crossrail 2 – North East to South West
• What?– 2x38km new tunnels connecting in to
suburban rail from North East to South West
– 10% increase in rail capacity
– High frequency – 30 trains per hour in Central Area
• Why?– Supports London’s growth – more CBD jobs
– Addresses capacity constrains in CDB and on main line suburban routes and stations
– Relief for Waterloo, London’s busiest station >100,000 passengers morning peak
– Makes land accessible for housing – 200,000 ne w homes
• Cost– £33.5 bn

Crossrail 2 – From the Incremental to the Transformational
• Crossrail 1 approach to estimating relocation of jobs ( filling capacity) not applicable:– Demand ‘created’ through additional housing
– Intention is to improve service quality – below crush capacity
– Hypothesis that supply creates demand questionable
– Need to show where relocated jobs had come from
– Developments in modelling since 2007
• LONLUTI – transport/land use interaction model for London with ‘bolt-on’ model to estimate GDP effects of location change.

Crossrail 2 Appraisal of Wider Benefits
• LUTI model for London – LONLUTI:– to estimate responses to changes in accessibility of households, of
firms andof developers of housing land and business floorspace
– Increases in housing and business floorspace constrained by planning policies, influenced by accessibility
– Regional economic model, to estimate firms’ responses to transport cost and labour cost changes
• Main use of LUTI model:– Feedback loop of location change on transport network
– Relocation of firms/jobs to more or less productive places

Conclusions: Success of Crossrail 1
• Conventional BCR ‘good enough’: still better with Wider Benefits
• Strong political support: national and London policy champions.
• Funding by beneficiaries made possible by:– New powers for local revenue raising – BRS
– Mapping of benefits using transport model and appraisal
• Evidence from appraisal of GDP effect demonstrated:– Project contributed to government policy objective – productivity growth
– Benefits for all UK, not only for London
• So investment in London not ‘unfair’ – politically acceptable
• Sound model for governance established

Crossrail 2: Prospects
• More than just a transport scheme – intended to change level and location of economic activity
• Predicting how Crossrail 2 might transform a place is difficult – precedent is weak, outcomes depend on many agents and are very uncertain
• LUTI models can help but:– Are complex, ‘black box’ models
– Are unvalidated and difficult to challenge
• Governance for Crossrail 2 will be difficult – many agents, need to avoid strategic game playing
• But Crossrail 2 not alone in its low BCR – costs for all transport schemes rising faster than benefits
• Politics – Brexit: effect on London employment versus Britain being ‘open for business’