
Parvaneh Tavakoli London Metropolitan University February 2012.
Upload
cristiana-cornoCategory
view
98download
0
The shape of yield curve to come... risk free Cristiana Corno– Strategist Capital Markets – Trading – Banca IMI 6th-7th February 2017
2
Aknowledgments
I would be happy to end the year with more Europe rather than less.
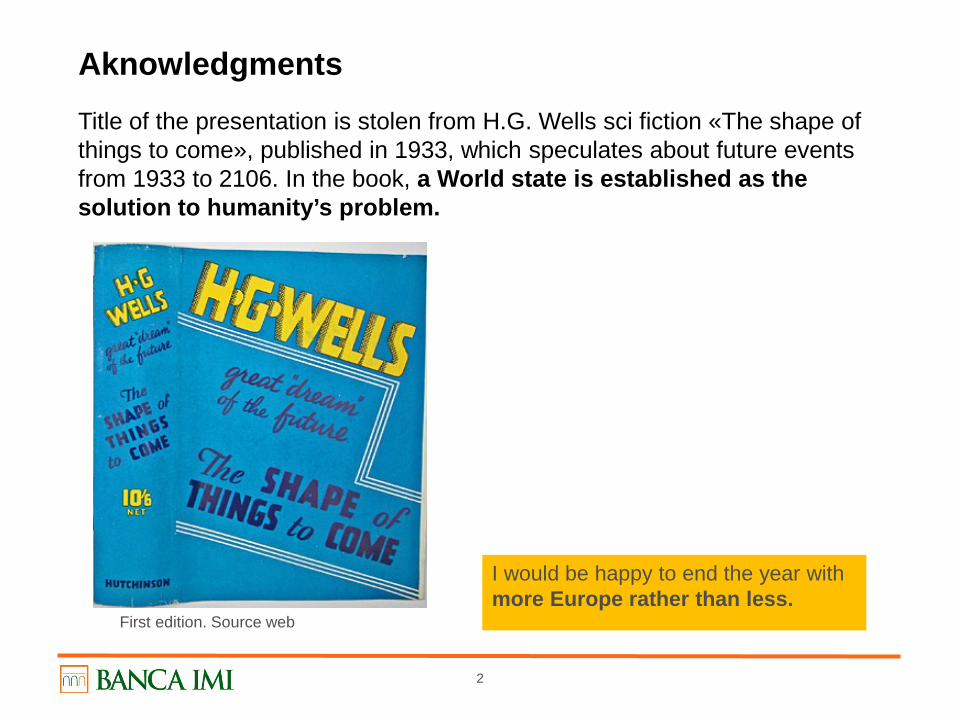
Title of the presentation is stolen from H.G. Wells sci fiction «The shape of things to come», published in 1933, which speculates about future events from 1933 to 2106. In the book, a World state is established as the solution to humanity’s problem.
First edition. Source web
3
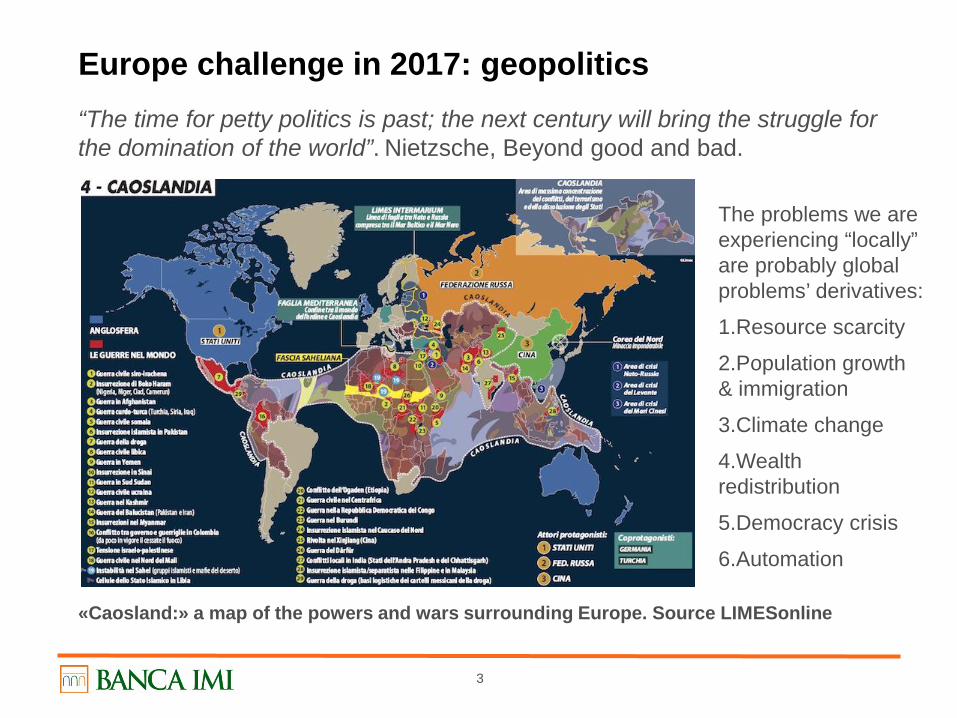
Europe challenge in 2017: geopolitics “The time for petty politics is past; the next century will bring the struggle for the domination of the world”. Nietzsche, Beyond good and bad.
«Caosland:» a map of the powers and wars surrounding Europe. Source LIMESonline
The problems we are experiencing “locally” are probably global problems’ derivatives:
1.Resource scarcity
2.Population growth & immigration
3.Climate change
4.Wealth redistribution
5.Democracy crisis
6.Automation
4
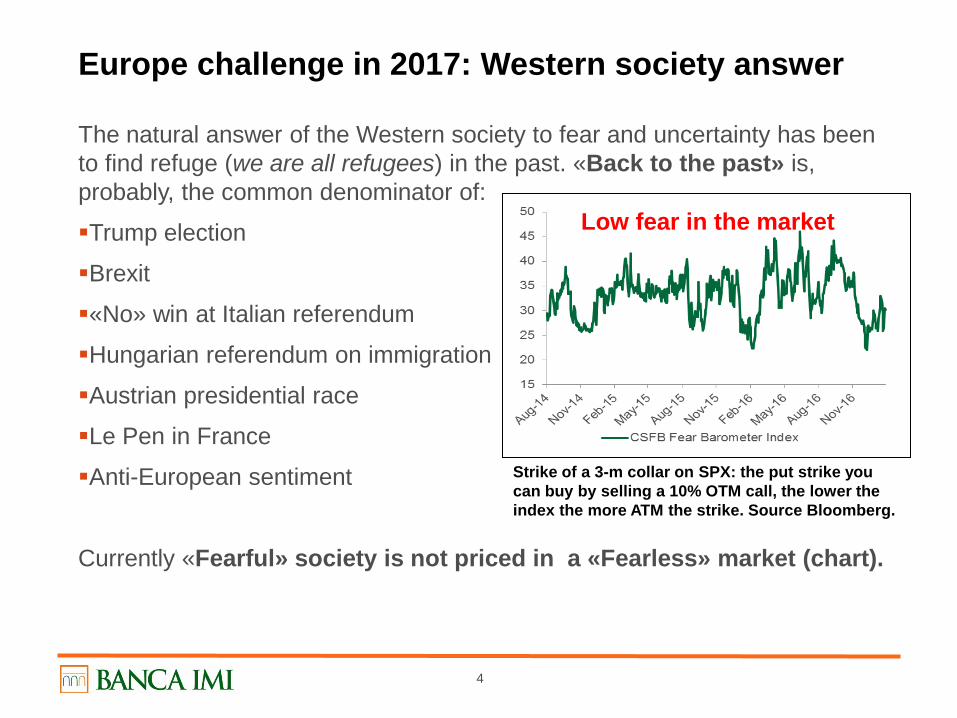
Europe challenge in 2017: Western society answer
The natural answer of the Western society to fear and uncertainty has been to find refuge (we are all refugees) in the past. «Back to the past» is, probably, the common denominator of:
Trump election
Brexit
«No» win at Italian referendum
Hungarian referendum on immigration
Austrian presidential race
Le Pen in France
Anti-European sentiment
Currently «Fearful» society is not priced in a «Fearless» market (chart).
Low fear in the market
Strike of a 3-m collar on SPX: the put strike you can buy by selling a 10% OTM call, the lower the index the more ATM the strike. Source Bloomberg.
5
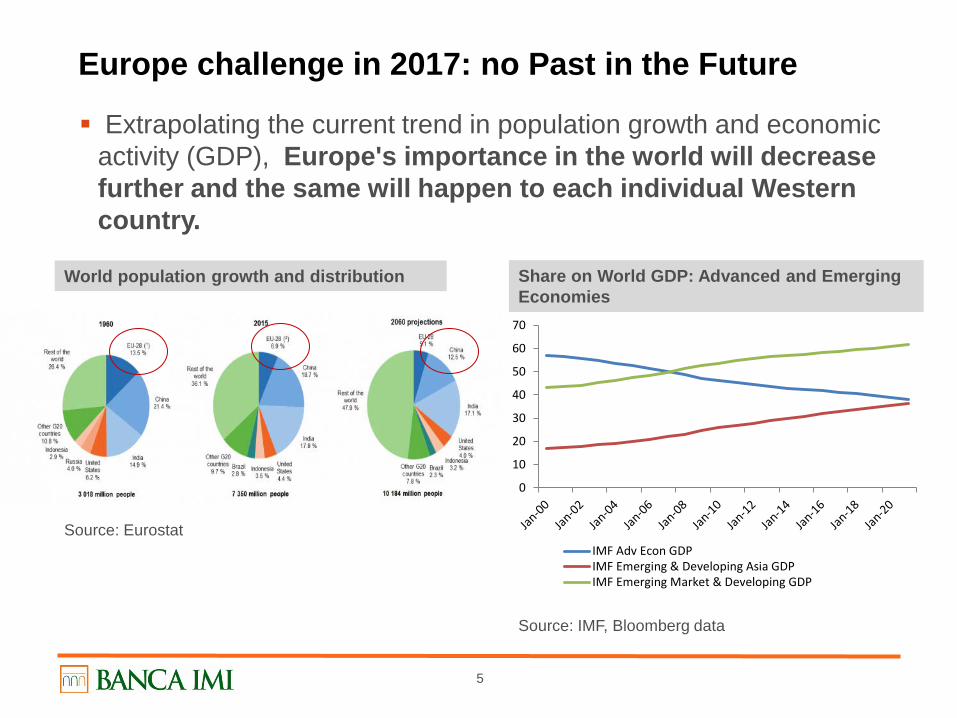
Europe challenge in 2017: no Past in the Future
Source: Eurostat
Extrapolating the current trend in population growth and economic activity (GDP), Europe's importance in the world will decrease further and the same will happen to each individual Western country.
World population growth and distribution
0
10
20
30
40
50
60
70
IMF Adv Econ GDPIMF Emerging & Developing Asia GDPIMF Emerging Market & Developing GDP
Share on World GDP: Advanced and Emerging Economies
Source: IMF, Bloomberg data
6
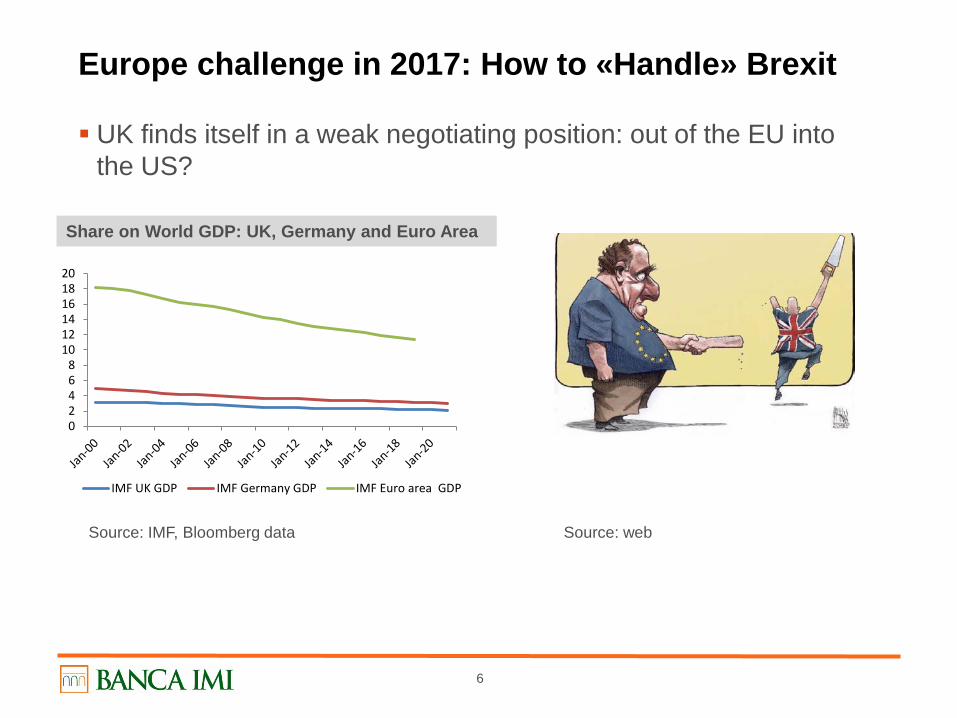
Europe challenge in 2017: How to «Handle» Brexit
UK finds itself in a weak negotiating position: out of the EU into the US?
Source: web
02468
101214161820
IMF UK GDP IMF Germany GDP IMF Euro area GDP
Share on World GDP: UK, Germany and Euro Area
Source: IMF, Bloomberg data
7
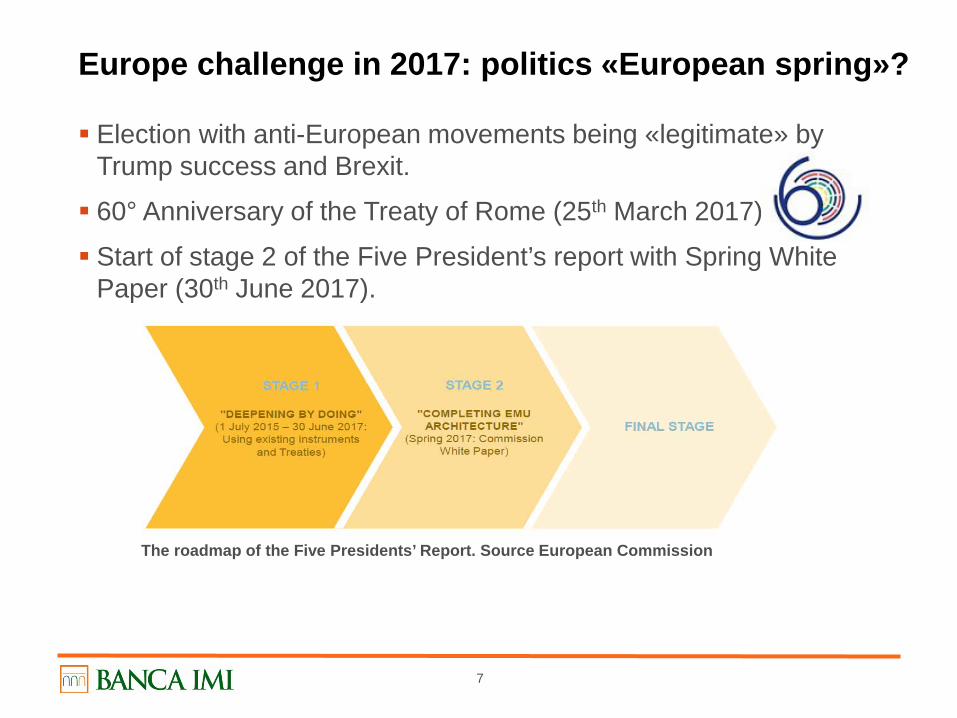
Europe challenge in 2017: politics «European spring»?
Election with anti-European movements being «legitimate» by Trump success and Brexit.
60° Anniversary of the Treaty of Rome (25th March 2017).
Start of stage 2 of the Five President’s report with Spring White Paper (30th June 2017).
The roadmap of the Five Presidents’ Report. Source European Commission
8
Europe challenge in 2017: ongoing work on growth convergence and stability
According to EC for the finalization of EMU we should see:
I. The completion of Banking Union with the European Deposit Insurance Scheme in tandem with risk reduction in the banking-government nexus via diversification of home-bias;
II. Further work on Capital Market Union (venture capital, integration in funding, securitization);
III. A positive fiscal stance for Europe, meaning:
Use of fiscal space where possible (Germany, Netherlands) in line with European strategic objectives or infrastructure, digital economy (FISCAL POLICY MUST BE NON-RICARDIAN to be effective);
Use of fiscal spending to reduce debt, where no space is available (to LIMIT MORAL HAZARD implicit in QE cheap financing).
9
Europe challenge in 2017: ongoing work on growth convergence and stability
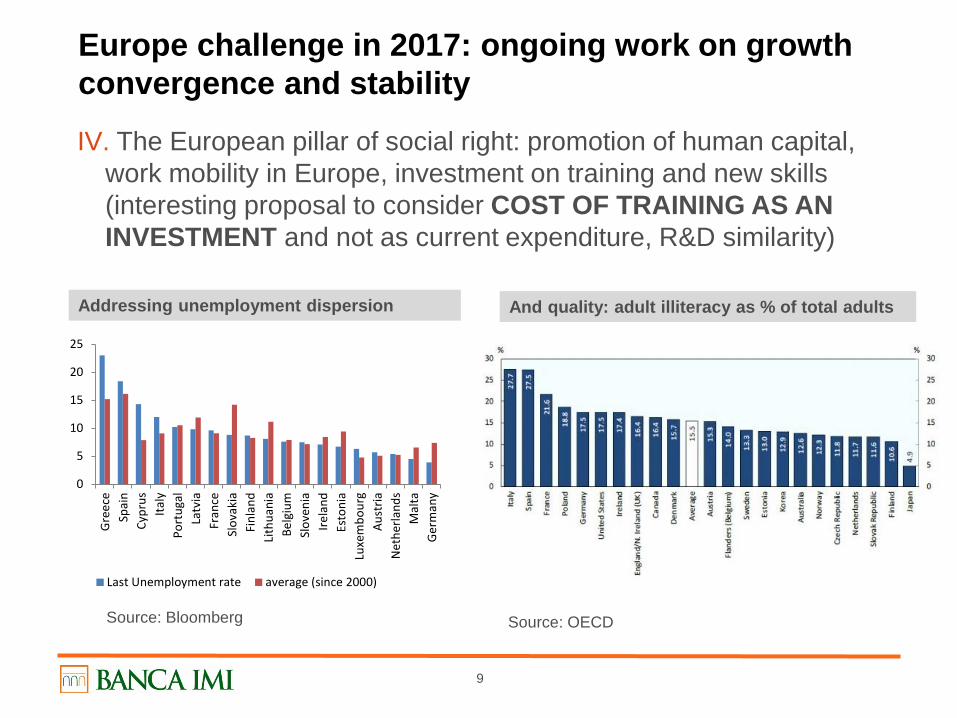
IV. The European pillar of social right: promotion of human capital, work mobility in Europe, investment on training and new skills (interesting proposal to consider COST OF TRAINING AS AN INVESTMENT and not as current expenditure, R&D similarity)
0
5
10
15
20
25
Gre
ece
Spai
nCy
prus
Italy
Port
ugal
Latv
iaFr
ance
Slov
akia
Finl
and
Lith
uani
aBe
lgiu
mSl
oven
iaIre
land
Esto
nia
Luxe
mbo
urg
Aust
riaN
ethe
rland
sM
alta
Ger
man
y
Last Unemployment rate average (since 2000)
Addressing unemployment dispersion And quality: adult illiteracy as % of total adults
Source: Bloomberg Source: OECD
10
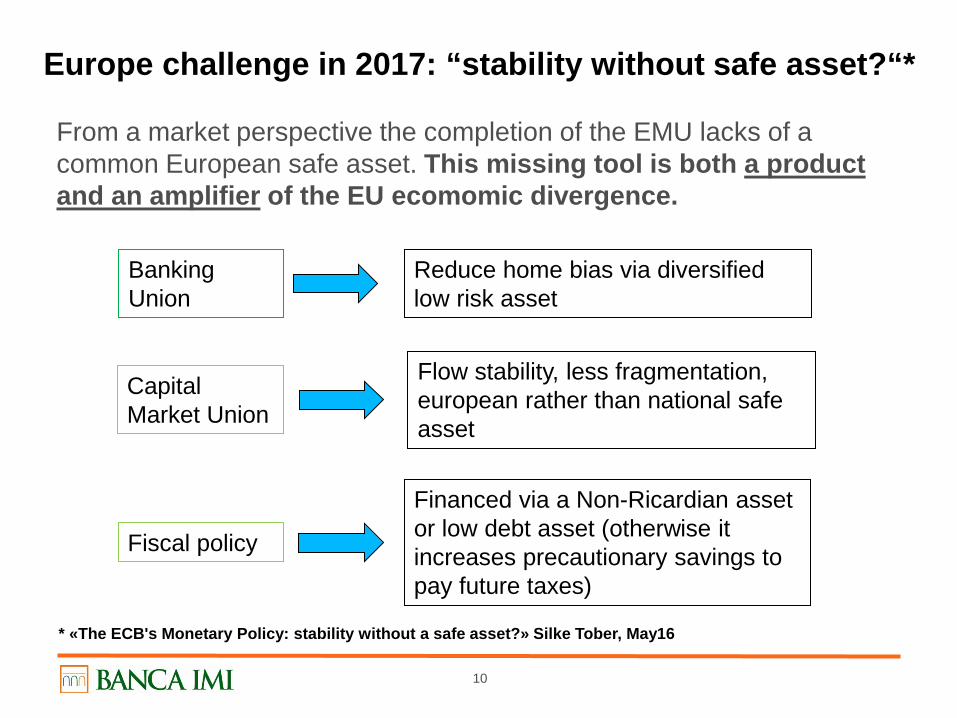
Europe challenge in 2017: “stability without safe asset?“*
From a market perspective the completion of the EMU lacks of a common European safe asset. This missing tool is both a product and an amplifier of the EU ecomomic divergence.
* «The ECB's Monetary Policy: stability without a safe asset?» Silke Tober, May16
Banking Union
Reduce home bias via diversified low risk asset
Capital Market Union
Flow stability, less fragmentation, european rather than national safe asset
Fiscal policy
Financed via a Non-Ricardian asset or low debt asset (otherwise it increases precautionary savings to pay future taxes)
11
The yield curve to come
1 2016 Experimental policy
2 Possible developments in 2017: European safe asset?
3 Markets
12
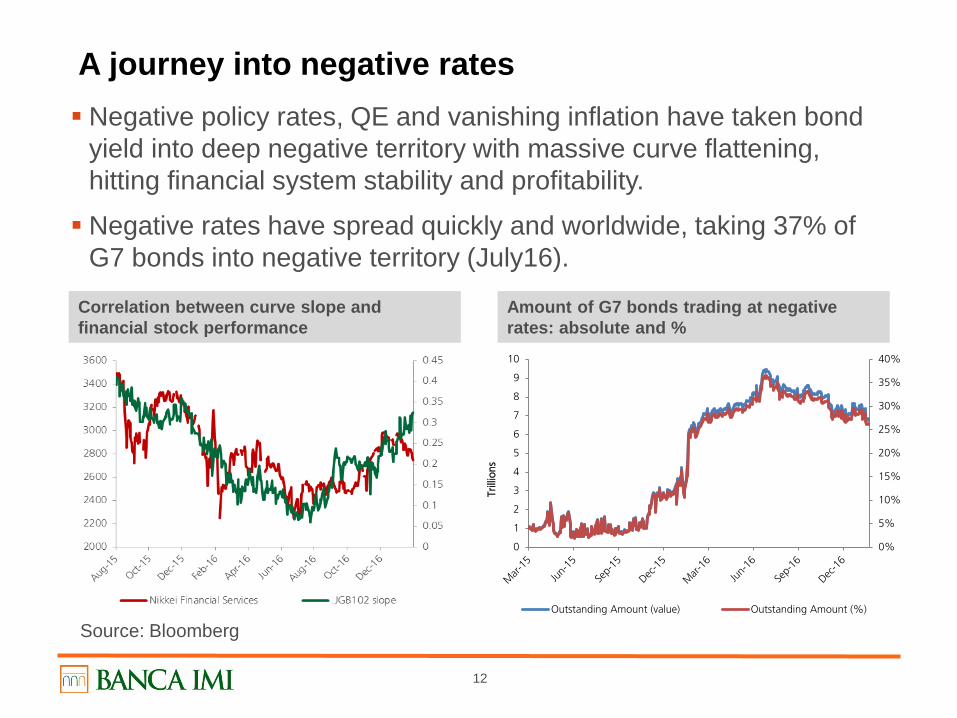
A journey into negative rates Negative policy rates, QE and vanishing inflation have taken bond
yield into deep negative territory with massive curve flattening, hitting financial system stability and profitability.
Negative rates have spread quickly and worldwide, taking 37% of G7 bonds into negative territory (July16).
Correlation between curve slope and financial stock performance
0%
5%
10%
15%
20%
25%
30%
35%
40%
0
1
2
3
4
5
6
7
8
9
10
Trill
ions
Outstanding Amount (value) Outstanding Amount (%)
Amount of G7 bonds trading at negative rates: absolute and %
Source: Bloomberg
13
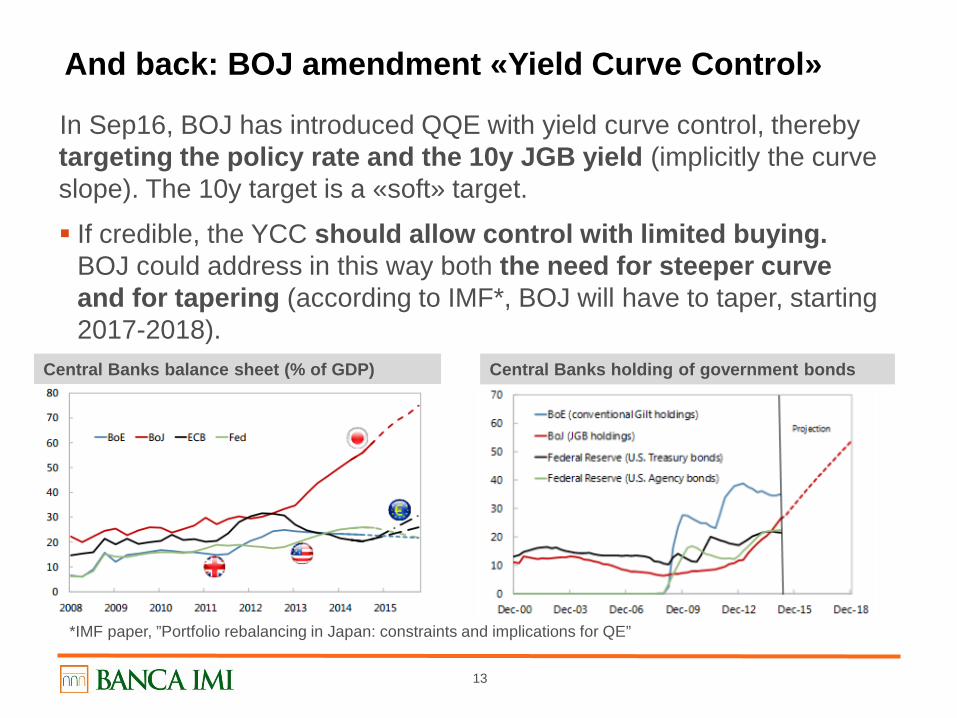
And back: BOJ amendment «Yield Curve Control»
In Sep16, BOJ has introduced QQE with yield curve control, thereby targeting the policy rate and the 10y JGB yield (implicitly the curve slope). The 10y target is a «soft» target.
If credible, the YCC should allow control with limited buying. BOJ could address in this way both the need for steeper curve and for tapering (according to IMF*, BOJ will have to taper, starting 2017-2018).
*IMF paper, ”Portfolio rebalancing in Japan: constraints and implications for QE”
Central Banks balance sheet (% of GDP) Central Banks holding of government bonds
14
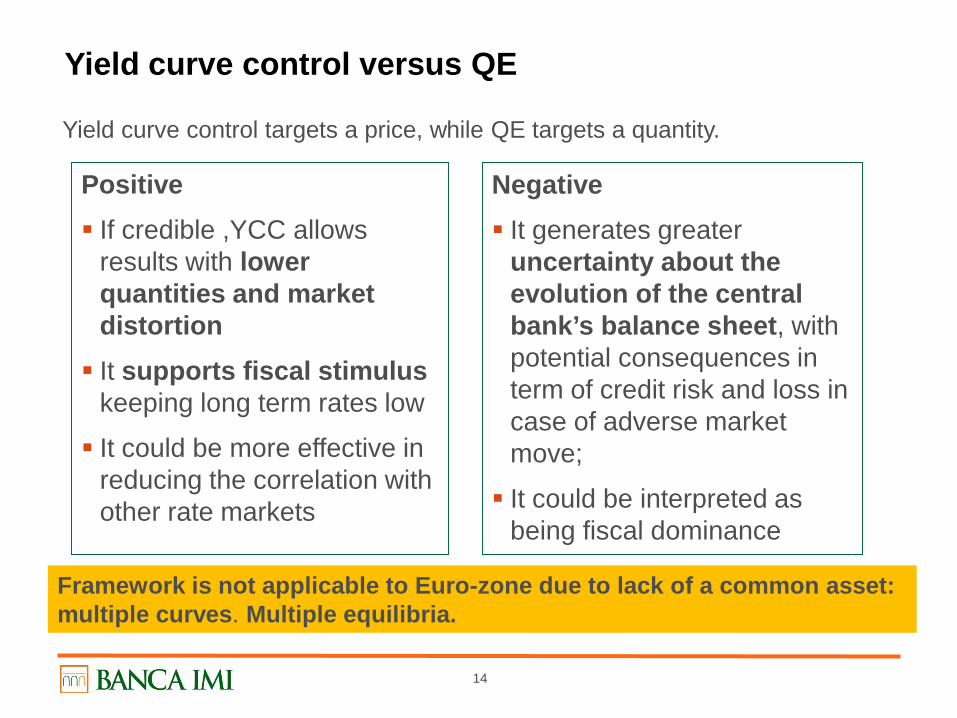
Yield curve control versus QE
Positive If credible ,YCC allows
results with lower quantities and market distortion It supports fiscal stimulus
keeping long term rates low
It could be more effective in reducing the correlation with other rate markets
Negative It generates greater
uncertainty about the evolution of the central bank’s balance sheet, with potential consequences in term of credit risk and loss in case of adverse market move;
It could be interpreted as being fiscal dominance
Framework is not applicable to Euro-zone due to lack of a common asset: multiple curves. Multiple equilibria.
Yield curve control targets a price, while QE targets a quantity.
15
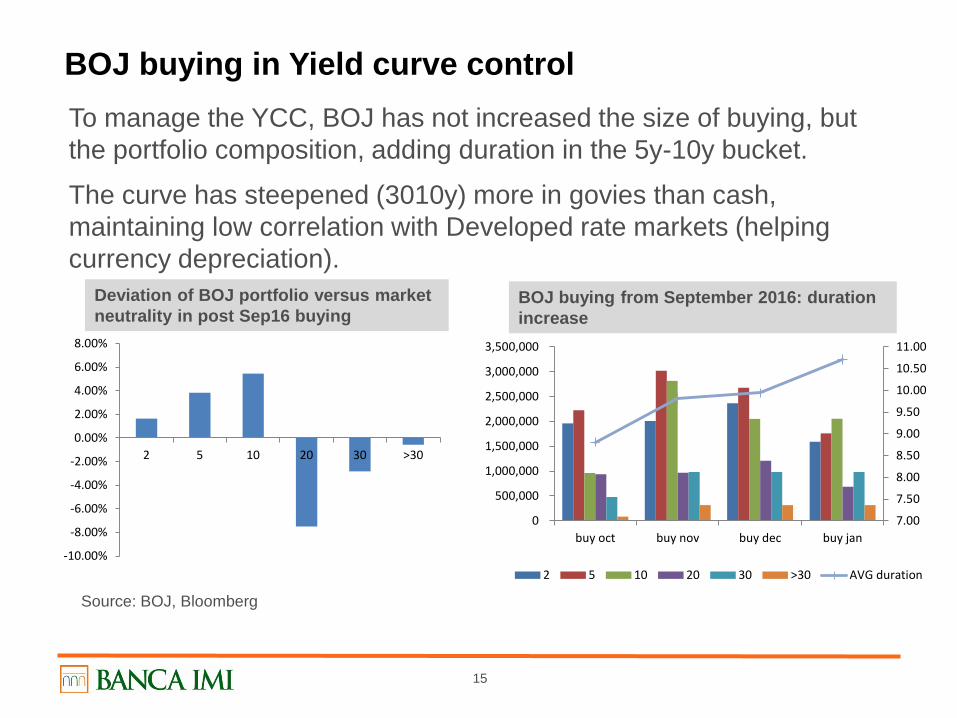
BOJ buying in Yield curve control To manage the YCC, BOJ has not increased the size of buying, but the portfolio composition, adding duration in the 5y-10y bucket.
The curve has steepened (3010y) more in govies than cash, maintaining low correlation with Developed rate markets (helping currency depreciation).
-10.00%
-8.00%
-6.00%
-4.00%
-2.00%
0.00%
2.00%
4.00%
6.00%
8.00%
2 5 10 20 30 >30
7.00
7.50
8.00
8.50
9.00
9.50
10.00
10.50
11.00
0
500,000
1,000,000
1,500,000
2,000,000
2,500,000
3,000,000
3,500,000
buy oct buy nov buy dec buy jan
2 5 10 20 30 >30 AVG duration
Deviation of BOJ portfolio versus market neutrality in post Sep16 buying
BOJ buying from September 2016: duration increase
Source: BOJ, Bloomberg
16
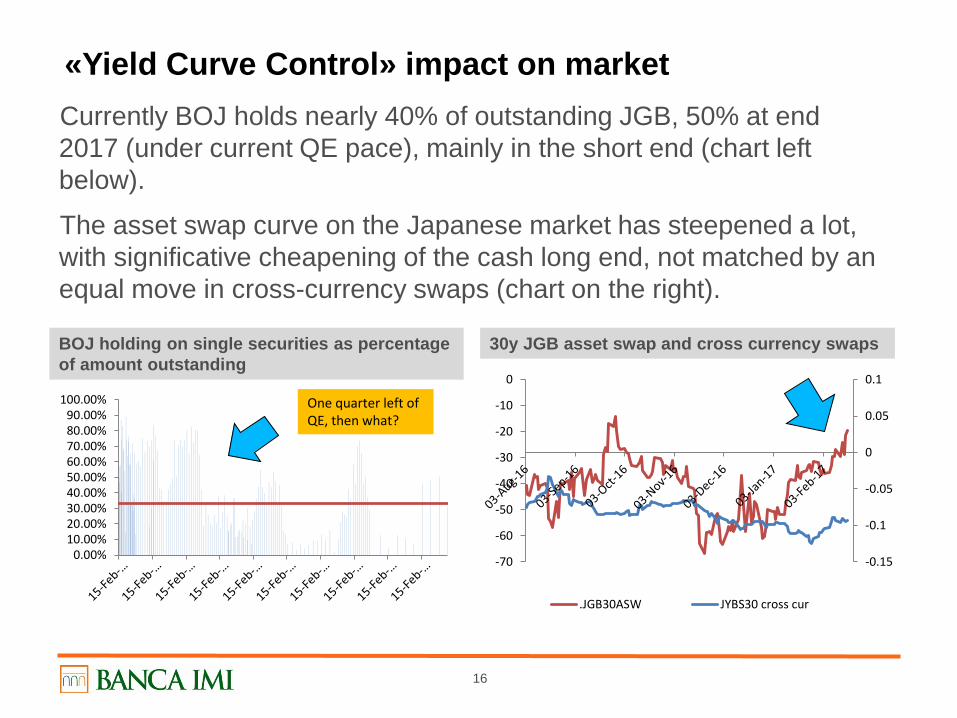
«Yield Curve Control» impact on market Currently BOJ holds nearly 40% of outstanding JGB, 50% at end 2017 (under current QE pace), mainly in the short end (chart left below).
The asset swap curve on the Japanese market has steepened a lot, with significative cheapening of the cash long end, not matched by an equal move in cross-currency swaps (chart on the right).
BOJ holding on single securities as percentage of amount outstanding
30y JGB asset swap and cross currency swaps
0.00%10.00%20.00%30.00%40.00%50.00%60.00%70.00%80.00%90.00%
100.00% One quarter left of QE, then what?
-70
-60
-50
-40
-30
-20
-10
0
-0.15
-0.1
-0.05
0
0.05
0.1
.JGB30ASW JYBS30 cross cur
17
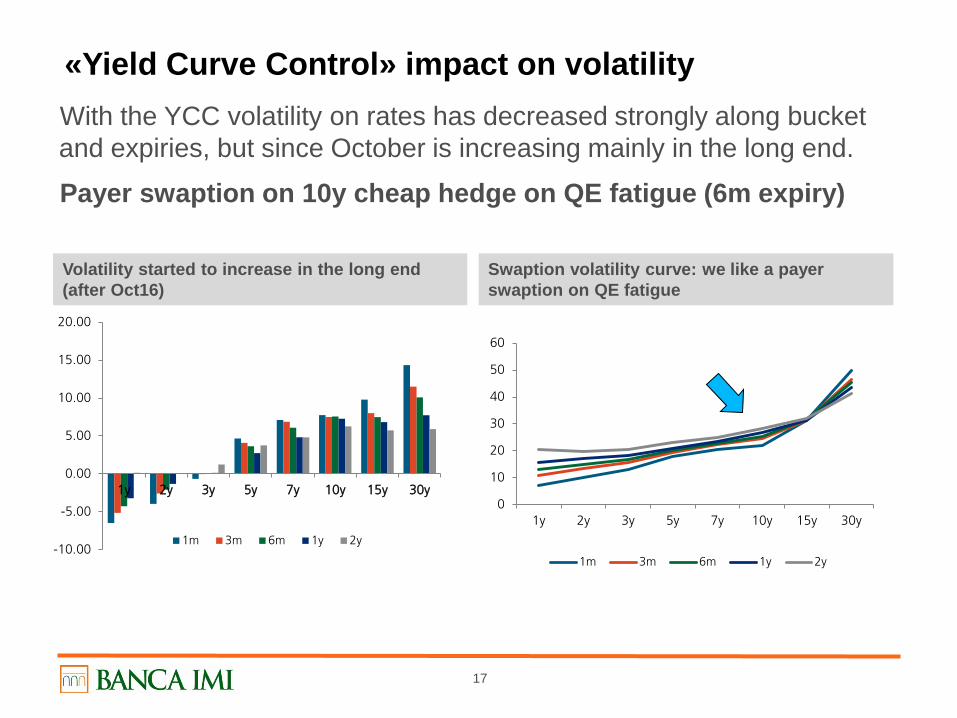
«Yield Curve Control» impact on volatility With the YCC volatility on rates has decreased strongly along bucket and expiries, but since October is increasing mainly in the long end.
Payer swaption on 10y cheap hedge on QE fatigue (6m expiry)
Volatility started to increase in the long end (after Oct16)
Swaption volatility curve: we like a payer swaption on QE fatigue
-10.00
-5.00
0.00
5.00
10.00
15.00
20.00
1y 2y 3y 5y 7y 10y 15y 30y
1m 3m 6m 1y 2y
0
10
20
30
40
50
60
1y 2y 3y 5y 7y 10y 15y 30y
1m 3m 6m 1y 2y
18
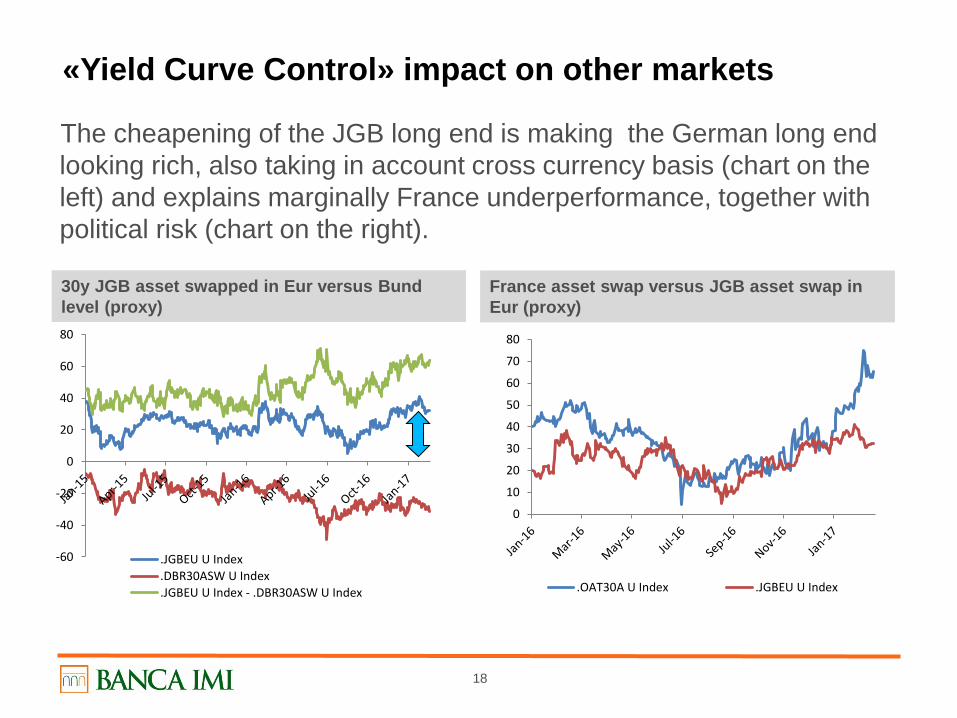
«Yield Curve Control» impact on other markets
The cheapening of the JGB long end is making the German long end looking rich, also taking in account cross currency basis (chart on the left) and explains marginally France underperformance, together with political risk (chart on the right).
30y JGB asset swapped in Eur versus Bund level (proxy)
France asset swap versus JGB asset swap in Eur (proxy)
-60
-40
-20
0
20
40
60
80
.JGBEU U Index
.DBR30ASW U Index
.JGBEU U Index - .DBR30ASW U Index
0
10
20
30
40
50
60
70
80
.OAT30A U Index .JGBEU U Index
19
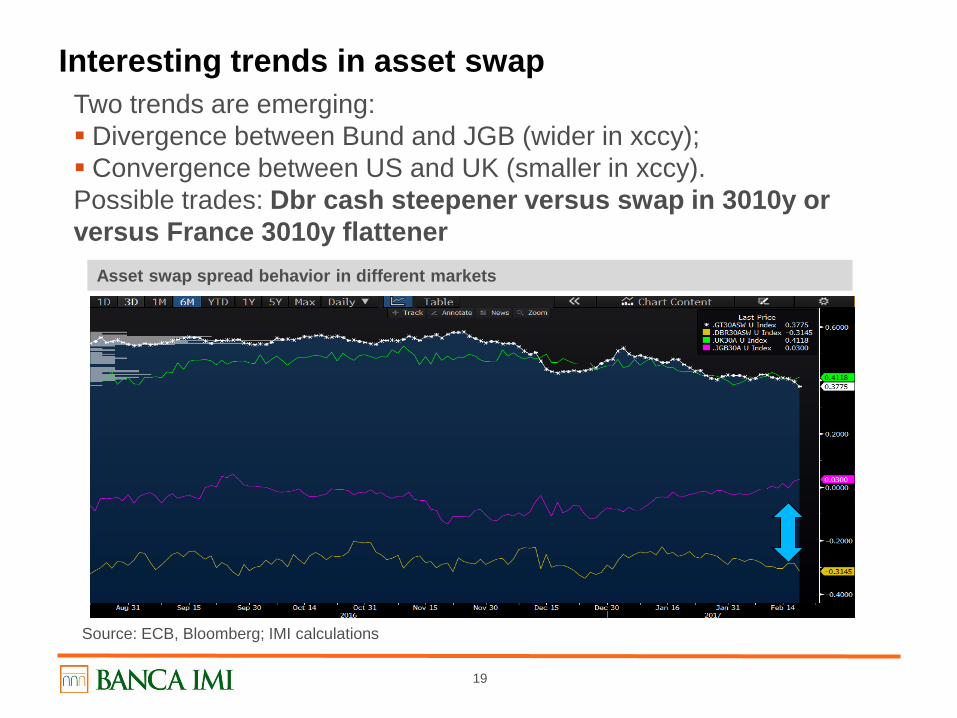
Interesting trends in asset swap Two trends are emerging: Divergence between Bund and JGB (wider in xccy); Convergence between US and UK (smaller in xccy). Possible trades: Dbr cash steepener versus swap in 3010y or versus France 3010y flattener
Asset swap spread behavior in different markets
Source: ECB, Bloomberg; IMI calculations
20
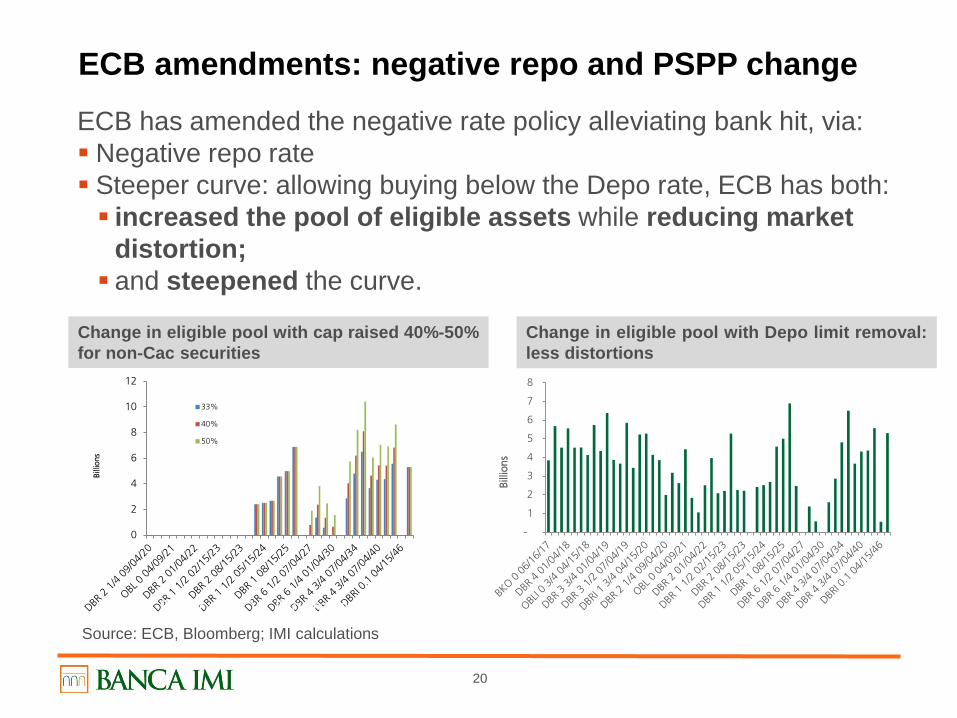
ECB amendments: negative repo and PSPP change ECB has amended the negative rate policy alleviating bank hit, via: Negative repo rate Steeper curve: allowing buying below the Depo rate, ECB has both: increased the pool of eligible assets while reducing market
distortion; and steepened the curve.
0
2
4
6
8
10
12
Billi
ons
33%
40%
50%
Source: BOJ, Bloomberg
-
1
2
3
4
5
6
7
8
Billi
ons
Change in eligible pool with cap raised 40%-50% for non-Cac securities
Change in eligible pool with Depo limit removal: less distortions
Source: ECB, Bloomberg; IMI calculations
21
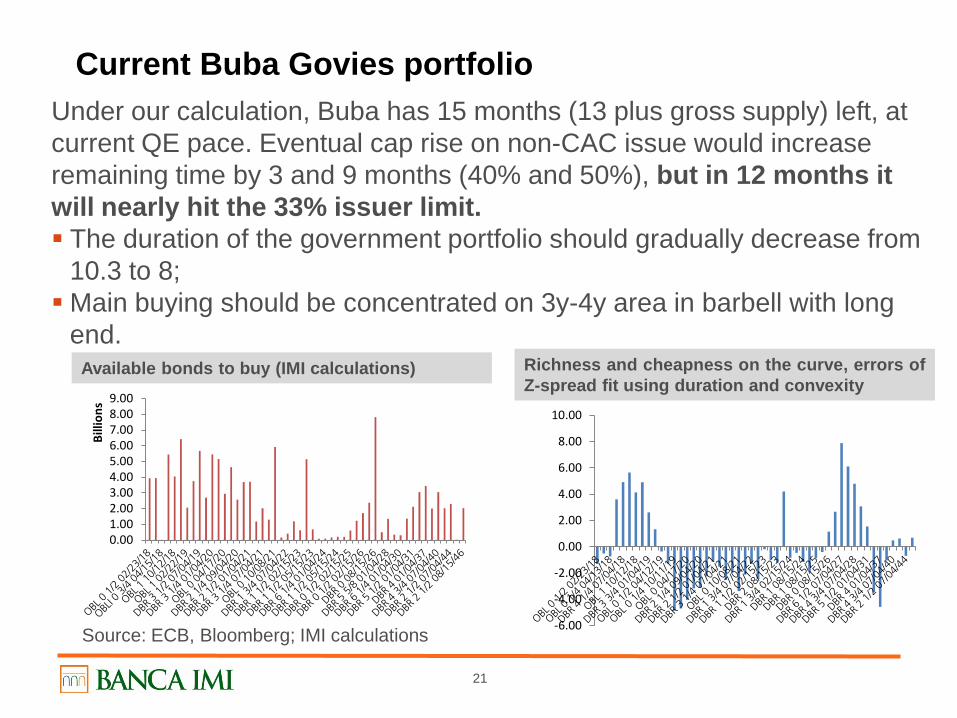
Current Buba Govies portfolio Under our calculation, Buba has 15 months (13 plus gross supply) left, at current QE pace. Eventual cap rise on non-CAC issue would increase remaining time by 3 and 9 months (40% and 50%), but in 12 months it will nearly hit the 33% issuer limit. The duration of the government portfolio should gradually decrease from
10.3 to 8; Main buying should be concentrated on 3y-4y area in barbell with long
end.
Available bonds to buy (IMI calculations) Richness and cheapness on the curve, errors of Z-spread fit using duration and convexity
0.001.002.003.004.005.006.007.008.009.00
Billi
ons
-6.00
-4.00
-2.00
0.00
2.00
4.00
6.00
8.00
10.00
Source: ECB, Bloomberg; IMI calculations
22
Yield curve to come
1 2016 Experimental policy
2 Possible themes in 2017: European safe asset?
3 Markets
23
Europe challenge in 2017: safe asset
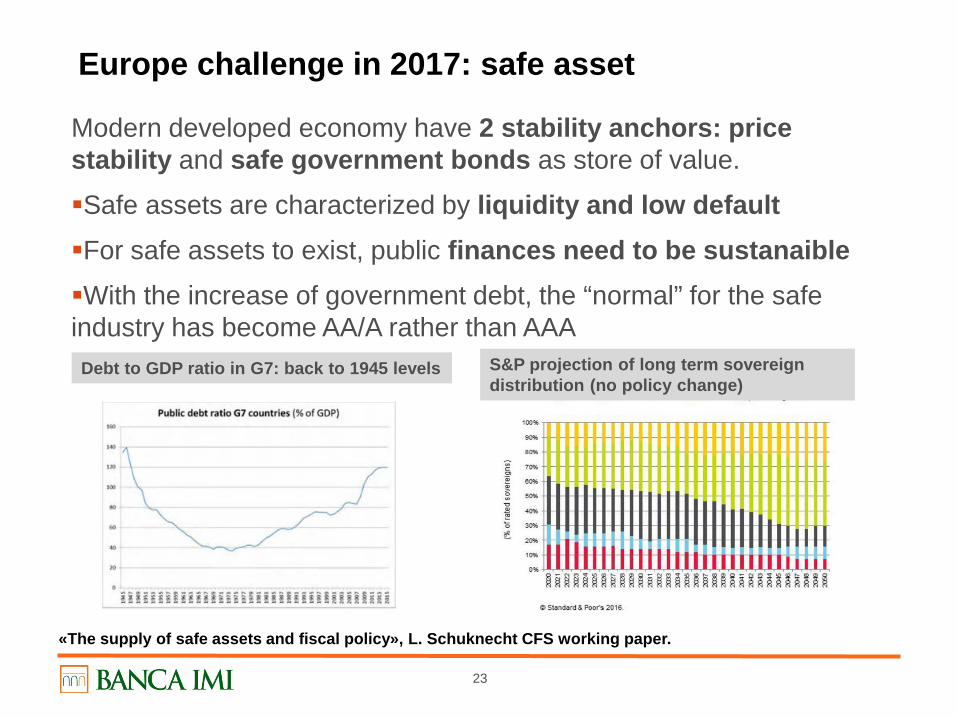
Modern developed economy have 2 stability anchors: price stability and safe government bonds as store of value.
Safe assets are characterized by liquidity and low default For safe assets to exist, public finances need to be sustanaible With the increase of government debt, the “normal” for the safe industry has become AA/A rather than AAA
«The supply of safe assets and fiscal policy», L. Schuknecht CFS working paper.
Debt to GDP ratio in G7: back to 1945 levels S&P projection of long term sovereign distribution (no policy change)
24
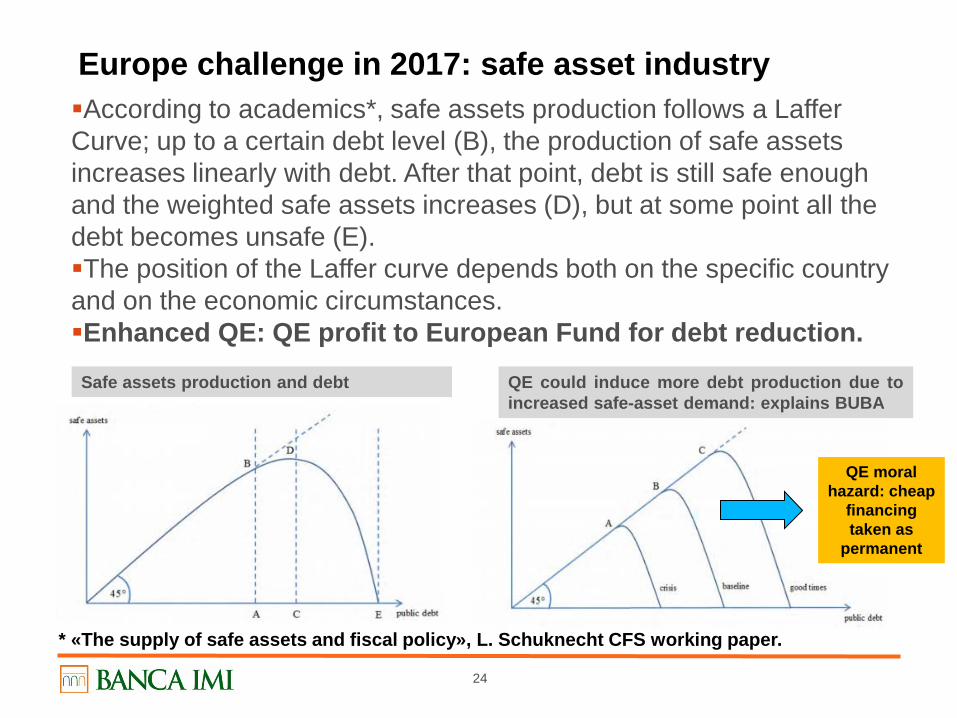
Europe challenge in 2017: safe asset industry According to academics*, safe assets production follows a Laffer Curve; up to a certain debt level (B), the production of safe assets increases linearly with debt. After that point, debt is still safe enough and the weighted safe assets increases (D), but at some point all the debt becomes unsafe (E). The position of the Laffer curve depends both on the specific country and on the economic circumstances. Enhanced QE: QE profit to European Fund for debt reduction.
Safe assets production and debt QE could induce more debt production due to increased safe-asset demand: explains BUBA
* «The supply of safe assets and fiscal policy», L. Schuknecht CFS working paper.
QE moral hazard: cheap
financing taken as
permanent
25
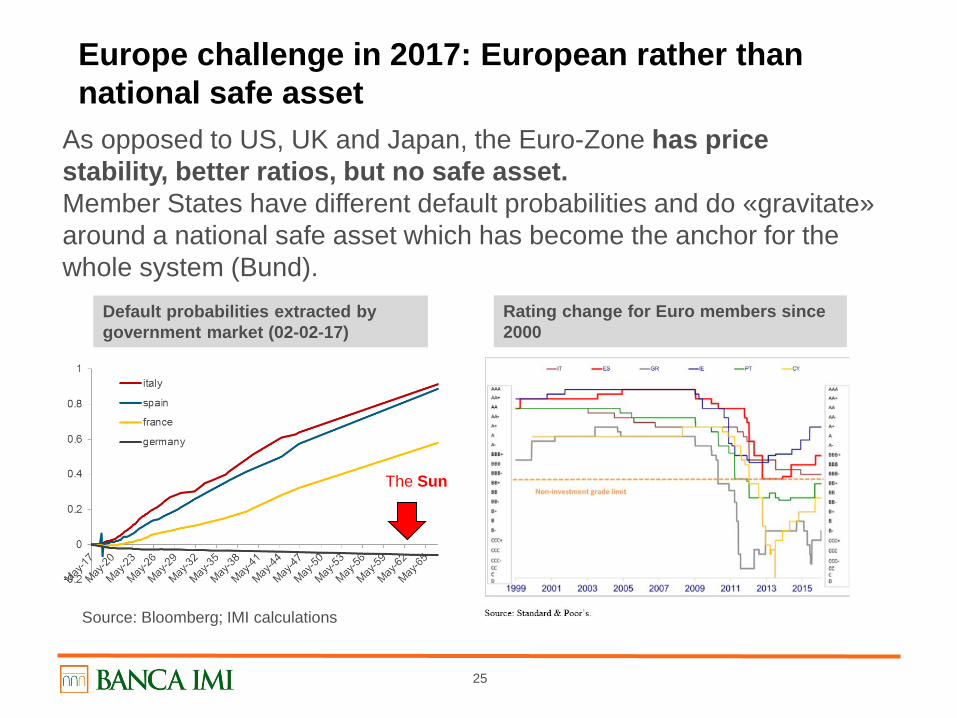
Europe challenge in 2017: European rather than national safe asset
As opposed to US, UK and Japan, the Euro-Zone has price stability, better ratios, but no safe asset. Member States have different default probabilities and do «gravitate» around a national safe asset which has become the anchor for the whole system (Bund).
Default probabilities extracted by government market (02-02-17)
Rating change for Euro members since 2000
Source: Bloomberg; IMI calculations
The Sun
26
Europe challenge in 2017: «European» rather than «national» safe asset
This evolution has reinforced the economic divergences intra Europe, by fragmenting further the financial system*:
altering the cost of credit intra Europe;
reducing the ability to diversify;
creating destabilizing capital outflows, alternatively, in search for yield or for safeness.
At current stage, Eurobonds are politically (joint liabilities and Treaty changes) and, probably, economically unfeasible (they could end up being credit negative).
Using some Financial Engineering two schemes have been proposed.
Currently, the European Systemic Risk board has started to study the options with a Task force on the subject.
* “Addressing the safety trilemma: A safe sovereign asset for the eurozone”, Ad van Riet, Oct16
27
Europe challenge in 2017: financial engineering Nasbies or National safe bond (Bundesbank*, July 2016) Each national bond is issued in 2 tranches (Senior and Junior), with defined loss distribution. In the simplest way, assuming a division 30%/70%, any traditional bond can be decomposed in: 30% Senior tranche with loss for recovery value <30%; 70% Junior tranche containing all the loss up to a recovery
value >= 30%.
The created tranches would be very similar between countries, trading on perceived differences in recovery value.
The tranching would increase AAA assets from ca 1.9tr (Germany & Netherlands) to 3.6tr, or almost 50% of the European Gov. Debt (7.5tr).
We can simplify saying that the Junior loss bear the «default risk», the Senior tranche the «recovery risk». * Bundesbank monthly
28
Europe challenge in 2017: financial engineering
The Senior Tranche could be used:
to reduce the home bias of the banks portfolios (regulatory reasons);
for QE, to increase the pool of eligible assets and to create an almost risk free yield curve, eventually allowing yield curve targeting;
with a guarantee by ESM they could become fungible and represent a light start for an European bond market. In this case, the joint guarantees on the senior tranches would make any other «national» asset trade at positive spread.
The tranching would not change each country liabilities' structure. The tranches could trade separate or together (in analogy with the stripped market) and they could also be used to build new structures (junior coupon and senior bulk).
An eventual restructuring process would not be complicate.
29
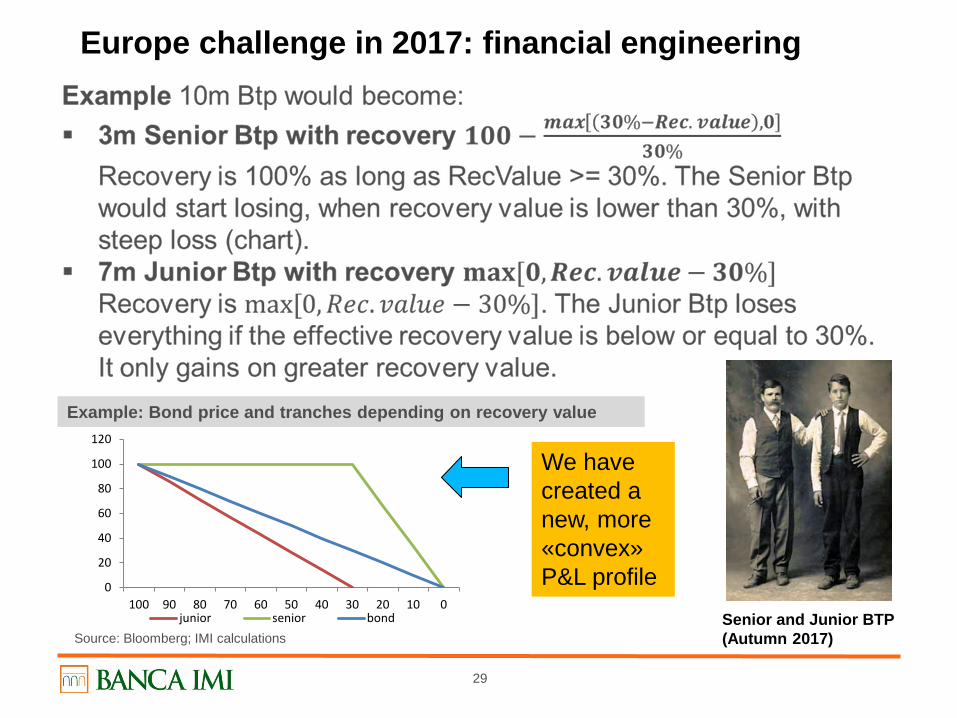
Europe challenge in 2017: financial engineering
Example: Bond price and tranches depending on recovery value
0
20
40
60
80
100
120
100 90 80 70 60 50 40 30 20 10 0junior senior bond
We have created a new, more «convex» P&L profile
Senior and Junior BTP (Autumn 2017) Source: Bloomberg; IMI calculations
30
Europe challenge in 2017: financial engineering
Esbies or European safe bond (Brunnemeier, 2016) are more complicated. They entail pooling and tranching a portfolio of government bonds (capital keys weighted). The authors estimate that with a 30% junior tranche is possible to get to AAA expected loss exploiting the correlation and diversification of the assets.
The amount of safe assets (AAA tranche) would equal 5.8 tr.
The Senior tranche would be granted preferential treatment .
I find this solution too complex, DIFFICULT TO PRICE and long “tail risk” (high correlation). Also due to the pooling, an eventual restructuring would be complex.
31
Yield curve to come
1 2016 Experimental policy
2 Possible themes in 2017: European safe asset?
3 Markets
32
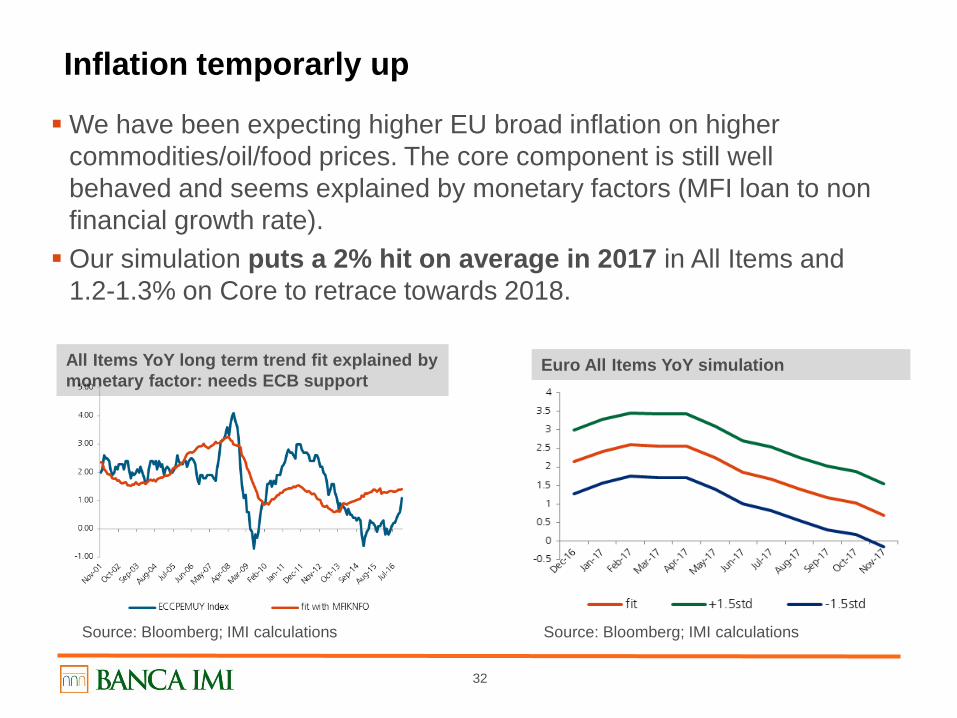
Inflation temporarly up
We have been expecting higher EU broad inflation on higher commodities/oil/food prices. The core component is still well behaved and seems explained by monetary factors (MFI loan to non financial growth rate). Our simulation puts a 2% hit on average in 2017 in All Items and
1.2-1.3% on Core to retrace towards 2018.
All Items YoY long term trend fit explained by monetary factor: needs ECB support
Euro All Items YoY simulation
Source: Bloomberg; IMI calculations Source: Bloomberg; IMI calculations
33
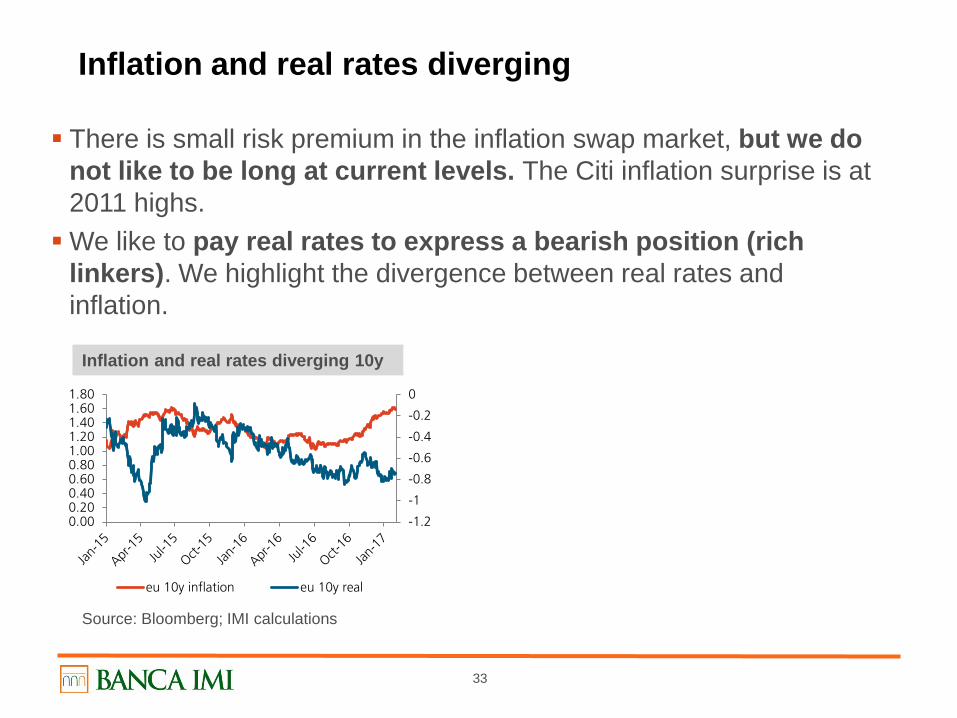
Inflation and real rates diverging
There is small risk premium in the inflation swap market, but we do not like to be long at current levels. The Citi inflation surprise is at 2011 highs. We like to pay real rates to express a bearish position (rich
linkers). We highlight the divergence between real rates and inflation.
Inflation and real rates diverging 10y
-1.2
-1
-0.8
-0.6
-0.4
-0.2
0
0.000.200.400.600.801.001.201.401.601.80
eu 10y inflation eu 10y real
Source: Bloomberg; IMI calculations
34
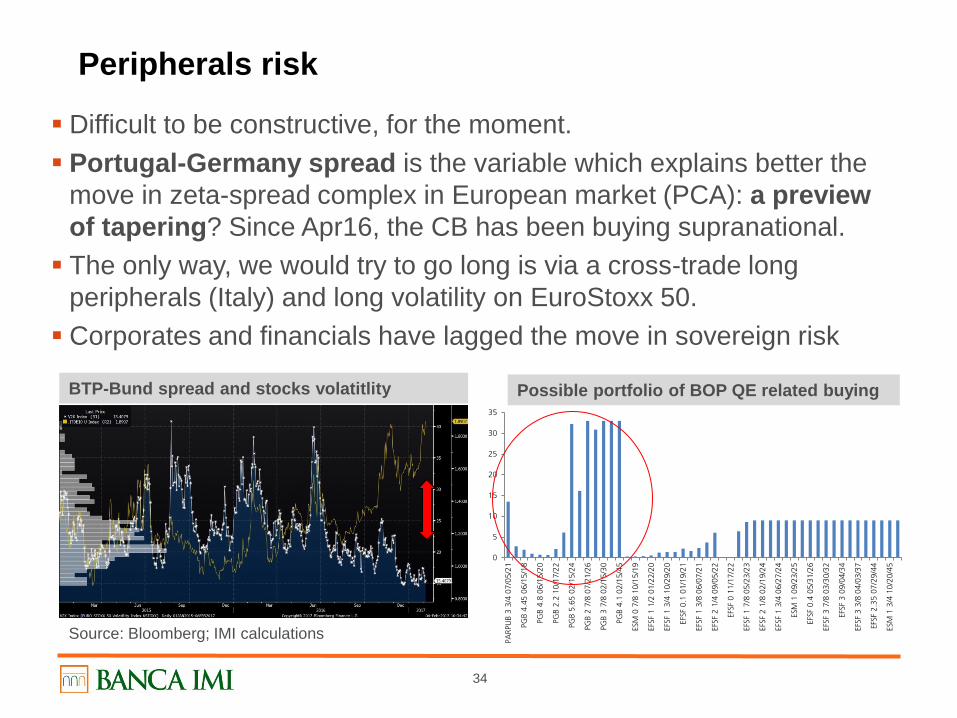
Peripherals risk
Difficult to be constructive, for the moment. Portugal-Germany spread is the variable which explains better the
move in zeta-spread complex in European market (PCA): a preview of tapering? Since Apr16, the CB has been buying supranational. The only way, we would try to go long is via a cross-trade long
peripherals (Italy) and long volatility on EuroStoxx 50. Corporates and financials have lagged the move in sovereign risk
Source: Bloomberg; IMI calculations
0
5
10
15
20
25
30
35
PARP
UB
3 3/
4 07
/05/
21
PGB
4.45
06/
15/1
8
PGB
4.8
06/1
5/20
PGB
2.2
10/1
7/22
PGB
5.65
02/
15/2
4
PGB
2 7/
8 07
/21/
26
PGB
3 7/
8 02
/15/
30
PGB
4.1
02/1
5/45
ESM
0 7
/8 1
0/15
/19
EFSF
1 1
/2 0
1/22
/20
EFSF
1 3
/4 1
0/29
/20
EFSF
0.1
01/
19/2
1
EFSF
1 3
/8 0
6/07
/21
EFSF
2 1
/4 0
9/05
/22
EFSF
0 1
1/17
/22
EFSF
1 7
/8 0
5/23
/23
EFSF
2 1
/8 0
2/19
/24
EFSF
1 3
/4 0
6/27
/24
ESM
1 0
9/23
/25
EFSF
0.4
05/
31/2
6
EFSF
3 7
/8 0
3/30
/32
EFSF
3 0
9/04
/34
EFSF
3 3
/8 0
4/03
/37
EFSF
2.3
5 07
/29/
44
ESM
1 3
/4 1
0/20
/45
BTP-Bund spread and stocks volatitlity Possible portfolio of BOP QE related buying
35
Directional rates: bearish but with hedge
We would keep a duration short, hedged with cheap protection on equity. There seems to be a lot of good news priced in the US equity market, in what has been called the «TRUMP SQUARED» effect (by Shiller). Looking at term premia in rates market, Euro rates are much richer
than US, but given political situation, we would not play the spread. We suggest a long in OIL volatility as a good hedge for
geopolitical risk.
36
Disclaimer This marketing communication has been prepared by the Trading Strategist department and is distributed by Banca IMI, a bank belonging to the Intesa Sanpaolo Banking Group which is authorized to carry out investment services in Italy and is regulated by the Bank of Italy and Consob. The information contained in this document: constitutes a marketing communication and, as such, it has not been prepared in accordance with the legal requirements designed to promote the independence of investment research and is not subject to any prohibition on dealing ahead of the dissemination of investment research; may differ from the recommendations prepared by financial analysts of the Direzione Studi e Ricerche of Intesa Sanpaolo and distributed by Banca IMI. The information contained herein does not constitute investment research within in the meaning of applicable regulatory rules in EU, or a solicitation or invitation, or investment advice, and does not purport to offer legal, tax or any other advice. Neither the Intesa Sanpaolo Banking Group, nor any officer, representative or employee thereof accepts any liability (for negligence or otherwise) for any direct or consequential losses arising from any use of information including, without limitation, the reliance on any such information contained in this communication. The information and views contained in this communication are based on sources believed to be reliable and in good faith. No representation or warranty is made as to their accuracy or correctness. The views, forecasts and estimates contained in this communication reflect the personal view of the author as of the date of its publication. The views may differ from those of others within the Intesa Sanpaolo Banking Group. All prices and rates included herein are shown for indication only and should not be relied upon to re-evaluate any positions held by any recipient of this document. For specific quotations, please contact your Banca IMI usual contact. There is no guarantee that the future results or any other future events will be consistent with the views, forecasts and estimates contained in this communication. Furthermore, any information included herein is subject to change by the author after the date of its publication without any notice by Banca IMI to the person to whom this communication has been distributed. Information about the basic elements and the methodology used for the purposes of evaluation are available on the website at https://www.bancaimi.com/bancaimi/Banca-IMI-Global-Strategy-reports.html#GlobalCreditOverview This document is intended for distribution in Italy and in the Member States of the European Union only to professional clients and eligible counterparties, as defined in the MiFID Directive 2004/39/EC, either as a printed document and/or electronic form. Trading Strategist Certification The Trading Strategist who prepared this report, and whose names and roles appear on the first page, certify that: The views expressed on companies mentioned herein accurately reflect independent, fair and balanced personal views; No direct or indirect compensation has been or will be received in exchange for any views expressed. Other information Neither the Trading Strategist nor any member of the Trading Strategist’s household has a financial interest in the securities. Conflicts of interest Banca IMI S.p.A. and the other companies belonging to Intesa Sanpaolo Banking Group (jointly, the "Intesa Sanpaolo Group") provide all services in the lending and securities industry, carrying out in particular – through its companies in possession of the necessary authorizations, where required – investment banking, corporate finance and finance and investment activities – through merchant banking activities and proprietary trading - financial advisory, investment research and financial analysis or other forms of general recommendation regarding transactions on financial instruments, securities issuance, placement activities, reception and transmission of orders, execution of orders for clients and dealing for own account in financial instruments, portfolio management, including the management of collective investment schemes and the management of multilateral trading facilities.
37
Disclaimer The Intesa Sanpaolo Banking Group is involved in a wide range of commercial and investment banking and other activities (including investment management, sales and trading of securities related activities) out of which may from time to time arise an interest in the issuers and in the financial instruments, including related financial instruments, or transactions referred to in this communication. Such interests may include i) having, at any time, significant directional positions, long or short, trading activity which could be also contrary to the views expressed herein; ii) holding financial instruments under pledge; iii) trading, on behalf of themselves or of their clients, the financial instruments, including related financial instruments, or financial instruments whose value is dependent upon, or is linked to, the financial instruments, issuers, parameters or indices referred to herein; iv) granting loans to companies whose securities are discussed herein; v) holding significant shareholdings and possibly appointing board members and/or other corporate bodies member, and participating in shareholders’ agreements; vi) providing banking, credit or other financial services to the issuers of the financial instruments referred to herein, including their controlling companies or other companies belonging to the issuer’s group. Banca IMI may act in the capacity of sponsor, specialist, listing partner, market maker, corporate broking and/or liquidity provider or in any other similar capacity with regard to the financial instruments, including related financial instruments, referred to herein. In consideration of the above, Banca IMI S.p.A. states that has adopted written guidelines “Modello di Organizzazione, Gestione e Controllo” pursuant to Legislative Decree June 8, 2001 n. 231 (available at the Intesa Sanpaolo website, webpage http://www.group.intesasanpaolo.com/scriptIsir0/si09/governance/ita_wp_governance.jsp, along with a summary sheet, webpage https://www.bancaimi.com/en/bancaimi/chisiamo/documentazione/mifid.) setting forth practices and procedures, in accordance with applicable regulations by the competent Italian authorities and best international practice, including those known as Chinese Walls, to restrict the flow of information, namely inside and/or confidential information, to prevent misuse of such information and to prevent any conflicts of interest may adversely affect the interests of the customer in accordance with current regulations. Furthermore, in relation to the government securities potentially mentioned within this marketing communication, we disclose that Banca IMI S.p.A. acts as market maker in the wholesale markets for the government securities of the main European countries and also acts as Government Bond Specialist, or comparable assignment, for the government securities issued by the Republic of Italy, by the Federal Republic of Germany, by the Hellenic Republic, by the European Stability Mechanism and by the European Financial Stability Facility. This communication is for exclusive use by the person to whom has been distributed by Banca IMI and may not be reproduced or redistributed, directly or indirectly, to any other person or published, fully or partially, for any reason whatsoever, without the prior written consent of Banca IMI. The copyright and any other intellectual rights on data, information, opinions and estimates referred to herein belong to the Intesa Sanpaolo Banking Group, unless otherwise stated. Such data, information, opinions and estimates may not be fully or partially distributed or reproduced in any form, and by any means, without the prior written consent of Banca IMI. Any recipient of this communication is required to comply with the above requirements.