LONDON BOROUGH OF BRENT Accounts 2011-2012.… · LONDON BOROUGH OF BRENT STATEMENT OF ACCOUNTS ......
147
LONDON BOROUGH OF BRENT STATEMENT OF ACCOUNTS 2011/12 C O N T E N T S Page INTRODUCTION BY DEPUTY DIRECTOR OF FINANCE AND CORPORATE SERVICES 1 EXPLANATORY FOREWORD 2 INDEPENDENT AUDITOR’S REPORT TO MEMBERS OF THE LONDON BOROUGH OF BRENT 12 STATEMENT OF RESPONSIBILITIES 16 STATEMENT OF ACCOUNTING POLICIES 18 BRENT CORE FINANCIAL STATEMENTS Movement in Reserves Statement 31 Comprehensive Income and Expenditure Statement 33 Balance Sheet 34 Cash Flow Statement 35 NOTES TO THE CORE FINANCIAL STATEMENTS 36 BRENT SUPPLEMENTARY FINANCIAL STATEMENTS - Housing Revenue Account 103 - The Collection Fund 109 GROUP ACCOUNTS 112 BRENT PENSION FUND ACCOUNTS 118 GLOSSARY AND ABBREVIATIONS 142
Transcript of LONDON BOROUGH OF BRENT Accounts 2011-2012.… · LONDON BOROUGH OF BRENT STATEMENT OF ACCOUNTS ......

LONDON BOROUGH OF BRENT
STATEMENT OF ACCOUNTS
2011/12
C O N T E N T S
Page
INTRODUCTION BY DEPUTY DIRECTOR OF FINANCE AND CORPORATE SERVICES 1
EXPLANATORY FOREWORD 2
INDEPENDENT AUDITOR’S REPORT TO MEMBERS OF THE LONDON BOROUGH OF BRENT 12
STATEMENT OF RESPONSIBILITIES 16
STATEMENT OF ACCOUNTING POLICIES 18
BRENT CORE FINANCIAL STATEMENTS
Movement in Reserves Statement 31
Comprehensive Income and Expenditure Statement 33
Balance Sheet 34
Cash Flow Statement 35
NOTES TO THE CORE FINANCIAL STATEMENTS 36
BRENT SUPPLEMENTARY FINANCIAL STATEMENTS
- Housing Revenue Account 103
- The Collection Fund 109
GROUP ACCOUNTS 112
BRENT PENSION FUND ACCOUNTS 118
GLOSSARY AND ABBREVIATIONS 142

1
INTRODUCTION BY THE DEPUTY DIRECTOR OF FINANCE AND CORPORATE SERVICES Brent’s annual accounts show the financial performance of the Council for the year 2011/12. They present the financial position of the Council on 31st March 2012 and its income and expenditure for the year ending on that date. It is intended that these accounts will provide a useful and important source of financial information for the community, Council Members and other interested parties. The Explanatory Foreword on the next few pages gives a brief summary of the Council’s financial position in 2011/12. I should also like to thank my staff and colleagues throughout the Council for their hard work and support during the year. Date:
MICK BOWDEN Deputy Director of Finance and Corporate Services

2
EXPLANATORY FOREWORD 1. INTRODUCTION The accounts for the year 2011/12 consist of: Statement of Accounting Policies - This explains the basis of the figures in the accounts. The
accounts can be properly appreciated only if the policies which have been followed in dealing with material items are explained.
CORE FINANCIAL STATEMENTS
Movement in Reserves Statement (MiRS) - This splits reserves into usable and unusable usable reserves including General fund balances.
Comprehensive Income and Expenditure Statement – This shows the accounting costs of
providing services. This may be different to the amount raised from taxation in accordance with regulations. Differences are shown in the MiRS.
Balance Sheet - This is fundamental to the understanding of the Council’s year-end financial
position. It shows the balances and reserves at the Council’s disposal and its long term indebtedness, the net current assets employed in its operations, and summarised information on the long term assets held. It excludes the Pension Fund.
Cash Flow Statement - This summarises the inflows and outflows of cash arising from transactions
with third parties.
SUPPLEMENTARY FINANCIAL STATEMENTS Housing Revenue Account - This reflects a statutory obligation to account separately for the
Council’s housing provision. It shows the major elements of housing expenditure and income. Collection Fund - The Collection Fund accounts independently for income related to Council Tax
and Non-Domestic Rates on behalf of those bodies (including the Council’s own General Fund) for whom the income has been raised.
Group Accounts - In line with accounting requirements, group accounts are shown for Brent and its subsidiary Brent Housing Partnership (BHP).
Pension Fund - The Pension Fund is separately managed by Brent and the Fund’s accounts are
separate from the Council’s accounts. The accounts have been produced in line with the requirements of the 2011 Accounts and Audit
Regulations, the 2011/12 Code of Practice on Local Council Accounting in the United Kingdom issued by the Chartered Institute of Public Finance and Accountancy (CIPFA), and the Audit Commission Act 1998, except where specifically stated in the Statement of Accounting Policies.
3
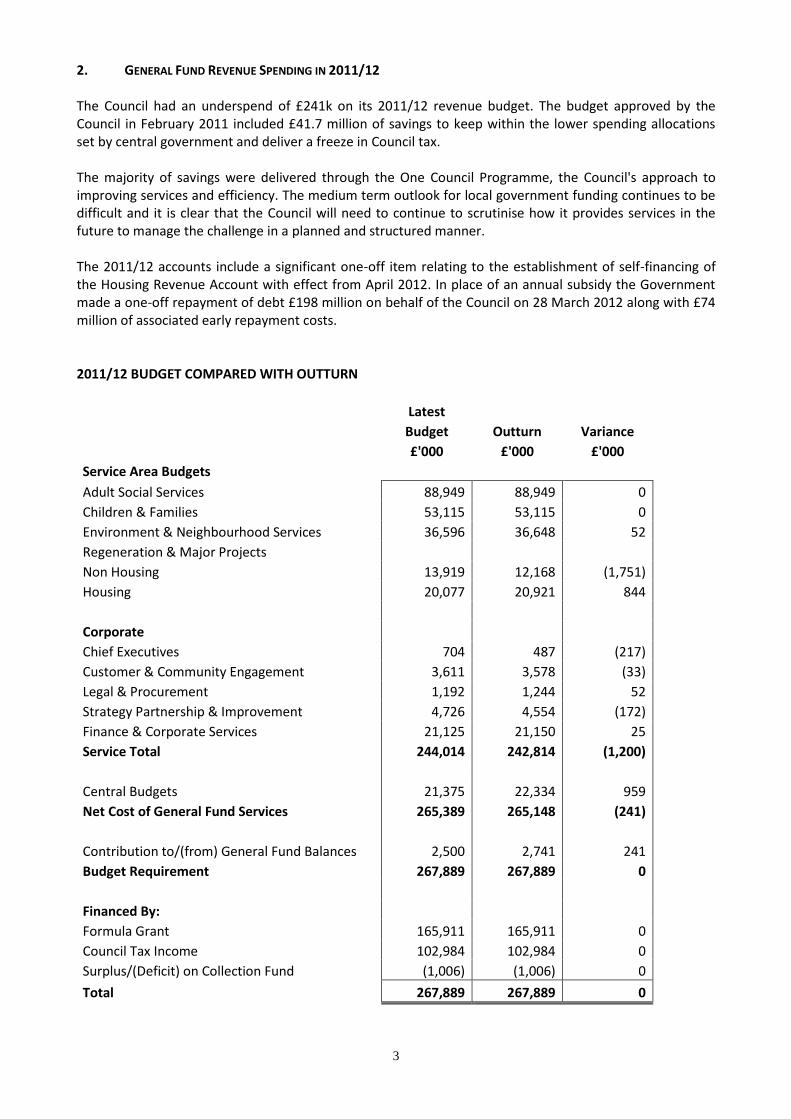
2. GENERAL FUND REVENUE SPENDING IN 2011/12 The Council had an underspend of £241k on its 2011/12 revenue budget. The budget approved by the Council in February 2011 included £41.7 million of savings to keep within the lower spending allocations set by central government and deliver a freeze in Council tax. The majority of savings were delivered through the One Council Programme, the Council's approach to improving services and efficiency. The medium term outlook for local government funding continues to be difficult and it is clear that the Council will need to continue to scrutinise how it provides services in the future to manage the challenge in a planned and structured manner. The 2011/12 accounts include a significant one-off item relating to the establishment of self-financing of the Housing Revenue Account with effect from April 2012. In place of an annual subsidy the Government made a one-off repayment of debt £198 million on behalf of the Council on 28 March 2012 along with £74 million of associated early repayment costs. 2011/12 BUDGET COMPARED WITH OUTTURN
Latest
Budget Outturn Variance
£'000 £'000 £'000
Service Area Budgets
Adult Social Services 88,949 88,949 0
Children & Families 53,115 53,115 0
Environment & Neighbourhood Services 36,596 36,648 52
Regeneration & Major Projects
Non Housing 13,919 12,168 (1,751)
Housing 20,077 20,921 844
Corporate
Chief Executives 704 487 (217)
Customer & Community Engagement 3,611 3,578 (33)
Legal & Procurement 1,192 1,244 52
Strategy Partnership & Improvement 4,726 4,554 (172)
Finance & Corporate Services 21,125 21,150 25
Service Total 244,014 242,814 (1,200)
Central Budgets 21,375 22,334 959
Net Cost of General Fund Services 265,389 265,148 (241)
Contribution to/(from) General Fund Balances 2,500 2,741 241
Budget Requirement 267,889 267,889 0
Financed By:
Formula Grant 165,911 165,911 0
Council Tax Income 102,984 102,984 0
Surplus/(Deficit) on Collection Fund (1,006) (1,006) 0
Total 267,889 267,889 0
4
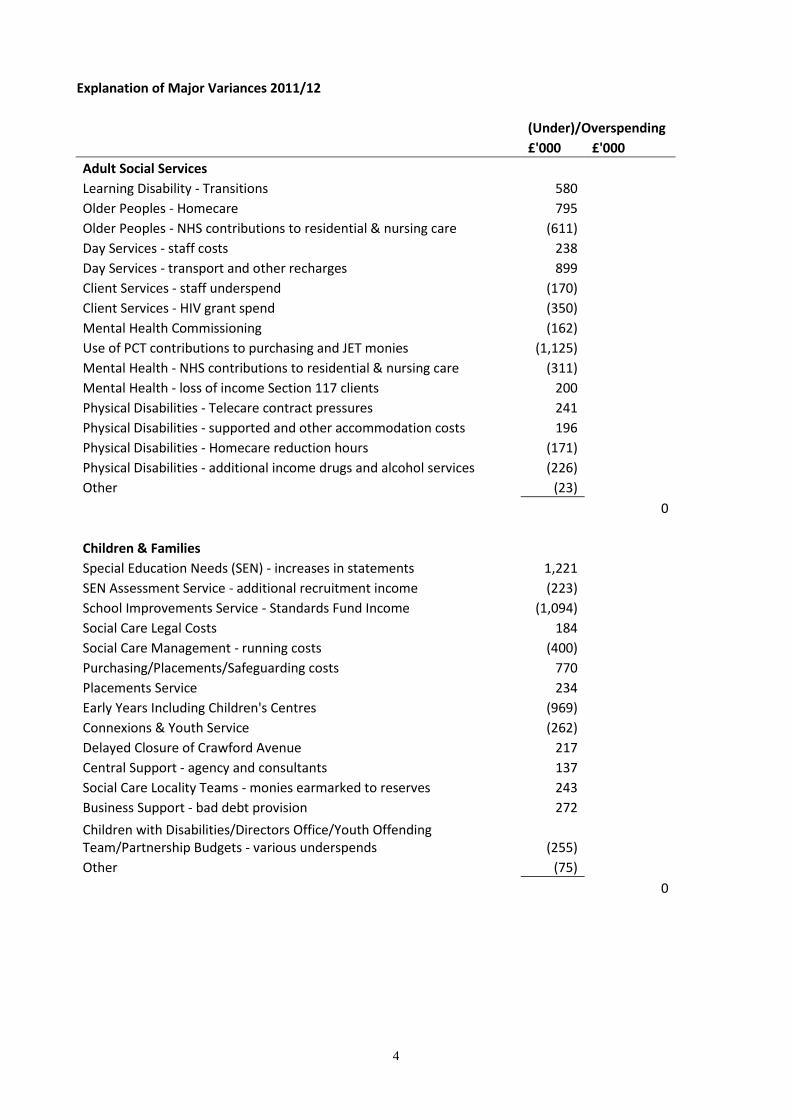
Explanation of Major Variances 2011/12
(Under)/Overspending
£'000 £'000
Adult Social Services
Learning Disability - Transitions 580
Older Peoples - Homecare 795
Older Peoples - NHS contributions to residential & nursing care (611)
Day Services - staff costs 238
Day Services - transport and other recharges 899
Client Services - staff underspend (170)
Client Services - HIV grant spend (350)
Mental Health Commissioning (162)
Use of PCT contributions to purchasing and JET monies (1,125)
Mental Health - NHS contributions to residential & nursing care (311)
Mental Health - loss of income Section 117 clients 200
Physical Disabilities - Telecare contract pressures 241
Physical Disabilities - supported and other accommodation costs 196
Physical Disabilities - Homecare reduction hours (171)
Physical Disabilities - additional income drugs and alcohol services (226)
Other (23)
0
Children & Families
Special Education Needs (SEN) - increases in statements 1,221
SEN Assessment Service - additional recruitment income (223)
School Improvements Service - Standards Fund Income (1,094)
Social Care Legal Costs 184
Social Care Management - running costs (400)
Purchasing/Placements/Safeguarding costs 770
Placements Service 234
Early Years Including Children's Centres (969)
Connexions & Youth Service (262)
Delayed Closure of Crawford Avenue 217
Central Support - agency and consultants 137
Social Care Locality Teams - monies earmarked to reserves 243
Business Support - bad debt provision 272
Children with Disabilities/Directors Office/Youth Offending Team/Partnership Budgets - various underspends (255)
Other (75)
0

5
(Under)/Overspending
£'000 £'000
Environment & Neighbourhood
Parks and Cemeteries (183)
Libraries, Arts and Heritage costs 416
Transportation - staff vacancies and NRASWA income (662)
Sports & Community Facilities (109)
Emergency Planning 198
Waste & Recycling 591
Safer Streets 551
Transport Services (759)
Business Support (118)
Directorate - Accommodation & staffing 82
Other 45
52 Regeneration & Major Projects
Housing
Housing Solutions - staff vacancies (95)
Supporting People - reduced contract costs (170)
General Fund contribution to landlord communal services 230
Housing Resource Centre - Staff costs (300)
Temporary Accommodation - payments to Housing Associations 210
Temporary Accommodation - monies earmarked for costs of benefit caps 1,000
Other (31)
844
Non Housing
Directorate & Business Support - lower spend on Wembley Works (736)
Planning & Building Control - Shortfall in income and monies set aside for planning inquiries 248
Major Projects - slippage in projects (1,335)
Other 72
(1,751)

6
(Under)/Overspending
£'000 £'000
Corporate
Chief Executives Office
Underspend on performance fund (200)
Other (17)
(217) Customer & Community Engagement
Registration & Nationality Service (106)
Print Shop - Income Shortfall 93
Other (21)
(34) Legal & Procurement
Procurement - staffing costs 166
Legal & democratic services - additional income and staff costs (110)
Other (3)
53 Strategy, Partnerships & Improvement
Programme Management Office - staffing (99)
Monies earmarked for projects - 2012/13 246
Environment Policy - land charge income/grant income / staff costs (267)
Other (52)
(172) Finance & Corporate Services
Information Technology - termination of photocopier leases 668
Customer Services - central item income (280)
Customer Services - operational savings following restructure (459)
Audit - staff vacancies (123)
People & Development - training, recruitment costs, staff costs and overachievement of school income (500)
Financial Services - write off of Council wide debt and balance sheet review 719
25
7
(Under)/Overspending
£'000 £'000
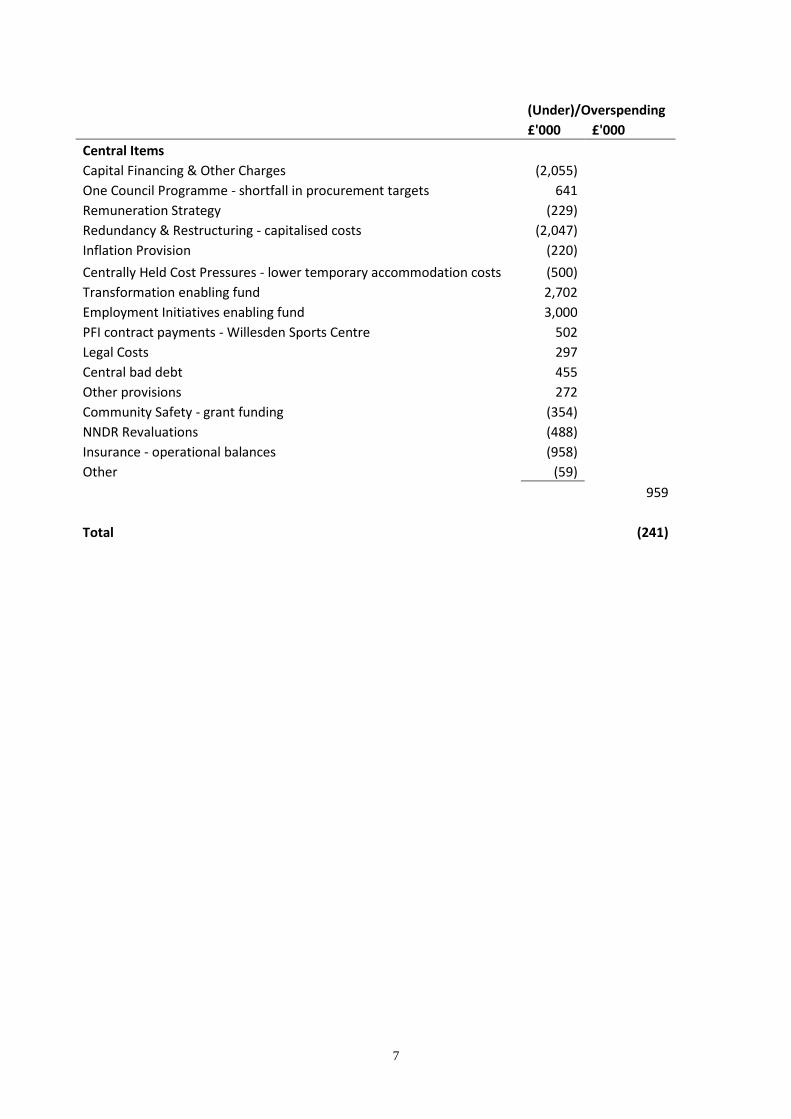
Central Items
Capital Financing & Other Charges (2,055)
One Council Programme - shortfall in procurement targets 641
Remuneration Strategy (229)
Redundancy & Restructuring - capitalised costs (2,047)
Inflation Provision (220)
Centrally Held Cost Pressures - lower temporary accommodation costs (500)
Transformation enabling fund 2,702
Employment Initiatives enabling fund 3,000
PFI contract payments - Willesden Sports Centre 502
Legal Costs 297
Central bad debt 455
Other provisions 272
Community Safety - grant funding (354)
NNDR Revaluations (488)
Insurance - operational balances (958)
Other (59)
959
Total (241)

8
3. Capital Expenditure – Disclosure The Councils in-year expenditure in 2011/12 was £124.423m (2010/11 £114.245m). The Expenditure was within the definition of capital expenditure within the Local Government and Housing Act 1989. Capital expenditure has been financed from the following sources:
Funding Source 2011/12 £000
Borrowing 48,518
Grants 49,998
Capital Receipts 10,080
Major Repairs Reserve 3,575
General Fund Contributions 9,030
HRA Contributions 3,222
Total 124,423
Capital Projects and other significant capital expenditure in excess of £500k during the year were as follows:
Scheme 2011/12 £000
Council Housing 10,835
Housing Renovation Grants 4,169
Civic Centre 34,042
South Kilburn Regeneration 7,189
Roundwood Youth Centre 3,102
Devolved Formula 1,201
Academies Programme 6,149
Schools Asset Management Plan 1,310
Primary Capital Programme 4,103
School Expansions 17,871
SEN Schools 7,935
School’s Capitalised Expenditure 3,377
Priority Backlog Repairs to Operational Buildings 917
Transportation 4,179
Access Corridors 593
Pavements and Roads 5,063
Purchase of Waste Caddies and Kerbside Containers 1,830
Contaminated Land 795
Sports Strategy 550
ICT Schemes 1,780
Redundancy 2,358
9
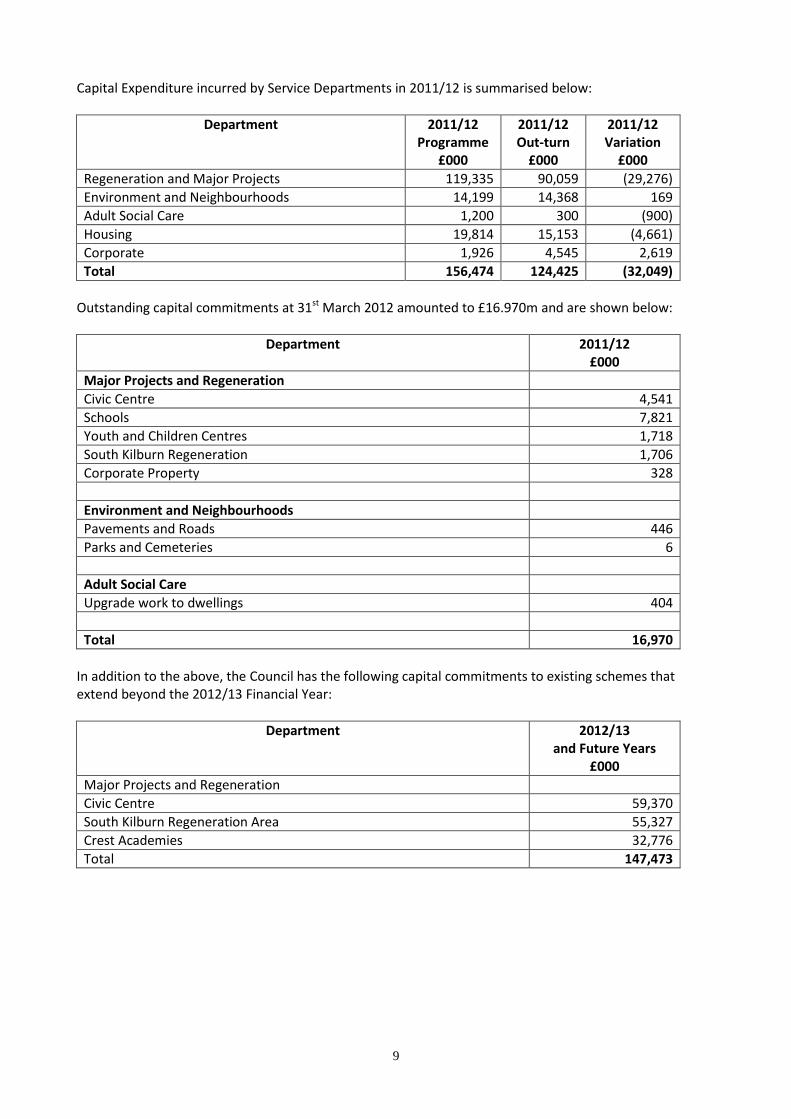
Capital Expenditure incurred by Service Departments in 2011/12 is summarised below:
Department 2011/12 Programme
£000
2011/12 Out-turn
£000
2011/12 Variation
£000
Regeneration and Major Projects 119,335 90,059 (29,276)
Environment and Neighbourhoods 14,199 14,368 169
Adult Social Care 1,200 300 (900)
Housing 19,814 15,153 (4,661)
Corporate 1,926 4,545 2,619
Total 156,474 124,425 (32,049)
Outstanding capital commitments at 31st March 2012 amounted to £16.970m and are shown below:
Department 2011/12 £000
Major Projects and Regeneration
Civic Centre 4,541
Schools 7,821
Youth and Children Centres 1,718
South Kilburn Regeneration 1,706
Corporate Property 328
Environment and Neighbourhoods
Pavements and Roads 446
Parks and Cemeteries 6
Adult Social Care
Upgrade work to dwellings 404
Total 16,970
In addition to the above, the Council has the following capital commitments to existing schemes that extend beyond the 2012/13 Financial Year:
Department 2012/13 and Future Years
£000
Major Projects and Regeneration
Civic Centre 59,370
South Kilburn Regeneration Area 55,327
Crest Academies 32,776
Total 147,473
10
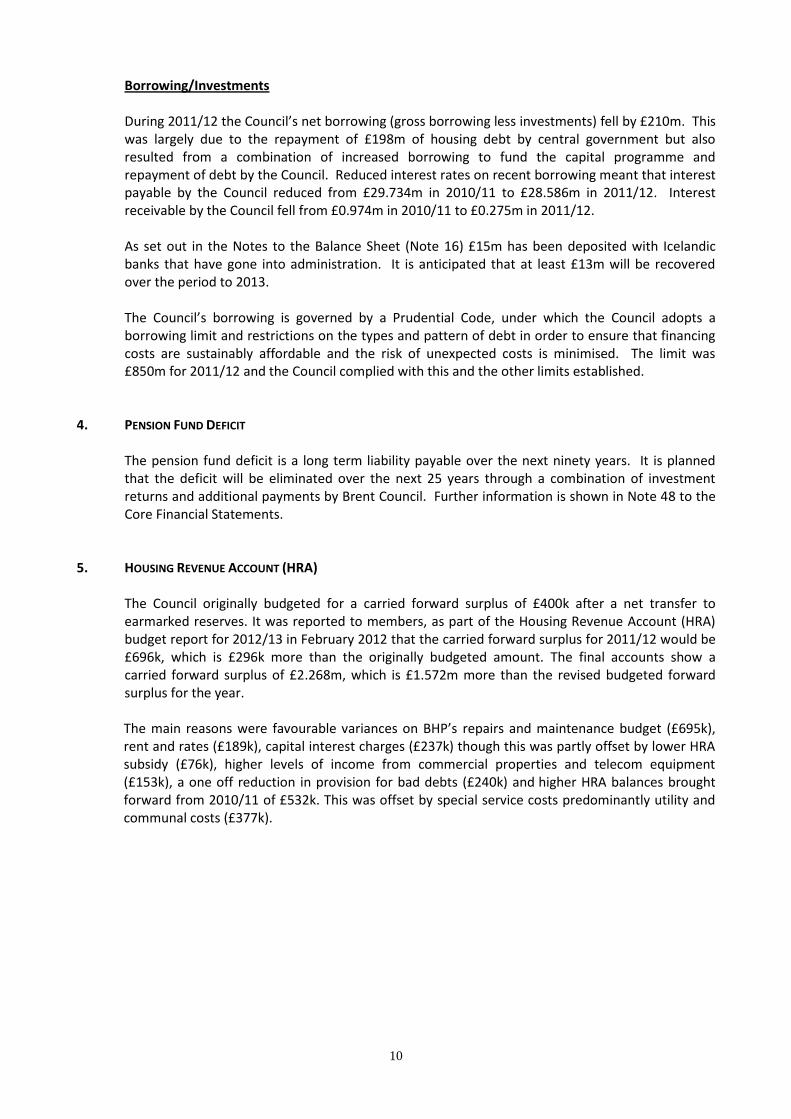
Borrowing/Investments
During 2011/12 the Council’s net borrowing (gross borrowing less investments) fell by £210m. This was largely due to the repayment of £198m of housing debt by central government but also resulted from a combination of increased borrowing to fund the capital programme and repayment of debt by the Council. Reduced interest rates on recent borrowing meant that interest payable by the Council reduced from £29.734m in 2010/11 to £28.586m in 2011/12. Interest receivable by the Council fell from £0.974m in 2010/11 to £0.275m in 2011/12. As set out in the Notes to the Balance Sheet (Note 16) £15m has been deposited with Icelandic banks that have gone into administration. It is anticipated that at least £13m will be recovered over the period to 2013. The Council’s borrowing is governed by a Prudential Code, under which the Council adopts a borrowing limit and restrictions on the types and pattern of debt in order to ensure that financing costs are sustainably affordable and the risk of unexpected costs is minimised. The limit was £850m for 2011/12 and the Council complied with this and the other limits established.
4. PENSION FUND DEFICIT
The pension fund deficit is a long term liability payable over the next ninety years. It is planned that the deficit will be eliminated over the next 25 years through a combination of investment returns and additional payments by Brent Council. Further information is shown in Note 48 to the Core Financial Statements.
5. HOUSING REVENUE ACCOUNT (HRA) The Council originally budgeted for a carried forward surplus of £400k after a net transfer to earmarked reserves. It was reported to members, as part of the Housing Revenue Account (HRA) budget report for 2012/13 in February 2012 that the carried forward surplus for 2011/12 would be £696k, which is £296k more than the originally budgeted amount. The final accounts show a carried forward surplus of £2.268m, which is £1.572m more than the revised budgeted forward surplus for the year. The main reasons were favourable variances on BHP’s repairs and maintenance budget (£695k), rent and rates (£189k), capital interest charges (£237k) though this was partly offset by lower HRA subsidy (£76k), higher levels of income from commercial properties and telecom equipment (£153k), a one off reduction in provision for bad debts (£240k) and higher HRA balances brought forward from 2010/11 of £532k. This was offset by special service costs predominantly utility and communal costs (£377k).
11
6. SIGNIFICANT CHANGES FROM LAST YEAR’S ACCOUNTS Financial Reporting Standard (FRS) 30 has changed requirements about heritage assets for the
2011/12 audited accounts. A tangible heritage asset is an asset with historical, artistic, scientific, technological, geophysical or environmental qualities that is held and maintained principally for its contribution to knowledge and culture. Heritage assets are recognised as a separate class of assets for the first time in the 2011/12 statement of accounts.
Latest advice from CIPFA and legislative changes has altered the treatment of Foundation Schools
non-current assets. They are no longer shown on Brent’s Balance Sheet at 31.03.12 and previous accounts have been amended as a prior period adjustment.
7. FURTHER INFORMATION Further information on these accounts may be obtained by writing to the Director of Finance and
Corporate Services, Room 114, Brent Town Hall, Wembley HA9 9HD or by e-mail from [email protected].
8. GLOSSARY
In the accounts which follow some technical accounting terms are used. Whenever possible, these are explained at the appropriate places in the accounts. However, if further information is needed please see the glossary of terms at the end of the accounts.
12
INDEPENDENT AUDITOR’S REPORT TO MEMBERS OF THE LONDON BOROUGH OF BRENT
OPINION ON THE AUTHORITY’S FINANCIAL STATEMENTS
I have audited the financial statements of the London Borough of Brent for the year ended 31 March 2012
under the Audit Commission Act 1998. The financial statements comprise the Authority and Group
Movement in Reserves Statement, the Authority and Group Comprehensive Income and Expenditure
Statement, the Authority and Group Balance Sheet, the Authority and Group Cash Flow Statement, the
Housing Revenue Account Income and Expenditure Statement, the Movement on the Housing Revenue
Account Statement and Collection Fund and the related notes. The financial reporting framework that has
been applied in their preparation is applicable law and the CIPFA/LASAAC Code of Practice on Local
Authority Accounting in the United Kingdom 2011/12.
This report is made solely to the Members of the London Borough of Brent in accordance with Part II of the
Audit Commission Act 1998 and for no other purpose, as set out in paragraph 48 of the Statement of
Responsibilities of Auditors and Audited Bodies published by the Audit Commission in March 2010.
RESPECTIVE RESPONSIBILITIES OF THE RESPONSIBLE FINANCIAL OFFICER AND AUDITOR
As explained more fully in the Statement of Responsibilities for the Accounts, the Responsible Financial
Officer is responsible for the preparation of the Statement of Accounts, which includes the financial
statements, in accordance with proper practices as set out in the CIPFA/LASAAC Code of Practice on Local
Authority Accounting in the United Kingdom, and for being satisfied that they give a true and fair view. My
responsibility is to audit and express an opinion on the financial statements in accordance with applicable
law and International Standards on Auditing (UK and Ireland). Those standards require me to comply with
the Auditing Practices Board’s Ethical Standards for Auditors. SCOPE OF THE AUDIT OF THE FINANCIAL STATEMENTS
An audit involves obtaining evidence about the amounts and disclosures in the financial statements
sufficient to give reasonable assurance that the financial statements are free from material misstatement,
whether caused by fraud or error. This includes an assessment of: whether the accounting policies are
appropriate to the Council’s circumstances and have been consistently applied and adequately disclosed;
the reasonableness of significant accounting estimates made by the Responsible Financial Officer; and the
overall presentation of the financial statements. In addition, I read all the financial and non-financial
information in the explanatory foreword to identify material inconsistencies with the audited financial
statements. If I become aware of any apparent material misstatements or inconsistencies I consider the
implications for my report. OPINION ON FINANCIAL STATEMENTS
In my opinion the financial statements:
give a true and fair view of the financial position of London Borough of Brent as at 31 March 2012 and
of its expenditure and income for the year then ended;
give a true and fair view of the financial position of the Group as at 31 March 2012 and of its
expenditure and income for the year then ended; and
have been prepared properly in accordance with the CIPFA/LASAAC Code of Practice on Local
Authority Accounting in the United Kingdom 2011/12.

13
OPINION ON OTHER MATTERS
In my opinion, the information given in the explanatory foreword for the financial year for which the
financial statements are prepared is consistent with the financial statements. MATTERS ON WHICH I REPORT BY EXCEPTION
I report to you if:
in my opinion the annual governance statement does not reflect compliance with ‘Delivering Good
Governance in Local Government: a Framework’ published by CIPFA/SOLACE in June 2007;
I issue a report in the public interest under section 8 of the Audit Commission Act 1998;
I designate under section 11 of the Audit Commission Act 1998 any recommendation as one that
requires the Authority to consider it at a public meeting and to decide what action to take in response;
or
I exercise any other special powers of the auditor under the Audit Commission Act 1998.
I have nothing to report in these respects.
OPINION ON THE PENSION FUND FINANCIAL STATEMENTS
I have audited the pension fund financial statements for the year ended 31 March 2012 under the Audit
Commission Act 1998. The pension fund financial statements comprise the Fund Account, the Net Assets
Statement and the related notes. The financial reporting framework that has been applied in their
preparation is applicable law and the CIPFA/LASAAC Code of Practice on Local Authority Accounting in the
United Kingdom 2011/12.
This report is made solely to the Members of the London Borough of Brent in accordance with Part II of the
Audit Commission Act 1998 and for no other purpose, as set out in paragraph 48 of the Statement of
Responsibilities of Auditors and Audited Bodies published by the Audit Commission in March 2010. RESPECTIVE RESPONSIBILITIES OF THE RESPONSIBLE FINANCIAL OFFICER AND AUDITOR
As explained more fully in the Statement of Responsibilities for the Accounts, the Responsible Financial
Officer is responsible for the preparation of the Authority and Group’s Statement of Accounts, which
includes the pension fund’s financial statements, in accordance with proper practices as set out in the
CIPFA/LASAAC Code of Practice on Local Authority Accounting in the United Kingdom, and for being
satisfied that they give a true and fair view. My responsibility is to audit and express an opinion on the
financial statements in accordance with applicable law and International Standards on Auditing (UK and
Ireland). Those standards require me to comply with the Auditing Practices Board’s Ethical Standards for
Auditors. SCOPE OF THE AUDIT OF THE FINANCIAL STATEMENTS
An audit involves obtaining evidence about the amounts and disclosures in the financial statements
sufficient to give reasonable assurance that the financial statements are free from material misstatement,
whether caused by fraud or error. This includes an assessment of: whether the accounting policies are
appropriate to the fund’s circumstances and have been consistently applied and adequately disclosed; the
reasonableness of significant accounting estimates made by the Responsible Financial Officer; and the
overall presentation of the financial statements. In addition, I read all the financial and non-financial
information in the explanatory foreword to identify material inconsistencies with the audited financial
statements. If I become aware of any apparent material misstatements or inconsistencies I consider the
implications for my report.
14
OPINION ON FINANCIAL STATEMENTS
In my opinion the pension fund’s financial statements:
give a true and fair view of the financial transactions of the pension fund during the year ended 31
March 2012 and the amount and disposition of the fund’s assets and liabilities as at 31 March 2012;
and
have been properly prepared in accordance with the CIPFA/LASAAC Code of Practice on Local
Authority Accounting in the United Kingdom 2011/12. OPINION ON OTHER MATTERS
In my opinion, the information given in the explanatory foreword for the financial year for which the
financial statements are prepared is consistent with the financial statements.
CONCLUSION ON THE AUTHORITY'S ARRANGEMENTS FOR SECURING ECONOMY, EFFICIENCY AND EFFECTIVENESS IN ITS USE
OF RESOURCES RESPECTIVE RESPONSIBILITIES OF THE AUTHORITY AND AUDITOR
The Authority is responsible for putting in place proper arrangements to secure economy, efficiency and
effectiveness in its use of resources, to ensure proper stewardship and governance, and to review regularly
the adequacy and effectiveness of these arrangements.
I am required under Section 5 of the Audit Commission Act 1998 to satisfy myself that the Authority has
made proper arrangements for securing economy, efficiency and effectiveness in its use of resources. The
Code of Audit Practice issued by the Audit Commission requires me to report to you my conclusion relating
to proper arrangements, having regard to relevant criteria specified by the Audit Commission.
I report if significant matters have come to my attention which prevent me from concluding that the
Authority has put in place proper arrangements for securing economy, efficiency and effectiveness in its
use of resources. I am not required to consider, nor have I considered, whether all aspects of the
Authority’s arrangements for securing economy, efficiency and effectiveness in its use of resources are
operating effectively. SCOPE OF THE REVIEW OF ARRANGEMENTS FOR SECURING ECONOMY, EFFICIENCY AND EFFECTIVENESS IN THE USE OF
RESOURCES
I have undertaken my audit in accordance with the Code of Audit Practice, having regard to the guidance
on the specified criteria, published by the Audit Commission in October 2011, as to whether the Council
has proper arrangements for:
securing financial resilience; and
challenging how it secures economy, efficiency and effectiveness.
The Audit Commission has determined these two criteria as those necessary for me to consider under the
Code of Audit Practice in satisfying myself whether the Council put in place proper arrangements for
securing economy, efficiency and effectiveness in its use of resources for the year ended 31 March 2012.
I planned my work in accordance with the Code of Audit Practice. Based on my risk assessment, I
undertook such work as I considered necessary to form a view on whether, in all significant respects, the
Council had put in place proper arrangements to secure economy, efficiency and effectiveness in its use of
resources.

15
CONCLUSION
On the basis of my work, having regard to the guidance on the specified criteria published by the Audit
Commission in October 2011, I am satisfied that, in all significant respects, the London Borough of Brent
put in place proper arrangements to secure economy, efficiency and effectiveness in its use of resources
for the year ended 31 March 2012. CERTIFICATE I cannot formally conclude the audit and issue an audit certificate until I have completed the work necessary to issue my assurance statement in respect of the Authority’s Whole of Government Accounts consolidation pack. I am satisfied that this work does not have a material effect on the financial statements or on my value for money conclusion.
Andrea White
District Auditor
1st Floor, Millbank Tower
Millbank
London
SW1P 4HQ
28 September 2012

16
STATEMENT OF RESPONSIBILITIES FOR THE STATEMENT OF ACCOUNTS THE COUNCIL’S RESPONSIBILITIES The Council is required:
to make arrangements for the proper administration of its financial affairs and to ensure that one of its officers has the responsibility for the administration of those affairs. In this Council, that officer is the Deputy Director of Finance and Corporate Services;
to manage its affairs to secure economic, efficient and effective use of resources and safeguard its
assets;
to approve the Statement of Accounts. THE RESPONSIBILITIES OF THE DIRECTOR OF FINANCE AND CORPORATE SERVICES The Deputy Director of Finance and Corporate Services is responsible for the preparation of the Council’s statement of accounts which, in terms of the CIPFA/LASAAC Code of Practice on Local Council Accounting in Great Britain (‘the Code of Practice’), is required to present fairly the financial position of the Council at the Accounting date and its income and expenditure for the year ended 31st March 2012. In preparing this statement of accounts, the Deputy Director of Finance and Corporate Services has:
selected suitable accounting policies and then applied them consistently;
made judgements and estimates that were reasonable and prudent;
complied with the Code of Practice.
kept proper accounting records which were up to date;
taken reasonable steps for the prevention and detection of fraud and other irregularities.

17
CERTIFICATE OF THE DEPUTY DIRECTOR OF FINANCE AND CORPORATE SERVICES I certify that the accounts set out on pages 2 to 117 give a true and fair view of the financial position of the London Borough of Brent as at 31 March 2012 and its income and expenditure for the year then ended, and that the accounts set out on pages 118 to 141 give a true and fair view of the net assets of the London Borough of Brent Pension Fund as at 31 March 2012 and its income and expenditure for the year then ended.
Date:
MICK BOWDEN Deputy Director of Finance and Corporate Services CERTIFICATE OF THE CHAIRMAN OF THE AUDIT COMMITTEE I confirm that these accounts were agreed by the Audit Committee at its meeting held on 27 September 2012.
Date:
STEPHEN WOOD Chairman of the Audit Committee
18
STATEMENT OF ACCOUNTING POLICIES
1. Code of Practice
The general policies adopted in preparing these accounts are in accordance with the 2011-12 Code of Practice on Local Council Accounting in the United Kingdom issued by the Chartered Institute of Public Finance Accountants (CIPFA) - Statement of Recommended Practice (SORP), henceforth referred to as the “Code of Practice”. This Code of Practice is based upon International Financial Reporting Standards (IFRS), with some adoptions from International Public Sector Accounting Standards (IPSAS). 2. Comprehensive Income and Expenditure Statement 2.1 Accruals of Expenditure and Income The Statement of Accounts is prepared on an accruals basis set out in the International Accounting Standards Board Framework, with the effects of transactions and other events are recognised when they occur, and recorded in the accounting records and reported in the financial statements of the periods to which they relate. This informs users of the accounts not only of past events, but of future obligation to transfer funds and future rights to receive income. The exception to this is the Cash Flow Statement, which shows the Council’s cash flow as required by the Code of Practice, using International Accounting Standard (IAS) 7.
2.2 Revenue Recognition
Revenue is recognised in line with the Code of Practice and IAS 18.
2.3 VAT
Income and expenditure accounts are VAT exclusive, unless VAT is irrecoverable, in which case it is included.
2.4 Revenue Government and Non-Government Grants
Grants are accounted for in line with the Code of Practice. Grants are immediately recognised where the Council has reasonable assurance it will comply with the conditions attached to the grant, and the grants or contributions will be received.
2.5 Charges to Revenue
External interest payable and the provision for depreciation are charged to the surplus or deficit on provision of services section of the Comprehensive Income and Expenditure Statement. This results in a charge to the General Fund for depreciation for all fixed assets used in the provision of services. The charge is allocated to each individual service on the basis of the capital employed in its provision. Depreciation charges are reversed out of the General Fund in the Movement in Reserves Statement. The charge made to the HRA is calculated on the basis determined by the Local Government and Housing Act 1989. Amounts set aside from revenue for the repayment of external loans, to finance capital expenditure or as transfers to earmarked reserves are disclosed in the Movement in Reserves Statement and the notes to this statement.
19
2.6 Council Tax and National Non Domestic Rates (NNDR)
Council Tax included in the Income and Expenditure (I and E) account is Brent’s accrued income for the year. The collection of Council Tax on behalf of the Greater London Authority(GLA) is in substance an agency arrangement so these amounts are shown in the surplus or deficit on provision of services section of the Comprehensive Income and Expenditure Statement. There will be a debtor / creditor position between Brent and the GLA to be recognised in Brent’s balance sheet if the net cash paid to the GLA is not exactly its share of cash collected from Council Taxpayers. In this case, Brent’s accrued income will be shown in the taxation and non-specific grant section of the Comprehensive Income and Expenditure Statement. The ‘Revenue Activities’ section of the cash flow statement only includes Brent’s share of Council Tax cash collected during the year. Brent collects NNDR under what is in substance an agency arrangement with the Government. Consequently NNDR income is not recognised in the surplus or deficit on provision of services section of the Comprehensive Income and Expenditure Statement. Similarly NNDR debtor and creditor balances with taxpayers are not recognised in Brent’s balance sheet. In addition cash collected from NNDR taxpayers by Brent is collected for the Government so is not included in Brent’s cash flow statement. Brent’s accrued income from the distribution of NNDR will be shown in the taxation and non-specific grant section of the Comprehensive Income and Expenditure Statement. 2.7 Area Based Grant Area Based Grant is a general grant allocated by central government directly to local authorities as additional revenue funding. Local authorities are free to use it as they see fit – it is not ring fenced. Area Based Grant is disclosed with the taxation and non-specific grant section of the Comprehensive Income and Expenditure Statement.
2.8 Overheads/Cost of Support Services
The full costs of support services (also known as overheads) have been charged to services in the Comprehensive Income and Expenditure Statement in accordance with CIPFA’s ‘Service Reporting Code of Practice’. Charges have been made on a variety of bases. Appropriate statistics have been used, for example, Human Resources charges were based on staff numbers.
2.9 Foreign Currency Transactions
Transactions in foreign currencies are accounted for in Sterling at the rate ruling on the date of the transactions. The Pension Fund accounting policies deal with the only foreign currency dominated assets disclosed on the balance sheet. 2.10 Accounting for the costs of the carbon reduction commitment scheme The Council is required to participate in the Carbon Reduction Commitment (CRC) Energy Efficiency Scheme. This scheme is currently in its introductory phase which will last until 31 March 2014. The Council is required to purchase and surrender allowances, currently retrospectively, on the basis of emissions ie carbon dioxide produced as energy is used. As carbon dioxide is emitted (ie as energy is used), a liability and an expense are recognised. The liability will be discharged by surrendering allowances. The liability is measured at the best estimate of the expenditure required to meet the obligation, normally at the current market price of the number of allowances required to meet the liability at the reporting date. The cost to the Council is recognised and reported in the costs of the Council’s services within the CIES and is apportioned to services on the basis of premises costs.
2.11 Exceptional items and prior period adjustments
These will be disclosed in line with the Code of Practice.
2.12 Events after the balance sheet date
These will be disclosed in line with the Code of Practice.
20
3. Balance sheet – Non Current Assets
3.1 Plant, Property and Equipment
All expenditure on the acquisition, creation or enhancement of fixed assets above the Council’s de minimus of £5,000 is capitalised on an accruals basis in the accounts. Repairs and maintenance expenditure is charged direct to service revenue accounts.
Fixed assets are valued on the basis required by CIPFA and in accordance with the Statements of Asset Valuation Principles and Guidance Notes issued by the Royal Institute of Chartered Surveyors (RICS) by the Council’s In-house Valuer. Fixed assets are classified into the groupings required by the Code of Practice, with the exception of plant and furniture and equipment where two categories are combined due to the limited amount of plant held by the Council. Individual categories of assets are valued on the following basis:
Council dwellings are valued using a beacon principle (ie using sample dwellings) based on their
Open Market Value (OMV) but adjusted to reflect their value as social housing in accordance with
ACOP.
Other Land and Buildings are included in the balance sheet at their OMV. The exceptions to this
are school buildings and Social Services establishments that are included at their Depreciated
Replacement Cost (DRC).
Surplus assets are included in the balance sheet at their OMV.
Assets held for sale are held at the lower of the asset’s carrying value and fair value less costs to
sell.
Community assets are included in the balance sheet at depreciated historic cost where appropriate
otherwise they are included at a nominal value.
Infrastructure assets, vehicles, plant, furniture and equipment have been valued at depreciated
historic cost. Heritage Assets are carried at valuation.
Investment Properties are held at fair value and not depreciated.
Assets under construction are held at their invoiced construction cost at year end.
Revaluations of fixed assets are planned on a five year cycle with a proportion of the asset base being revalued each year. Material changes to asset valuations resulting from works or similar investment outside of the agreed revaluation of assets cycle will be adjusted in the period as they occur. At 1st April 2009 those land and building assets held at 1st April 2004 values were revalued completing that 5 year cycle. There has been subsequent revaluation of elements of the asset base at 1st April 2010 and 1st April 2011 in line with the five year cycle. Council dwellings have been revalued at 1st April 2011 in line with the separate 5 year cycle, and their values have been up-rated to 31st March 2012 using Land Registry indices to reflect changes in property values.
3.1.1 Depreciation and Amortisation
Depreciation is the measurement of the cost or revalued amount of the economic benefits of the tangible fixed assets that have been consumed during the financial year. Consumption includes the wearing out, using up or other reduction in the useful economic life of a tangible fixed asset whether arising from use, passing of time or obsolescence through either changes in technology or demand for the goods and services produced by the asset.

21
With the exception of HRA dwellings depreciation is calculated on all building assets using the straight line method as set out below. Land Assets are not depreciated.
Buildings 5 – 60 years as determined by the Valuer Infrastructure 10 – 40 years Plant, Vehicles, Equipment and Machinery
Up to 10 years
Housing Revenue Account dwellings are depreciated by an estimate of the consumption of economic benefits. The Major Repairs Allowance calculated by central government is used as the basis for this. Where buildings assets are revalued, the accumulated depreciation at the beginning of the year is written down to the revaluation reserve.
3.1.2 Component Accounting
The Code of Practice 2010-11 introduced component accounting for Plant, Property and Equipment. This is a prospective change, and local authorities are required to value the components of major assets, where the components are of material value and have a significantly different economic life to the asset itself. Taking account of available guidance and reviews undertaken by CIPFA, componentisation will be undertaken where the value of the individual component is over £2 million and/or the value of that component is in excess of 20% of the total gross carrying value of the building. Housing Revenue Account assets are not componentised, in accordance with valuation guidance published by central government.
Consideration of the requirement for componentisation will be undertaken when buildings are valued/re-valued, or enhancement expenditure of £250,000 is spent on them, which will trigger a revaluation.
3.2 Investment Properties
Investment properties are properties held solely for capital appreciation or rental income. Investment properties are included in the balance sheet at OMV. The Code of Practice requires that investment properties are not depreciated, but instead held at fair value, and their book value is adjusted annually where there has been a material change in value. The Council adjusts the book value of these assets when appropriate indices indicate that the property has changed in value by 15% or more since the last indexation or revaluation. Investment properties have a full revaluation on the same five year cycle as Plant, Property and Equipment.
3.3 Heritage Assets
The Code of Practice 2011-12 introduces Heritage Assets based on FRS 30. Heritage Assets are defined as: A tangible asset with historical, artistic, scientific, technological, geophysical or environmental qualities that is held and maintained principally for its contribution to knowledge and culture, or an intangible asset with cultural, environmental or historical significance. The tangible assets that meet the definition of a Heritage Asset held by the Council are the collections of the Museums and Archive and the Civic Regalia.
22
Heritage assets are carried at valuation rather than fair value, reflecting the fact that exchanges of heritage assets are uncommon. The Council’s valuation is as per an insurance valuation which is an approach in line with CIPFA advice. Revaluations will be carried out as and when the insurance valuation is updated.
3.4 Intangible Assets
Intangible assets are identifiable non-monetary assets without physical substance. Expenditure on purchasing intangible fixed assets such as computer software has been capitalised at cost. Amortisation is the equivalent of depreciation for intangible assets. It spreads the cost of buying or developing an intangible asset over the life of the intangible asset. Amortisation is also calculated using the straight line method based on estimated economic life of between 5 to 7 years.
3.5 Impairment
Impairment reviews on groups of assets are undertaken on an annual basis by the valuer. Impairment is recognised where the asset’s carrying value is greater than its net recoverable value in use or through sale, and the loss is specific to the asset, or a small group of assets. Losses not specific to the asset or a small group of assets, such as a general fall in market prices will be treated as revaluation losses. Impairment losses are recognised against historic cost, and revalued net book value (for revalued assets). Losses for revalued assets will be recognised against the revaluation reserve to the limit of the credit balance for that asset in the revaluation reserve, and thereafter in surplus or deficit on provision of services in the Comprehensive Income and Expenditure Statement. The impairment review includes an annual assessment of whether there is indication that the recoverable value of any impaired assets has increased, reversing part or all of the impairment. If there is indication that the recoverable value has increased, the valuer will reassess the economic life of the asset for the purposes of determining depreciation. The impairment will be reversed to the extent that up to the carrying value of the asset had there been no impairment. This reversal will in the first instance be used to reverse any charge made to the surplus or deficit on provision of services in the Comprehensive Income and Expenditure Statement, and then to the revaluation reserve. Impairment and reversal of impairment loss are not proper charges to the General Fund under legislation and the Code of Practice and will be reserved out of the General Fund in the Movement of Reserves Statement. 4. Balance sheet – Current Assets
4.1 Inventories
Inventories are valued at the lower of cost and net realisable value. The Council has no inventories obtained through non-exchange transactions.
4.2 Cash and Cash Equivalents
IAS 7 defines cash and cash equivalents as cash, bank balances, and very short term investments used for cash management purposes. The Council uses bank overdrafts as part of its cash management strategy, therefore these are disclosed as part of cash and cash equivalents in line with IAS 7. Short term investments invested for three months or less with a known maturity value and date are included in cash and cash equivalents; the Council uses money market funds as an integral part of its cash management, so these investments are also disclosed as part of cash and cash equivalents.
23
4.3 Work in Progress (Construction contracts)
Under the Code of Practice, construction contracts undertaken by the Council for the Council’s customers are accounted for as set out in IAS 11. This is separate from Assets under Construction where the Council is constructing assets for its own use. The Code of Practice requires use of the percentage completion method for calculating accounting entries for such contracts. Under the percentage of completion method, contract revenue is matched with the contract costs incurred in reaching the stage of completion, resulting in the reporting of revenue, expenses and surplus/deficit which can be attributed to the proportion of work completed. The percentage of completion is assessed based on costs incurred for work performed to date. Until the point where outcome of the construction contract can be reliably estimated, revenue will only be recognised in line with construction costs to date. Once construction costs can be reliably measured, revenue will be recognised using the percentage completion method described above. Any expected losses will be immediately recognised as an expense. 5. Balance sheet - Liabilities
5.1 Debtors and Creditors
The revenue accounts of the Council have been compiled on an accruals basis in accordance with IAS 18.
5.2 Provisions, Contingent Liabilities, and Contingent Assets
The Council makes a provision in compliance with IAS 37 where there is a present obligation as a result of a past event where it is probable that the Council will incur expenditure to settle the obligation and where a reasonable estimate can be made of the amount involved. In addition to the provisions listed in note 23 to the Core Financial Statements, there is a provision for unrecovered debts, this has been netted off against the debtors figure on the balance sheet (see note 19 to the Core Financial Statements). The Code of Practice requires provisions to be split into current provisions (within a year) and long term provisions. The current provision for insurance is estimated by taking the moving average of insurance expense over the previous three years. All other current provisions are estimated by the officers of the Council in the relevant service area. The provision for Council Tax debts is based on an assessment of the likely future collection of Council Tax arrears compared to the total level of arrears. Collection of arrears continues for several years after the original liability arises, and the provision is re-assessed each year based on collection trends and movements in amounts due. Debts are not actually written off until there is no realistic chance of collection, at which point the write-off reduces both the debtors and provision totals. A contingent liability is disclosed in the notes to the accounts where there is either a possible obligation as a result of a past event where it is possible that the Council will incur expenditure to settle the obligation; or a present obligation as a result of a past event where it is either not probable that the Council will incur expenditure to settle the obligation, or where a reasonable estimate of the future obligation cannot be made. A contingent asset is disclosed in the notes to the accounts where a possible asset arises from past events, and whose existence will be confirmed only by the occurrence or non-occurrence of one or more uncertain future events not wholly within the control of the entity.

24
5.2.1 Employee benefits
The Code of Practice requires that the Council recognises a provision for the entitlement of its employees to benefits within the reported financial year. This provision is estimated based on the entitlement of the Council’s employees to leave as at the 1st April for the previous financial year. The Local Authorities (Capital Finance and Accounting) (England) (Amendment) Regulations 2010 prohibit Council tax payers from being charged for this provision, so any movement in this provision is transferred to the Accumulated Absences Account (note 25) as advised by CIPFA’s IFRS transition guidance.
5.3 Reserves
Reserves are divided into usable and unusable reserves in line with the Code of Practice. Within the usable reserves there are amounts set aside for earmarked purposes out of the balances on the Council’s funds. One of the main financial statements details Movements in Reserves. Further details of Earmarked Reserves are given in Note 35 to the Core Financial Statements.
6 Balance Sheet - Financial Instruments
6.1 Financial Assets
Financial assets are classified into three types:
Loans and receivables – assets that have fixed or determinable payments, but are not quoted in an
active market
Available for sale assets – assets that have a quoted market price and / or do not have fixed or
determinable payments
Fair value through income and expenditure
6.1.1 Loans and Receivables
Loans and Receivables are initially measured at fair value and carried at their amortised cost. Annual credits to the Comprehensive Income and Expenditure Statement for interest receivable are based on the carrying amount of the asset multiplied by the effective rate of interest for the instrument. For most of the loans that the Council has made, this means that the amount presented in the Balance Sheet is the outstanding principal receivable plus interest outstanding, and interest credited to the financing and investment income and expenditure section of the Comprehensive Income and Expenditure Statement is the amount receivable for the year in the loan agreement. Where assets are identified as impaired because of a likelihood arising from a past event that payments due under a contract will not be made, the asset is written down and a charge made to the surplus or deficit on provision of services section of the Comprehensive Income and Expenditure Statement. Any gains or losses that arise on the derecognition of the asset are credited/debited to the surplus or deficit on provision of services section of the Comprehensive Income and Expenditure Statement.
6.1.2 Available for Sale assets
Available for sale assets are initially measured and carried at fair value. Where the asset has fixed or determinable payments, annual credits to the financing and investment income and expenditure section of the Comprehensive Income and Expenditure Statement for interest receivable are based on the amortised cost of the asset multiplied by the effective rate of interest for the instrument. Where there are no fixed or determinable payments, income (e.g. dividends) is credited to the financing and investment income and expenditure section of the Comprehensive Income and Expenditure Statement when it becomes receivable by the Council.

25
Assets are maintained in the Balance Sheet at fair value. Values are based on the following principles:
Instruments with quoted market prices – the market price
Other instruments with fixed and determinable payments – discounted cash flow analysis
Equity shares with no quoted market prices – independent appraisal of company valuations
Changes in fair value are balanced by an entry in the Available for Sale reserve and the gain/loss is recognised in the surplus or deficit on revaluation of available-for-sale financial assets line in the Comprehensive Income and Expenditure Statement. The exception is where impairment losses have been incurred – these are debited to the surplus or deficit on the provision of services section of the Comprehensive Income and Expenditure Statement, along with any net gain / loss for the asset accumulated in the Reserve. Where assets are identified as impaired because of a likelihood arising from a past event that payments due under the contract will not be made, the asset is written down and a charge made to the Comprehensive Income and Expenditure Statement. Any gains or losses that arise on the derecognition of the asset are credited/debited to the surplus or deficit on the provision of services section of the Comprehensive Income and Expenditure Statement, along with any accumulated gains/losses previously recognised in the surplus or deficit on revaluation of available-for-sale financial assets line in the Comprehensive Income and Expenditure Statement. Where fair value cannot be measured reliably, the instrument is carried at cost (less any impairment losses). 6.1.3 Fair value through income and expenditure Investments where there is an active market (e.g. certificates of deposit or gilts). These are treated in the same manner as Loans and Receivables.
6.2 Premature Redemption of Debt
The practice for the Comprehensive Income and Expenditure Statement, in accordance with the Code of Practice as amended by Regulations, is to amortise premia and discounts over a period which reflects the life of the loans with which they are refinanced determined as described below. This will not be followed in the following situations:
Where it is permissible and advantageous to capitalise premia (in which case the question of
amortisation will not arise)
Where the loans redeemed are not refinanced (when premia and discounts will be taken directly to
the Revenue Account)
Where discounts and premia are amortised over a broadly similar period, for convenience they will
be shown as a net figure.
The practice for the HRA is different because it is determined by the Housing Subsidy rules. In this case, discounts and premia are amortised, individually, over the remaining life of the loan repaid or ten years, whichever is the shorter.

26
The Council’s policy on repayment of debt is as follows:
For strategic financial reasons, the optimum level of borrowing for an Council in the position of
Brent is usually to maintain gross borrowing at the Council’s overall Capital Financing Requirement,
unless the yield curve indicates very low short term rates. Unless borrowing required to fund the
capital programme is less than the Minimum Revenue Provision, this will always involve refinancing
debt redeemed prematurely with new borrowing. Borrowing to fund Brent’s capital programme is
likely to exceed Minimum Revenue Provision by a substantial margin for the foreseeable future.
However, at present the yield curve indicates that interest rates are likely to remain low, so that
borrowing for shorter periods or at variable rates may be prudent.
Given the current pattern of rates, there is a significant penalty incurred in redeeming much of the
Council’s debt prematurely. However, the cost of maintaining a higher borrowing portfolio than is
immediately required is particularly high at present, and the current risks to balances on deposit
indicate that these should be kept to a minimum prudent level (to cover cash flow). In practice, this
suggests a policy of seeking opportunities to redeem individual loans where this is economical.
6.3 Financial Liabilities
Financial liabilities are initially measured at fair value and carried at their amortised cost. Annual charges to the Comprehensive Income and Expenditure Statement for interest payable are based on the carrying amount of the liability, multiplied by the effective rate of interest for the instrument. For most of the borrowings that the Council has, this means that the amount presented in the Balance Sheet is the outstanding principal repayable and interest charged to the Comprehensive Income and Expenditure Statement is the amount payable for the year in the loan agreement. Gains and losses on the repurchase or early settlement of borrowing are credited and debited to the surplus or deficit on the provision of services section in the Comprehensive Income and Expenditure Statement in the year of repurchase / settlement. However, where repurchase has taken place as part of a restructuring of the loan portfolio that involves the modification or exchange of existing instruments, the premium or discount respectively would be deducted from or added to the amortised cost of the new or modified loan and the write down to the surplus or deficit on the provision of services section in the Comprehensive Income and Expenditure Statement spread over the life of the loan by an adjustment to the effective interest rate. Where premia and discounts have been charged to the surplus or deficit on the provision of services section in the Comprehensive Income and Expenditure Statement, regulations allow the impact on the General Fund balance to be spread over future years. The Council has a policy of spreading the gain / loss over the term of the replacement loan, at present up to a maximum of thirty years. The reconciliation of amounts charged to the surplus or deficit on the provision of services section in the Comprehensive Income and Expenditure Statement to the net charge required against the General Fund balance is managed by a transfer to or from the Financial Instruments Adjustment Account (note 25) in the Movement in Reserves Statement.
7 Capital Financing
7.1 Capital Expenditure
Capital expenditure on building assets is added to the value of the asset and depreciated over the remaining useful life. Capital expenditure on HRA dwellings is added to the value of fixed assets. Revenue expenditure funded from capital under statute (REFCUS) represents expenditure that may be capitalised under statutory provisions but does not result in the creation of tangible assets owned by the

27
Council. Such revenue expenditure incurred during the year has been written off as expenditure to the relevant service revenue account in the year.
7.2 Capital Government Grants and Contributions
Where the acquisition of a fixed asset is financed either wholly or in part by a government grant or other contribution, the amount of the grant or contribution is recognised as income as soon as the Council has reasonable assurance it will comply with the conditions attached to the grant, and the grants or contributions will be received. As central government has recently rescinded major capital grants prior to financial close, the Council will only recognise capital grants for specific projects in full at financial close of the specific project. Prior to financial close, income will be recognised as equal to expenditure on the project. Where funds have been recognised, but not spent, they are transferred to the Capital Grants Unapplied Account within the usable reserves. Grants where conditions have not been met in full are credited to Capital Grants Receipts in Advance; once conditions have been met they will transferred to the Capital Grants Unapplied Account. Upon expenditure funds are transferred to the Capital Adjustment Account.
7.3 Leasing
The Council has acquired a number of assets, mainly vehicles, plant and computer equipment, by means of leases. The Council assesses whether or not leases have to be disclosed on balance sheet in line with IAS 17, using guidance from the Royal Institute of Chartered Surveyors as directed by the CIPFA. On balance sheet leases are described as finance leases, leases not reported on the balance sheet are known as operating leases. Finance leases are initially recognised on the balance sheet with assets and liabilities equal to the net present value of the minimum lease payments. Where a contract does not detail an interest rate for a specific asset, or provide sufficient information for its calculation, the interest rate implicit in the lease will in the first instance be estimated based on interest rates for other assets within the lease. If there is no interest rate detailed in the lease then a suitable interest rate is applied. Assets financed by finance leases are treated as having an economic life equal to the minimum length of the contract and are depreciated over this period. Finance lease repayments and interest payments are calculated using the actuarial method (allocating interest to the period it relates to) and assumes that a single payment is made at the end of the contract year. Where a contract starts part way through a single financial year payments will be apportioned to that financial year based on the number of days of the contract year within the reported financial year. In accordance with accounting convention, rentals payable under operating leases are charged to revenue in the year in which they are paid and no provision is made for outstanding lease commitments. Two interpretations of the International Financial Reporting Standards apply to contracts and series of transactions where the substance of the contract or transactions may be a lease under International Financial Reporting Standards. In line with the Code of Practice, the Council first assesses whether or not contracts contain a service concession under IFRS Interpretations Committee (IFRIC) 12, and then whether or not there is an embedded lease under IFRIC 4. The disclosure of service concessions is complex and dealt with in further detail below. Embedded leases are disclosed as set out in IFRIC 4, accounting policies for major embedded finance leases are set out below.
7.3.1 Service Concessions and the Private Finance Initiative (PFI)
Contracts and other arrangements that have been determined as “service concessions” are accounted for under IFRIC 12 and the Code of Practice. The Council has analysed its contracts and other arrangements and has determined the five arrangements below to be “service concessions”. The Council has entered into three PFI projects which have generated assets to be used by the Council, these are:

28
In 1998/99 a 20 year project to provide and maintain street lights throughout the Borough;
In 2006/07 a 25 year project to provide and maintain a new sports centre and related facilities in
Willesden.
In 2008/09 a 20 year project to provide and maintain social housing and replacement residential
facilities for people with learning disabilities.
The Council has entered into two other contracts that meet the definition of a Service Concession:
In 2005/06 a 32 year agreement to provide and maintain social housing within Stonebridge.
In 2006/07 a 5 year agreement to refurbish a sports centre in Wembley.
Where this analysis has resulted in new assets being identified these assets are recognised at fair value being the relevant elements of the capital cost in the PFI operators’ financial model, as recommended by the Code of Practice. Where the PFI operator’s right to third party income is recognised in reductions to the unitary payment, a proportion of the finance lease creditor is re-allocated to a deferred income balance based on the proportion of fixed payments (if any) from the Council and expected third party payments. The deferred income balance is amortised to the Comprehensive Income and Expenditure Statement on a straight line basis over the life of the PFI scheme. The Council’s ongoing liabilities for these service concessions are recognised on the balance sheet. This has been done by recognising a finance lease creditor calculated in line with the requirements of the Code of Practice and written down accordingly. The assets acquired with these service concessions will be depreciated over the useful estimated economic life of the assets; with the exception of the assets generated by the Social Housing PFI. Legal title to the majority of assets from the Social Housing PFI will remain with the PFI operator, so these assets will be depreciated over the life of the contract, not their useful economic life. Lifecycle costs will be capitalised in line with the directions of the Code of Practice on capitalising expenditure for these service concessions. All lifecycle costs for the Street lighting PFI are treated as revenue maintenance expenditure due to the nature of maintaining street lighting.
7.3.2 Embedded Finance Leases
The Council has two major contracts with significant value of assets funded by embedded finance leases within the contract. Due to the complex nature of these contracts assets have been recognised on the basis appropriate to each contract:
for the waste services contract, commenced in April 2007, assets have been recognised on the
basis of an inventory provided by the contractor; and
for the parking contract, commenced July 2005, assets have been recognised based on
documentation supplied as part of the tender.
Accounting for these assets and the corresponding liabilities follows the policies set out for leases above.

29
7.4 Minimum Revenue Provision
The Minimum Revenue Provision (MRP) included within the 2011/12 Accounts has been calculated on the basis of the 2010/11 outturn position, amended for the inclusion of PFI projects as per the requirements of the introduction of the International Financial Reporting Standards. In accordance with the revised regulations for the calculation of MRP issued in 2008 the Council adopted the following policy for non-HRA assets:
For supported borrowing, the Council will continue with the existing method (Option 1). This option, ‘the regulatory method’, continues to use the calculations that were used under the system that existed from 2004/05 when the previous regulations came into effect. This means that the amount of non-housing Capital Financing Requirement (CFR), adjusted as set out in the original regulations (Adjustment A’), is used as the starting position for the MRP calculation in 2008/09 and adjusted thereafter for supported borrowing in each year. For prudential borrowing, the Council will adopt Option 3, ‘the asset life method’, and an ‘annuity’ approach for calculating repayments. This option allows provision for repayment of principal to be made over the estimated life of the asset. The use of the ‘annuity’ method is akin to a mortgage where the combined sum of principal and interest are equalised over the life of the asset.
The proposed asset lives which will be applied to different classes of assets are as follows:
o Vehicles and equipment – 5 to 15 years;
o Capital repairs to roads and buildings – 15 to 25 years;
o Purchase of buildings – 30 to 40 years;
o New construction – 40 to 60 years;
o Purchase of land – 50 years (unless there is a structure on the land with an asset
life of more than 50 years, in which case the land would have the same asset life as
the structure).
These policies do not apply to HRA assets. The statutory guidance in the Guidance on Minimum Revenue Provision (second edition) from the Department of Communities and Local Government directs local authorities to make an MRP charge equal to the writing down of the finance lease liability upon transition to IFRS, and a charge equal to the writing down of the finance lease liability in subsequent years for operating leases reclassified as finance leases. It states that this is equivalent to one of the other options provided by the guidance for MRP in other circumstances. In order to ensure consistent treatment of all finance leases, an MRP charge equal to the writing down of the finance lease liability will be made for all finance leases. In line with the statutory guidance on Minimum Revenue Provision (MRP), MRP has been charged for PFIs at a rate equal to the writing down of the finance lease liability. In addition, to ensure that all capital costs are captured by MRP, MRP includes a charge equal to any capital lifecycle additions within the scheme, and a charge equal to the release of any deferred income. Where finance lease liabilities increase in year, this is recognised by a credit to MRP equal to the increase in liability. The net effect of this policy is to maintain revenue balances at the same level under IFRS as under UK GAAP which is considered the prudent course of action within Guidance on Minimum Revenue Provision. Minimum Revenue Provision is charged against the General Fund in the Movement in Reserves statement.
7.5 Contributions from the Capital Adjustment Account
These represent expenditure which may properly be capitalised but which does not represent tangible fixed assets. Expenditure is included in the Comprehensive Income and Expenditure Statement and written off to the Capital Adjustment Account.
30
7.6 Income from the Sale of Fixed Assets
Income from the disposal of fixed assets is known as capital receipts. Such income that is not reserved and has not been used to finance capital expenditure in the period is included in the balance sheet as capital receipts unapplied. The treatment of capital receipts is determined by the Local Government Act 2003. Under this Act and its supporting regulations, the Council is required to pay to the Secretary of State any ‘pooled’ HRA receipts. The value of these ‘pooled’ receipts is calculated as 75% of HRA dwellings and 50% of HRA land. The remaining proportions and 100% of General Fund capital receipts can be used to finance capital expenditure.
7.7 Borrowing Costs
The Council may borrow to meet capital costs that are attributable to the acquisition, construction or production of a qualifying asset that has a life of more than one year. It is the Council’s policy to capitalise borrowing costs that are directly attributable to the acquisition, construction or production of a qualifying asset. Borrowing costs will be deemed as interest and other costs that the Council incurs in connection with the borrowing of funds, and a qualifying asset will be that which takes in excess of three years to get ready for intended use and has forecast expenditure in excess of £100 million. Cessation of capitalisation will occur when substantially all the activities necessary to prepare the qualifying asset for its intended use are complete. 8 Group Accounts The Group Accounts have been prepared on the basis of a full consolidation of the financial transactions of the Council and its subsidiary Brent Housing Partnership (BHP) Limited. BHP is an Arms Length Management Organisation (ALMO). The financial statements in the Group Accounts are prepared in accordance with the policies set out above.
8.1 Interest in Companies
Brent Housing Partnership (BHP) is a subsidiary of the London Borough of Brent. It is the only organisation that meets the criteria for inclusion in Brent’s group accounts. Group accounts are included in this document after Brent’s single entity financial statements. BHP’s accounting policies are based on UK Generally Accepted Accounting Practice. Their accounts have been amended prior to consolidation into the group accounts to reflect the Council’s accounting policies. Mick Bowden Deputy Director of Finance and Corporate Services
31
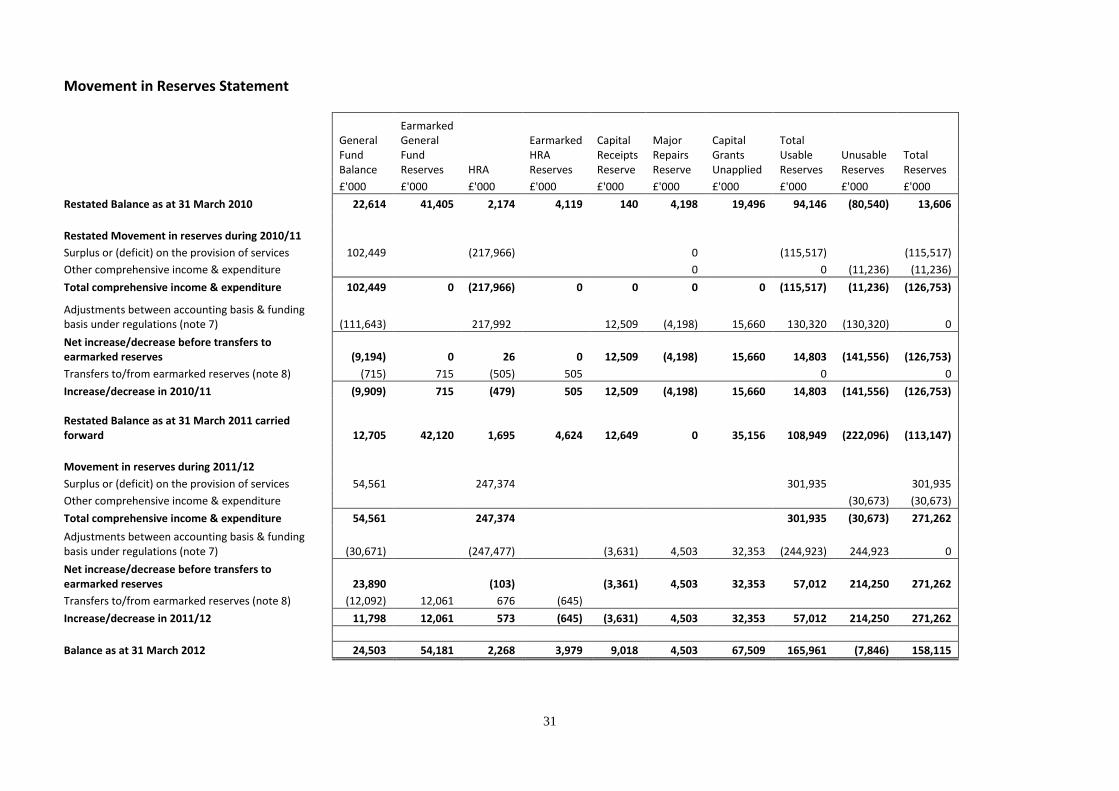
Movement in Reserves Statement
General Fund Balance
Earmarked General Fund Reserves HRA
Earmarked HRA Reserves
Capital Receipts Reserve
Major Repairs Reserve
Capital Grants Unapplied
Total Usable Reserves
Unusable Reserves
Total Reserves
£'000 £'000 £'000 £'000 £'000 £'000 £'000 £'000 £'000 £'000
Restated Balance as at 31 March 2010 22,614 41,405 2,174 4,119 140 4,198 19,496 94,146 (80,540) 13,606
Restated Movement in reserves during 2010/11 Surplus or (deficit) on the provision of services 102,449 (217,966) 0 (115,517) (115,517)
Other comprehensive income & expenditure 0 0 (11,236) (11,236)
Total comprehensive income & expenditure 102,449 0 (217,966) 0 0 0 0 (115,517) (11,236) (126,753)
Adjustments between accounting basis & funding basis under regulations (note 7) (111,643)
217,992 12,509 (4,198) 15,660 130,320 (130,320) 0
Net increase/decrease before transfers to earmarked reserves (9,194) 0 26 0 12,509 (4,198) 15,660 14,803 (141,556) (126,753)
Transfers to/from earmarked reserves (note 8) (715) 715 (505) 505 0 0
Increase/decrease in 2010/11 (9,909) 715 (479) 505 12,509 (4,198) 15,660 14,803 (141,556) (126,753) Restated Balance as at 31 March 2011 carried forward 12,705 42,120 1,695 4,624 12,649 0 35,156 108,949 (222,096) (113,147)
Movement in reserves during 2011/12
Surplus or (deficit) on the provision of services 54,561
247,374
301,935
301,935
Other comprehensive income & expenditure
(30,673) (30,673)
Total comprehensive income & expenditure 54,561
247,374
301,935 (30,673) 271,262
Adjustments between accounting basis & funding basis under regulations (note 7) (30,671)
(247,477)
(3,631) 4,503 32,353 (244,923) 244,923 0
Net increase/decrease before transfers to earmarked reserves 23,890
(103)
(3,361) 4,503 32,353 57,012 214,250 271,262
Transfers to/from earmarked reserves (note 8) (12,092) 12,061 676 (645) Increase/decrease in 2011/12 11,798 12,061 573 (645) (3,631) 4,503 32,353 57,012 214,250 271,262
Balance as at 31 March 2012 24,503 54,181 2,268 3,979 9,018 4,503 67,509 165,961 (7,846) 158,115
32
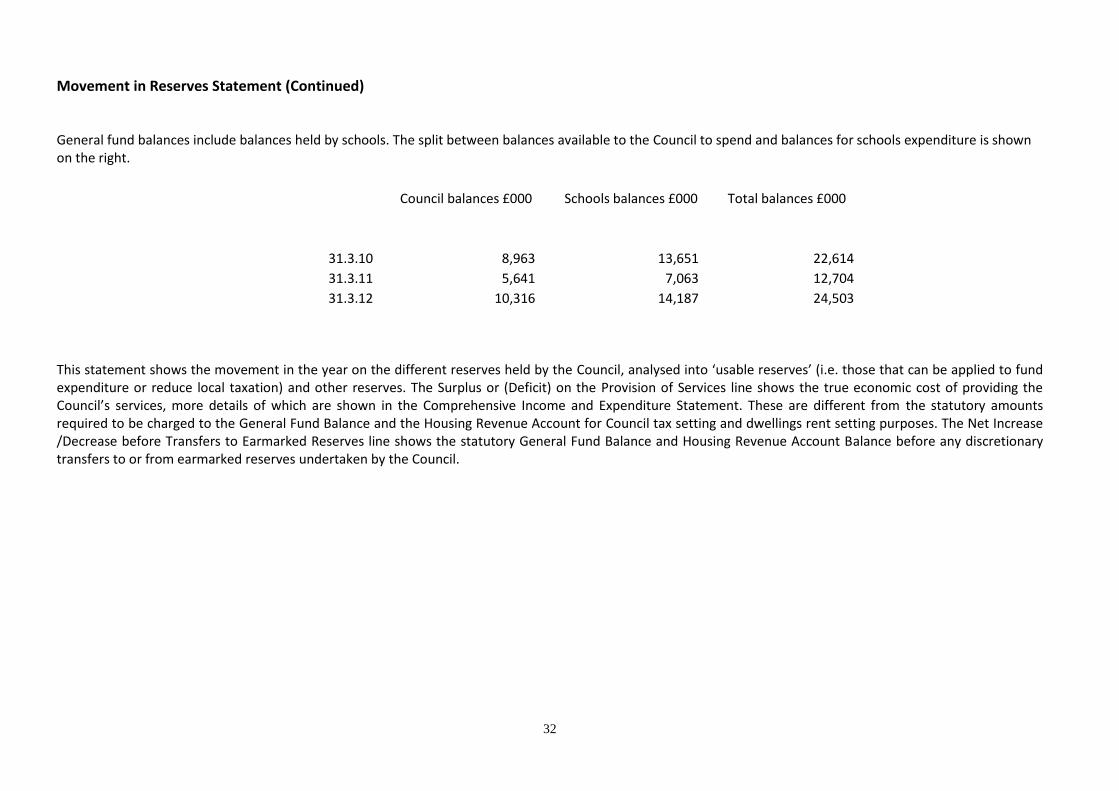
Movement in Reserves Statement (Continued) General fund balances include balances held by schools. The split between balances available to the Council to spend and balances for schools expenditure is shown on the right.
Council balances £000 Schools balances £000 Total balances £000
31.3.10 8,963
13,651
22,614
31.3.11 5,641
7,063
12,704
31.3.12 10,316
14,187
24,503
This statement shows the movement in the year on the different reserves held by the Council, analysed into ‘usable reserves’ (i.e. those that can be applied to fund expenditure or reduce local taxation) and other reserves. The Surplus or (Deficit) on the Provision of Services line shows the true economic cost of providing the Council’s services, more details of which are shown in the Comprehensive Income and Expenditure Statement. These are different from the statutory amounts required to be charged to the General Fund Balance and the Housing Revenue Account for Council tax setting and dwellings rent setting purposes. The Net Increase /Decrease before Transfers to Earmarked Reserves line shows the statutory General Fund Balance and Housing Revenue Account Balance before any discretionary transfers to or from earmarked reserves undertaken by the Council.

33
Comprehensive Income & Expenditure Statement
2010/11 Restated 2011/12 Gross
Expenditure Gross
Income Net
Expenditure Gross
Expenditure Gross
Income Net
Expenditure £'000 £'000 £'000 £'000 £'000 £'000
50,289 (39,377) 10,912 Central services to the public 59,163 (47,279) 11,884 19,360 (2,984) 16,376 Cultural and related services 20,579 (2,648) 17,931 32,827 (5,351) 27,476
Environmental and regulatory services 35,324 (5,055) 30,269
7,944 (3,331) 4,613
Planning 4,440 (2,466) 1,974 52,138 (4,288) 47,850
Children’s social care 47,266 (3,895) 43,371
398,322 (358,929) 39,393 Education and children's services 354,959 (323,016) 31,943 26,144 (17,250) 8,894 Highways and transport services 34,078 (29,168) 4,910 34,015 (53,784) (19,769) Local authority housing (HRA) 36,915 (102,657) (65,742)
364,916 (332,578) 32,338 Other housing services 402,450 (367,942) 34,508 122,235 (25,276) 96,959 Adult social care 118,077 (25,133) 92,944
6,470 6,470 Corporate and democratic core 8,609 (36) 8,573 234,654 234,654 Exceptional item - downward revaluation of assets
(117,950)
(117,950)
Reduction in past service pension costs. See Note 48 & 50 6,264 (9,603) (3,339) Non distributed costs 1,633
1,633
1,237,628 (852,751) 384,877 Cost of Services 1,123,493 (909,295) 214,198
32,403 Other operating expenditure (note 9) 9,190 62,898 Financing and investment income and expenditure (note 10) 43,532
Exceptional item – HRA settlement debt redemption costs (note 5)
74,213
Exceptional item – HRA settlement capital grant (note 5)
(272,213)
(364,661) Taxation and non-specific grant income (note 11) (370,855)
115,517 (Surplus) or Deficit on Provision of Services (301,935)
(1,284) (Surplus) or deficit on revaluation of Property, Plant and Equipment assets (35,818)
(Surplus) or deficit on revaluation of available for sale financial assets
12,520 Actuarial (gains)/losses on pension assets and liabilities 66,494
11,236 Other Comprehensive Income and Expenditure 30,676
126,753 Total Comprehensive Income and Expenditure (271,259)
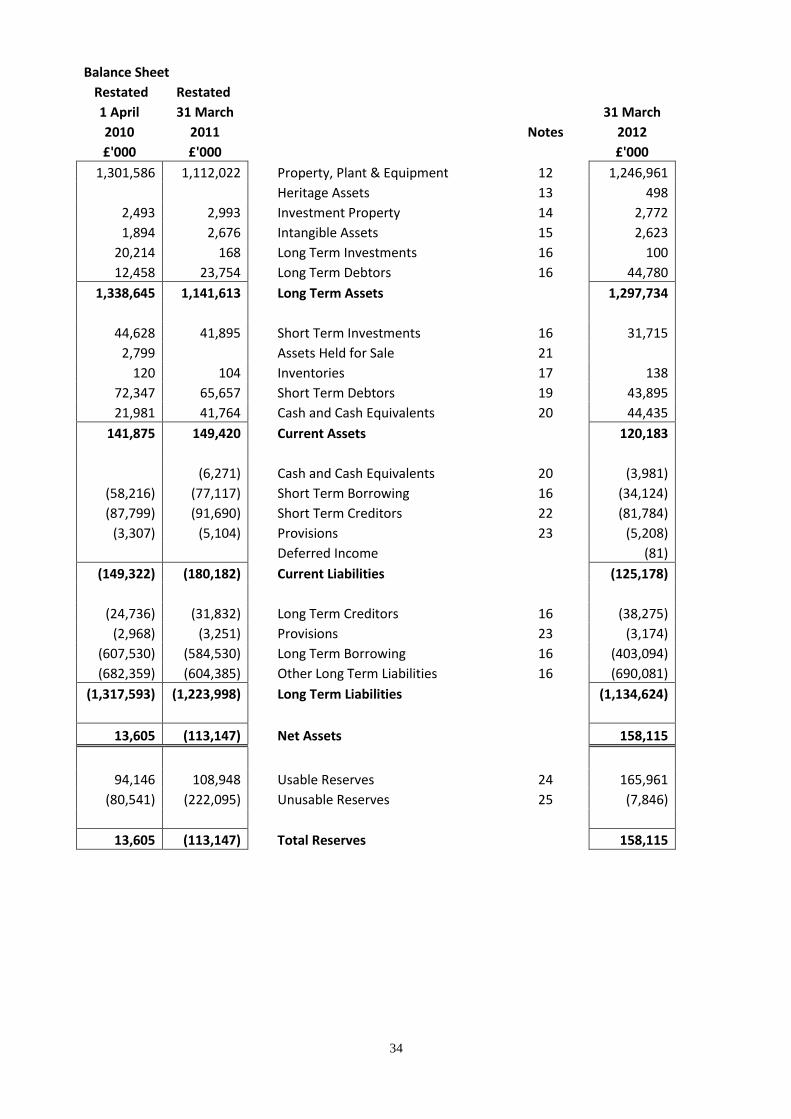
34
Balance Sheet
Restated Restated
1 April 31 March 31 March
2010 2011 Notes 2012
£'000 £'000 £'000
1,301,586 1,112,022 Property, Plant & Equipment 12 1,246,961
Heritage Assets 13 498
2,493 2,993 Investment Property 14 2,772
1,894 2,676 Intangible Assets 15 2,623
20,214 168 Long Term Investments 16 100
12,458 23,754 Long Term Debtors 16 44,780
1,338,645 1,141,613 Long Term Assets 1,297,734
44,628 41,895 Short Term Investments 16 31,715
2,799 Assets Held for Sale 21
120 104 Inventories 17 138
72,347 65,657 Short Term Debtors 19 43,895
21,981 41,764 Cash and Cash Equivalents 20 44,435
141,875 149,420 Current Assets 120,183
(6,271) Cash and Cash Equivalents 20 (3,981)
(58,216) (77,117) Short Term Borrowing 16 (34,124)
(87,799) (91,690) Short Term Creditors 22 (81,784)
(3,307) (5,104) Provisions 23 (5,208)
Deferred Income
(81)
(149,322) (180,182) Current Liabilities (125,178)
(24,736) (31,832) Long Term Creditors 16 (38,275)
(2,968) (3,251) Provisions 23 (3,174)
(607,530) (584,530) Long Term Borrowing 16 (403,094)
(682,359) (604,385) Other Long Term Liabilities 16 (690,081)
(1,317,593) (1,223,998) Long Term Liabilities (1,134,624)
13,605 (113,147) Net Assets 158,115
94,146 108,948 Usable Reserves 24 165,961
(80,541) (222,095) Unusable Reserves 25 (7,846)
13,605 (113,147) Total Reserves 158,115
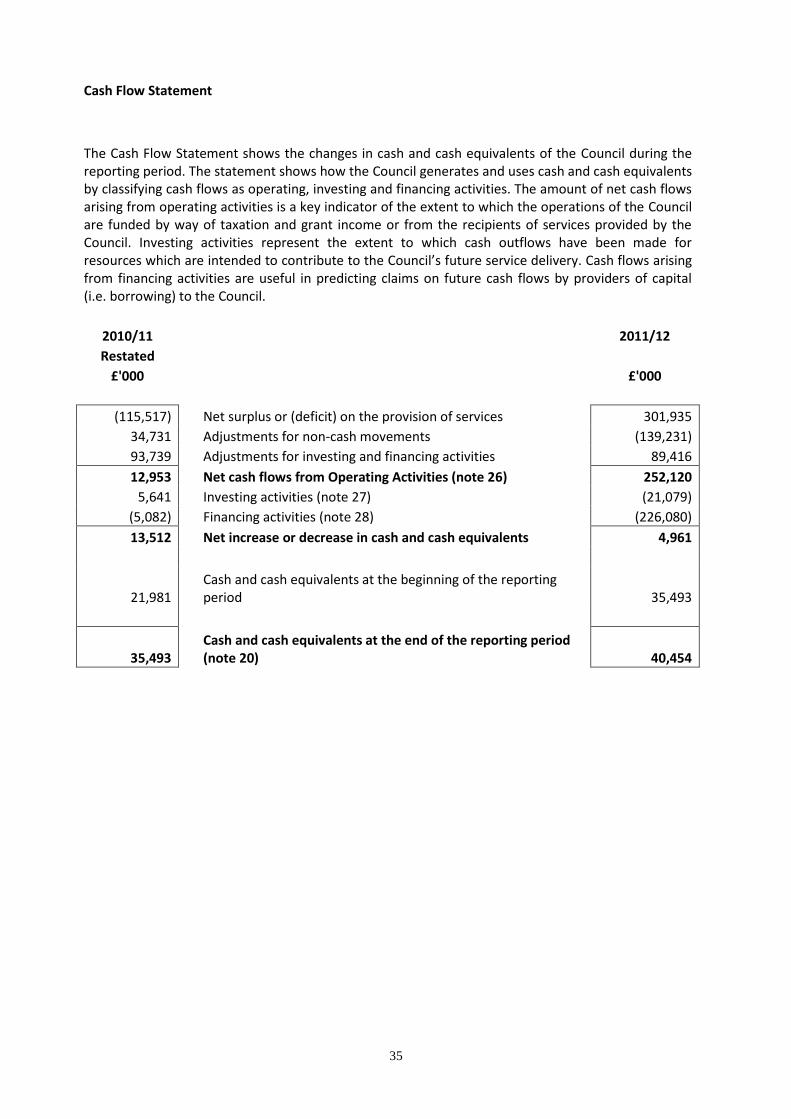
35
Cash Flow Statement
The Cash Flow Statement shows the changes in cash and cash equivalents of the Council during the reporting period. The statement shows how the Council generates and uses cash and cash equivalents by classifying cash flows as operating, investing and financing activities. The amount of net cash flows arising from operating activities is a key indicator of the extent to which the operations of the Council are funded by way of taxation and grant income or from the recipients of services provided by the Council. Investing activities represent the extent to which cash outflows have been made for resources which are intended to contribute to the Council’s future service delivery. Cash flows arising from financing activities are useful in predicting claims on future cash flows by providers of capital (i.e. borrowing) to the Council.
2010/11 2011/12
Restated
£'000 £'000
(115,517) Net surplus or (deficit) on the provision of services 301,935
34,731 Adjustments for non-cash movements (139,231)
93,739 Adjustments for investing and financing activities 89,416
12,953 Net cash flows from Operating Activities (note 26) 252,120
5,641 Investing activities (note 27) (21,079)
(5,082) Financing activities (note 28) (226,080)
13,512 Net increase or decrease in cash and cash equivalents 4,961
21,981 Cash and cash equivalents at the beginning of the reporting period 35,493
35,493 Cash and cash equivalents at the end of the reporting period (note 20) 40,454
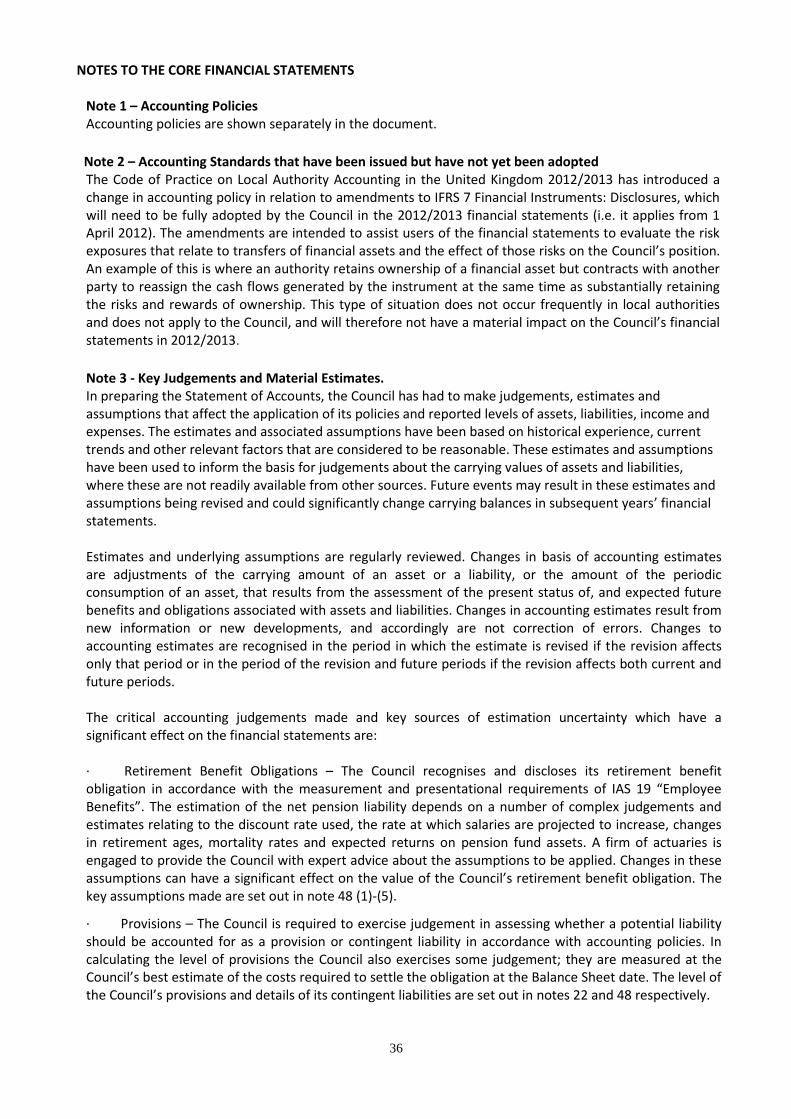
36
NOTES TO THE CORE FINANCIAL STATEMENTS
Note 1 – Accounting Policies Accounting policies are shown separately in the document.
Note 2 – Accounting Standards that have been issued but have not yet been adopted The Code of Practice on Local Authority Accounting in the United Kingdom 2012/2013 has introduced a change in accounting policy in relation to amendments to IFRS 7 Financial Instruments: Disclosures, which will need to be fully adopted by the Council in the 2012/2013 financial statements (i.e. it applies from 1 April 2012). The amendments are intended to assist users of the financial statements to evaluate the risk exposures that relate to transfers of financial assets and the effect of those risks on the Council’s position. An example of this is where an authority retains ownership of a financial asset but contracts with another party to reassign the cash flows generated by the instrument at the same time as substantially retaining the risks and rewards of ownership. This type of situation does not occur frequently in local authorities and does not apply to the Council, and will therefore not have a material impact on the Council’s financial statements in 2012/2013.
Note 3 - Key Judgements and Material Estimates. In preparing the Statement of Accounts, the Council has had to make judgements, estimates and assumptions that affect the application of its policies and reported levels of assets, liabilities, income and expenses. The estimates and associated assumptions have been based on historical experience, current trends and other relevant factors that are considered to be reasonable. These estimates and assumptions have been used to inform the basis for judgements about the carrying values of assets and liabilities, where these are not readily available from other sources. Future events may result in these estimates and assumptions being revised and could significantly change carrying balances in subsequent years’ financial statements. Estimates and underlying assumptions are regularly reviewed. Changes in basis of accounting estimates are adjustments of the carrying amount of an asset or a liability, or the amount of the periodic consumption of an asset, that results from the assessment of the present status of, and expected future benefits and obligations associated with assets and liabilities. Changes in accounting estimates result from new information or new developments, and accordingly are not correction of errors. Changes to accounting estimates are recognised in the period in which the estimate is revised if the revision affects only that period or in the period of the revision and future periods if the revision affects both current and future periods. The critical accounting judgements made and key sources of estimation uncertainty which have a significant effect on the financial statements are: · Retirement Benefit Obligations – The Council recognises and discloses its retirement benefit obligation in accordance with the measurement and presentational requirements of IAS 19 “Employee Benefits”. The estimation of the net pension liability depends on a number of complex judgements and estimates relating to the discount rate used, the rate at which salaries are projected to increase, changes in retirement ages, mortality rates and expected returns on pension fund assets. A firm of actuaries is engaged to provide the Council with expert advice about the assumptions to be applied. Changes in these assumptions can have a significant effect on the value of the Council’s retirement benefit obligation. The key assumptions made are set out in note 48 (1)-(5).
· Provisions – The Council is required to exercise judgement in assessing whether a potential liability should be accounted for as a provision or contingent liability in accordance with accounting policies. In calculating the level of provisions the Council also exercises some judgement; they are measured at the Council’s best estimate of the costs required to settle the obligation at the Balance Sheet date. The level of the Council’s provisions and details of its contingent liabilities are set out in notes 22 and 48 respectively.

37
· Property, Plant and Equipment – Assets are depreciated over useful lives that are dependent on assumptions such as the level of repairs and maintenance that will be incurred in relation to individual type of asset, the expected length of service potential of the asset and the likelihood of the Council’s usage of the asset. The Council carries out an annual impairment review of its asset base which takes in to account such factors as the current economic climate.
· Future Levels of Government Funding and Levels of Reserves – the future levels of funding for local authorities has a high degree of uncertainty. The Council has set aside amounts in reserves which it believes are appropriate based on local circumstances including the overall budget size, risks, robustness of budgets, major initiatives being undertaken, budget assumptions, other earmarked reserves and the Council’s track record in financial management. The Council’s budget strategy for 2011/12 was approved in February 2011.
· Treatment of PFI arrangements – The Council has entered into a number of PFI arrangements in respect of infrastructure. The Council has exercised judgement in the identification of service concessions and embedded leases within PFIs using such as arrangements that allow the Council to control residual value of PFI assets without legal title. Initial assets and liabilities for the PFIs are calculated using financial model based upon the contractual terms and conditions and the operator’s financial model; subsequent changes in the Council’s PFI liabilities are estimated using the same model. Subsequent changes in the Council’s PFI funded assets are measured in the same way as other non current assets. Details of the PFI and service concession type arrangements are set out in note 43. · Deposits with Icelandic banks – The Council has deposited £15million with Icelandic banks which are in administration. Based on the latest information from the administrators an impairment of £2million has been recognised to cover reasonably expected losses relating to those deposits. Further information on deposits with Icelandic Banks is included in note 16 (3). · The estimate of depreciation chargeable on dwellings within the Housing Revenue Account is based on the Government's major repairs allowance. An external review of this has been undertaken to ensure this does not lead to a material misstatement in the accounts.
Note 4 – Assumption made about the future and other major sources of estimation uncertainty The Council includes accounting estimates within the accounts; the significant accounting estimates relate to non current assets, impairment of financial assets. The Council’s accounting policies include details on the calculation of these accounting estimates.
The Council also carries out a review of all debtor balances, and uses past experience of debt collection rates across all categories to establish allowances for non-collection. The appropriate level of non-earmarked reserves to be held by the Council is based on an assessment of financial risks facing the Council. These risks include future funding levels, delivery of planned savings and future demands on services.
Note 5 – Material items of Income and Expenses The 2011/12 accounts include a significant one-off item relating to the establishment of self-financing of the Housing Revenue Account with effect from April 2012. In place of an annual subsidy the Government made a one-off repayment of debt £198 million of behalf of the Council on 28 March 2012 along with £74 million of associated early repayment costs.
Note 6 – Events After the Balance Sheet Date None identified
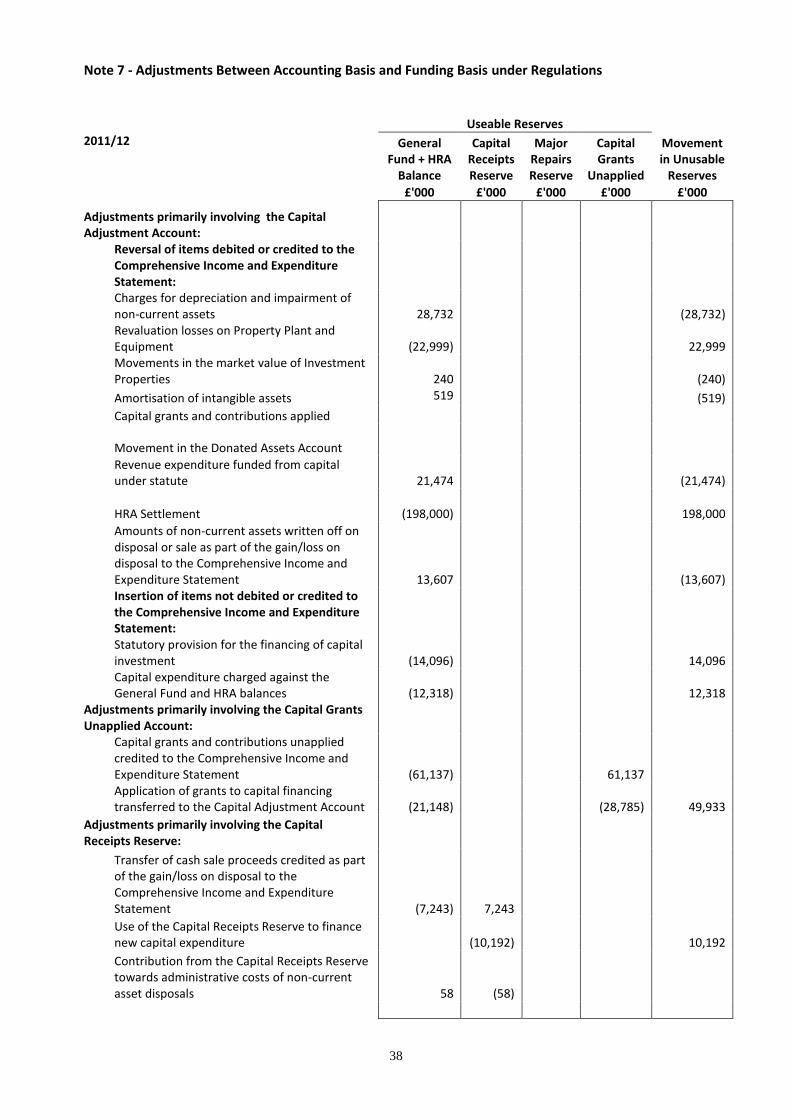
38
Note 7 - Adjustments Between Accounting Basis and Funding Basis under Regulations
Useable Reserves
2011/12 General Fund + HRA
Balance
Capital Receipts Reserve
Major Repairs Reserve
Capital Grants
Unapplied
Movement in Unusable
Reserves
£'000 £'000 £'000 £'000 £'000
Adjustments primarily involving the Capital Adjustment Account:
Reversal of items debited or credited to the Comprehensive Income and Expenditure Statement:
Charges for depreciation and impairment of non-current assets 28,732
(28,732)
Revaluation losses on Property Plant and Equipment (22,999)
22,999
Movements in the market value of Investment Properties 240
(240)
Amortisation of intangible assets 519
(519)
Capital grants and contributions applied
Movement in the Donated Assets Account
Revenue expenditure funded from capital under statute 21,474
(21,474)
HRA Settlement (198,000)
198,000
Amounts of non-current assets written off on disposal or sale as part of the gain/loss on disposal to the Comprehensive Income and Expenditure Statement 13,607
(13,607)
Insertion of items not debited or credited to the Comprehensive Income and Expenditure Statement:
Statutory provision for the financing of capital investment (14,096)
14,096
Capital expenditure charged against the General Fund and HRA balances (12,318)
12,318
Adjustments primarily involving the Capital Grants Unapplied Account:
Capital grants and contributions unapplied credited to the Comprehensive Income and Expenditure Statement (61,137)
61,137
Application of grants to capital financing transferred to the Capital Adjustment Account (21,148)
(28,785) 49,933
Adjustments primarily involving the Capital Receipts Reserve:
Transfer of cash sale proceeds credited as part of the gain/loss on disposal to the Comprehensive Income and Expenditure Statement (7,243) 7,243
Use of the Capital Receipts Reserve to finance new capital expenditure
(10,192)
10,192
Contribution from the Capital Receipts Reserve towards administrative costs of non-current asset disposals 58 (58)
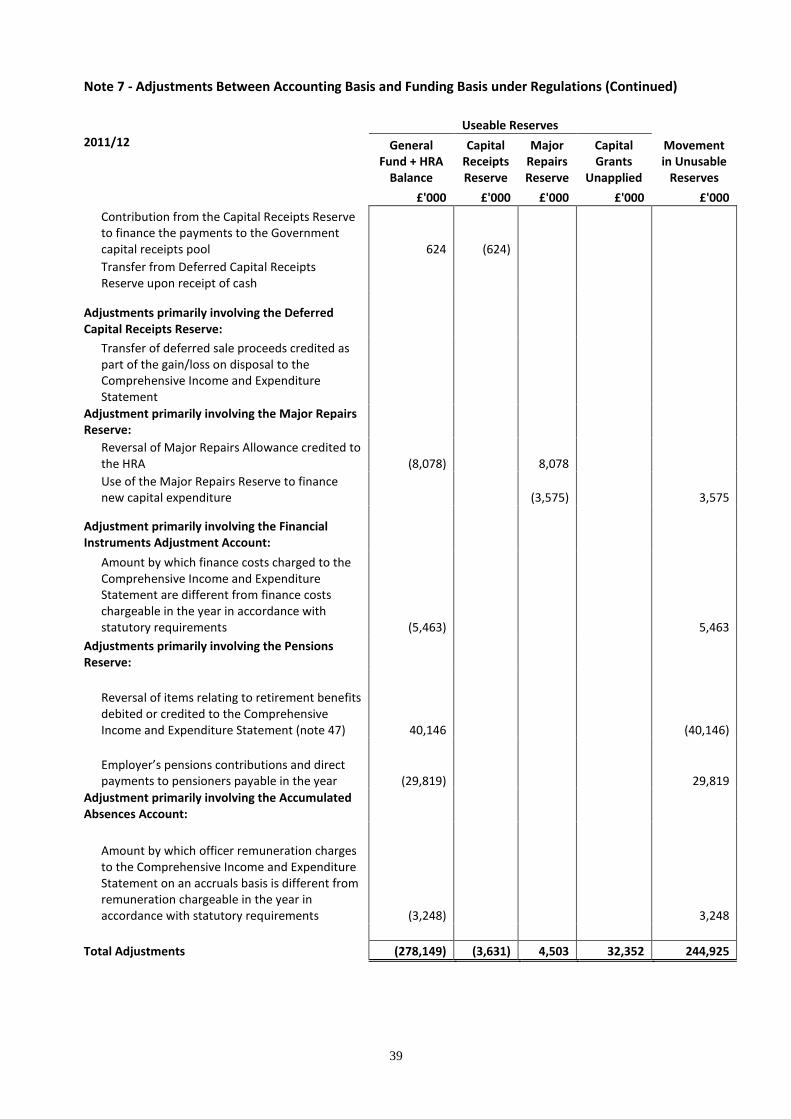
39
Note 7 - Adjustments Between Accounting Basis and Funding Basis under Regulations (Continued)
Useable Reserves
2011/12 General Fund + HRA
Balance
Capital Receipts Reserve
Major Repairs Reserve
Capital Grants
Unapplied
Movement in Unusable
Reserves
£'000 £'000 £'000 £'000 £'000
Contribution from the Capital Receipts Reserve to finance the payments to the Government capital receipts pool 624 (624)
Transfer from Deferred Capital Receipts Reserve upon receipt of cash
Adjustments primarily involving the Deferred Capital Receipts Reserve:
Transfer of deferred sale proceeds credited as part of the gain/loss on disposal to the Comprehensive Income and Expenditure Statement
Adjustment primarily involving the Major Repairs Reserve:
Reversal of Major Repairs Allowance credited to the HRA (8,078)
8,078
Use of the Major Repairs Reserve to finance new capital expenditure
(3,575)
3,575
Adjustment primarily involving the Financial Instruments Adjustment Account:
Amount by which finance costs charged to the Comprehensive Income and Expenditure Statement are different from finance costs chargeable in the year in accordance with statutory requirements (5,463)
5,463
Adjustments primarily involving the Pensions Reserve:
Reversal of items relating to retirement benefits debited or credited to the Comprehensive Income and Expenditure Statement (note 47) 40,146
(40,146)
Employer’s pensions contributions and direct payments to pensioners payable in the year (29,819)
29,819
Adjustment primarily involving the Accumulated Absences Account:
Amount by which officer remuneration charges to the Comprehensive Income and Expenditure Statement on an accruals basis is different from remuneration chargeable in the year in accordance with statutory requirements (3,248)
3,248
Total Adjustments (278,149) (3,631) 4,503 32,352 244,925
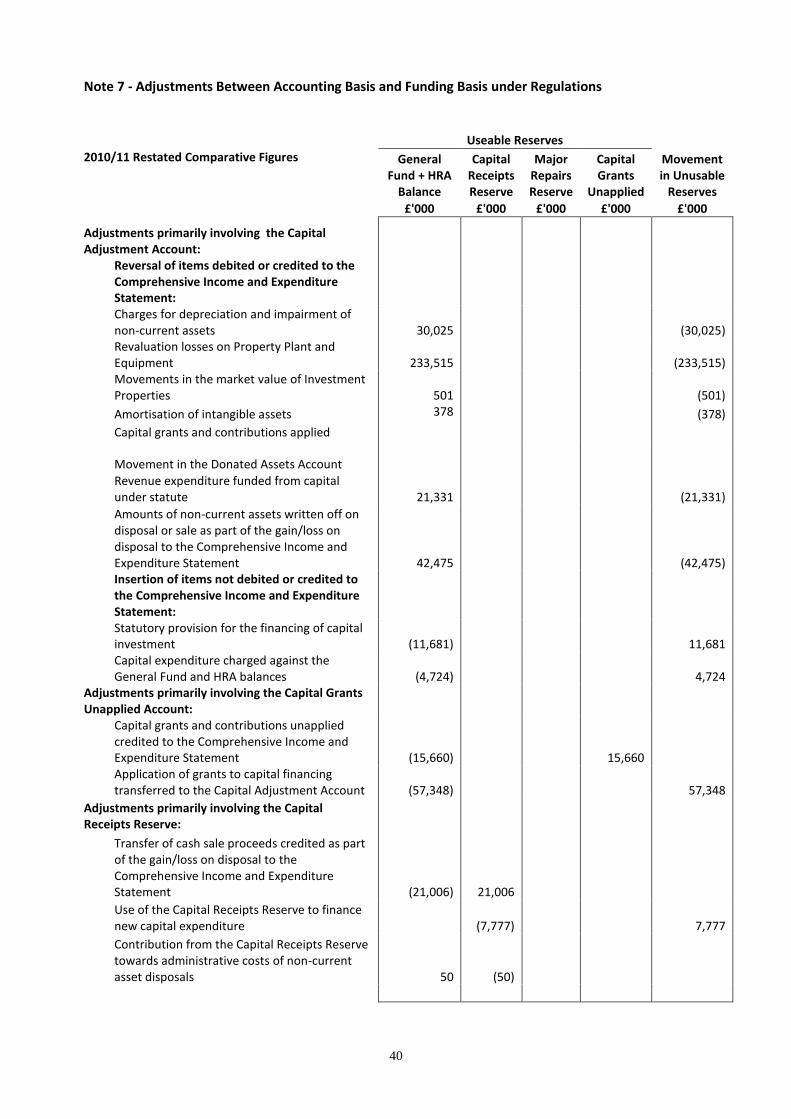
40
Note 7 - Adjustments Between Accounting Basis and Funding Basis under Regulations
Useable Reserves
2010/11 Restated Comparative Figures General Fund + HRA
Balance
Capital Receipts Reserve
Major Repairs Reserve
Capital Grants
Unapplied
Movement in Unusable
Reserves
£'000 £'000 £'000 £'000 £'000
Adjustments primarily involving the Capital Adjustment Account:
Reversal of items debited or credited to the Comprehensive Income and Expenditure Statement:
Charges for depreciation and impairment of non-current assets 30,025
(30,025)
Revaluation losses on Property Plant and Equipment 233,515 (233,515)
Movements in the market value of Investment Properties
501 (501)
Amortisation of intangible assets 378 (378)
Capital grants and contributions applied
Movement in the Donated Assets Account
Revenue expenditure funded from capital under statute 21,331 (21,331)
Amounts of non-current assets written off on disposal or sale as part of the gain/loss on disposal to the Comprehensive Income and Expenditure Statement 42,475 (42,475)
Insertion of items not debited or credited to the Comprehensive Income and Expenditure Statement:
Statutory provision for the financing of capital investment (11,681) 11,681
Capital expenditure charged against the General Fund and HRA balances (4,724) 4,724
Adjustments primarily involving the Capital Grants Unapplied Account:
Capital grants and contributions unapplied credited to the Comprehensive Income and Expenditure Statement (15,660) 15,660
Application of grants to capital financing transferred to the Capital Adjustment Account (57,348)
57,348
Adjustments primarily involving the Capital Receipts Reserve:
Transfer of cash sale proceeds credited as part of the gain/loss on disposal to the Comprehensive Income and Expenditure Statement (21,006) 21,006
Use of the Capital Receipts Reserve to finance new capital expenditure
(7,777) 7,777
Contribution from the Capital Receipts Reserve towards administrative costs of non-current asset disposals 50 (50)

41
Note 7 - Adjustments Between Accounting Basis and Funding Basis under Regulations (Continued)
Useable Reserves
2010/11 Comparative Figures General Fund + HRA
Balance
Capital Receipts Reserve
Major Repairs Reserve
Capital Grants
Unapplied
Movement in Unusable
Reserves
£'000 £'000 £'000 £'000 £'000
Contribution from the Capital Receipts Reserve to finance the payments to the Government capital receipts pool 670 (670)
Transfer from Deferred Capital Receipts Reserve upon receipt of cash
Adjustments primarily involving the Deferred Capital Receipts Reserve:
Transfer of deferred sale proceeds credited as part of the gain/loss on disposal to the Comprehensive Income and Expenditure Statement
Adjustment primarily involving the Major Repairs Reserve:
Reversal of Major Repairs Allowance credited to the HRA (2,363) 2,363
Use of the Major Repairs Reserve to finance new capital expenditure
(6,561) 6,561
Adjustment primarily involving the Financial Instruments Adjustment Account:
Amount by which finance costs charged to the Comprehensive Income and Expenditure Statement are different from finance costs chargeable in the year in accordance with statutory requirements (2,352) 2,352
Adjustments primarily involving the Pensions Reserve:
Reversal of items relating to retirement benefits debited or credited to the Comprehensive Income and Expenditure Statement (note 47) (73,270) 73,270
Employer’s pensions contributions and direct payments to pensioners payable in the year (31,450) 31,450
Adjustment primarily involving the Accumulated Absences Account:
Amount by which officer remuneration charges to the Comprehensive Income and Expenditure Statement on an accruals basis is different from remuneration chargeable in the year in accordance with statutory requirements (2,742) 2,742
Total Adjustments 106,349 12,509 (4,198) 15,660 (130,320)

42
Note 8 - Transfers to/from Earmarked Reserves
Balance at Transfers in Transfers out Balance at
31 March
2011 2011/12 2011/12 31 March
2012
£'000 £'000 £'000 £'000
General Fund
2Yr Old additional Funding 0 397 397
Affordable Housing PFI 3,365 2,203 5,568
Area Child Protection (Local S B) 132 19 151
Avenue School 0 108 108
BACES 0 210 210
Brent NHS Trust Settlement 391 3,281 3,672
Brent Performance Fund 110 0
110
Capital Funding 605 0
605
Care of the Elderly 260 0
260
Chalkhill Community Building 1,870 0 (17) 1,853
CLG Funding Secondment Officer 135 100 (107) 128
Crest Academy/Surveys 0 176 176
Destination Wembley 189 189
Discretionary Housing Payment Grant 0 346 346
DWP LHA 2012/13 0 522 522
DWP Transitional Funding 0 109 109
Employment Initiatives 0 3,000 3,000
Financial Skills Systems 197 197
Homeless Strategy 100 164 (10) 254
JFS School PFI 2,354 139 2,493
Legal Dispute Costs 132 132
Local Development Framework (LDF) 103 (103) 0
Local Elections 0 100 100
Local Housing Allowance 288 0
288
Long Term Sickness 142 223 365
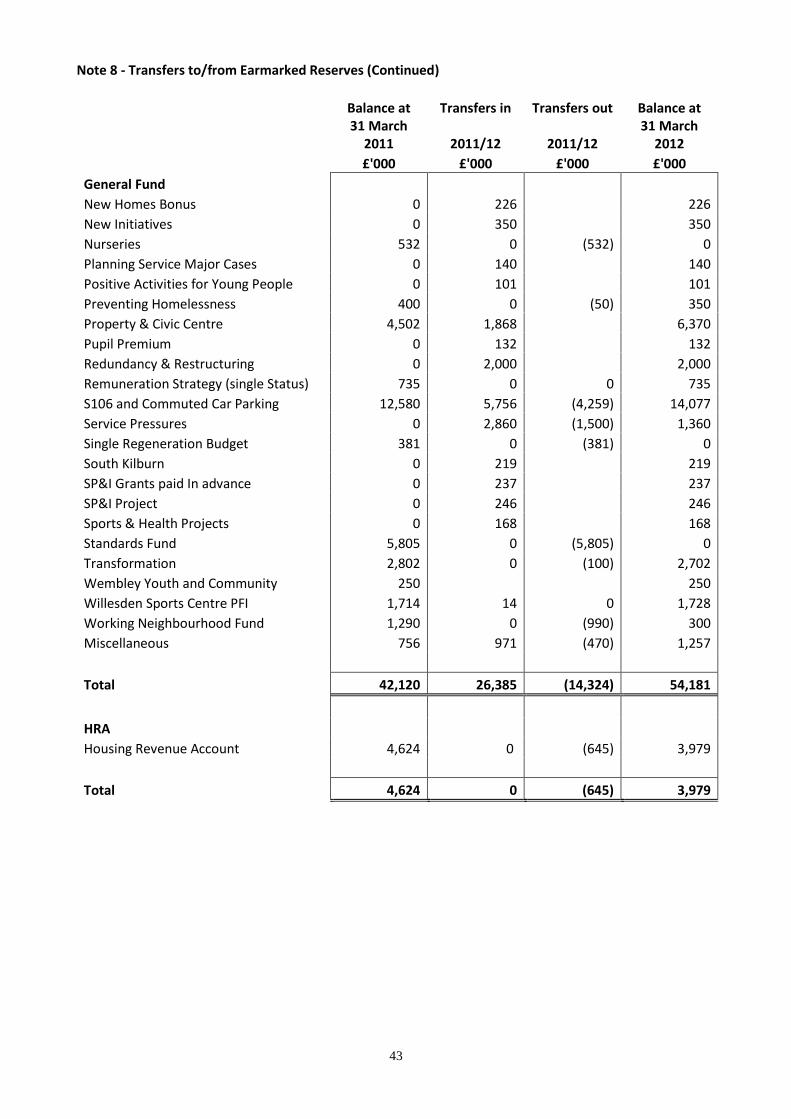
43
Note 8 - Transfers to/from Earmarked Reserves (Continued)
Balance at Transfers in Transfers out Balance at
31 March
2011 2011/12 2011/12 31 March
2012
£'000 £'000 £'000 £'000
General Fund
New Homes Bonus 0 226 226
New Initiatives 0 350 350
Nurseries 532 0 (532) 0
Planning Service Major Cases 0 140 140
Positive Activities for Young People 0 101 101
Preventing Homelessness 400 0 (50) 350
Property & Civic Centre 4,502 1,868 6,370
Pupil Premium 0 132 132
Redundancy & Restructuring 0 2,000 2,000
Remuneration Strategy (single Status) 735 0 0 735
S106 and Commuted Car Parking 12,580 5,756 (4,259) 14,077
Service Pressures 0 2,860 (1,500) 1,360
Single Regeneration Budget 381 0 (381) 0
South Kilburn 0 219 219
SP&I Grants paid In advance 0 237 237
SP&I Project 0 246 246
Sports & Health Projects 0 168 168
Standards Fund 5,805 0 (5,805) 0
Transformation 2,802 0 (100) 2,702
Wembley Youth and Community 250 250
Willesden Sports Centre PFI 1,714 14 0 1,728
Working Neighbourhood Fund 1,290 0 (990) 300
Miscellaneous 756 971 (470) 1,257
Total 42,120 26,385 (14,324) 54,181
HRA
Housing Revenue Account 4,624 0 (645) 3,979
Total 4,624 0 (645) 3,979

44
2Yr Old additional Funding - To fund 2 Year Old Places in Private & Voluntary Sector. Affordable Housing PFI - Monies set aside for affordable housing PFI. Area Child Protection - Money received from Brent Local Safeguarding Children’s Board for children’s services to promote the welfare of children. Avenue School - Income from closure of the Avenue Bank Account. Funds to be paid to Islamia School in 2012/13 BACES - Grant funded expenditure carried forward by way of an earmarked reserve. Brent NHS Trust Settlement - Brent NHS Trust indicated that a number of patients that it funded for care should transfer to the local Council. The Council did not accept the legal basis for many of these changes. However, the majority of cases have now been resolved between the two bodies. Part of this settlement requires the Council to earmark £1.4m in this reserve. It will be utilised to fund joint initiatives between the Council and Brent NHS which will be agreed by both parties. Brent Performance Fund - The fund is used to pay for various service improvements across the Council. Capital Funding - This represents revenue contributions set aside to meet commitments included in the capital programme. This only relates to the General Fund. There are no contributions from the HRA in this reserve. Care of the Elderly - Monies bequeathed by a former resident to be utilised for providing services for the elderly within the borough. Chalkhill Community Building - MONIES earmarked for the development of a new community building on the Chalkhill estate. CLG Funding Secondment Officer – Funding for work on Social Investment and Youth Homelessness Prevention. Crest Academy/Surveys - The reserve is required to meet future revenue cost that is attached to the construction process. Failure could result in the delays in the construction process and impacting the delivery date. Destination Wembley - Monies carried forward to meet commitments in Wembley Regeneration area. Discretionary Housing Payment Grant - Balance of DHP grant received in 2011/12 allowed to be carried forward to 2012/13 by DWP due to delayed implementation of new HB caps. DWP LHA 2012/13 - This funding is to assist in mitigating the impact of LHA caps and has to be separately accounted for DWP Transitional Funding - DWP funding for transitional help for claimants adversely affected by LHA caps. Money advisor team has been set up and salaries will be paid monthly throughout 12/13. Employment Initiatives - Monies set aside centrally for employment initiatives. Financial Skills & Systems - Monies set aside for financial systems and training across the Council. Homeless Strategy - Additional grant received for Homelessness Strategy Project.
45
Housing Revenue Account - Monies earmarked to spend on various Housing Revenue Account projects. JFS School PFI - Grant relating to the setting up of JFS. (A secondary school in the Borough). The PFI agreement means that government funding exceeds contract payments in earlier years but tapers off in later years. The reserve was set up to take account of the funding profile. Legal Discipline Disputes - Trading Standards - The Reserve is intended to be used as a contingency for unexpected legal costs that may arise as a result of the complex prosecutions that are undertaken on behalf of both Brent & Harrow Councils. In addition to this the reserve has included incentivisation monies received from the Home Office under the Proceeds of Crime Act, which can only be used for Trading Standards purposes. Both Councils have received under this scheme will be used as part of the ongoing enforcement and prosecution activities undertaken by the Service. Local Development Framework (LDF) – Costs set aside for cost of inquiry. Local Elections - Monies set aside to meet the costs of the local election in 2014. Local Housing Allowance - Reserve for on-going implementation costs of the new Local Housing Allowance commencing in April 2008 – costs for staff training, software development, publicity, start-up activities. Long Term Sickness - Monies expected to be required to pay for long term sickness in schools funded by contributions from schools. New Homes Bonus - Monies received in advance for 2012/13. New Initiatives - The £100k Wembley projects involve completing various Environmental Initiatives. Nurseries - Monies earmarked for the education of nursery school children in the borough. Planning Service Major Cases - To meet future significant expenditure that relates to anticipated changes to the planning process as part of the government review. Some of these changes include the introduction of the Community Infrastructure Levy and the proposal for decentralisation of planning fees by central government. There has been significant increase in the number of planning reviews in the past years and it is anticipated that these changes would further increase the numbers of reviews to unprecedented levels. The reserve is required to meet future expenditure that relates to these reviews. Positive Activities for Young People - Monies set aside for planning activities for Youth Service. Preventing Homelessness – Monies to manage the effects of Local Housing Allowance changes. Property and Civic Centre - Monies earmarked to be spent on repairs, maintenance and dilapidations to Council freehold and leasehold buildings and costs associated with the move to the Civic Centre. This will support more efficient use of office accommodation and new ways of working. Pupil Premium - Grant received from DfE in advance of payments due to Brent schools Redundancy & Restructuring - Monies set aside to meet the future costs of restructuring. Remuneration Strategy (single status) - Monies for the development and the implementation of the single status agreement for employees and other recruitment and retention initiatives. Section 106 and Commuted Car Parking - Amounts received under Section 106 of the Town and Country Planning Act 1990 which are earmarked for particular purposes arising from the related developments.

46
Service Pressures - a centrally held fund which was created for service pressures Single Regeneration Budget (SRB) - Monies set aside to cover the set up/closure costs of SRB schemes. South Kilburn – Monies held centrally for delivering various regeneration projects- e.g. independent advice for residents and other general office administration costs associated with delivering the programme. Strategy, Partnerships & Improvement Grants paid In advance - Various grants received in advance. Strategy, Partnerships & Improvement Project - Monies set aside for various projects e.g. Young Offenders & Young drinkers (CST), and Social Mobility Commission (Policy). Sports and Health Project - Various Sports and Health projects for Multi Use Parks and Voucher Scheme. Standards Fund - Unspent Standards Fund balances may be carried forward into the following financial year to be spent by 31st August. Transformation - Reserve is to provide monies for financial, HR and IT transformation as well as for Spend to Save initiatives. Wembley Youth and Community - Monies provided for the renovation of the Wembley Youth and Community Centre. Willesden Sports Centre PFI - The new Willesden Sports Centre opened during 2006/07 is financed through a 25 year PFI agreement. This involves an arrangement whereby funds received from the Council’s own budget and from Government PFI credits are used to cover payments to the contractor. At the start of the project surplus funds are paid into a reserve which will be utilised over the life of the project. Working Neighbourhood Fund - Programme of employment and skills provision through Brent into work. Miscellaneous - This comprises of a variety of miscellaneous small reserves each totalling below £100,000. Some of these small reserves have relevance to more than one Service Area.
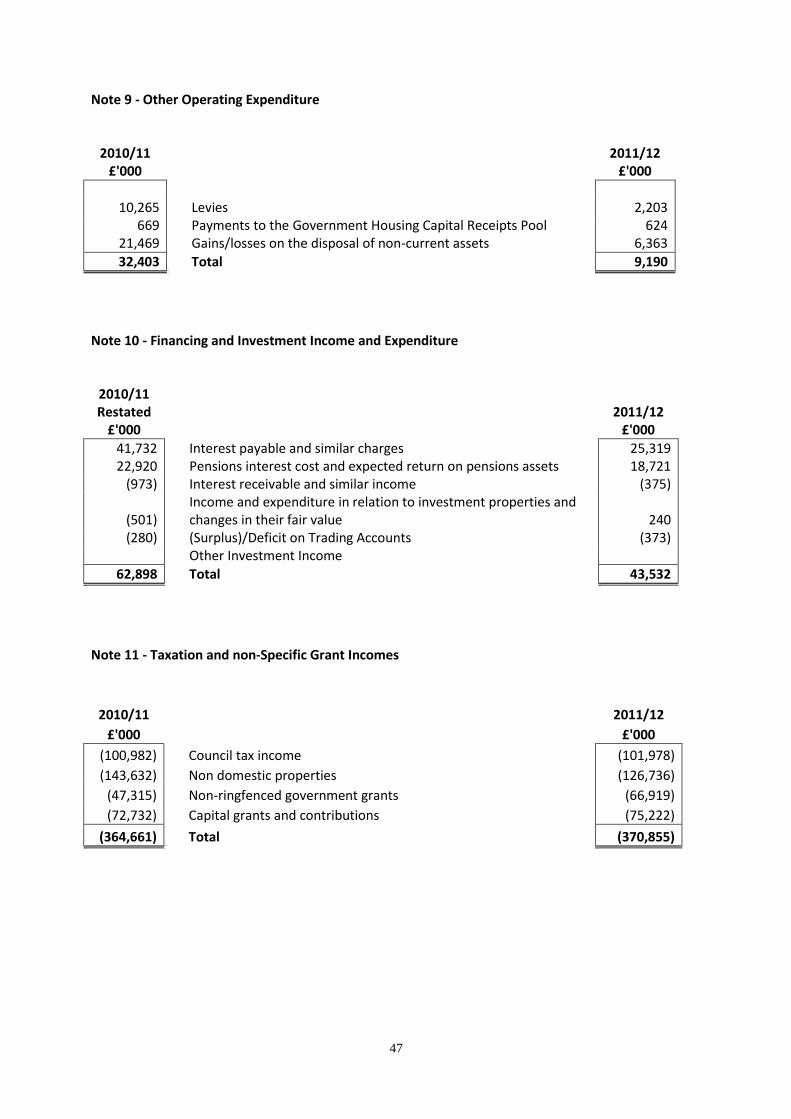
47
Note 9 - Other Operating Expenditure
2010/11 2011/12 £'000 £'000
10,265 Levies 2,203
669 Payments to the Government Housing Capital Receipts Pool 624 21,469 Gains/losses on the disposal of non-current assets 6,363
32,403 Total 9,190
Note 10 - Financing and Investment Income and Expenditure
2010/11 Restated 2011/12
£'000 £'000
41,732 Interest payable and similar charges 25,319 22,920 Pensions interest cost and expected return on pensions assets 18,721
(973) Interest receivable and similar income (375)
(501) Income and expenditure in relation to investment properties and changes in their fair value 240
(280) (Surplus)/Deficit on Trading Accounts (373) Other Investment Income
62,898 Total 43,532
Note 11 - Taxation and non-Specific Grant Incomes
2010/11 2011/12
£'000 £'000
(100,982) Council tax income (101,978)
(143,632) Non domestic properties (126,736)
(47,315) Non-ringfenced government grants (66,919)
(72,732) Capital grants and contributions (75,222)
(364,661) Total (370,855)
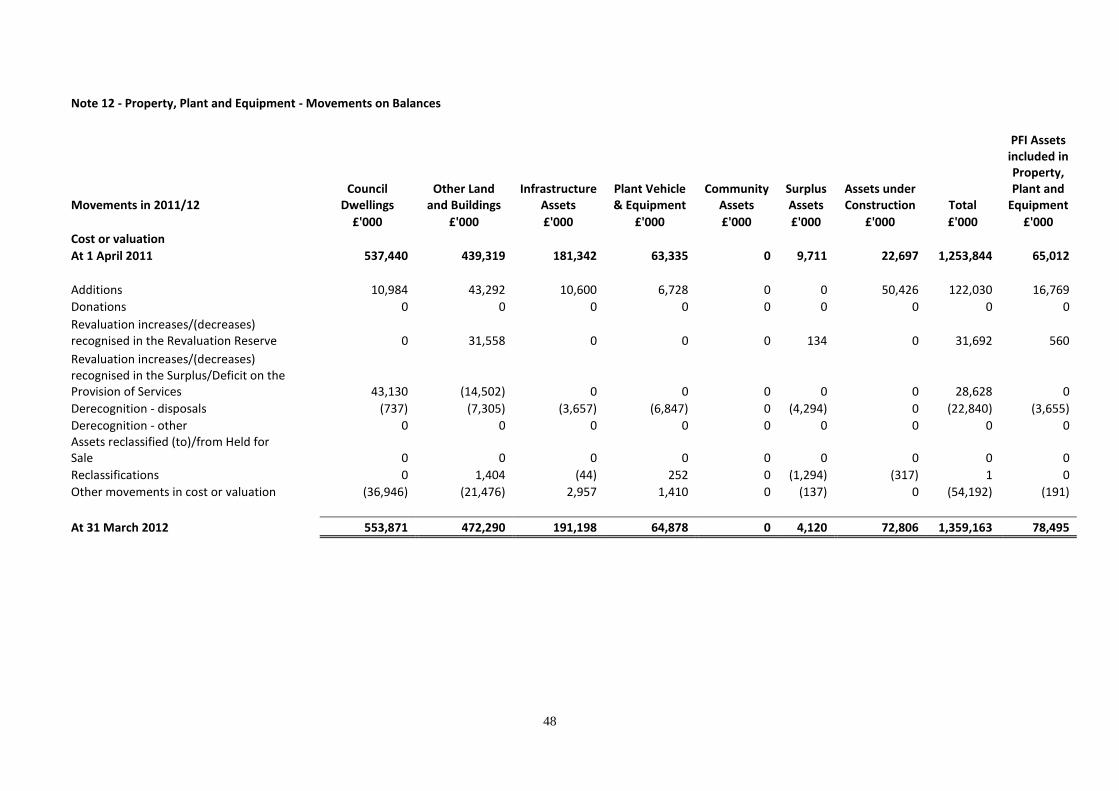
48
Note 12 - Property, Plant and Equipment - Movements on Balances
Movements in 2011/12 Council
Dwellings Other Land
and Buildings Infrastructure
Assets Plant Vehicle & Equipment
Community Assets
Surplus Assets
Assets under Construction Total
PFI Assets included in Property, Plant and
Equipment
£'000 £'000 £'000 £'000 £'000 £'000 £'000 £'000 £'000
Cost or valuation
At 1 April 2011 537,440 439,319 181,342 63,335 0 9,711 22,697 1,253,844 65,012
Additions 10,984 43,292 10,600 6,728 0 0 50,426 122,030 16,769
Donations 0 0 0 0 0 0 0 0 0
Revaluation increases/(decreases) recognised in the Revaluation Reserve 0 31,558 0 0 0 134 0 31,692 560
Revaluation increases/(decreases) recognised in the Surplus/Deficit on the Provision of Services 43,130 (14,502) 0 0 0 0 0 28,628 0
Derecognition - disposals (737) (7,305) (3,657) (6,847) 0 (4,294) 0 (22,840) (3,655)
Derecognition - other 0 0 0 0 0 0 0 0 0 Assets reclassified (to)/from Held for Sale 0 0 0 0 0 0 0 0 0
Reclassifications 0 1,404 (44) 252 0 (1,294) (317) 1 0
Other movements in cost or valuation (36,946) (21,476) 2,957 1,410 0 (137) 0 (54,192) (191)
At 31 March 2012 553,871 472,290 191,198 64,878 0 4,120 72,806 1,359,163 78,495
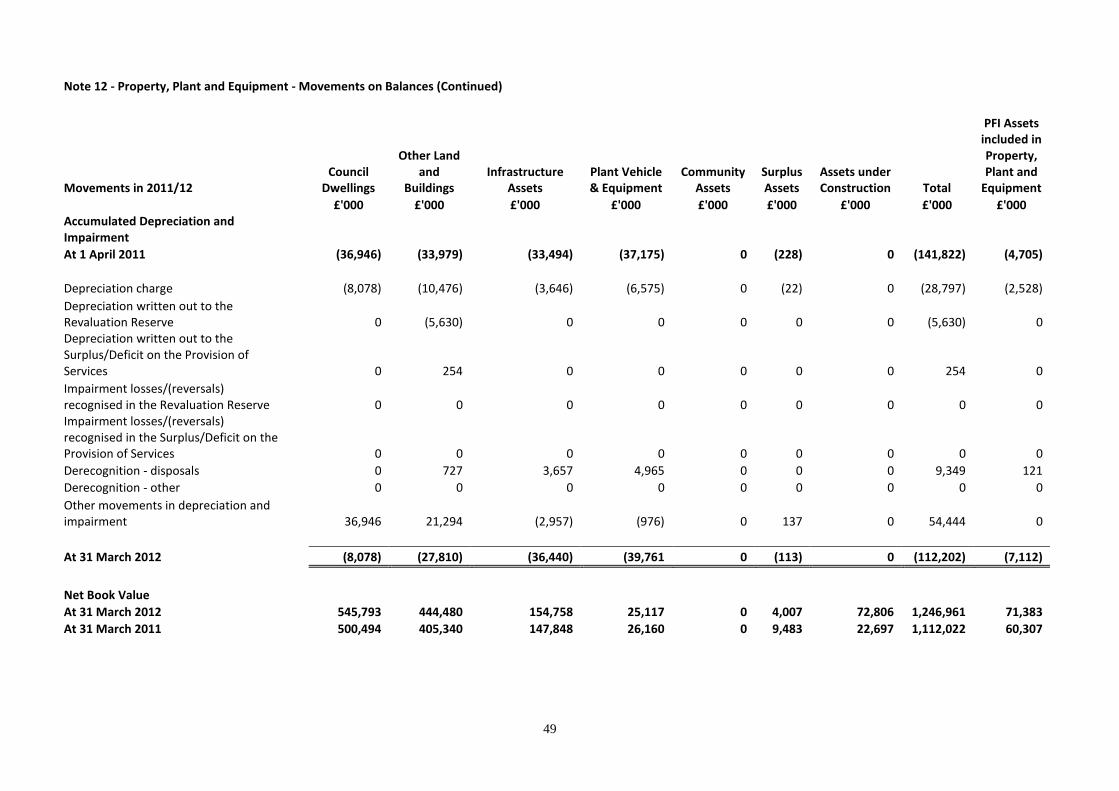
49
Note 12 - Property, Plant and Equipment - Movements on Balances (Continued)
Movements in 2011/12 Council
Dwellings
Other Land and
Buildings Infrastructure
Assets Plant Vehicle & Equipment
Community Assets
Surplus Assets
Assets under Construction Total
PFI Assets included in Property, Plant and
Equipment
£'000 £'000 £'000 £'000 £'000 £'000 £'000 £'000 £'000 Accumulated Depreciation and Impairment
At 1 April 2011 (36,946) (33,979) (33,494) (37,175) 0 (228) 0 (141,822) (4,705)
Depreciation charge (8,078) (10,476) (3,646) (6,575) 0 (22) 0 (28,797) (2,528)
Depreciation written out to the Revaluation Reserve 0 (5,630) 0 0 0 0 0 (5,630) 0 Depreciation written out to the Surplus/Deficit on the Provision of Services 0 254 0 0 0 0 0 254 0
Impairment losses/(reversals) recognised in the Revaluation Reserve 0 0 0 0 0 0 0 0 0 Impairment losses/(reversals) recognised in the Surplus/Deficit on the Provision of Services 0 0 0 0 0 0 0 0 0
Derecognition - disposals 0 727 3,657 4,965 0 0 0 9,349 121
Derecognition - other 0 0 0 0 0 0 0 0 0
Other movements in depreciation and impairment 36,946 21,294 (2,957) (976) 0 137 0 54,444 0
At 31 March 2012 (8,078) (27,810) (36,440) (39,761 0 (113) 0 (112,202) (7,112)
Net Book Value
At 31 March 2012 545,793 444,480 154,758 25,117 0 4,007 72,806 1,246,961 71,383
At 31 March 2011 500,494 405,340 147,848 26,160 0 9,483 22,697 1,112,022 60,307
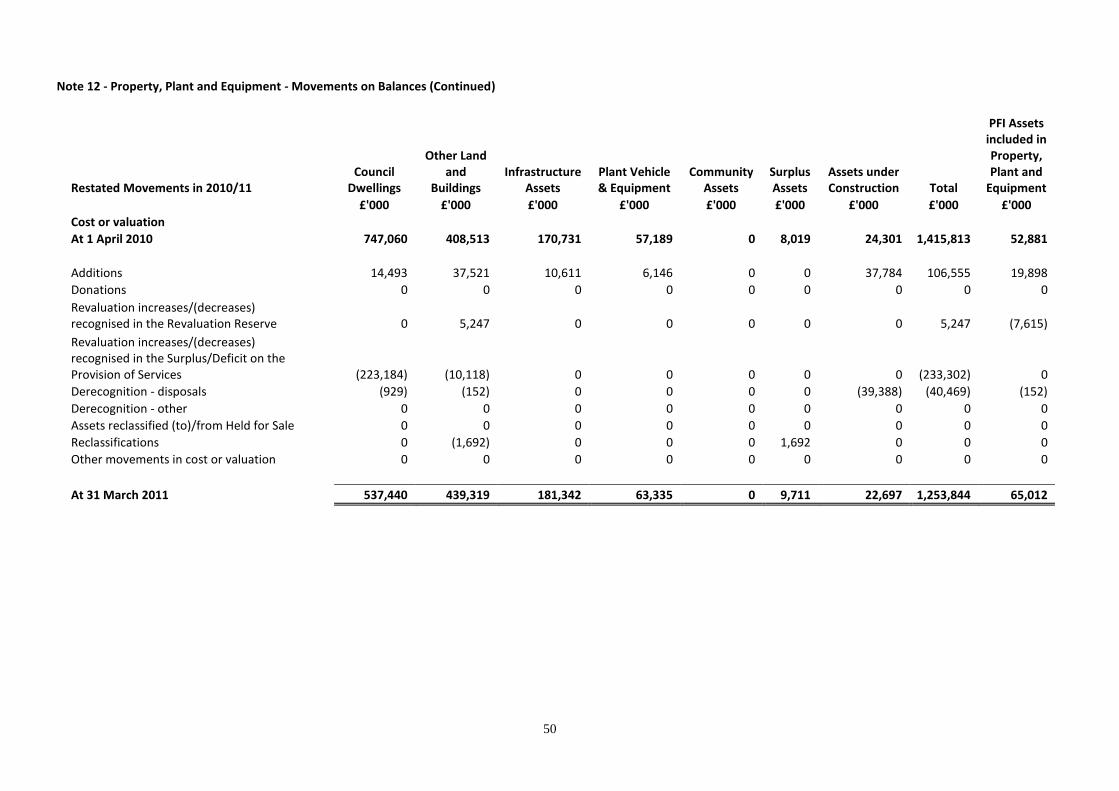
50
Note 12 - Property, Plant and Equipment - Movements on Balances (Continued)
Restated Movements in 2010/11 Council
Dwellings
Other Land and
Buildings Infrastructure
Assets Plant Vehicle & Equipment
Community Assets
Surplus Assets
Assets under Construction Total
PFI Assets included in Property, Plant and
Equipment
£'000 £'000 £'000 £'000 £'000 £'000 £'000 £'000 £'000
Cost or valuation
At 1 April 2010 747,060 408,513 170,731 57,189 0 8,019 24,301 1,415,813 52,881
Additions 14,493 37,521 10,611 6,146 0 0 37,784 106,555 19,898
Donations 0 0 0 0 0 0 0 0 0
Revaluation increases/(decreases) recognised in the Revaluation Reserve 0 5,247 0 0 0 0 0 5,247 (7,615)
Revaluation increases/(decreases) recognised in the Surplus/Deficit on the Provision of Services (223,184) (10,118) 0 0 0 0 0 (233,302) 0
Derecognition - disposals (929) (152) 0 0 0 0 (39,388) (40,469) (152)
Derecognition - other 0 0 0 0 0 0 0 0 0
Assets reclassified (to)/from Held for Sale 0 0 0 0 0 0 0 0 0
Reclassifications 0 (1,692) 0 0 0 1,692 0 0 0
Other movements in cost or valuation 0 0 0 0 0 0 0 0 0
At 31 March 2011 537,440 439,319 181,342 63,335 0 9,711 22,697 1,253,844 65,012
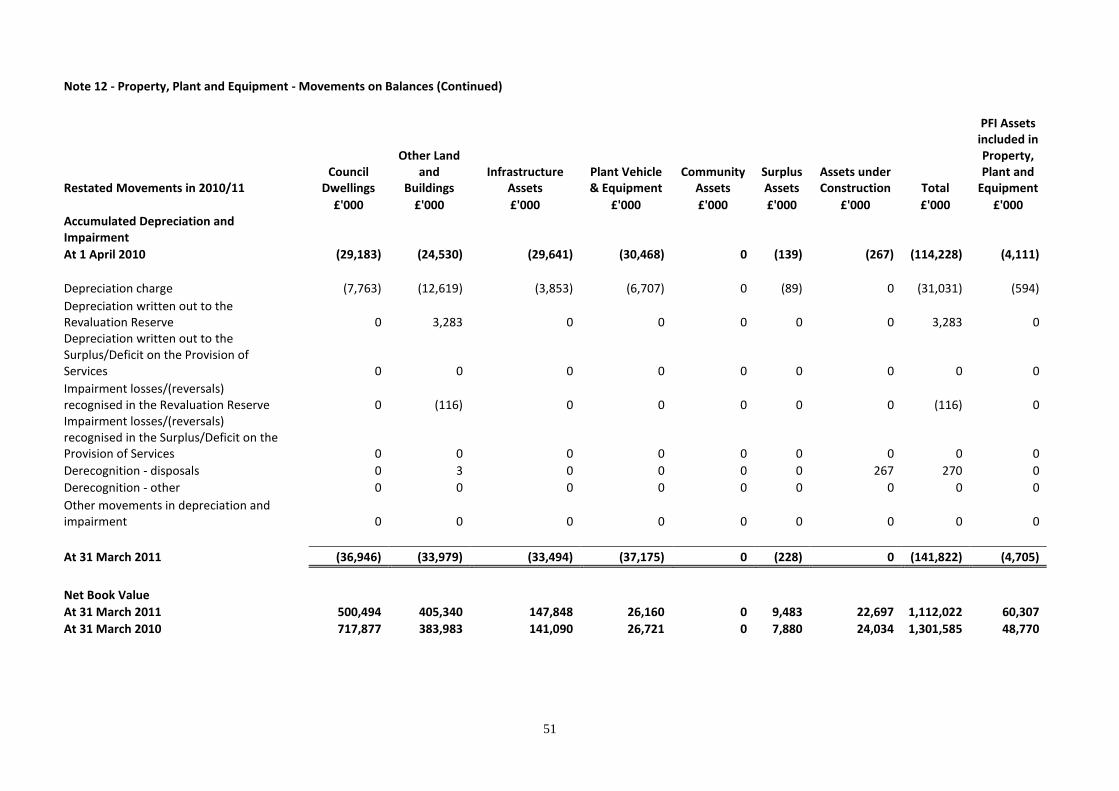
51
Note 12 - Property, Plant and Equipment - Movements on Balances (Continued)
Restated Movements in 2010/11 Council
Dwellings
Other Land and
Buildings Infrastructure
Assets Plant Vehicle & Equipment
Community Assets
Surplus Assets
Assets under Construction Total
PFI Assets included in Property, Plant and
Equipment
£'000 £'000 £'000 £'000 £'000 £'000 £'000 £'000 £'000 Accumulated Depreciation and Impairment
At 1 April 2010 (29,183) (24,530) (29,641) (30,468) 0 (139) (267) (114,228) (4,111)
Depreciation charge (7,763) (12,619) (3,853) (6,707) 0 (89) 0 (31,031) (594)
Depreciation written out to the Revaluation Reserve 0 3,283 0 0 0 0 0 3,283 0 Depreciation written out to the Surplus/Deficit on the Provision of Services 0 0 0 0 0 0 0 0 0
Impairment losses/(reversals) recognised in the Revaluation Reserve 0 (116) 0 0 0 0 0 (116) 0 Impairment losses/(reversals) recognised in the Surplus/Deficit on the Provision of Services 0 0 0 0 0 0 0 0 0
Derecognition - disposals 0 3 0 0 0 0 267 270 0
Derecognition - other 0 0 0 0 0 0 0 0 0
Other movements in depreciation and impairment 0 0 0 0 0 0 0 0 0
At 31 March 2011 (36,946) (33,979) (33,494) (37,175) 0 (228) 0 (141,822) (4,705)
Net Book Value
At 31 March 2011 500,494 405,340 147,848 26,160 0 9,483 22,697 1,112,022 60,307
At 31 March 2010 717,877 383,983 141,090 26,721 0 7,880 24,034 1,301,585 48,770
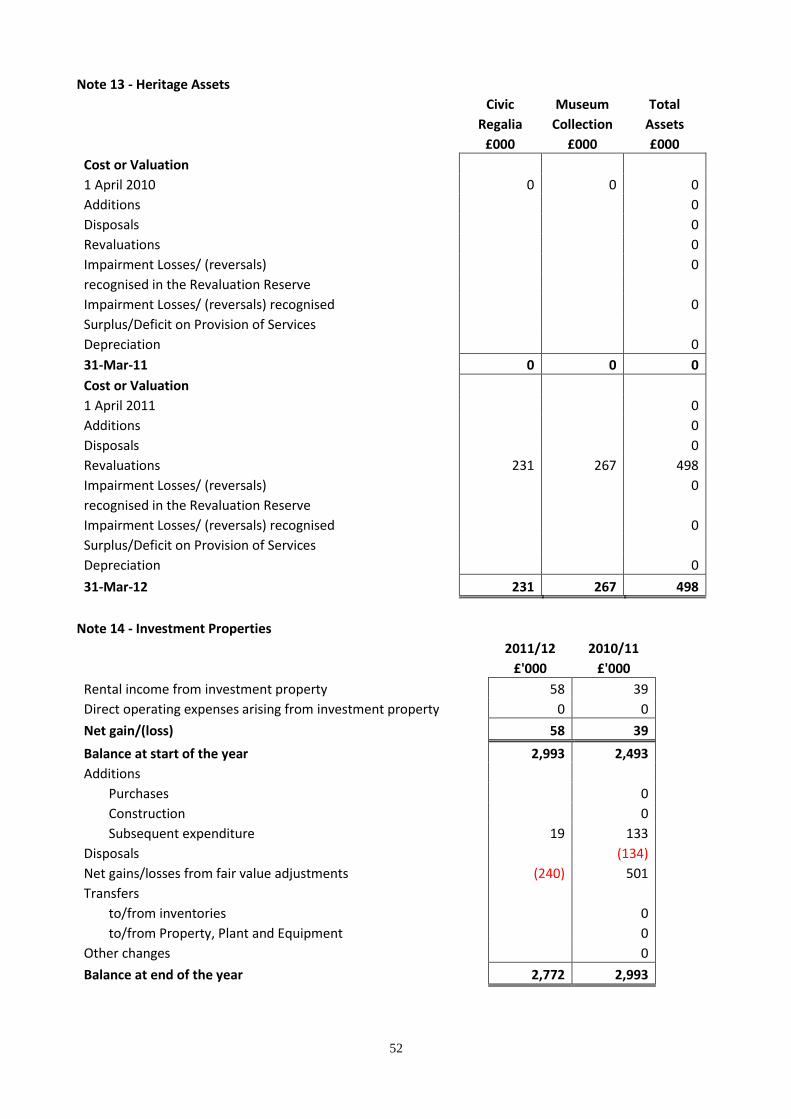
52
Note 13 - Heritage Assets
Civic Museum Total
Regalia Collection Assets
£000 £000 £000
Cost or Valuation
1 April 2010 0 0 0
Additions 0
Disposals 0
Revaluations 0
Impairment Losses/ (reversals) 0
recognised in the Revaluation Reserve
Impairment Losses/ (reversals) recognised 0
Surplus/Deficit on Provision of Services
Depreciation 0
31-Mar-11 0 0 0
Cost or Valuation
1 April 2011 0
Additions 0
Disposals 0
Revaluations 231 267 498
Impairment Losses/ (reversals) 0
recognised in the Revaluation Reserve
Impairment Losses/ (reversals) recognised 0
Surplus/Deficit on Provision of Services
Depreciation 0
31-Mar-12 231 267 498
Note 14 - Investment Properties
2011/12 2010/11
£'000 £'000
Rental income from investment property 58 39
Direct operating expenses arising from investment property 0 0
Net gain/(loss) 58 39
Balance at start of the year 2,993 2,493
Additions
Purchases 0
Construction 0
Subsequent expenditure 19 133
Disposals (134)
Net gains/losses from fair value adjustments (240) 501
Transfers
to/from inventories 0
to/from Property, Plant and Equipment 0
Other changes 0
Balance at end of the year 2,772 2,993

53
Note 15 - Intangible Assets
2011/12 2010/11
Internally Generated
Assets Other Assets Total
Internally Generated
Assets Other Assets Total
£'000 £'000 £'000 £'000 £'000 £'000
Balance at start of the year Gross carrying amounts 2,370 721 3,091 1,301 629 1,930 Accumulated amortisation (269) (145) (414) (36) 0 (36)
Net carrying amount at start of year 2,101 576 2,677 1,265 629 1,894 Additions: Internal development 280 0 280 1,069 0 1,069 Purchases 604 0 604 0 92 92 Acquired through business combinations 0 0 0 0 0 0 Assets reclassified as held for sale 0 0 0 0 0 0 Other disposals 0 (258) (258) 0 0 0 Revaluation increases or decreases 0 0 0 0 0 0 Impairment losses recognised or reversed directly in the Revaluation Reserve 0 0 0 0 0 0 Impairment losses recognised in the surplus/deficit on the Provision of Services 0 0 0 0 0 0 Reversals of past impairment losses written back to the surplus/deficit on the Provision of Services 0 0 0 0 0 0 Amortisation for the period (825) 0 (825) (233) (145) (378) Depreciation & Impairment Derecognition - Disposal 0 145 145 0 0 0
Net carrying amount at end of year 2,160 463 2,623 2,101 576 2,677
Comprising Gross carrying amounts 3,254 463 3,717 2,370 721 3,091 Accumulated amortisation (1,094) 0 (1,094) (269) (145) (414)
2,160 463 2,623 2,101 576 2,677
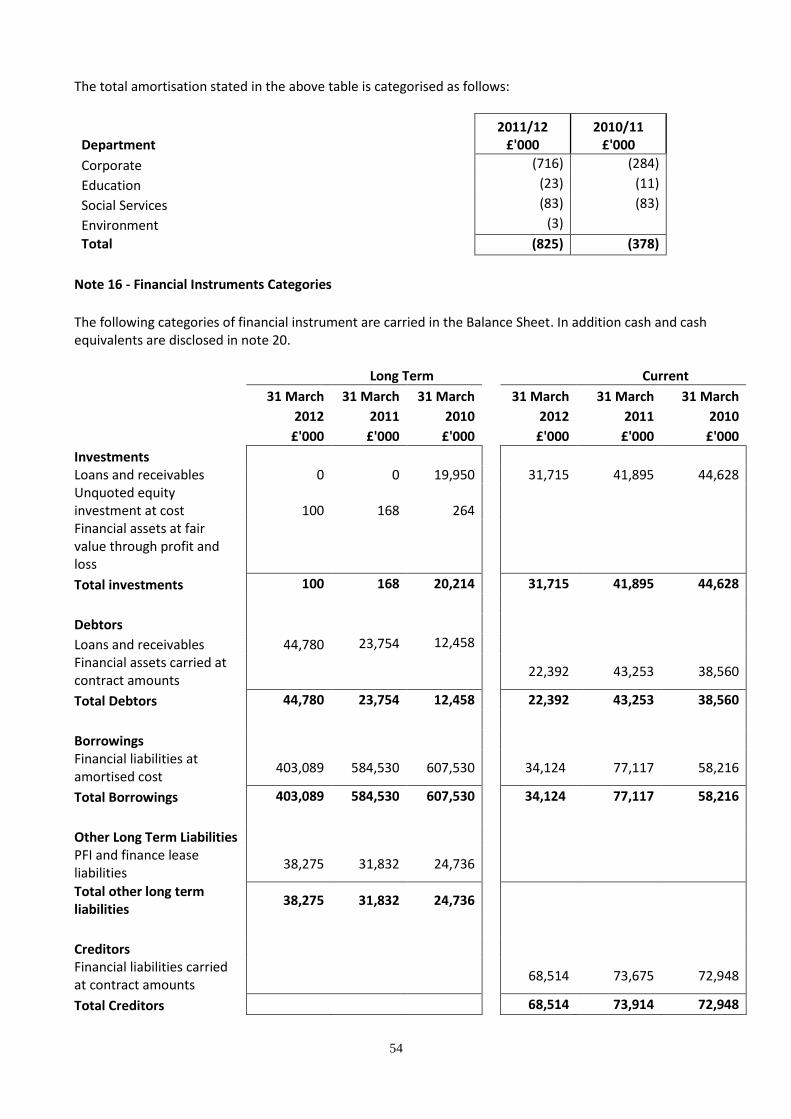
54
The total amortisation stated in the above table is categorised as follows:
Department 2011/12
£'000 2010/11
£'000
Corporate (716) (284)
Education (23) (11)
Social Services (83) (83)
Environment (3)
Total (825) (378)
Note 16 - Financial Instruments Categories
The following categories of financial instrument are carried in the Balance Sheet. In addition cash and cash equivalents are disclosed in note 20.
Long Term
Current
31 March 31 March 31 March 31 March 31 March 31 March
2012 2011 2010 2012 2011 2010
£'000 £'000 £'000 £'000 £'000 £'000
Investments Loans and receivables 0 0 19,950 31,715 41,895 44,628 Unquoted equity investment at cost 100 168 264
Financial assets at fair value through profit and loss
Total investments 100 168 20,214 31,715 41,895 44,628
Debtors
Loans and receivables 44,780 23,754 12,458
Financial assets carried at contract amounts
22,392 43,253 38,560
Total Debtors 44,780 23,754 12,458
22,392 43,253 38,560
Borrowings
Financial liabilities at amortised cost
403,089 584,530 607,530 34,124 77,117 58,216
Total Borrowings 403,089 584,530 607,530 34,124 77,117 58,216
Other Long Term Liabilities
PFI and finance lease liabilities
38,275 31,832 24,736
Total other long term liabilities
38,275 31,832 24,736
Creditors
Financial liabilities carried at contract amounts
68,514 73,675 72,948
Total Creditors
68,514 73,914 72,948
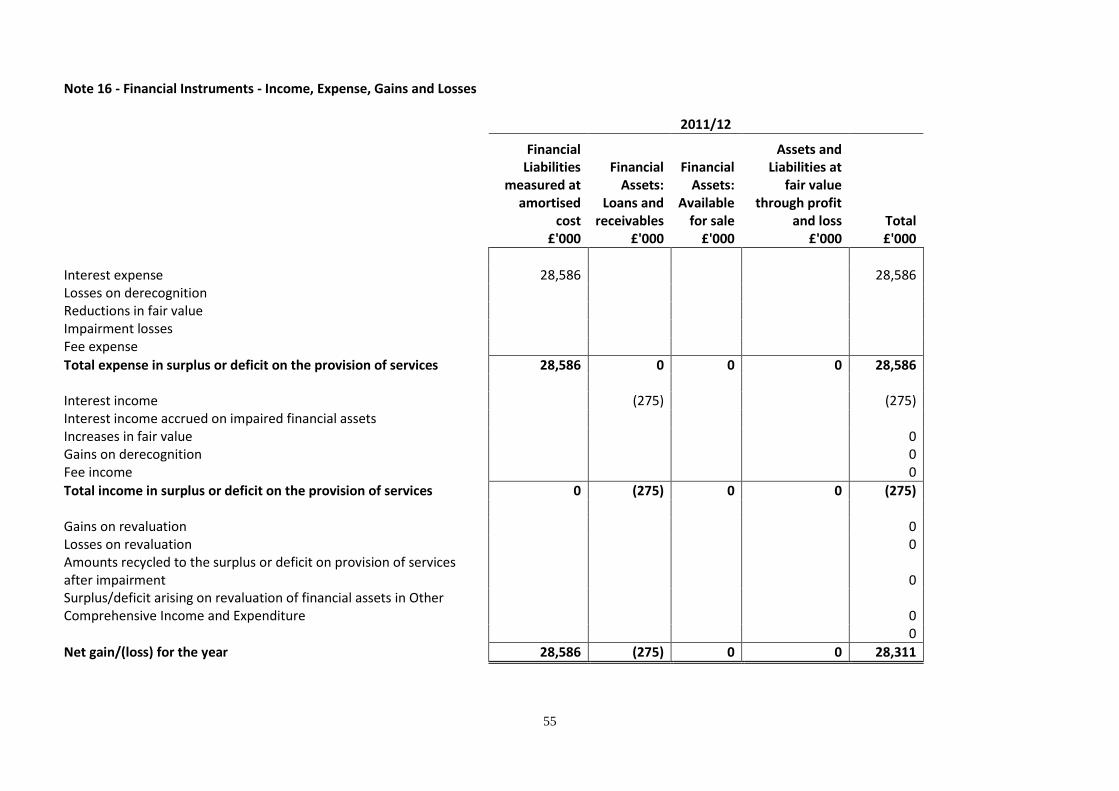
55
Note 16 - Financial Instruments - Income, Expense, Gains and Losses
2011/12
Financial Liabilities
measured at amortised
cost
Financial Assets:
Loans and receivables
Financial Assets:
Available for sale
Assets and Liabilities at
fair value through profit
and loss Total £'000 £'000 £'000 £'000 £'000
Interest expense 28,586 28,586 Losses on derecognition
Reductions in fair value
Impairment losses
Fee expense
Total expense in surplus or deficit on the provision of services 28,586 0 0 0 28,586
Interest income (275) (275)
Interest income accrued on impaired financial assets
Increases in fair value
0
Gains on derecognition
0 Fee income
0
Total income in surplus or deficit on the provision of services 0 (275) 0 0 (275) Gains on revaluation 0 Losses on revaluation 0 Amounts recycled to the surplus or deficit on provision of services after impairment 0 Surplus/deficit arising on revaluation of financial assets in Other Comprehensive Income and Expenditure 0 0
Net gain/(loss) for the year 28,586 (275) 0 0 28,311

56
Note 16 - Financial Instruments - Income, Expense, Gains and Losses (Continued)
2010/11
Financial Liabilities
measured at amortised cost
Financial Assets:
Loans and receivables
Financial Assets:
Available for sale
Assets and Liabilities at
fair value through profit
and loss Total £'000 £'000 £'000 £'000 £'000
Interest expense 29,734 29,734 Losses on derecognition 0 Reductions in fair value 0 Impairment losses 0 Fee expense 0
Total expense in surplus or deficit on the provision of services 29,734 0 0 0 29,734 Interest income (974) (974) Interest income accrued on impaired financial assets 0 Increases in fair value 0 Gains on derecognition 0 Fee income 0
Total income in surplus or deficit on the provision of services 0 (974) 0 0 (974) Gains on revaluation 0 Losses on revaluation 0 Amounts recycled to the surplus or deficit on provision of services after impairment 0 Surplus/deficit arising on revaluation of financial assets in Other Comprehensive Income and Expenditure 0 0
Net gain/(loss) for the year 29,734 (974) 0 0 28,760

57
Note 16 - Fair Values of Assets and Liabilities The Council’s long term financial assets and financial liabilities are carried in the Balance Sheet at amortised cost. The portion of borrowings and investments due to be settled within 12 months of the Balance Sheet date are presented in the Balance Sheet under short term borrowings or short term investments. This includes accrued interest for long term investments and borrowings, as well as accrued interest for cash and cash equivalents. The Council’s long term borrowing at 31 March 2011 and 31 March 2012 consisted of loans from the Public Works Loan Board (PWLB) and market loans. The PWLB has provided the Council with Fair Value amounts in relation to its debt portfolio, assessed by calculating the amounts the Council would have had to pay to extinguish the loans on these dates. In the case of market loans, the Council’s Treasury Adviser has calculated the fair value based on equivalent swap rates at the Balance Sheet date. The carrying amount of short term borrowing is considered to be at fair value.
The Council’s investments consisted almost entirely of term deposits with Banks and public sector bodies. The maturity dates of these investments were within 12 months of the Balance Sheet date. The contracts of term deposits do not permit premature redemption. None of the investments were impaired (i.e. at risk of default), apart from the deposits with Icelandic banks referred to below.
31 March 2012 31 March 2011
Carrying Fair Carrying Fair
Amount Value Amount Value
£'000 £'000 £'000 £'000
Financial Liabilities
Short Term Borrowing
34,124 34,124
77,117 77,117
Long Term Borrowing 403,089 550,082 584,530 682,859
Long Term Creditors
35,540 35,540 31,832 31,832
The fair value of long term borrowing is higher than the carrying amount because the Council’s portfolio of loans includes a number of loans where the interest rate payable is higher than the rates available for similar loans at the Balance Sheet date.
Financial Assets
Loans and Receivables 41,820 41,820 41,895 41,895
Long Term Debtors 44,780 44,780 23,754 23,754
The amortised value of investments is felt to be a good estimate of the Fair Value.
Impairment of Deposits with Icelandic Banks
The details of the original deposits were:
Amount Interest Rate Maturity
£m % Heritable 10 5.85 13.11.08
Glitnir 5 5.85 12.12.08

58
All monies within these institutions are currently subject to the respective administration and receivership processes. The amounts and timing of payments to depositors such as the Council will be determined by the administrators/receivers.
The current situation with regards to recovery of the sums deposited varies between each institution. Based on the latest information available the Council considers that it is appropriate to consider an impairment adjustment for the deposits, and has taken the action outlined below. As the available information is not definitive as to the amounts and timings of payments to be made by the administrators/receivers, it is likely that further adjustments will be made to the accounts in future years.
Heritable Bank Heritable bank is a UK registered bank under Scottish law. The company was placed in administration on 7th October 2008. The creditor progress report issued by the administrators Ernst and Young indicate that the Council is likely to recover between 86p and 90p in the pound. The Council has therefore decided to recognise an impairment of £2m in order to cover any reasonably expected loss. As at 31st March 2012, the Council had recovered £6.79m. It is anticipated that there will be some front loading of these repayments and that a final sale of assets will take place after the books have been run down to the end of 2013. The Council has made the following assumptions re timing of future repayments: April 2012 - 3.79% July 2012 - 3.5% October 2012 - 3.5% January 2013 - 3.5% April 2013 - 5.81%
Recoveries are expressed as a percentage of the Council’s claim in the administration, which includes interest accrued up to 6th October 2008.
Glitnir Bank hf
Glitnir Bank hf is an Icelandic entity. Following steps taken by the Icelandic Government in early October 2008 its domestic assets and liabilities were transferred to a new bank (new Glitnir) with the management of the affairs of old Glitnir being placed in the hands of a resolution committee. Old Glitnir’s affairs are being administered under Icelandic law. Old Glitnir’s latest public presentation of its affairs was made to creditors on 6th February 2009 and can be viewed on its website. Court action in Iceland has confirmed that the Council is a preferential creditor and £4m (of £5m) has been repaid to the Council. The balance is being held in an escrow account in Icelandic krone. Recovery of the remaining balance is subject to the impact of exchange rate fluctuations on the value of assets recovered by the resolution committee and on the settlement of the Council’s claim, which may be denominated wholly or partly in currencies other than sterling.
Note 17 - Inventories
Consumable
Stores
2011/12 2010/11
£'000 £'000
Balance outstanding at start of year 104 120
Purchases
Recognised as an expense in the year 34 (16)
Written off balances
Reversals of write-offs in previous years
Balance outstanding at year end 138 104

59
Note 18 - Construction Contracts
At 31 March 2012 the Council had a single construction contract in progress, for the construction of the Crest Academies (previously known as the John Kelly Schools) on behalf of the Academy Partnership utilizing grant monies provided by the Department of Education. Upon completion of the scheme the buildings will be passed over to the Academy Partnership at nil consideration to the Council. The value of work completed at 31 March 2012 is as per the Council’s Financial Information System as maintained by the scheme’s Project Manager and based on consultants reports. The amount due from the Department of Education at 31 March 2012 is as follows:
CREST Academies £000
Costs Incurred to date 5,149
Revenue recognized:
Before 1 April 2011 0
During 2011/12 8,399
Profit/(Loss) 0
Advances Received 3,250
Gross Amount Due 0
Comprising:
Amounts not billed 0
Retentions 0
Note 19 - Debtors
31-Mar-12 31-Mar-11 31-Mar-10
£'000 £'000 £'000
Central government bodies 12,023 13,861 21,800
Other local authorities 7,621 5,902 7,988
NHS bodies 1,854 2,505 3,999
Public corporations and trading funds 5 136 0
Other entities and individuals 22,392 43,253 38,560
Total 43,895 65,657 72,347
Note 20 - Cash and Cash Equivalents
31-Mar-12 31-Mar-11 31-Mar-10
£'000 £'000 £'000
Cash held by the Council 0 48 137
Bank current accounts 12,559 16,674 17,844
Short-term deposits 31,876 25,042 4,000
Total 44,435 41,764 21,981
Schools overdrawn accounts (3,981) (6,271)
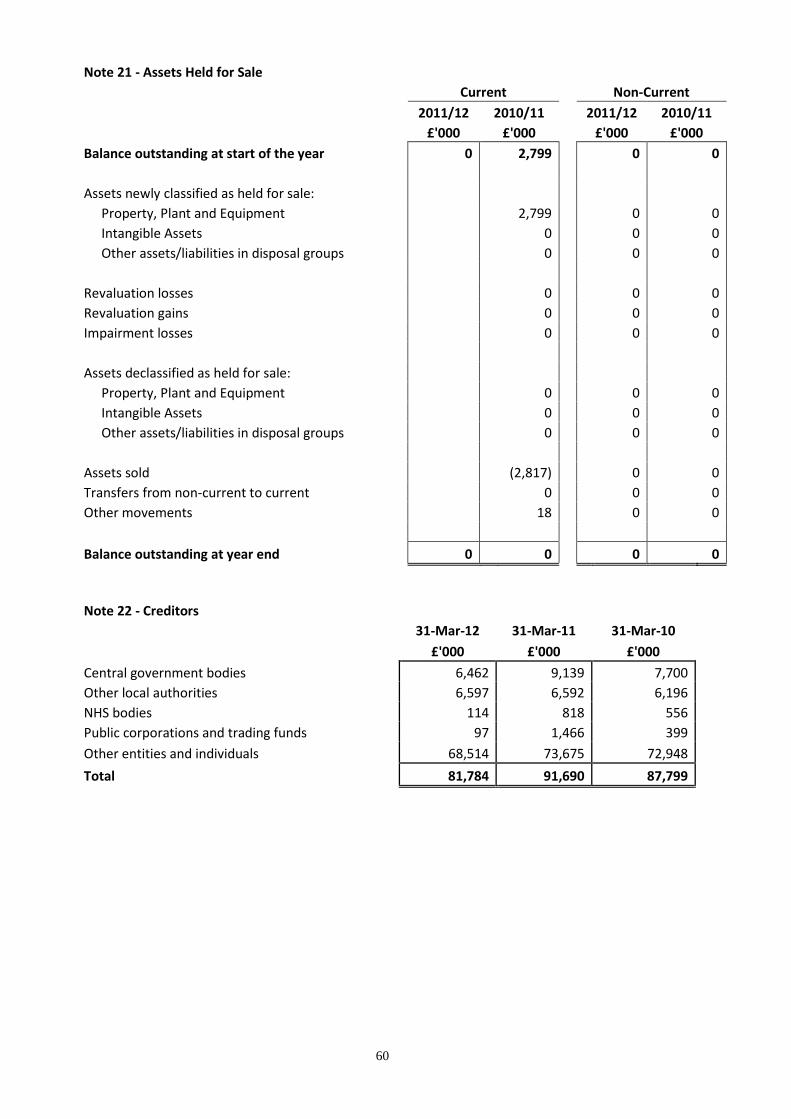
60
Note 21 - Assets Held for Sale
Current Non-Current
2011/12 2010/11 2011/12 2010/11
£'000 £'000 £'000 £'000
Balance outstanding at start of the year 0 2,799 0 0
Assets newly classified as held for sale:
Property, Plant and Equipment
2,799 0 0
Intangible Assets
0 0 0
Other assets/liabilities in disposal groups
0 0 0
Revaluation losses
0 0 0
Revaluation gains
0 0 0
Impairment losses
0 0 0
Assets declassified as held for sale:
Property, Plant and Equipment
0 0 0
Intangible Assets
0 0 0
Other assets/liabilities in disposal groups
0 0 0
Assets sold
(2,817) 0 0
Transfers from non-current to current
0 0 0
Other movements
18 0 0
Balance outstanding at year end 0 0 0 0
Note 22 - Creditors
31-Mar-12 31-Mar-11 31-Mar-10
£'000 £'000 £'000
Central government bodies 6,462 9,139 7,700
Other local authorities 6,597 6,592 6,196
NHS bodies 114 818 556
Public corporations and trading funds 97 1,466 399
Other entities and individuals 68,514 73,675 72,948
Total 81,784 91,690 87,799

61
Note 23 - Provisions
Outstanding Legal Cases
Compensation Claims
Other Provisions Total
SHORT TERM PROVISIONS £'000 £'000 £'000 £'000
Balance at 1 April 2011 1,000 2,044 2,060 5,104
Movement from long-term 46
46 Additional provisions made in 2011/12 272 3,089 993 4,354
Amounts used in 2011/12
(2,324) (1,972) (4,296) Unused amounts reversed in 2011/12
Unwinding of discounting in 2011/12 0
Balance at 31 March 2012 1,318 2,809 1,081 5,208
LONG TERM PROVISIONS
Balance at 1 April 2011 367 2,702 182 3,251
Movement from short term (46)
(46) Additional provisions made in 2011/12
528 528
Amounts used in 2011/12 (167) (304) (88) (559) Unused amounts reversed in 2011/12 0
Unwinding of discounting in 2011/12 0
Balance at 31 March 2012 154 2,398 622 3,174
The information set out below provides a general indication of the potential claims on the Council to protect the Council’s financial position. Outstanding legal claims
Disrepair Cases - Estimated compensation due to Council tenants for disrepair cases. Housing Repairs - To meet legal liabilities to repair leased properties.
Quainton Street S106 - Ongoing legal dispute.
Compulsory Purchase Order – relating to Wembley Estate access road. London Lets - Legal costs relating to outstanding rents, interest and legal costs taken by London Lets Ltd on disputed agreement relating to financial commitment to house 2 bed households in 3 bed properties.

62
Compensation Claims
Uninsured Losses - The Council meets a proportion of its insurance liabilities and claims from the Uninsured Losses provision. The level of the provision is reviewed annually on the basis of information from the Council’s advisers.
Other Provisions Redundancy - Provision for redundancies arising from restructuring of services announced in 2011/12. Finance lease liability - provision for onerous lease. Carbon Reduction Commitment – provision to cover 2011/12 costs of scheme.
Note 24 - Usable Reserves
Movements in the Council’s usable reserves are detailed in the Movement in Reserves Statement and Note 8 to the accounts.
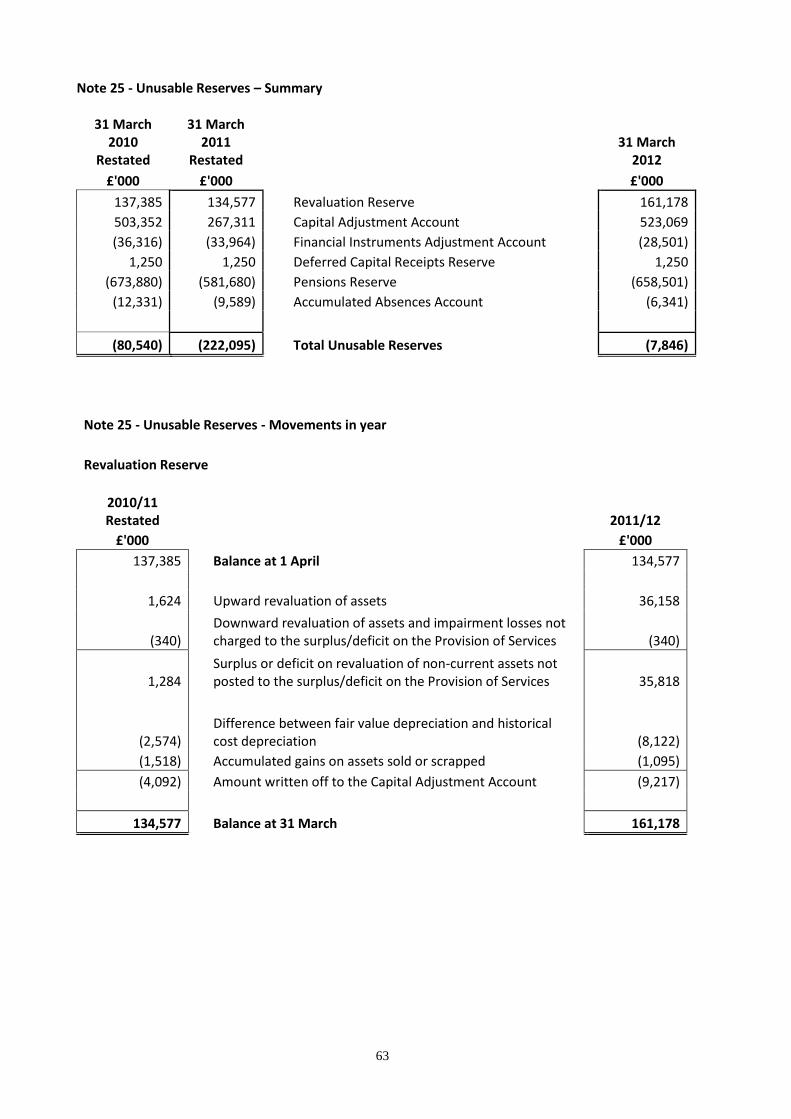
63
Note 25 - Unusable Reserves – Summary
31 March
2010 Restated
31 March 2011
Restated 31 March
2012
£'000 £'000 £'000
137,385 134,577 Revaluation Reserve 161,178
503,352 267,311 Capital Adjustment Account 523,069
(36,316) (33,964) Financial Instruments Adjustment Account (28,501)
1,250 1,250 Deferred Capital Receipts Reserve 1,250
(673,880) (581,680) Pensions Reserve (658,501)
(12,331) (9,589) Accumulated Absences Account (6,341)
(80,540) (222,095) Total Unusable Reserves (7,846)
Note 25 - Unusable Reserves - Movements in year
Revaluation Reserve
2010/11 Restated 2011/12
£'000 £'000
137,385 Balance at 1 April 134,577
1,624 Upward revaluation of assets 36,158
(340) Downward revaluation of assets and impairment losses not charged to the surplus/deficit on the Provision of Services (340)
1,284 Surplus or deficit on revaluation of non-current assets not posted to the surplus/deficit on the Provision of Services 35,818
(2,574) Difference between fair value depreciation and historical cost depreciation (8,122)
(1,518) Accumulated gains on assets sold or scrapped (1,095)
(4,092) Amount written off to the Capital Adjustment Account (9,217)
134,577 Balance at 31 March 161,178

64
Capital Adjustment Account
2010/11 Restated 2011/12
£'000 £'000
503,352 Balance at 1 April 267,311
Reversal of items relating to capital expenditure debited or credited to the Comprehensive Income and Expenditure Statement:
(30,938) Charges for depreciation and impairment of non-current assets (28,732)
(233,514) Revaluation losses on Property, Plant and Equipment 22,999
(378) Amortisation of intangible assets (519)
(21,331) Revenue expenditure funded from capital under statute (21,474)
(42,475)
Amounts of non-current assets written off on disposal or sale as part of the gain/loss on disposal to the Comprehensive Income and Expenditure Statement (13,607)
(328,636) (41,333)
5,005 Adjusting amounts written out of the Revaluation Reserve 9,217
(323,631) Net written out amount of the cost of non-current assets consumed in the year (32,116)
Capital Financing applied in the year:
7,777 Use of the Capital Receipts Reserve to finance new capital expenditure 10,192
6,561 Use of the Major Repairs Reserve to finance new capital expenditure 3,575
57,348
Capital grants and contributions credited to the Comprehensive Income and Expenditure Statement that have been applied to capital financing 49,932
0 Application of grants to capital financing from the Capital Grants Unapplied Account 0
Capital Grant applied to HRA debt repayment 198,000
11,681 Statutory provision for the financing of capital investment charged against the General Fund and HRA balances 14,096
4,724 Capital expenditure charged against the General Fund and HRA balances 12,319
88,091 288,114
(501)
Movements in the market value of Investment Properties debited or credited to the Comprehensive Income and Expenditure Statement (240)
0 Movement in the Donated Assets Account credited to the Comprehensive Income and Expenditure Statement 0
267,311 Balance at 31 March 523,069
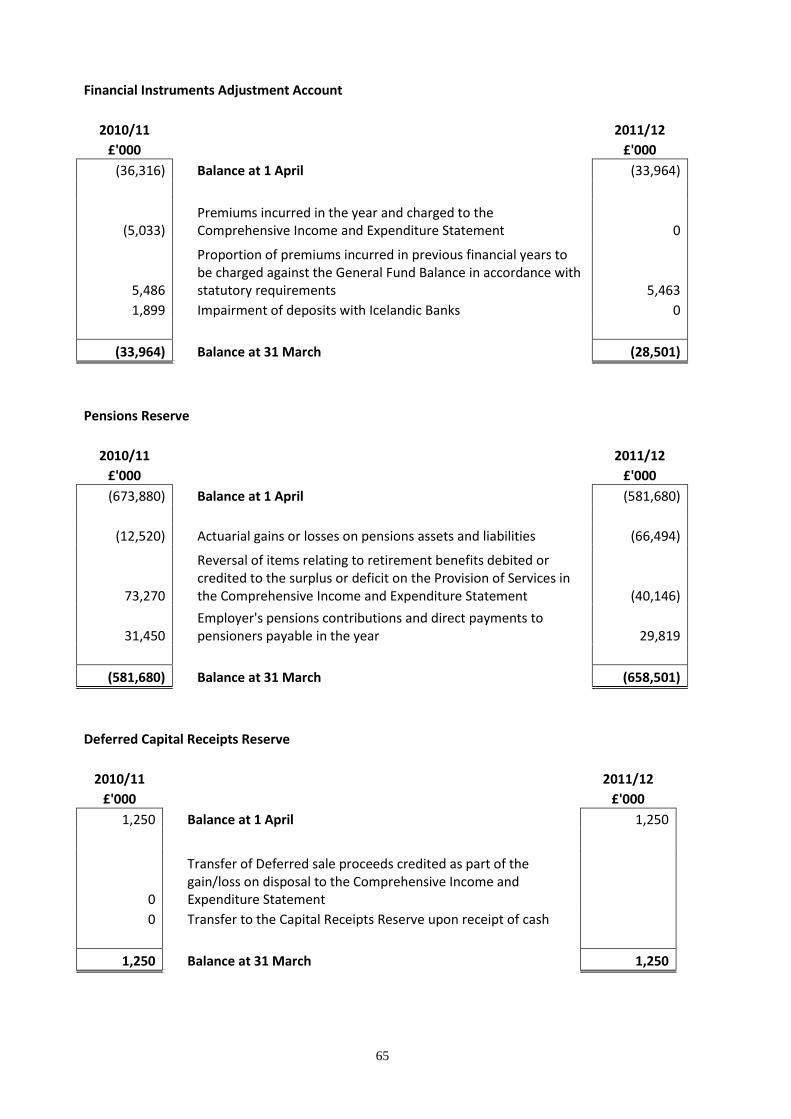
65
Financial Instruments Adjustment Account
2010/11 2011/12
£'000 £'000
(36,316) Balance at 1 April (33,964)
(5,033) Premiums incurred in the year and charged to the Comprehensive Income and Expenditure Statement 0
5,486
Proportion of premiums incurred in previous financial years to be charged against the General Fund Balance in accordance with statutory requirements 5,463
1,899 Impairment of deposits with Icelandic Banks 0
(33,964) Balance at 31 March (28,501)
Pensions Reserve
2010/11 2011/12
£'000 £'000
(673,880) Balance at 1 April (581,680)
(12,520) Actuarial gains or losses on pensions assets and liabilities (66,494)
73,270
Reversal of items relating to retirement benefits debited or credited to the surplus or deficit on the Provision of Services in the Comprehensive Income and Expenditure Statement (40,146)
31,450 Employer's pensions contributions and direct payments to pensioners payable in the year 29,819
(581,680) Balance at 31 March (658,501)
Deferred Capital Receipts Reserve
2010/11 2011/12
£'000 £'000
1,250 Balance at 1 April 1,250
0
Transfer of Deferred sale proceeds credited as part of the gain/loss on disposal to the Comprehensive Income and Expenditure Statement
0 Transfer to the Capital Receipts Reserve upon receipt of cash
1,250 Balance at 31 March 1,250
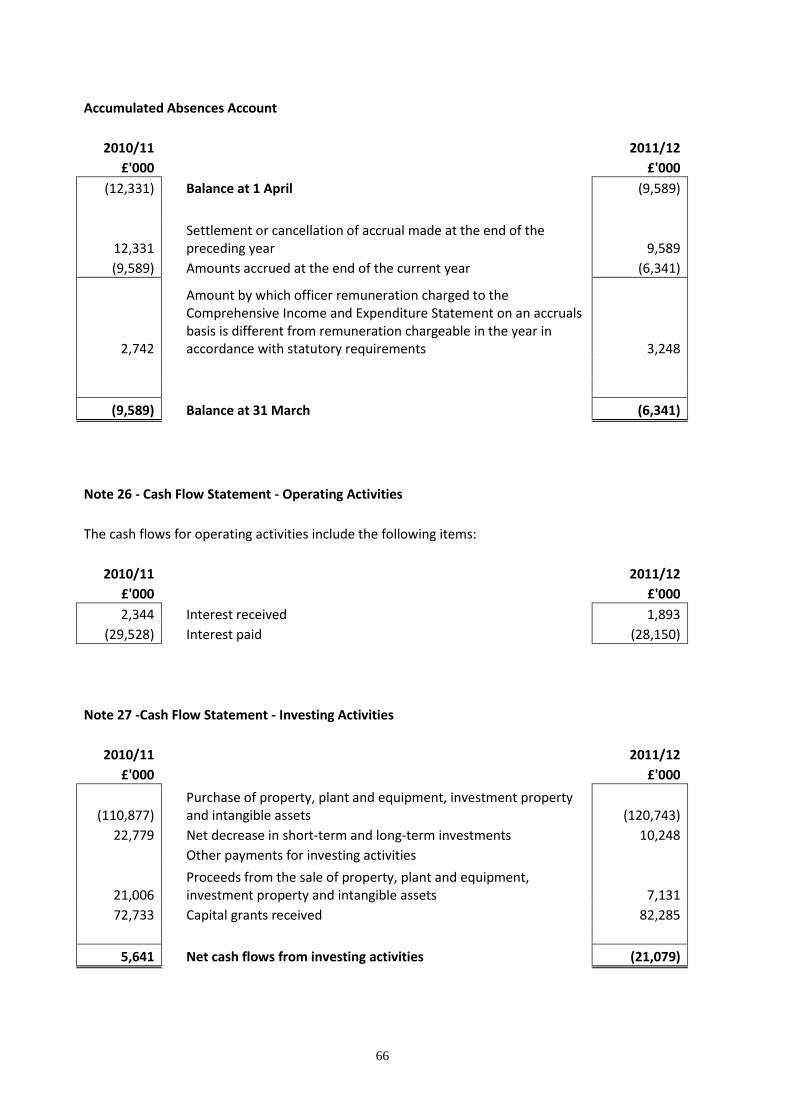
66
Accumulated Absences Account
2010/11 2011/12
£'000 £'000
(12,331) Balance at 1 April (9,589)
12,331 Settlement or cancellation of accrual made at the end of the preceding year 9,589
(9,589) Amounts accrued at the end of the current year (6,341)
2,742
Amount by which officer remuneration charged to the Comprehensive Income and Expenditure Statement on an accruals basis is different from remuneration chargeable in the year in accordance with statutory requirements 3,248
(9,589) Balance at 31 March (6,341)
Note 26 - Cash Flow Statement - Operating Activities
The cash flows for operating activities include the following items:
2010/11 2011/12
£'000 £'000
2,344 Interest received 1,893
(29,528) Interest paid (28,150)
Note 27 -Cash Flow Statement - Investing Activities
2010/11 2011/12
£'000 £'000
(110,877) Purchase of property, plant and equipment, investment property and intangible assets (120,743)
22,779 Net decrease in short-term and long-term investments 10,248
Other payments for investing activities
21,006 Proceeds from the sale of property, plant and equipment, investment property and intangible assets 7,131
72,733 Capital grants received 82,285
5,641 Net cash flows from investing activities (21,079)

67
Note 28 - Cash Flow Statement - Financing Activities
2010/11 2011/12
£'000 £'000
(4,099) Net decrease in short-term and long-term borrowing (224,429)
(983) Cashflows relating to PFI schemes (1,651)
(5,082) Net cash flows from financing activities (226,080)
Note 29 - Amounts Reported for Resource Allocation Decisions / Directorate Income and Expenditure
The analysis of income and expenditure by service on the face of the Comprehensive Income and Expenditure Statement is that specified by the Service Reporting Code of Practice. However, decisions about resource allocation are taken by the Council’s Executive on the basis of budget reports analysed across departments. These reports are prepared on a different basis from the accounting policies used in the financial statements. In particular:
no charges are made in relation to capital expenditure (whereas depreciation, revaluation and impairment losses in excess of the balance on the Revaluation Reserve and amortisations are charged to services in the Comprehensive Income and Expenditure Statement)
the cost of retirement benefits is based on cash flows (payment of employer’s pensions contributions) rather than current service cost of benefits accrued in the year
expenditure on some support services is budgeted for centrally and not charged to departments.
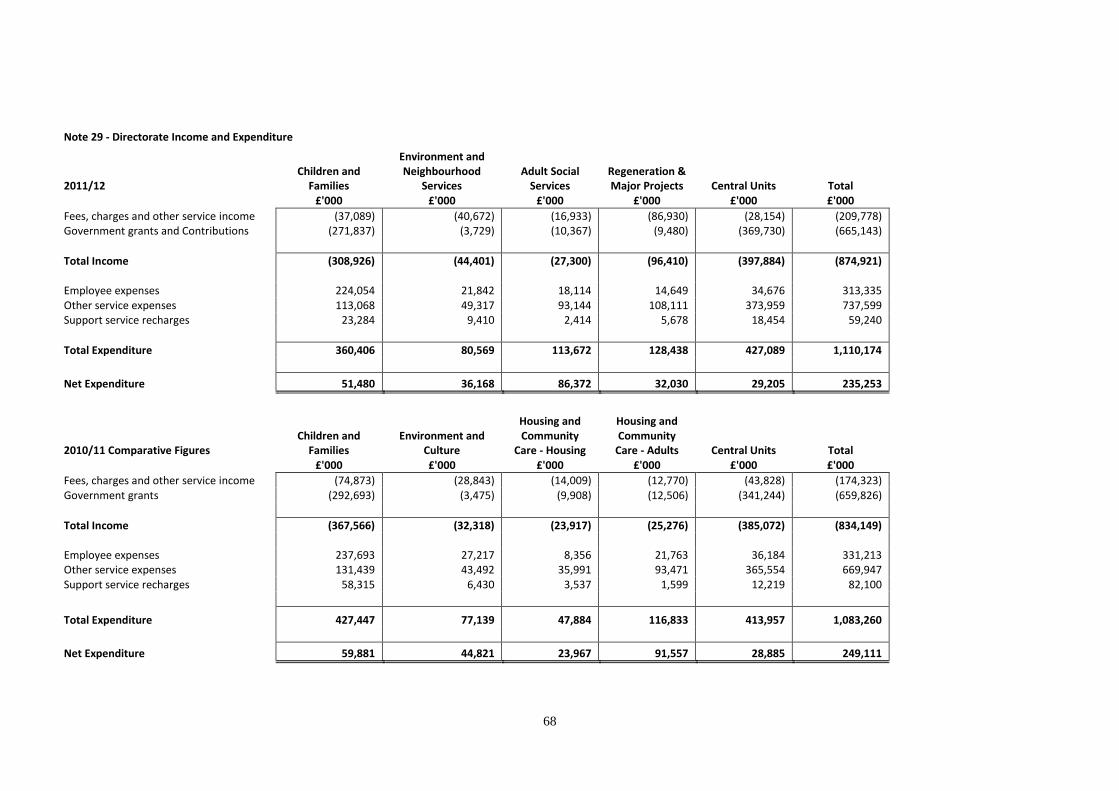
68
Note 29 - Directorate Income and Expenditure
2011/12 Children and
Families
Environment and Neighbourhood
Services Adult Social
Services Regeneration & Major Projects Central Units Total
£'000 £'000 £'000 £'000 £'000 £'000
Fees, charges and other service income (37,089) (40,672) (16,933) (86,930) (28,154) (209,778) Government grants and Contributions (271,837) (3,729) (10,367) (9,480) (369,730) (665,143)
Total Income (308,926) (44,401) (27,300) (96,410) (397,884) (874,921)
Employee expenses 224,054 21,842 18,114 14,649 34,676 313,335 Other service expenses 113,068 49,317 93,144 108,111 373,959 737,599 Support service recharges 23,284 9,410 2,414 5,678 18,454 59,240
Total Expenditure 360,406 80,569 113,672 128,438 427,089 1,110,174
Net Expenditure 51,480 36,168 86,372 32,030 29,205 235,253
2010/11 Comparative Figures Children and
Families Environment and
Culture
Housing and Community
Care - Housing
Housing and Community
Care - Adults Central Units Total £'000 £'000 £'000 £'000 £'000 £'000
Fees, charges and other service income (74,873) (28,843) (14,009) (12,770) (43,828) (174,323) Government grants (292,693) (3,475) (9,908) (12,506) (341,244) (659,826)
Total Income (367,566) (32,318) (23,917) (25,276) (385,072) (834,149) Employee expenses 237,693 27,217 8,356 21,763 36,184 331,213 Other service expenses 131,439 43,492 35,991 93,471 365,554 669,947 Support service recharges 58,315 6,430 3,537 1,599 12,219 82,100
Total Expenditure 427,447 77,139 47,884 116,833 413,957 1,083,260
Net Expenditure 59,881 44,821 23,967 91,557 28,885 249,111
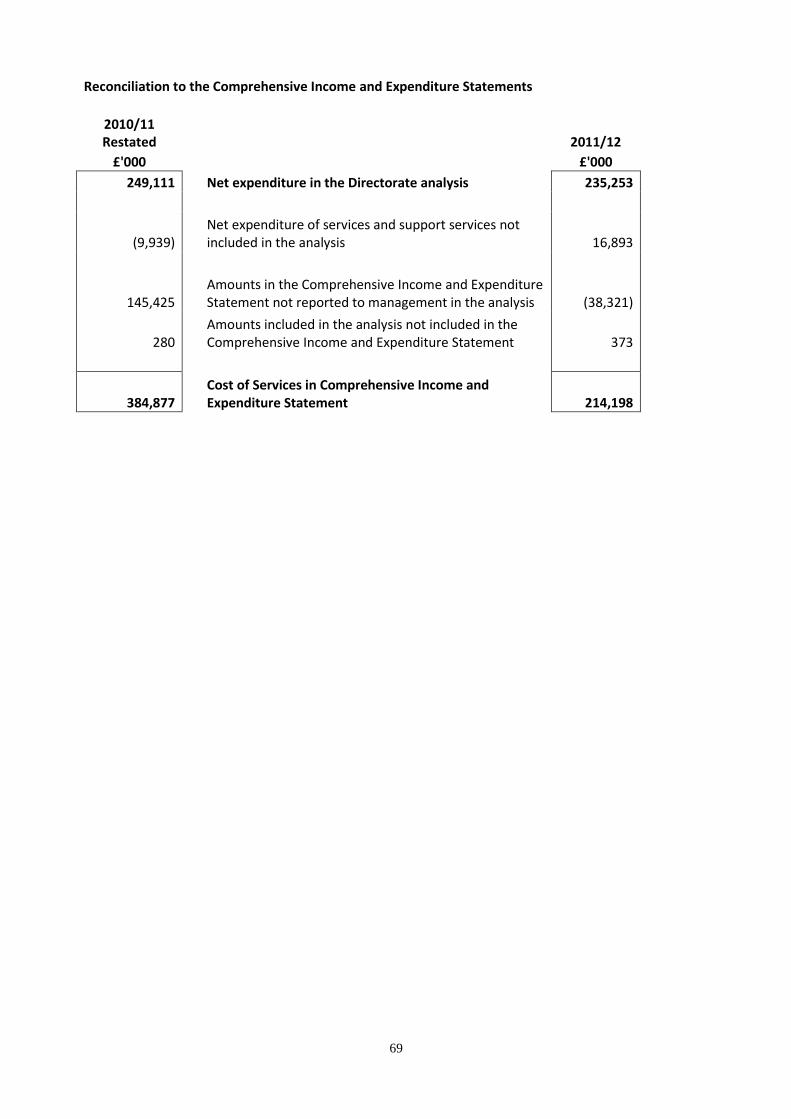
69
Reconciliation to the Comprehensive Income and Expenditure Statements
2010/11 Restated 2011/12
£'000 £'000
249,111 Net expenditure in the Directorate analysis 235,253
(9,939) Net expenditure of services and support services not included in the analysis 16,893
145,425 Amounts in the Comprehensive Income and Expenditure Statement not reported to management in the analysis (38,321)
280 Amounts included in the analysis not included in the Comprehensive Income and Expenditure Statement 373
384,877 Cost of Services in Comprehensive Income and Expenditure Statement 214,198
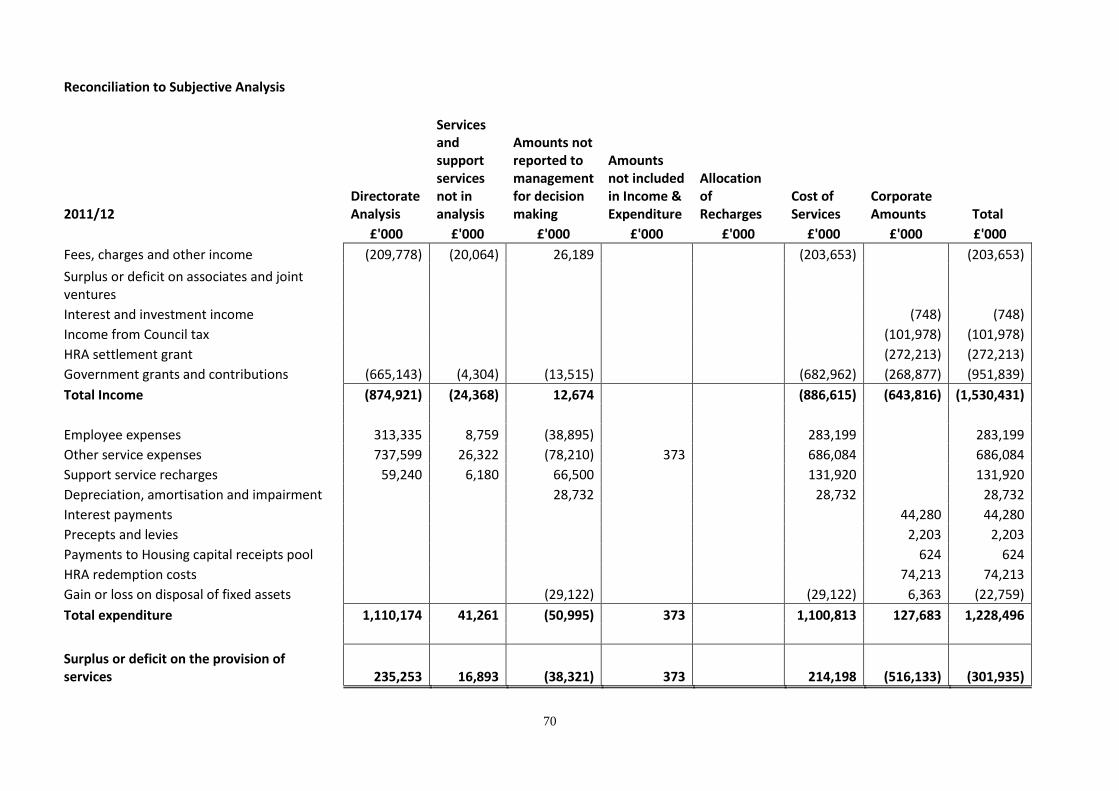
70
Reconciliation to Subjective Analysis
2011/12 Directorate Analysis
Services and support services not in analysis
Amounts not reported to management for decision making
Amounts not included in Income & Expenditure
Allocation of Recharges
Cost of Services
Corporate Amounts Total
£'000 £'000 £'000 £'000 £'000 £'000 £'000 £'000
Fees, charges and other income (209,778) (20,064) 26,189
(203,653)
(203,653)
Surplus or deficit on associates and joint ventures
Interest and investment income
(748) (748)
Income from Council tax
(101,978) (101,978)
HRA settlement grant
(272,213) (272,213)
Government grants and contributions (665,143) (4,304) (13,515)
(682,962) (268,877) (951,839)
Total Income (874,921) (24,368) 12,674
(886,615) (643,816) (1,530,431)
Employee expenses 313,335 8,759 (38,895)
283,199
283,199
Other service expenses 737,599 26,322 (78,210) 373
686,084
686,084
Support service recharges 59,240 6,180 66,500
131,920
131,920
Depreciation, amortisation and impairment
28,732
28,732
28,732
Interest payments
44,280 44,280
Precepts and levies
2,203 2,203
Payments to Housing capital receipts pool
624 624
HRA redemption costs
74,213 74,213
Gain or loss on disposal of fixed assets
(29,122)
(29,122) 6,363 (22,759)
Total expenditure 1,110,174 41,261 (50,995) 373
1,100,813 127,683 1,228,496
Surplus or deficit on the provision of
services 235,253 16,893 (38,321) 373
214,198 (516,133) (301,935)
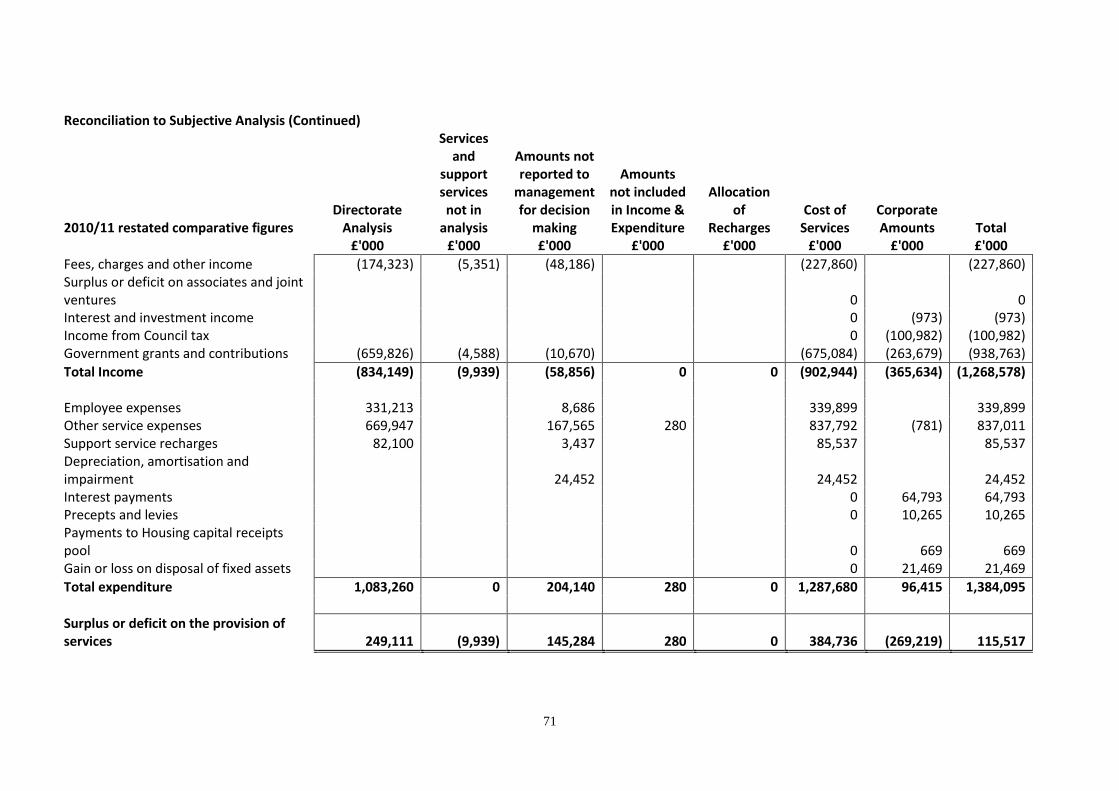
71
Reconciliation to Subjective Analysis (Continued)
2010/11 restated comparative figures Directorate
Analysis
Services and
support services not in
analysis
Amounts not reported to
management for decision
making
Amounts not included in Income & Expenditure
Allocation of
Recharges Cost of
Services Corporate Amounts Total
£'000 £'000 £'000 £'000 £'000 £'000 £'000 £'000
Fees, charges and other income (174,323) (5,351) (48,186) (227,860) (227,860) Surplus or deficit on associates and joint ventures 0 0 Interest and investment income 0 (973) (973) Income from Council tax 0 (100,982) (100,982) Government grants and contributions (659,826) (4,588) (10,670) (675,084) (263,679) (938,763)
Total Income (834,149) (9,939) (58,856) 0 0 (902,944) (365,634) (1,268,578) Employee expenses 331,213 8,686 339,899 339,899 Other service expenses 669,947 167,565 280 837,792 (781) 837,011 Support service recharges 82,100 3,437 85,537 85,537 Depreciation, amortisation and impairment 24,452 24,452 24,452 Interest payments 0 64,793 64,793 Precepts and levies 0 10,265 10,265 Payments to Housing capital receipts pool 0 669 669 Gain or loss on disposal of fixed assets 0 21,469 21,469
Total expenditure 1,083,260 0 204,140 280 0 1,287,680 96,415 1,384,095
Surplus or deficit on the provision of services 249,111 (9,939) 145,284 280 0 384,736 (269,219) 115,517
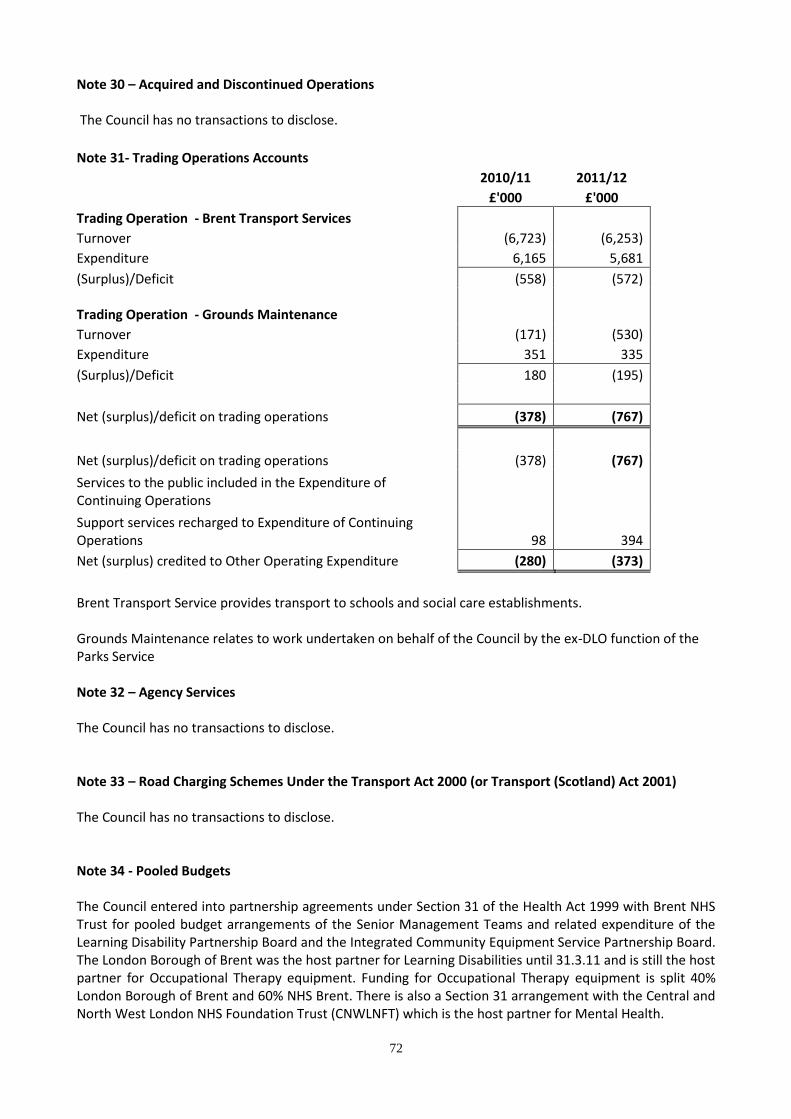
72
Note 30 – Acquired and Discontinued Operations The Council has no transactions to disclose.
Note 31- Trading Operations Accounts
2010/11 2011/12
£'000 £'000
Trading Operation - Brent Transport Services
Turnover (6,723) (6,253)
Expenditure 6,165 5,681
(Surplus)/Deficit (558) (572) Trading Operation - Grounds Maintenance
Turnover (171) (530)
Expenditure 351 335
(Surplus)/Deficit 180 (195)
Net (surplus)/deficit on trading operations (378) (767)
Net (surplus)/deficit on trading operations (378) (767)
Services to the public included in the Expenditure of Continuing Operations
Support services recharged to Expenditure of Continuing Operations 98 394
Net (surplus) credited to Other Operating Expenditure (280) (373)
Brent Transport Service provides transport to schools and social care establishments. Grounds Maintenance relates to work undertaken on behalf of the Council by the ex-DLO function of the Parks Service Note 32 – Agency Services The Council has no transactions to disclose. Note 33 – Road Charging Schemes Under the Transport Act 2000 (or Transport (Scotland) Act 2001) The Council has no transactions to disclose. Note 34 - Pooled Budgets The Council entered into partnership agreements under Section 31 of the Health Act 1999 with Brent NHS Trust for pooled budget arrangements of the Senior Management Teams and related expenditure of the Learning Disability Partnership Board and the Integrated Community Equipment Service Partnership Board. The London Borough of Brent was the host partner for Learning Disabilities until 31.3.11 and is still the host partner for Occupational Therapy equipment. Funding for Occupational Therapy equipment is split 40% London Borough of Brent and 60% NHS Brent. There is also a Section 31 arrangement with the Central and North West London NHS Foundation Trust (CNWLNFT) which is the host partner for Mental Health.

73
The Partnerships’ income and expenditure for 2011/12 was: Mental Occupational
Health Therapy
£'000 £'000
Funding: London Borough of Brent (566) (450)
Brent NHS Trust - (675)
CNWLNFT (1261) -
Total Funding (1827) (1125)
Expenditure 1827 1094
Net Overspend/(Underspend) 0 (31)
2010/11 Net Overspend/(Underspend) (12) (56)
Note 35 - Members Allowances
Total payments including National Insurance costs in 2011/12 were £943,000 (£940,000 in 2010/11). Details of the Members' Allowances scheme are available on Brent's website (www.brent.gov.uk).
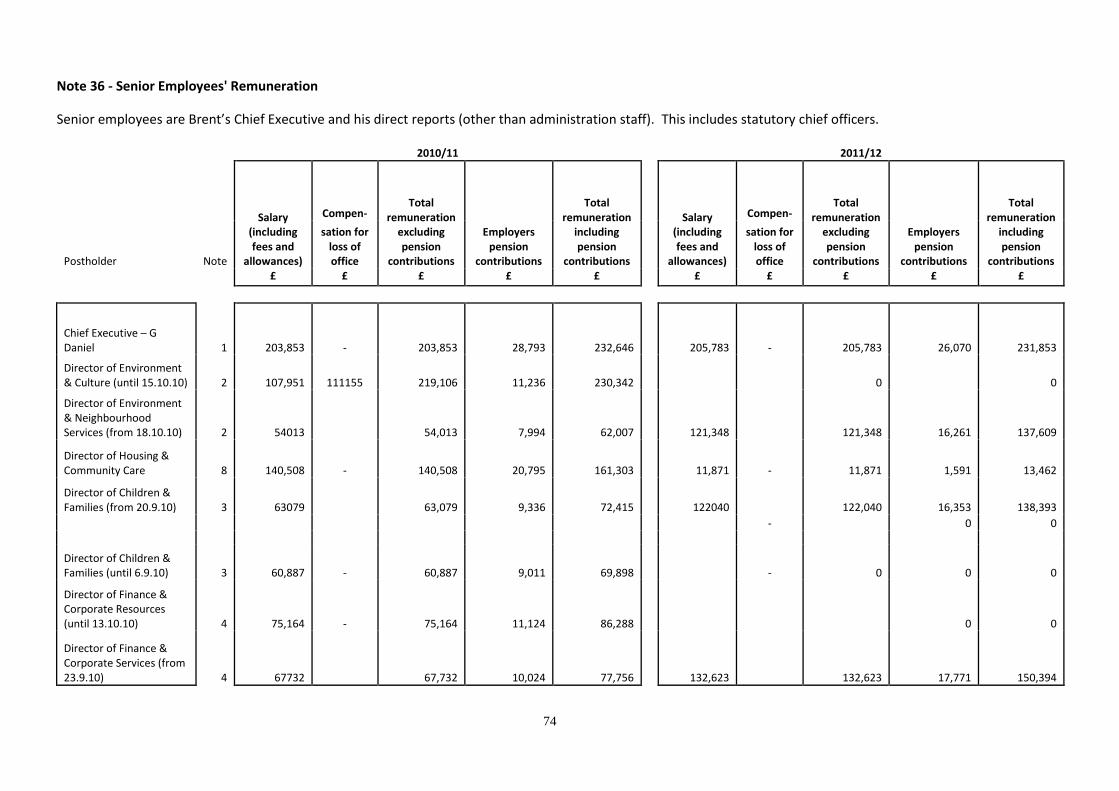
74
Note 36 - Senior Employees' Remuneration
Senior employees are Brent’s Chief Executive and his direct reports (other than administration staff). This includes statutory chief officers.
2010/11 2011/12
Salary (including fees and
allowances)
Compen- Total
remuneration excluding pension
contributions
Employers pension
contributions
Total remuneration
including pension
contributions
Salary (including fees and
allowances)
Compen- Total
remuneration excluding pension
contributions
Employers pension
contributions
Total remuneration
including pension
contributions Postholder Note
sation for loss of office
sation for loss of office
£ £ £ £ £ £ £ £ £ £
Chief Executive – G Daniel 1 203,853 - 203,853 28,793 232,646 205,783 - 205,783 26,070 231,853
Director of Environment & Culture (until 15.10.10) 2 107,951 111155 219,106 11,236 230,342 0 0
Director of Environment & Neighbourhood Services (from 18.10.10) 2 54013 54,013 7,994 62,007 121,348 121,348 16,261 137,609
Director of Housing & Community Care 8 140,508 - 140,508 20,795 161,303 11,871 - 11,871 1,591 13,462
Director of Children & Families (from 20.9.10) 3 63079 63,079 9,336 72,415 122040 122,040 16,353 138,393
- 0 0
60,887 - 60,887
Director of Children & Families (until 6.9.10) 3 9,011 69,898 - 0 0 0
Director of Finance & Corporate Resources (until 13.10.10) 4 75,164 - 75,164 11,124 86,288 0 0
Director of Finance & Corporate Services (from 23.9.10) 4 67732 67,732 10,024 77,756 132,623 132,623 17,771 150,394

75
Note 36 - Senior Employees' Remuneration Continued)
2010/11 2011/12
Salary (including fees and
allowances)
Compen- Total
remuneration excluding pension
contributions
Employers pension
contributions
Total remuneration
including pension
contributions
Salary (including fees and
allowances)
Compen- Total
remuneration excluding pension
contributions
Employers pension
contributions
Total remuneration
including pension
contributions Postholder Note
sation for loss of office
sation for loss of office
£ £ £ £ £ £ £ £ £ £
Director of Strategy, Partnerships and Improvement (formerly Director of Policy & Regeneration) 140,508 - 140,508 20,795 161,303 140,508 - 140,508 18,828 159,336
Director of Business Transformation (until 11.08.10) 5 95,536 - 95,536 14,139 109,675 - 0 0 0 Director of Customer & Community Engagement (formerly Director of Communications and Diversity)
108,084 - 108,084 15,996 124,080 108,084 - 108,084 14,483 122,567
Director of Legal and Procurement (from 4.5.10) 6 90840 90,840 13,444 104,284 103,858 - 103,858 13,917 117,775
Director of Adult Social Services (from April 2011) 8 108,084 108,084 14,483 122,567
Director of Regeneration and Major Projects (from 18.10.10) 7, 8 54013 54,013 7,994 62,007 121,348 121,348 16,261 137,609
Total 1,262,168 111,155 1,373,323 180,683 1,554,006 1,175,547 0 1,175,547 156,018 1,331,565
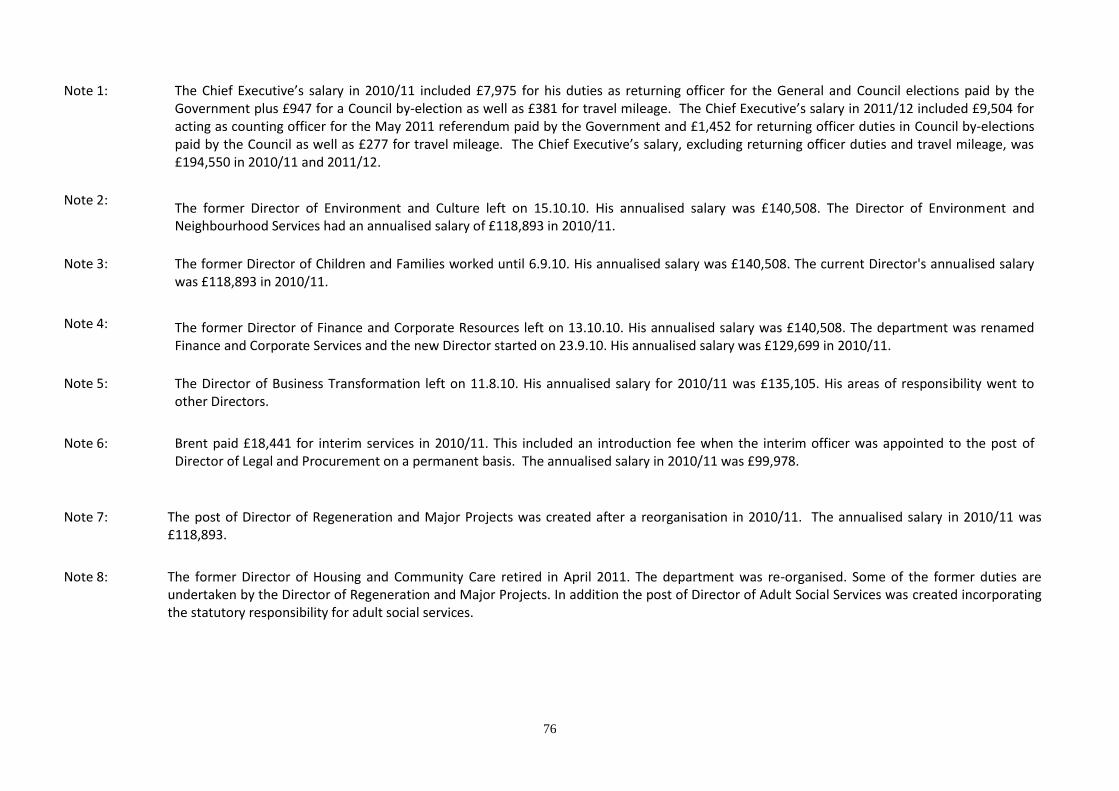
76
Note 1: The Chief Executive’s salary in 2010/11 included £7,975 for his duties as returning officer for the General and Council elections paid by the Government plus £947 for a Council by-election as well as £381 for travel mileage. The Chief Executive’s salary in 2011/12 included £9,504 for acting as counting officer for the May 2011 referendum paid by the Government and £1,452 for returning officer duties in Council by-elections paid by the Council as well as £277 for travel mileage. The Chief Executive’s salary, excluding returning officer duties and travel mileage, was £194,550 in 2010/11 and 2011/12.
Note 2:
The former Director of Environment and Culture left on 15.10.10. His annualised salary was £140,508. The Director of Environment and Neighbourhood Services had an annualised salary of £118,893 in 2010/11.
Note 3: The former Director of Children and Families worked until 6.9.10. His annualised salary was £140,508. The current Director's annualised salary
was £118,893 in 2010/11.
Note 4: The former Director of Finance and Corporate Resources left on 13.10.10. His annualised salary was £140,508. The department was renamed
Finance and Corporate Services and the new Director started on 23.9.10. His annualised salary was £129,699 in 2010/11.
Note 5: The Director of Business Transformation left on 11.8.10. His annualised salary for 2010/11 was £135,105. His areas of responsibility went to
other Directors.
Note 6: Brent paid £18,441 for interim services in 2010/11. This included an introduction fee when the interim officer was appointed to the post of
Director of Legal and Procurement on a permanent basis. The annualised salary in 2010/11 was £99,978.
Note 7: The post of Director of Regeneration and Major Projects was created after a reorganisation in 2010/11. The annualised salary in 2010/11 was
£118,893.
Note 8: The former Director of Housing and Community Care retired in April 2011. The department was re-organised. Some of the former duties are
undertaken by the Director of Regeneration and Major Projects. In addition the post of Director of Adult Social Services was created incorporating the statutory responsibility for adult social services.
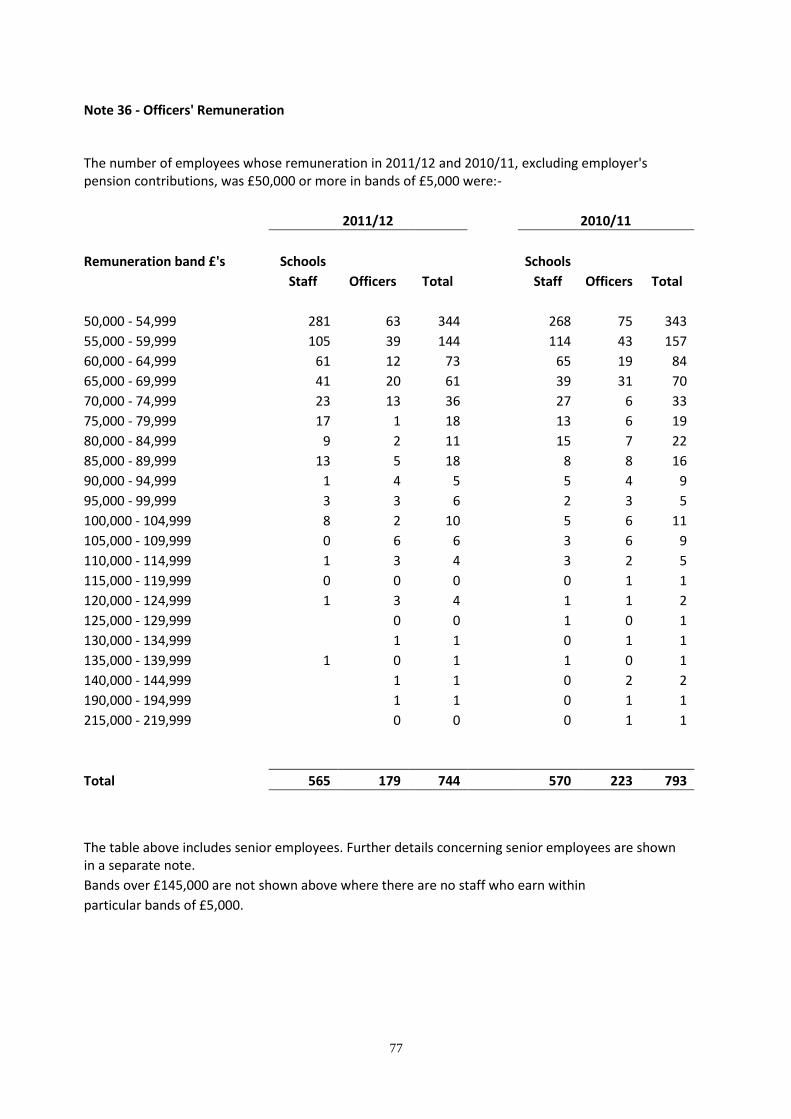
77
Note 36 - Officers' Remuneration
The number of employees whose remuneration in 2011/12 and 2010/11, excluding employer's pension contributions, was £50,000 or more in bands of £5,000 were:-
2011/12 2010/11
Remuneration band £'s Schools Schools
Staff Officers Total Staff Officers Total
50,000 - 54,999 281 63 344 268 75 343
55,000 - 59,999 105 39 144 114 43 157
60,000 - 64,999 61 12 73 65 19 84
65,000 - 69,999 41 20 61 39 31 70
70,000 - 74,999 23 13 36 27 6 33
75,000 - 79,999 17 1 18 13 6 19
80,000 - 84,999 9 2 11 15 7 22
85,000 - 89,999 13 5 18 8 8 16
90,000 - 94,999 1 4 5 5 4 9
95,000 - 99,999 3 3 6 2 3 5
100,000 - 104,999 8 2 10 5 6 11
105,000 - 109,999 0 6 6 3 6 9
110,000 - 114,999 1 3 4 3 2 5
115,000 - 119,999 0 0 0 0 1 1
120,000 - 124,999 1 3 4 1 1 2
125,000 - 129,999 0 0 1 0 1
130,000 - 134,999 1 1 0 1 1
135,000 - 139,999 1 0 1 1 0 1
140,000 - 144,999 1 1 0 2 2
190,000 - 194,999 1 1 0 1 1
215,000 - 219,999 0 0 0 1 1
Total 565 179 744 570 223 793
The table above includes senior employees. Further details concerning senior employees are shown in a separate note.
Bands over £145,000 are not shown above where there are no staff who earn within
particular bands of £5,000.
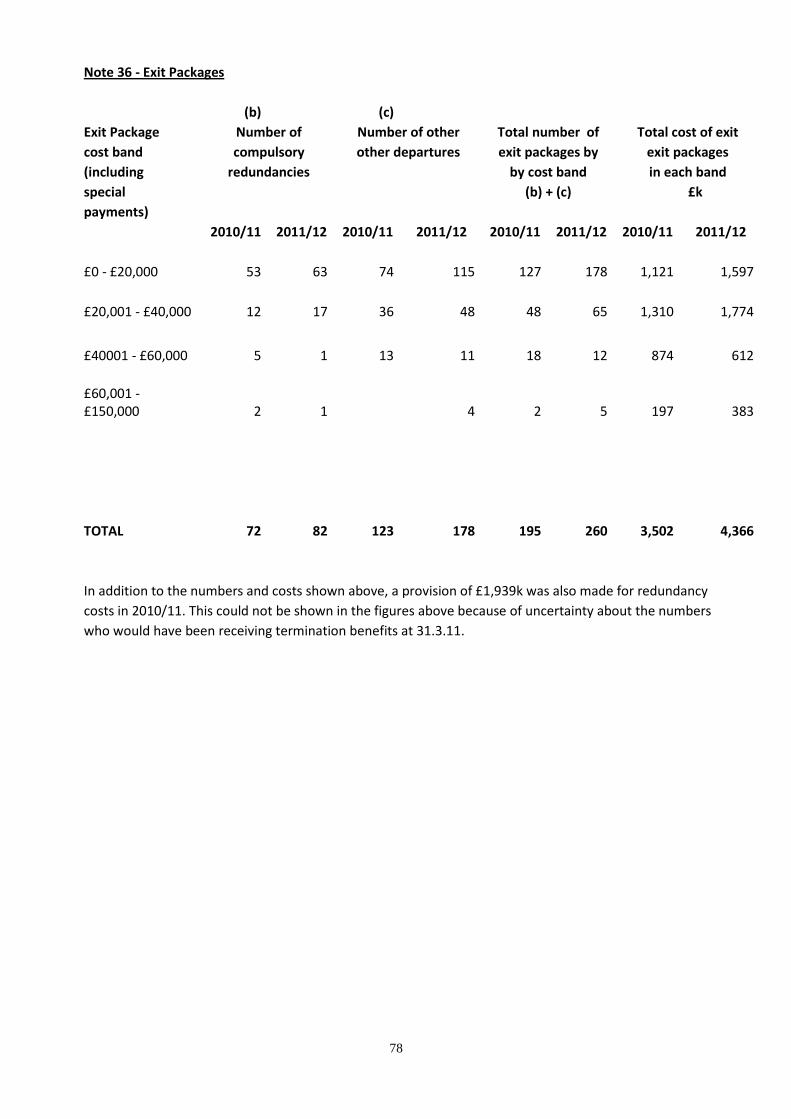
78
Note 36 - Exit Packages
(b) (c)
Exit Package Number of Number of other Total number of Total cost of exit
cost band compulsory other departures exit packages by exit packages
(including redundancies by cost band in each band
special (b) + (c) £k
payments)
2010/11 2011/12 2010/11 2011/12 2010/11 2011/12 2010/11 2011/12
£0 - £20,000 53 63 74 115 127 178 1,121 1,597
£20,001 - £40,000 12 17 36 48 48 65 1,310 1,774
£40001 - £60,000 5 1 13 11 18 12 874 612
£60,001 - £150,000 2 1 4 2 5 197 383
TOTAL 72 82 123 178 195 260 3,502 4,366
In addition to the numbers and costs shown above, a provision of £1,939k was also made for redundancy
costs in 2010/11. This could not be shown in the figures above because of uncertainty about the numbers
who would have been receiving termination benefits at 31.3.11.
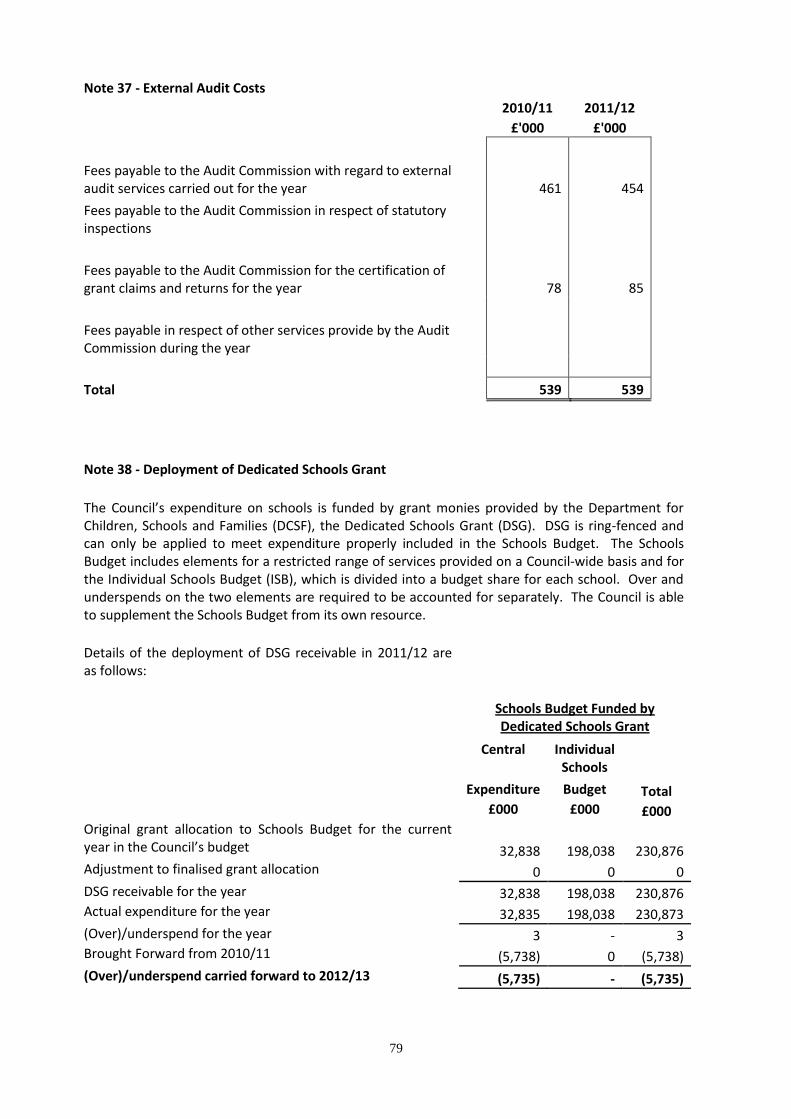
79
Note 37 - External Audit Costs
2010/11 2011/12
£'000 £'000
Fees payable to the Audit Commission with regard to external audit services carried out for the year 461 454
Fees payable to the Audit Commission in respect of statutory inspections
Fees payable to the Audit Commission for the certification of grant claims and returns for the year 78 85
Fees payable in respect of other services provide by the Audit Commission during the year
Total 539 539
Note 38 - Deployment of Dedicated Schools Grant
The Council’s expenditure on schools is funded by grant monies provided by the Department for Children, Schools and Families (DCSF), the Dedicated Schools Grant (DSG). DSG is ring-fenced and can only be applied to meet expenditure properly included in the Schools Budget. The Schools Budget includes elements for a restricted range of services provided on a Council-wide basis and for the Individual Schools Budget (ISB), which is divided into a budget share for each school. Over and underspends on the two elements are required to be accounted for separately. The Council is able to supplement the Schools Budget from its own resource.
Details of the deployment of DSG receivable in 2011/12 are as follows:
Schools Budget Funded by
Dedicated Schools Grant
Central Individual Schools
Expenditure Budget Total £000 £000 £000
Original grant allocation to Schools Budget for the current year in the Council’s budget 32,838 198,038 230,876 Adjustment to finalised grant allocation 0 0 0
DSG receivable for the year 32,838 198,038 230,876 Actual expenditure for the year 32,835 198,038 230,873
(Over)/underspend for the year 3 - 3 Brought Forward from 2010/11 (5,738) 0 (5,738)
(Over)/underspend carried forward to 2012/13 (5,735) - (5,735)
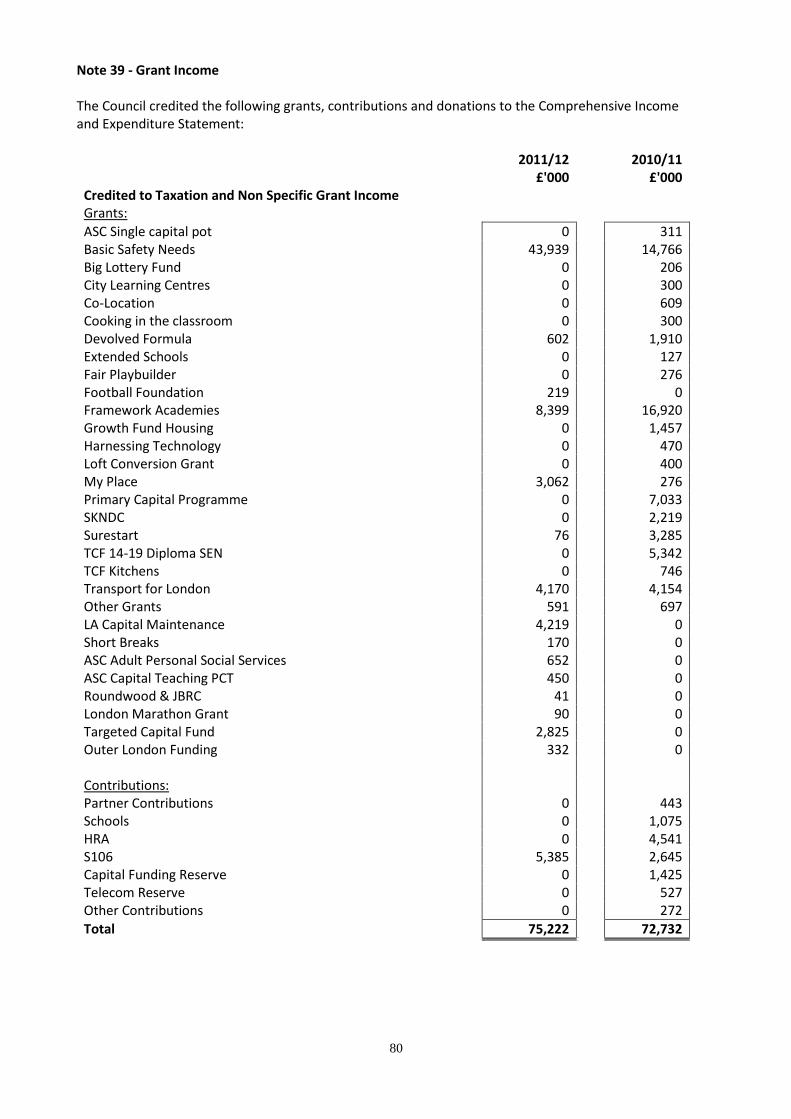
80
Note 39 - Grant Income The Council credited the following grants, contributions and donations to the Comprehensive Income and Expenditure Statement:
2011/12 2010/11 £'000 £'000 Credited to Taxation and Non Specific Grant Income Grants:
ASC Single capital pot 0 311 Basic Safety Needs 43,939 14,766 Big Lottery Fund 0 206 City Learning Centres 0 300 Co-Location 0 609 Cooking in the classroom 0 300 Devolved Formula 602 1,910 Extended Schools 0 127 Fair Playbuilder 0 276 Football Foundation 219 0 Framework Academies 8,399 16,920 Growth Fund Housing 0 1,457 Harnessing Technology 0 470 Loft Conversion Grant 0 400 My Place 3,062 276 Primary Capital Programme 0 7,033 SKNDC 0 2,219 Surestart 76 3,285 TCF 14-19 Diploma SEN 0 5,342 TCF Kitchens 0 746 Transport for London 4,170 4,154 Other Grants 591 697 LA Capital Maintenance 4,219 0 Short Breaks 170 0 ASC Adult Personal Social Services 652 0 ASC Capital Teaching PCT 450 0 Roundwood & JBRC 41 0 London Marathon Grant 90 0 Targeted Capital Fund 2,825 0 Outer London Funding 332 0 Contributions: Partner Contributions 0 443 Schools 0 1,075 HRA 0 4,541 S106 5,385 2,645 Capital Funding Reserve 0 1,425 Telecom Reserve 0 527 Other Contributions 0 272
Total 75,222 72,732

81
2011/12 2010/11
Credited to Services £'000 £'000
Adult and Community Learning from Learning and Skills Council (LSC) 4,421 4,244
AIDS Support 0 377 Aiming High Capital grant for Foundation schools
0 10,680
251 0
Council Tax Benefit 35,117 34,665
Dedicated Schools Grant (DSG) 232,116 198,934
Diploma Grants 14-19 year olds 0 218
Discretionary Housing Payments 512 226
Highways Asset management 346 0
Homelessness Strategy Grant 164 806
Housing Benefit and Council Tax Benefit Administration 3,813 4,028
Private Finance Initiative Housing Non HRA 3,418 2,789
Housing Benefit Transition Funding 753 0 Housing Subsidy Improvement Grants
7,931 1,768
6,018 0
Private Finance Initiative Jewish Free School 884 884
LDA Childcare Affordability Grant 0 475
London Pay Addition 0 1,028
Mandatory Rent Allowances: subsidy 286,381 261,395
Mandatory Rent Rebates outside HRA: subsidy 13,004 10,994
Mental Health Supporting People Team 0 472
New Deal for Communities (NDC) 0 916
Preventing Homelessness 1,675 600
Private Finance Initiative Public Lighting 787 787
Private Finance Initiative Willesden Sports Cent - PFI Res 1,242 1,242
Pupil Premium Grant 4,603 0
Rent Rebates Granted to HRA Tenants: subsidy 29,669 28,320
Schools Standards Grant 0 8,609
Sixth forms funding from Learning and Skills Council (LSC) 16,955 23,386
Social Care Reform 0 1,329
Standards Fund (excluding elements now in ABG now part of DSG) 3,219 27,673
Sure Start, Early Years and Childcare Grant 0 11,565
Think Family Grant 0 474
Training and Development Agency for Schools 0 348
Unaccompanied Asylum Seeking Children (UASC) Grant 996 1,733
Other Grants 1,182 2,335
Total 661,636 637,121

82
Capital Grants Receipts in Advance
The Council has received the following grant that is yet to be recognised as income due to the conditions attached to the grant. The balance at year end is:
31 March
2012 31 March
2011
£'000 £'000
Aiming high for Disabled Children nil 152
Note 40 - Related Party Transactions The Council is required to disclose material transactions with related parties – bodies or individuals that have the potential to control or influence the Council or to be controlled or influenced by the Council. Central Government provides grant income for the Council which is shown in the Notes 39 and 11 to the Core Financial Statements. Councillors and Chief Officers complete related party transactions forms each year. Only 1 Councillor out of 63 has failed to reply for 2011/12. A number of voluntary organisations which received grants from the London Borough of Brent in 2011/12 have Brent Members as Directors, Trustees or employees. The following information has been obtained from Members’ 2011/12 Declarations of Related Party Transactions:
£'000
Brent Association of Disabled People 159
Brent Irish Advisory Service 22
London Borough of Brent Pension Fund - administrative support is provided to the Fund. UK equities are managed in-house. The Pension Fund’s accounts are shown separately in this document. The Council charged the Pension Fund £1.027M for administering the fund in 2011/12 (£1.141M in 2010/11). Pooled Budgets - Details of partnerships with Brent tPCT and the North West London Mental Health Trust are shown in Note 34 to the Core Financial Statements. Subsidiary Company - Brent has one subsidiary, Brent Housing Partnership (BHP) Limited. The Council paid a management fee to BHP of £8.703M in 2011/12 (£8.758M 2010/11). Further details are provided in the Group Accounts later in this document which combine Brent and BHP’s accounts. At the 31 March 2012 the Council owed £5k to the Brent Irish Advisory Service and £3k to the PCT. At that date the Council was owed £965k but the PCT. There was no provision for bad debt relating to this figure.

83
Note 41 - Capital Expenditure and Capital Financing
2011/12 2010/11 Restated
£'000 £'000
Capital Investment
Property, Plant and Equipment 102,187 101,363
Investment Properties 19 133
Intangible Assets 743 1,161
Assets Held for Sale 0 18
Revenue Expenditure Funded from Capital under Statute 21,474 8,841
Total Expenditure 124,423 111,516
Sources of Finance
Capital Receipts (10,080) (7,777)
Government Grants and other Contributions (62,604) (64,092)
Direct revenue contributions (3,222) (4,541)
Borrowing (48,517) (35,106)
Total Resources (124,423) (111,516)
Net Balance 0 0
Calculation of Capital Financing Requirement
Fixed Assets 1,250,232 1,115,015
Intangible Assets 2,623 2,676
Long term Debtors relating to Capital Transactions 0 0
Investments treated as Capital Expenditure 0 0
Revaluation Reserve (161,178) (134,577)
Capital Adjustment Account (523,069) (267,311)
Deferred Income (30,279) (21,145)
Capital Financing Requirement 538,329 694,658
Note 42: Leases Council as Lessee
Finance Leases
Brent Council leases some of its IT equipment and Vehicles under finance leases. The assets acquired are included in Plant, Property and Equipment in the balance sheet as part of Plant, Furniture, Vehicles and Equipment in the notes at the following net amounts:
31-Mar-12 31-Mar-11
Restated £'000 £'000
Plant, Furniture, Vehicles and Equipment 1,296 2,143

84
The Council is committed to making minimum payments comprising of repaying the outstanding liability for the capital purchase, and interest upon the outstanding liabilities. The minimum lease payments are made of the following amounts:
31-Mar-12 31-Mar-11
Restated
£'000 £'000
Finance lease liabilities
Current 848 1,183
Non-current 845 1,711
Finance costs payable in future years 227 384
Minimum lease payments 1,921 3,278
These minimum lease payments are payable over the following periods:
Present Value of Minimum Lease
Payments Repayable
Total Minimum Lease Minimum Lease
Payments
Payments Repayable
2011-12 2010-11
Restated 2011-12 2010-11
Restated
£'000 £'000 £'000 £'000
Not Later than one year 1,020 1,376 848 1,183 Later than one year and not later than five years 900 1,902 845 1,619
Later than five years 0 0 0 2
1,921 3,278 1,694 2,802
Operating Leases
Brent Council leases Land & Buildings, Office Equipment, vehicles, and telecommunications Equipment in order to provide its services.
The Future Minimum payments under these leases in future years are:
2011-12 2010-11
Restated
£'000 £'000
Not later than one year 2,838 2,645 Later than one year and not later than five years 6,377 5,386
Later than five years 7,253 7,202
16,468 15,233

85
The Council sub-leases office accommodation and sports grounds. The future minimum sub lease payments to the Council for these sub leases are:
2011-12 2010-11
Restated
£'000 £'000
Future Minimum Sublease Payments Receivable 154 283
The expenditure charged to Comprehensive Income and Expenditure Statement for these leases is detailed below:
2011-12 2010-11
Restated
£'000 £'000
Minimum Lease payments 4,460 4,378
(Sublease payments receivable) (146) (129)
4,314 4,249
The Council is required to disclose embedded leases in line with the principles of IFRIC 4. IFRIC 4 requires disclosure of the total payment required where payments cannot be separated in separate payments for services and for assets. Lease elements of contracts for Waste Services and Parking Enforcement have been separated and are disclosed above in the finance and operating lease sections.
The following payments are for an adult Social care contract where payments cannot be separated, so are disclosed separately:
2011-12 2012-11
£'000 £'000
Minimum Lease payments 1,517 1,653
Future payments under this contract are:
2011-12 2010-11
£'000 £'000
Not later than one year 1,517 1,694 Later than one year and not later than five years 0 1,517
1,517 3,211 Council as Lessor
Finance Leases
Brent Council leases Northwick golf course to a commercial operator on a finance lease with a remaining term of 93 years.

86
The Council has a gross investment in the property which is the present value of future lease payments receivable under the contract. The gross investment is made up of the following amounts:
2011-12 2010-11
£'000 £'000
Finance lease debtor
Current 0 0
Non Current 1,250 1,250
Gross Investment in Lease 1,250 1,250
The gross investment in the lease and the minimum lease payments will be received over the following periods:
Gross Investment in the Lease
Present Value of Minimum Lease
Payments
2010-12 2010-11 2011-12 2010-11
£'000 £'000 £'000 £'000
Not Later than one year 0 0 0 0
Later than one year and not later than five years
0 0 0 0
Later than five years 1,249 1,249 1,249 1249
1,249 1,249 1,249 1,249
The Council receives additional contingent rent based on the turnover of the golf course. For 2011-12, it is estimated that £36,000 of contingent rent will be receivable.
Operating Leases
The Council leases out a number of its properties both for commercial use and service provision. It also leases a small number of vehicles to Brent Housing Partnership.
Future minimum lease payments expected under these contracts are:
2011-12 2010-11
Restated
£'000 £'000
Not later than one year 965 970 Later than one year and not later than five years 1,617 2,079
Later than five years 7,174 6,100
9,756 9,149
The Council receives additional contingent rent for one of its properties based on the turnover of the lessee’s business. In 2011-12, £37,178 contingent rent was receivable.
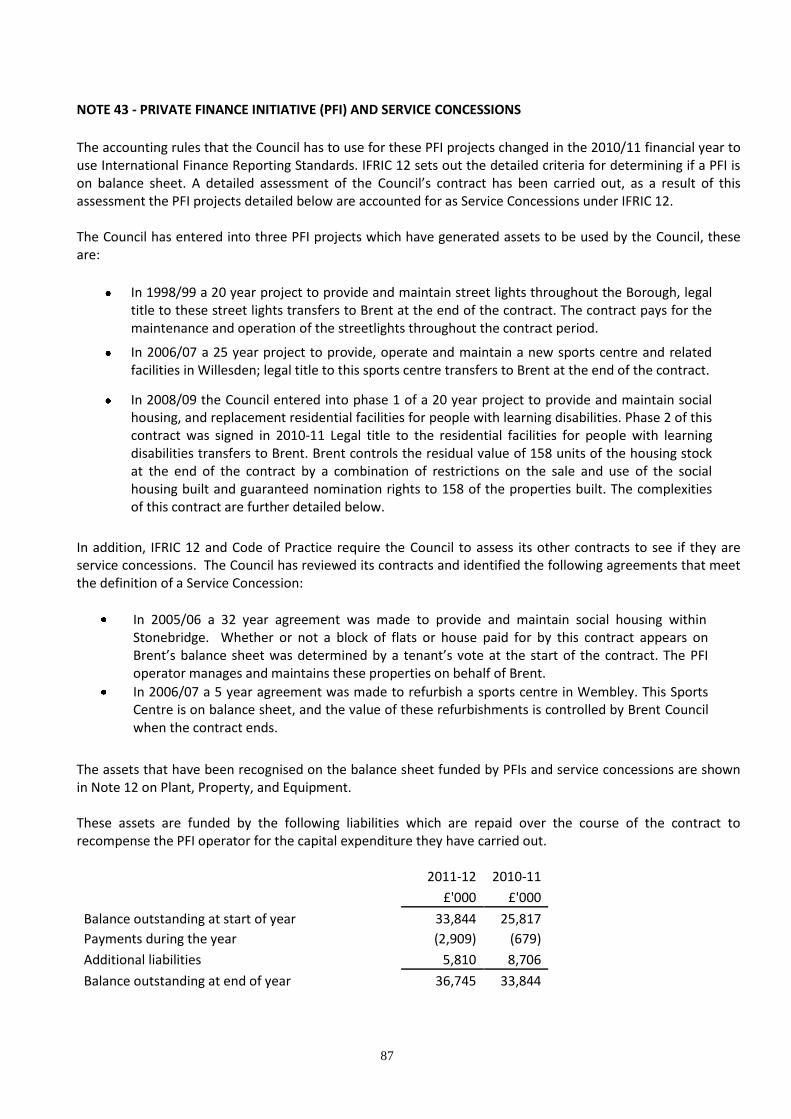
87
NOTE 43 - PRIVATE FINANCE INITIATIVE (PFI) AND SERVICE CONCESSIONS
The accounting rules that the Council has to use for these PFI projects changed in the 2010/11 financial year to use International Finance Reporting Standards. IFRIC 12 sets out the detailed criteria for determining if a PFI is on balance sheet. A detailed assessment of the Council’s contract has been carried out, as a result of this assessment the PFI projects detailed below are accounted for as Service Concessions under IFRIC 12. The Council has entered into three PFI projects which have generated assets to be used by the Council, these are:
In 1998/99 a 20 year project to provide and maintain street lights throughout the Borough, legal title to these street lights transfers to Brent at the end of the contract. The contract pays for the maintenance and operation of the streetlights throughout the contract period.
In 2006/07 a 25 year project to provide, operate and maintain a new sports centre and related facilities in Willesden; legal title to this sports centre transfers to Brent at the end of the contract.
In 2008/09 the Council entered into phase 1 of a 20 year project to provide and maintain social housing, and replacement residential facilities for people with learning disabilities. Phase 2 of this contract was signed in 2010-11 Legal title to the residential facilities for people with learning disabilities transfers to Brent. Brent controls the residual value of 158 units of the housing stock at the end of the contract by a combination of restrictions on the sale and use of the social housing built and guaranteed nomination rights to 158 of the properties built. The complexities of this contract are further detailed below.
In addition, IFRIC 12 and Code of Practice require the Council to assess its other contracts to see if they are service concessions. The Council has reviewed its contracts and identified the following agreements that meet the definition of a Service Concession:
In 2005/06 a 32 year agreement was made to provide and maintain social housing within
Stonebridge. Whether or not a block of flats or house paid for by this contract appears on Brent’s balance sheet was determined by a tenant’s vote at the start of the contract. The PFI operator manages and maintains these properties on behalf of Brent.
In 2006/07 a 5 year agreement was made to refurbish a sports centre in Wembley. This Sports Centre is on balance sheet, and the value of these refurbishments is controlled by Brent Council when the contract ends.
The assets that have been recognised on the balance sheet funded by PFIs and service concessions are shown in Note 12 on Plant, Property, and Equipment. These assets are funded by the following liabilities which are repaid over the course of the contract to recompense the PFI operator for the capital expenditure they have carried out.
2011-12 2010-11
£'000 £'000
Balance outstanding at start of year 33,844 25,817
Payments during the year (2,909) (679)
Additional liabilities 5,810 8,706
Balance outstanding at end of year 36,745 33,844

88
The following future payments are expected to be made on the PFIs and Service Concessions:
Payment for
Services
Reimbursement of Capital
Expenditure Interest Total
£'000 £'000 £'000 £'000
Payable in 2012/13 2,734 1,854 3,843 8,431
Payable with two to five years 12,199 10,774 14,220 37,193
Payable within 6 to 10 years 13,479 12,357 14,383 40,219
Payable within 11 to 15 years 9,673 15,029 11,553 36,255
Payable within 16 to 20 years 8,656 14,803 8,677 32,137
Payable within 21 to 25 years 2,056 8,894 6,223 17,173
Payable within 25 to 30 years 0 0 0 0
Total 48,797 63,711 58,899 171,408
Where a PFI asset is paid for by third party payments, the statement of recommended practice requires recognition of deferred income, recognising the expected future third party payments. The following deferred income balance has been recognised in line with the Code of Practice:
2011-12 2010-11 £'000 £'000 Deferred Income opening balance (21,145) (6,877) Additions (10,680) (14,540) Amortisation 1,546 272 Deferred Income closing balance (30,279) (21,145)
Further details of the Housing and Adult Social Care PFI: assessed under IFRS this contract has three distinct elements:
1. Residential facilities for people with learning disabilities Legal title to 20 units residential facilities for people with learning disabilities transfers to Brent. This element of the PFI is accounted for using the service concession rules for IFRIC 12
2. Residential social housing with guaranteed nomination rights Brent controls the residual value of this Social Housing stock at the end of the contract by a combination of restrictions on the sale and use of the social housing built and nomination rights to some of the properties built. Brent will be granted at least 158 nomination rights. This element of the PFI is accounted for using the service concession rules for IFRIC 12.
3. Residential social housing without guaranteed nomination rights This residual stock after Brent is granted at least 158 nomination rights. This will be at most 206 units. These units can be sold by the PFI Operator to other Registered Social Landlords under the conditions of the contract. This element is therefore considered to be temporary housing stock, and is accounted for using the embedded lease rules for IFRIC 4.
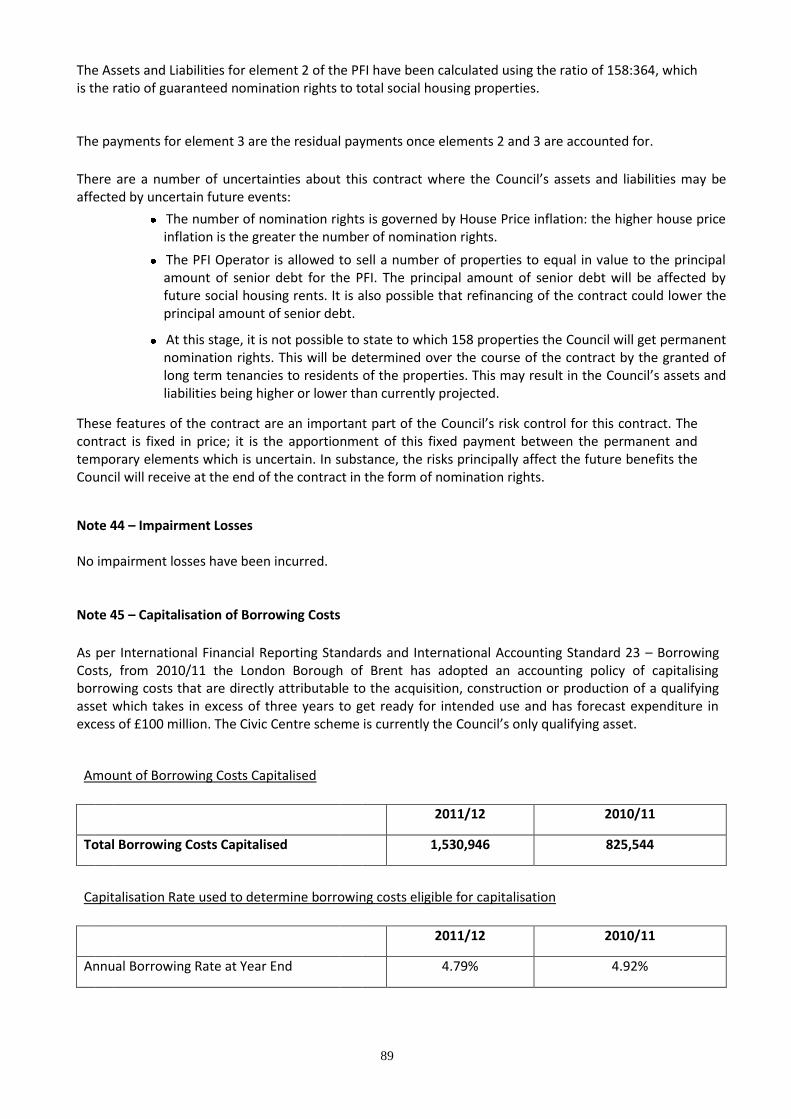
89
The Assets and Liabilities for element 2 of the PFI have been calculated using the ratio of 158:364, which is the ratio of guaranteed nomination rights to total social housing properties.
The payments for element 3 are the residual payments once elements 2 and 3 are accounted for.
There are a number of uncertainties about this contract where the Council’s assets and liabilities may be affected by uncertain future events:
The number of nomination rights is governed by House Price inflation: the higher house price inflation is the greater the number of nomination rights.
The PFI Operator is allowed to sell a number of properties to equal in value to the principal amount of senior debt for the PFI. The principal amount of senior debt will be affected by future social housing rents. It is also possible that refinancing of the contract could lower the principal amount of senior debt.
At this stage, it is not possible to state to which 158 properties the Council will get permanent nomination rights. This will be determined over the course of the contract by the granted of long term tenancies to residents of the properties. This may result in the Council’s assets and liabilities being higher or lower than currently projected.
These features of the contract are an important part of the Council’s risk control for this contract. The contract is fixed in price; it is the apportionment of this fixed payment between the permanent and temporary elements which is uncertain. In substance, the risks principally affect the future benefits the Council will receive at the end of the contract in the form of nomination rights.
Note 44 – Impairment Losses No impairment losses have been incurred.
Note 45 – Capitalisation of Borrowing Costs
As per International Financial Reporting Standards and International Accounting Standard 23 – Borrowing Costs, from 2010/11 the London Borough of Brent has adopted an accounting policy of capitalising borrowing costs that are directly attributable to the acquisition, construction or production of a qualifying asset which takes in excess of three years to get ready for intended use and has forecast expenditure in excess of £100 million. The Civic Centre scheme is currently the Council’s only qualifying asset.
Amount of Borrowing Costs Capitalised
2011/12 2010/11
Total Borrowing Costs Capitalised
1,530,946 825,544
Capitalisation Rate used to determine borrowing costs eligible for capitalisation
2011/12 2010/11
Annual Borrowing Rate at Year End
4.79% 4.92%
90
Note 46 - Termination Benefits
Information on termination benefits is included within the exit packages note (Note 36)
Note 47 - Pension Schemes Accounted for as Defined Contribution Schemes Teachers employed by the Council are members of the Teachers’ Pension Scheme, administered by the Department for Education. The Scheme provides teachers with specified benefits upon their retirement, and the Council contributes towards the costs by making contributions based on a percentage of members’ pensionable salaries. The Scheme is technically a defined benefit scheme. However, the Scheme is unfunded and the Department for Education uses a notional fund as the basis for calculating the employers’ contribution rate paid by local authorities. The Council is not able to identify its share of underlying financial position and performance of the Scheme with sufficient reliability for accounting purposes. For the purposes of this Statement of Accounts, it is therefore accounted for on the same basis as a defined contribution scheme. In 2011/12, the Council paid £13.3m to Teachers’ Pensions in respect of teachers’ retirement benefits, representing 14.1% of pensionable pay. The figures for 2010/11 were £13.9m and 14.1%. The Council is responsible for the costs of any additional benefits awarded upon early retirement outside of the terms of the teachers’ scheme. These costs are accounted for on a defined benefit basis and detailed in Note 48.
Note 48.1 - Defined Benefit Pension Schemes
Participation in Pension Schemes As part of the terms and conditions of employment of its officers, the Council makes contributions towards the cost of post employment benefits. Although these benefits will not actually be payable until employees retire, the Council has a commitment to make the payments that needs to be disclosed at the time that employees earn their future entitlement. The Council participates in two post employment schemes: (1) The Local Government Pension Scheme – this is a funded defined benefit final salary scheme, meaning that the Council and employees pay contributions into a fund, calculated at a level intended to balance the pensions liabilities with investment assets. (2) Arrangements for the award of discretionary post retirement benefits upon early retirement – this is an unfunded defined benefit arrangement, under which liabilities are recognised when awards are made. However, there are no investment assets built up to meet these pensions liabilities, and cash has to be generated to meet actual pensions payments as they eventually fall due. Transactions Relating to Post-employment Benefits We recognise the cost of retirement benefits in the reported cost of services when they are earned by employees, rather than when the benefits are eventually paid as pensions. Actuarial gains and losses on pension assets and liabilities are recorded as Other Comprehensive Income and Expenditure. However, the charge we are required to make against council tax is based on the cash payable in the year, so the real cost of post employment/retirement benefits is reversed out of the General Fund via the Movement in Reserves Statement. The following transactions have been made in the Comprehensive Income and Expenditure Statement and the General Fund Balance via the Movement in Reserves Statement during the year:
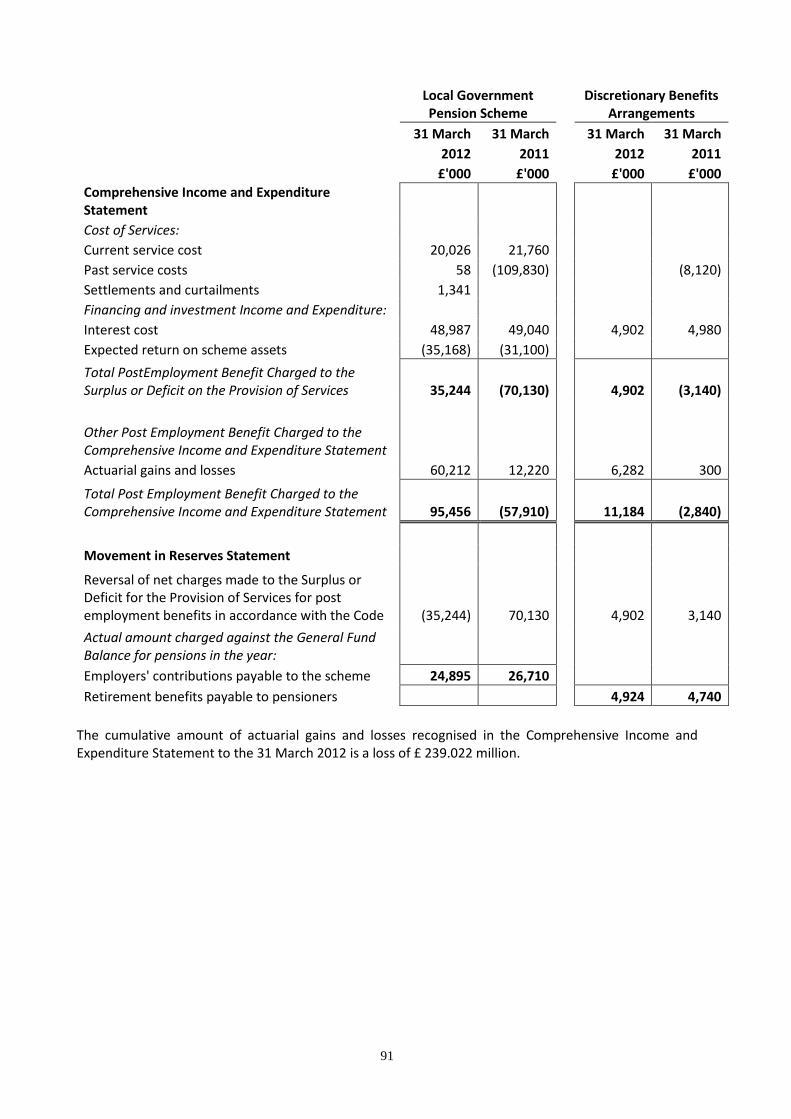
91
Local Government Pension Scheme
Discretionary Benefits Arrangements
31 March 31 March 31 March 31 March
2012 2011 2012 2011
£'000 £'000 £'000 £'000
Comprehensive Income and Expenditure Statement
Cost of Services:
Current service cost 20,026 21,760
Past service costs 58 (109,830) (8,120)
Settlements and curtailments 1,341
Financing and investment Income and Expenditure:
Interest cost 48,987 49,040 4,902 4,980
Expected return on scheme assets (35,168) (31,100)
Total PostEmployment Benefit Charged to the Surplus or Deficit on the Provision of Services 35,244 (70,130) 4,902 (3,140)
Other Post Employment Benefit Charged to the Comprehensive Income and Expenditure Statement
Actuarial gains and losses 60,212 12,220 6,282 300
Total Post Employment Benefit Charged to the Comprehensive Income and Expenditure Statement 95,456 (57,910) 11,184 (2,840)
Movement in Reserves Statement
Reversal of net charges made to the Surplus or Deficit for the Provision of Services for post employment benefits in accordance with the Code (35,244) 70,130 4,902 3,140
Actual amount charged against the General Fund Balance for pensions in the year:
Employers' contributions payable to the scheme 24,895 26,710
Retirement benefits payable to pensioners 4,924 4,740
The cumulative amount of actuarial gains and losses recognised in the Comprehensive Income and Expenditure Statement to the 31 March 2012 is a loss of £ 239.022 million.

92
Note 48.2 - Assets and Liabilities in Relation to Post Employment Benefits
Reconciliation of present value of the scheme liabilities
Funded Liabilities: Local Government Pension
Scheme
Unfunded Liabilities: Discretionary Benefits
Arrangements
31 March 31 March 31 March 31 March
2012 2011 2012 2011
£'000 £'000 £'000 £'000
Opening Balance at 1 April 908,400 977,480 91,520 99,100
Current service cost 20,026 21,760
Interest cost 48,987 49,040 4,902 4,980
Contributions by scheme participants 6,570 6,990
Actuarial gains and losses 27,428 (6,120) 6,282 300
Benefits paid (30,481) (30,920) (4,924) (4,740)
Past service costs 58 (109,830) (8,120)
Entity combinations
Curtailments 1,341
Settlements
Expected return on scheme assets
Closing Balance at 31 March 982,329 908,400 97,780 91,520
Reconciliation of fair value of the scheme assets
Local Government Pension
Scheme
31 March 31 March
2012 2011
£'000 £'000
Opening Balance at 1 April 418,240 402,700
Expected return on assets 35,168 31,100
Actuarial gains and losses (32,784) (18,340)
Employer contributions 24,895 26,710 Contributions by scheme participants 6,570 6,990
Benefits paid (30,481) (30,920)
Entity combinations
Settlements
Closing Balance at 31 March 421,608 418,240

93
Note 48.3 -Scheme History
31 March 31 March 31 March
2012 2011 2010
£'000 £'000 £'000
Present Value of Liabilities:
Local Government Pension Scheme 982,329 908,400 977,480
Discretionary Benefits 97,780 91,520 99,100
Fair Value of Assets in the Local Government Pension Scheme 421,608 418,240 402,700
Surplus/(Deficit) in the Scheme:
Local Government Pension Scheme (560,721) (490,160) (574,780)
Discretionary Benefits (97,780) (91,520) (99,100)
Total (658,501) (581,680) (673,880)
The liabilities show the underlying commitments that the Council has in the long run to pay post employment (retirement) benefits. The total liability of £1,080.109m has a substantial impact on the net worth of the Council as recorded in the Balance Sheet, resulting in a negative overall net liability of £658.501m. However, statutory arrangements for funding the deficit mean that the financial position of the Council remains healthy:
the deficit on the local government scheme will be made good by increased contributions over the remaining working life of employees (i.e. before payments fall due), as assessed by the scheme actuary
finance is only required to be raised to cover discretionary benefits when the pensions are actually paid The total contributions expected to be made to the Local Government Pension Scheme by the Council in the year to 31 March 2013 is £25.658m. Expected contributions for the Discretionary Benefits scheme in the year to 31 March 2013 is £5.0m. Note 48.4 - Basis for Estimating Assets and Liabilities The latest actuarial valuation of the London Borough of Brent's liabilities took place as at 31 March 2010. The principal assumptions used by the independent qualified actuaries in updating the latest valuation of the Fund and assessing discretionary benefit liabilities are set out below:
Local Government Pension
Scheme
Discretionary Benefits
Arrangements
2011-12 2010-11 2011-12 2010-11
£'000 £'000 £'000 £'000
Long-Term Expected Rate of Return on Assets in the Scheme
Equity Investments 6.3% 8.4%
Private Equity / Infrastructure 10.0% 13.4%
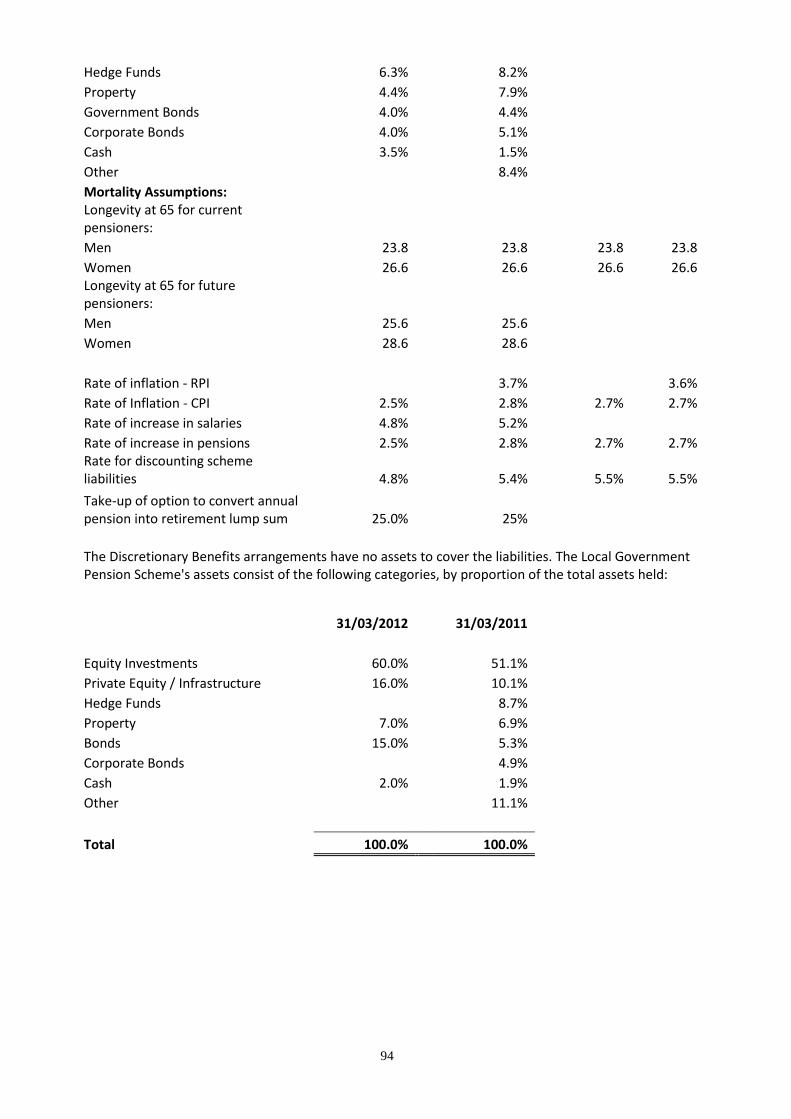
94
Hedge Funds 6.3% 8.2%
Property 4.4% 7.9%
Government Bonds 4.0% 4.4%
Corporate Bonds 4.0% 5.1%
Cash 3.5% 1.5%
Other 8.4%
Mortality Assumptions: Longevity at 65 for current pensioners:
Men 23.8 23.8 23.8 23.8
Women 26.6 26.6 26.6 26.6 Longevity at 65 for future pensioners:
Men 25.6 25.6
Women 28.6 28.6
Rate of inflation - RPI 3.7% 3.6%
Rate of Inflation - CPI 2.5% 2.8% 2.7% 2.7%
Rate of increase in salaries 4.8% 5.2%
Rate of increase in pensions 2.5% 2.8% 2.7% 2.7% Rate for discounting scheme liabilities 4.8% 5.4% 5.5% 5.5%
Take-up of option to convert annual pension into retirement lump sum 25.0% 25%
The Discretionary Benefits arrangements have no assets to cover the liabilities. The Local Government Pension Scheme's assets consist of the following categories, by proportion of the total assets held:
31/03/2012 31/03/2011
Equity Investments 60.0% 51.1%
Private Equity / Infrastructure 16.0% 10.1%
Hedge Funds 8.7%
Property 7.0% 6.9%
Bonds 15.0% 5.3%
Corporate Bonds 4.9%
Cash 2.0% 1.9%
Other 11.1%
Total 100.0% 100.0%

95
Note 48.5 - History of Experience Gains and Losses The actuarial gains identified as movements on the Pensions Reserve can be analysed into the following categories, measured as a percentage of assets or liabilities at 31 March each year:
2011-12 2010-11 2009-10
% % %
Local Government Pension Scheme
Differences between the expected and actual return on assets (7.8) (4.4) 17.5
Experience gains and losses on liabilities (1.3) (2.1) 0.8
Discretionary Benefit Arrangements
Experience gains and losses on liabilities (2.4) 0.7 3.0
96
Note 49 - Contingent Liabilities The Council has a number of contingent liabilities listed below. The potential maximum liability for all the issues could be in the region of £1.3m. Figures are not shown against contingent liabilities where there are legal proceedings or the disclosure would adversely affect the outcome. Brent Teaching Primary Care Trust (tPCT) has indicated that a number of patients that it is currently responsible for to provide and fund care should transfer to the local Council as they do not meet health care criteria. The Council does not accept the legal basis of many of these funding changes and it cannot properly assess responsibility in individual cases without a proper assessment process having been undertaken. These uncertainties have resulted in the Council being unable to quantify any liability and the Council will deal with claims as they arise. At this stage, there is a judicial review pending between the Brent PCT and two neighbouring boroughs relating to alleged failure to comply with their statutory duty to ten persons in need of community care. The Council is an interested party to the judicial review proceedings and the outcome could have a financial impact on the Council. The Council has received a claim form a company that owns a piece of land, in which it bought from the Council, stating that the Council is liable to decontaminate the land. The Council is resisting the claim and is making no specific provision. A number of claims to Employment Tribunals have been made against the Council. The Council is disputing these claims. Note 50 - Exceptional Items
There were 2 exceptional items in 2010/11: 1. With effect from 1st April 2011, increases in local government pensions in payment and deferred pensions will be linked to annual increases in the CPI (Consumer Prices Index), rather than the Retail Prices Index (RPI). Since, over the long term CPI increases are expected to be lower than RPI increases, this gives rise to a reduction in the defined benefit obligation on the balance sheet. The change also reduces this (and future) periods’ current service cost and interest cost. The actuary has allowed for the impact of the change as a benefit change and therefore recognised this as a (negative) past service cost reflecting the reduction in the constructive obligation. The impact of the change is around £110m for funded benefits, and £8m for unfunded benefits. 2. Government regulations have changed the factor used to discount social housing from 37% to 25%. This has resulted in a reduction in the value of Council dwellings of £242M. In addition there is one exceptional item in the 2011/12 accounts. The Localism Act 2011 ended the HRA subsidy system with effect from 1 April 2012. In preparation for the new arrangements, under which each Council's HRA would need to be self-financing, the government repaid £198m of the Council's long term borrowing and £74m of associated early repayment costs Note 51 - Nature and extent of risks arising from Financial Instruments
The Council’s investment activities expose it to a variety of financial risks, including: - Credit risk – the possibility that other parties might fail to pay amounts due to the Council;
- Liquidity risk – the possibility that the Council might not have funds available to meet its commitments to make payments;
- Re-financing risk – the possibility that the Council might be required to renew a financial instrument on maturity at disadvantageous interest rates or terms.
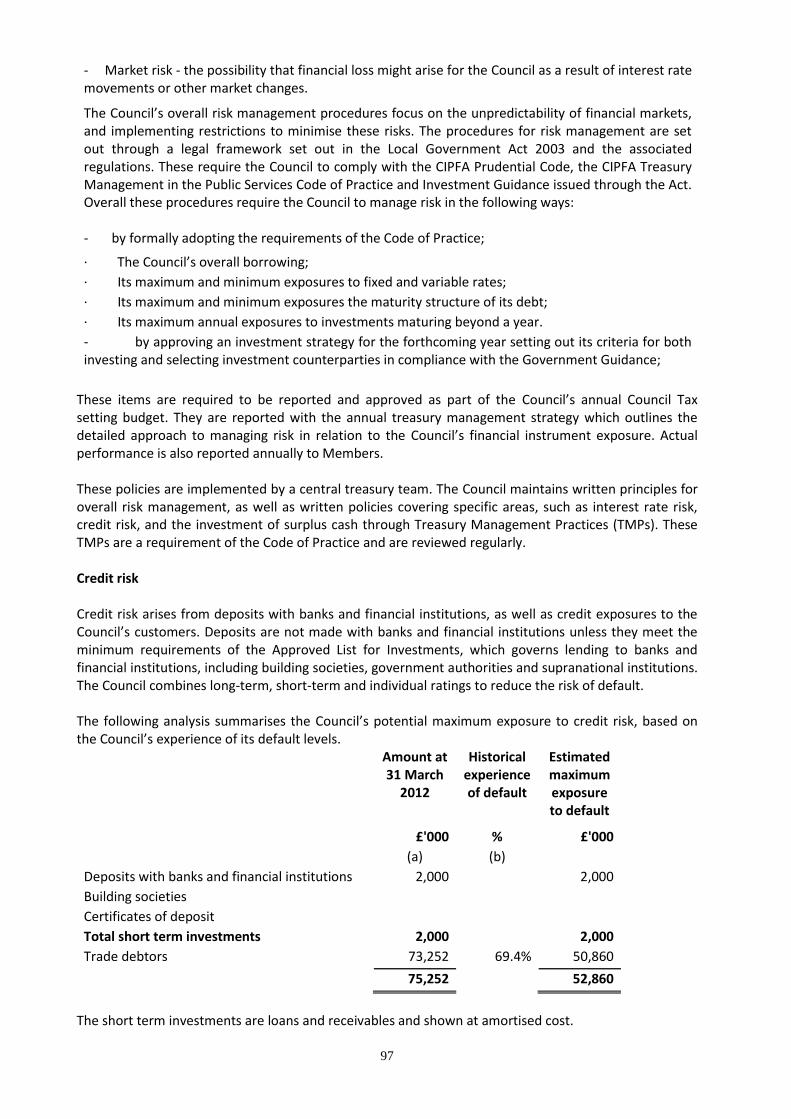
97
- Market risk - the possibility that financial loss might arise for the Council as a result of interest rate movements or other market changes.
The Council’s overall risk management procedures focus on the unpredictability of financial markets, and implementing restrictions to minimise these risks. The procedures for risk management are set out through a legal framework set out in the Local Government Act 2003 and the associated regulations. These require the Council to comply with the CIPFA Prudential Code, the CIPFA Treasury Management in the Public Services Code of Practice and Investment Guidance issued through the Act. Overall these procedures require the Council to manage risk in the following ways: - by formally adopting the requirements of the Code of Practice;
· The Council’s overall borrowing;
· Its maximum and minimum exposures to fixed and variable rates;
· Its maximum and minimum exposures the maturity structure of its debt;
· Its maximum annual exposures to investments maturing beyond a year.
- by approving an investment strategy for the forthcoming year setting out its criteria for both investing and selecting investment counterparties in compliance with the Government Guidance;
These items are required to be reported and approved as part of the Council’s annual Council Tax setting budget. They are reported with the annual treasury management strategy which outlines the detailed approach to managing risk in relation to the Council’s financial instrument exposure. Actual performance is also reported annually to Members.
These policies are implemented by a central treasury team. The Council maintains written principles for overall risk management, as well as written policies covering specific areas, such as interest rate risk, credit risk, and the investment of surplus cash through Treasury Management Practices (TMPs). These TMPs are a requirement of the Code of Practice and are reviewed regularly.
Credit risk
Credit risk arises from deposits with banks and financial institutions, as well as credit exposures to the Council’s customers. Deposits are not made with banks and financial institutions unless they meet the minimum requirements of the Approved List for Investments, which governs lending to banks and financial institutions, including building societies, government authorities and supranational institutions. The Council combines long-term, short-term and individual ratings to reduce the risk of default.
The following analysis summarises the Council’s potential maximum exposure to credit risk, based on the Council’s experience of its default levels.
Amount at 31 March
2012
Historical experience of default
Estimated maximum exposure to default
£'000 % £'000
(a) (b)
Deposits with banks and financial institutions 2,000 2,000
Building societies
Certificates of deposit
Total short term investments 2,000 2,000
Trade debtors 73,252 69.4% 50,860
75,252 52,860
The short term investments are loans and receivables and shown at amortised cost.
98
On a small number of occasions, the upper lending and term limits have been waived to allow the Council to take advantage of attractive lending opportunities with sound counterparties. The Council expects some losses from non-performance by its Icelandic counterparties in relation to deposits, and has allowed for this in the impairment calculation. The Council does not expect any losses from non-performance by other counterparties.
Trade debtors are general debtors to the Council, and do not include government departments, other local authorities or housing rents.
The Council does not generally allow credit for its trade debtors. During the reporting period the Council held no collateral as security.
Historical experience of default has been used to determine the bad debt provision for trade debtors.
Liquidity risk
The Council has ready access to borrowings from the Money Markets to cover any day to day cash flow need, and whilst the Public Works Loans Board (PWLB) provides access to longer term funds, it also acts as a lender of last resort to Councils. The Council is also required to provide a balanced budget through the Local Government Finance Act 1992, which ensures sufficient monies are raised to cover annual expenditure. There is therefore no significant risk that it will be unable to raise finance to meet its commitments under financial instruments.
The Council manages its liquidity position through the risk management procedures above (the setting and approval of prudential indicators and the approval of the treasury and investment strategy reports), as well as through cash flow management procedures required by the Code of Practice.
Refinancing and Maturity Risk
The Council maintains a significant debt and investment portfolio. Whilst the cash flow procedures above are considered against the refinancing risk procedures, longer term risk to the Council relates to managing the exposure to replacing financial instruments as they mature. This risk relates to both the maturing of longer term financial liabilities and longer term financial assets (up to three years).
The approved prudential indicator limits for the maturity structure of debt and the limits placed on investments placed for greater than one year in duration are the key parameters used to address this risk. The Council approved treasury and investment strategies address the main risks and the central treasury team address the operational risks within the approved parameters. This includes:
- monitoring the maturity profile of financial liabilities and amending the profile through either new borrowing or the rescheduling of the existing debt; and
- monitoring the maturity profile of investments to ensure sufficient liquidity is available for the Council’s day to day cash flow needs, and the spread of longer term investments provide stability of maturities and returns in relation to the longer term cash flow needs.
The maturity analysis of borrowing is as follows:
£'000
Less than one year 34,124
Between one and two years 2,441
Between two and five years 7,323
Between five and ten years 18,918

99
Between ten and twenty years 0
Between 20 and 30 years 18,308
Between 30 and 40 years 61,872
Between 40 and 50 years 233,727
More than 50 years 60,500
437,213
The maturity analysis of investments is as follows:
£'000
Less than one year 31,715
Between one and two years
Between two and three years
More than three years
31,715
Market risk – The variation in interest paid is 1% on the principal sum except for fixed rate long term loans. The variation in fair value is a pro rata figure assessed by comparing current rates with the average rate paid on current debt and adjusting the difference between fair value and nominal value to 1%. The figure is highly approximate as the actual figure will be sensitive to the detail pattern of rates at the time of assessment, the commercial circumstances of the parties to the loan, the detailed maturity profile, the proposed details of refinancing and the direction of movement of rates.
Interest rate risk - The Council is exposed to interest rate movements on its borrowings and investments. Movements in interest rates have a complex impact on the Council, depending on how variable and fixed interest rates move across differing financial instrument periods. For instance, a rise in variable and fixed interest rates would have the following effects:
- borrowings at variable rates – the interest expense charged to the Income and Expenditure Account may rise;
- borrowings at fixed rates – the fair value of the borrowing liability will fall;
- investments at variable rates – the interest income credited to the Income and Expenditure Account will rise; and
- investments at fixed rates – the fair value of the assets will fall.
Borrowings are not carried at fair value on the balance sheet, so nominal gains and losses on fixed rate borrowings would not impact on the Income and Expenditure Account or STRGL. However, changes in interest payable and receivable on variable rate borrowings and investments affect Income and Expenditure Account and the General Fund Balance. Movements in the fair value of fixed rate investments will be reflected in the STRGL, unless the investments have been designated as Fair Value through the Income and Expenditure Account.
The Council has a number of strategies for managing interest rate risk. The Annual Treasury Management Strategy draws together Council’s prudential indicators and its expected treasury operations, including an expectation of interest rate movements. From this Strategy a prudential indicator is set which provides maximum and minimum limits for fixed and variable interest rate exposure. The treasury team monitors market and forecast interest rates within the year and adjusts exposures appropriately. During periods of falling interest rates, and where economic circumstances
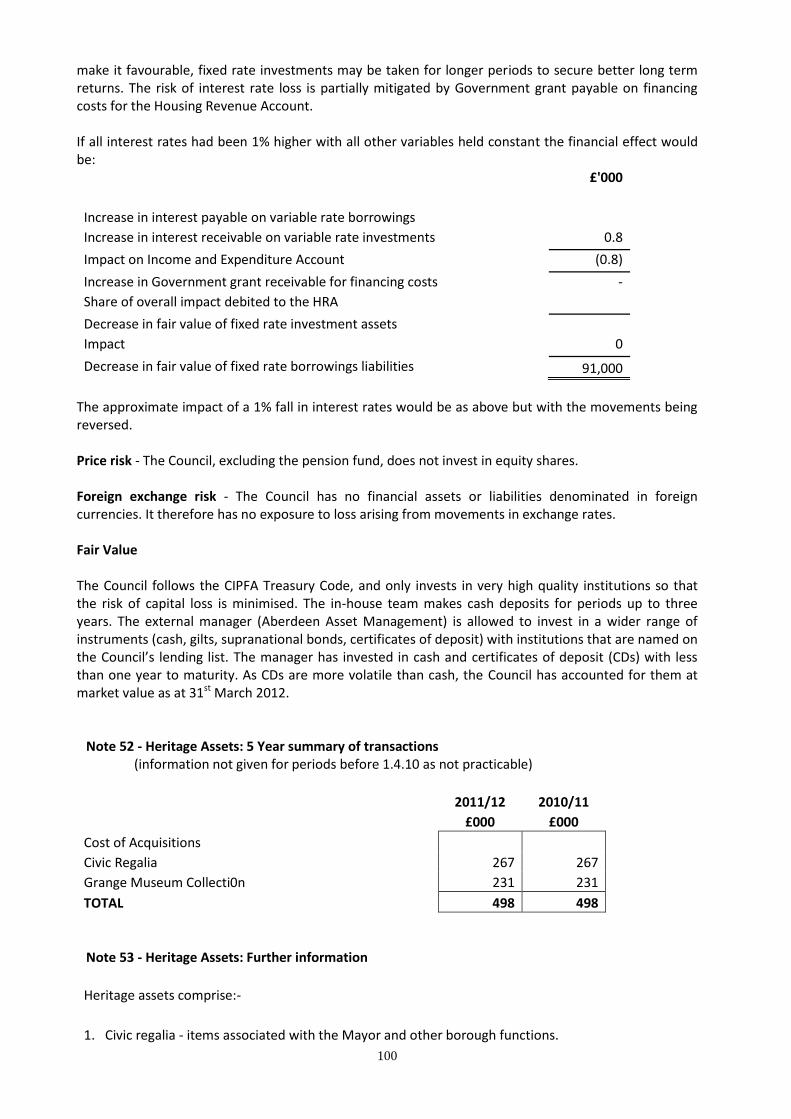
100
make it favourable, fixed rate investments may be taken for longer periods to secure better long term returns. The risk of interest rate loss is partially mitigated by Government grant payable on financing costs for the Housing Revenue Account. If all interest rates had been 1% higher with all other variables held constant the financial effect would be:
£'000
Increase in interest payable on variable rate borrowings
Increase in interest receivable on variable rate investments 0.8
Impact on Income and Expenditure Account (0.8)
Increase in Government grant receivable for financing costs -
Share of overall impact debited to the HRA
Decrease in fair value of fixed rate investment assets
Impact 0
Decrease in fair value of fixed rate borrowings liabilities 91,000
The approximate impact of a 1% fall in interest rates would be as above but with the movements being reversed.
Price risk - The Council, excluding the pension fund, does not invest in equity shares.
Foreign exchange risk - The Council has no financial assets or liabilities denominated in foreign currencies. It therefore has no exposure to loss arising from movements in exchange rates.
Fair Value
The Council follows the CIPFA Treasury Code, and only invests in very high quality institutions so that the risk of capital loss is minimised. The in-house team makes cash deposits for periods up to three years. The external manager (Aberdeen Asset Management) is allowed to invest in a wider range of instruments (cash, gilts, supranational bonds, certificates of deposit) with institutions that are named on the Council’s lending list. The manager has invested in cash and certificates of deposit (CDs) with less than one year to maturity. As CDs are more volatile than cash, the Council has accounted for them at market value as at 31st March 2012.
Note 52 - Heritage Assets: 5 Year summary of transactions
(information not given for periods before 1.4.10 as not practicable)
2011/12 2010/11
£000 £000
Cost of Acquisitions
Civic Regalia 267 267
Grange Museum Collecti0n 231 231
TOTAL 498 498
Note 53 - Heritage Assets: Further information
Heritage assets comprise:-
1. Civic regalia - items associated with the Mayor and other borough functions.
101
2. Grange museum collection - historic documents relating to Brent including display cabinets. Brent Museum's collections reflect working and domestic life in the London Borough of Brent from the mid-nineteenth century to the present day.
The collection is comprised over 10,000 artefacts relating to the borough, and also includes video and oral history recordings.
Note 54-Change in accounting policy required by the Code of Practice for Local Authority Accounting in the United Kingdom
The Code of Practice on Local Authority Accounting in the United Kingdom 2011/12 introduced a change to the treatment in accounting for heritage assets held by the Council.
As set out in our summary of significant accounting policies, the Council now requires heritage assets to be carried in the balance sheet at valuation.
Heritage Assets For 2011/12 the Council is required to change its accounting policy for heritage assets and recognise them at valuation. Previously, heritage assets were either recognised as community assets (at cost) in the property, plant and equipment classification in the Balance Sheet or were not recognised in the Balance Sheet as it was not possible to obtain cost information on the assets. Community Assets (that are now to be classified as heritage assets) that were donated to the Council were held at valuation as a proxy for historical cost. The Council’s accounting policies for recognition and measurement of heritage assets are set out in the Council’s summary of significant accounting policies Note 55 – Locata Brent, in partnership with other London boroughs and Housing Associations, is operating a joint lettings scheme for housing tenants. A company called Locata (Housing Services) Limited has been set up for this purpose. Locata’s turnover was £2,199k in 2011/12 (£2,379k 2010/11). Locata’s net assets were £443k in 2011/12 (£462k 2010/11). Brent is liable to contribute to the debts and liabilities of Locata up to £10, if it was wound up. Locata’s accounts have not been consolidated into Brent’s group accounts because the sums involved are not material to the Council’s accounts and because Brent has limited influence on the company (less than 20% voting rights). A copy of Locata’s accounts can be obtained from Companies House, Crown Way, Maindy, Cardiff CF14 3UZ or from www.companieshouse.gov.uk.
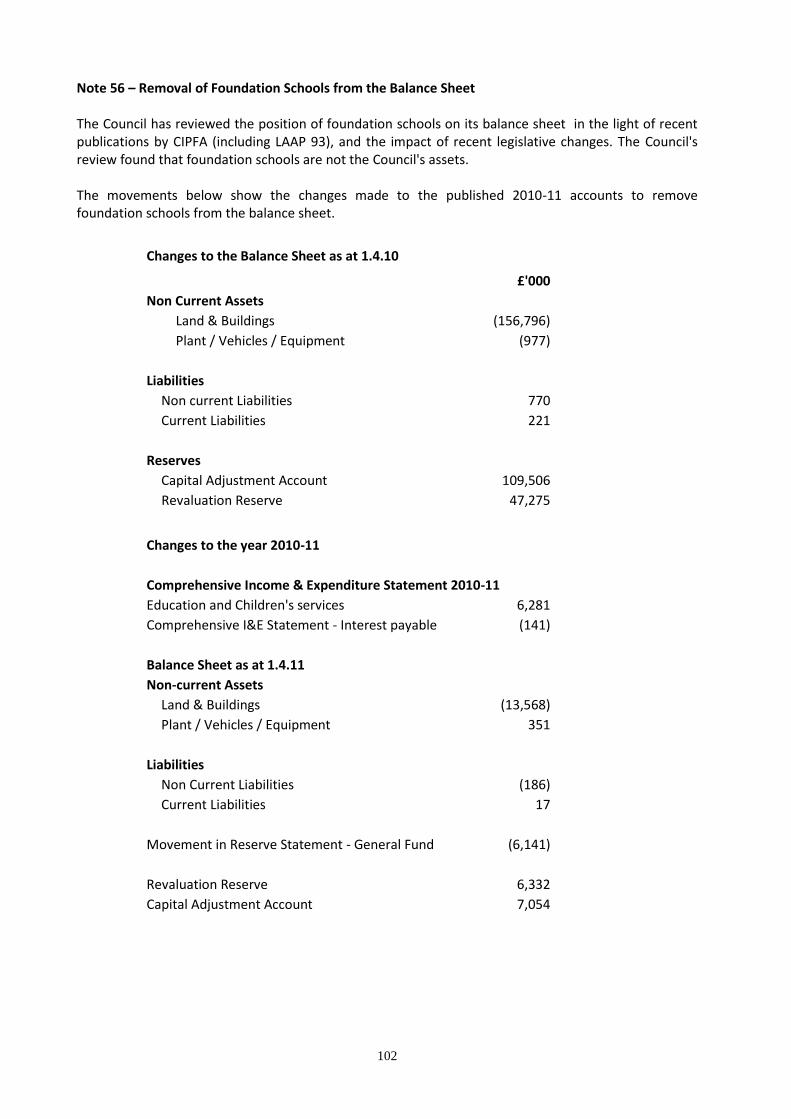
102
Note 56 – Removal of Foundation Schools from the Balance Sheet The Council has reviewed the position of foundation schools on its balance sheet in the light of recent publications by CIPFA (including LAAP 93), and the impact of recent legislative changes. The Council's review found that foundation schools are not the Council's assets. The movements below show the changes made to the published 2010-11 accounts to remove foundation schools from the balance sheet.
Changes to the Balance Sheet as at 1.4.10
£'000
Non Current Assets
Land & Buildings (156,796)
Plant / Vehicles / Equipment (977)
Liabilities
Non current Liabilities 770
Current Liabilities 221
Reserves
Capital Adjustment Account 109,506
Revaluation Reserve 47,275
Changes to the year 2010-11
Comprehensive Income & Expenditure Statement 2010-11
Education and Children's services 6,281
Comprehensive I&E Statement - Interest payable (141)
Balance Sheet as at 1.4.11
Non-current Assets
Land & Buildings (13,568)
Plant / Vehicles / Equipment 351
Liabilities
Non Current Liabilities (186)
Current Liabilities 17
Movement in Reserve Statement - General Fund (6,141)
Revaluation Reserve 6,332
Capital Adjustment Account 7,054
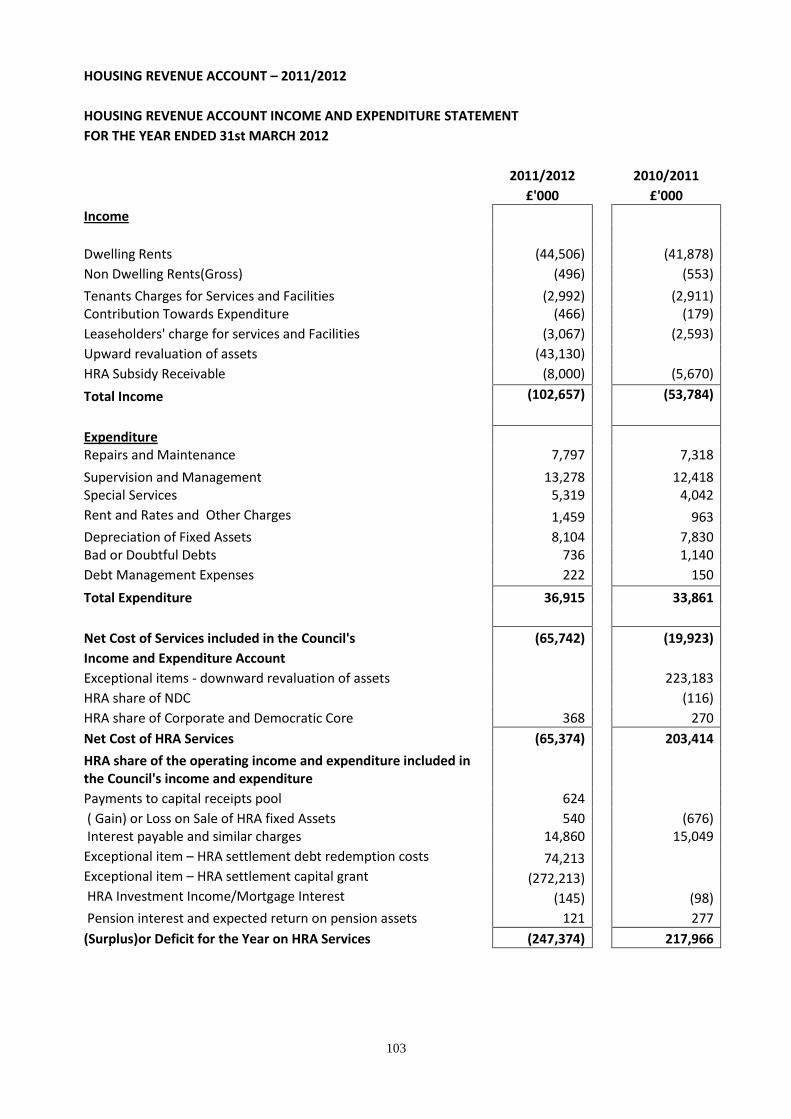
103
HOUSING REVENUE ACCOUNT – 2011/2012
HOUSING REVENUE ACCOUNT INCOME AND EXPENDITURE STATEMENT
FOR THE YEAR ENDED 31st MARCH 2012
2011/2012 2010/2011
£'000 £'000
Income
Dwelling Rents (44,506) (41,878)
Non Dwelling Rents(Gross) (496) (553)
Tenants Charges for Services and Facilities (2,992) (2,911) Contribution Towards Expenditure (466) (179)
Leaseholders' charge for services and Facilities (3,067) (2,593)
Upward revaluation of assets (43,130)
HRA Subsidy Receivable (8,000) (5,670)
Total Income (102,657) (53,784)
Expenditure
Repairs and Maintenance 7,797 7,318
Supervision and Management 13,278 12,418 Special Services 5,319 4,042
Rent and Rates and Other Charges 1,459 963
Depreciation of Fixed Assets 8,104 7,830 Bad or Doubtful Debts 736 1,140
Debt Management Expenses 222 150
Total Expenditure 36,915 33,861
Net Cost of Services included in the Council's (65,742) (19,923)
Income and Expenditure Account
Exceptional items - downward revaluation of assets
223,183
HRA share of NDC
(116)
HRA share of Corporate and Democratic Core 368 270
Net Cost of HRA Services (65,374) 203,414
HRA share of the operating income and expenditure included in the Council's income and expenditure
Payments to capital receipts pool 624 ( Gain) or Loss on Sale of HRA fixed Assets 540 (676)
Interest payable and similar charges 14,860 15,049
Exceptional item – HRA settlement debt redemption costs 74,213
Exceptional item – HRA settlement capital grant (272,213)
HRA Investment Income/Mortgage Interest (145) (98)
Pension interest and expected return on pension assets 121 277
(Surplus)or Deficit for the Year on HRA Services (247,374) 217,966
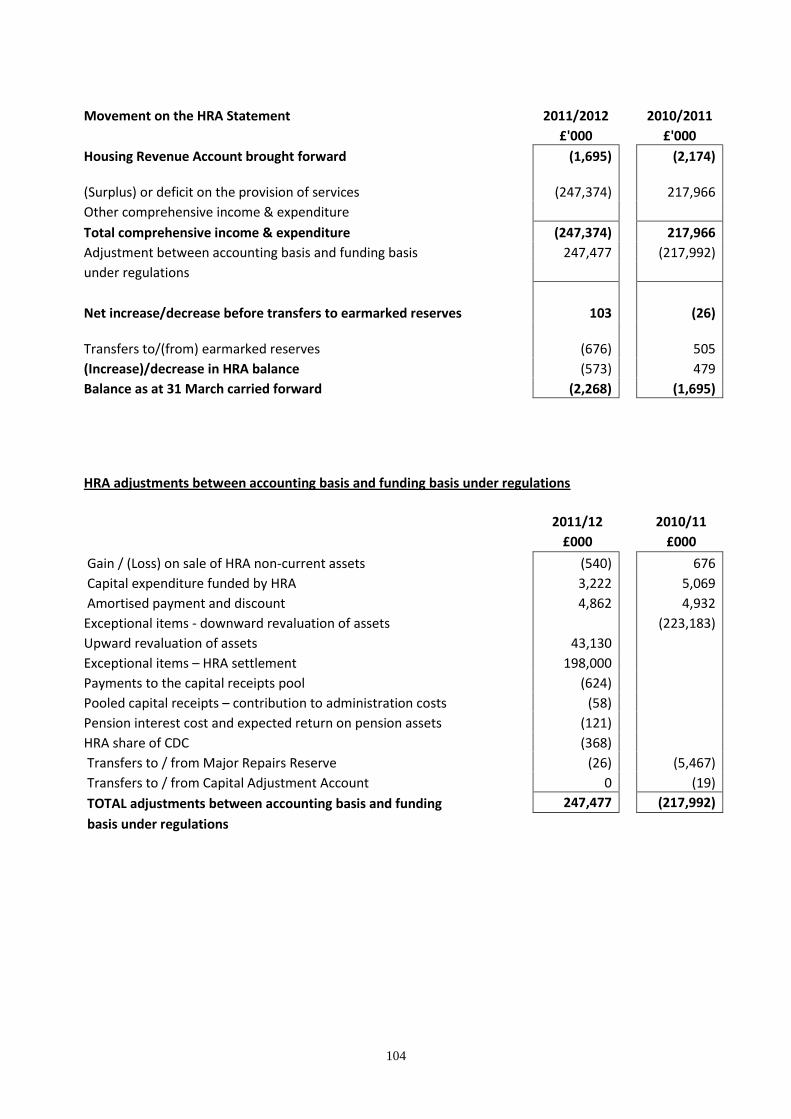
104
Movement on the HRA Statement 2011/2012 2010/2011
£'000 £'000
Housing Revenue Account brought forward (1,695) (2,174) (Surplus) or deficit on the provision of services (247,374) 217,966
Other comprehensive income & expenditure
Total comprehensive income & expenditure (247,374) 217,966
Adjustment between accounting basis and funding basis 247,477 (217,992)
under regulations
Net increase/decrease before transfers to earmarked reserves 103 (26) Transfers to/(from) earmarked reserves (676) 505
(Increase)/decrease in HRA balance (573) 479
Balance as at 31 March carried forward (2,268) (1,695)
HRA adjustments between accounting basis and funding basis under regulations
2011/12 2010/11
£000 £000
Gain / (Loss) on sale of HRA non-current assets (540) 676
Capital expenditure funded by HRA 3,222 5,069
Amortised payment and discount 4,862 4,932
Exceptional items - downward revaluation of assets
(223,183)
Upward revaluation of assets 43,130 Exceptional items – HRA settlement 198,000 Payments to the capital receipts pool (624) Pooled capital receipts – contribution to administration costs (58) Pension interest cost and expected return on pension assets (121) HRA share of CDC (368) Transfers to / from Major Repairs Reserve (26) (5,467)
Transfers to / from Capital Adjustment Account 0 (19)
TOTAL adjustments between accounting basis and funding 247,477 (217,992)
basis under regulations
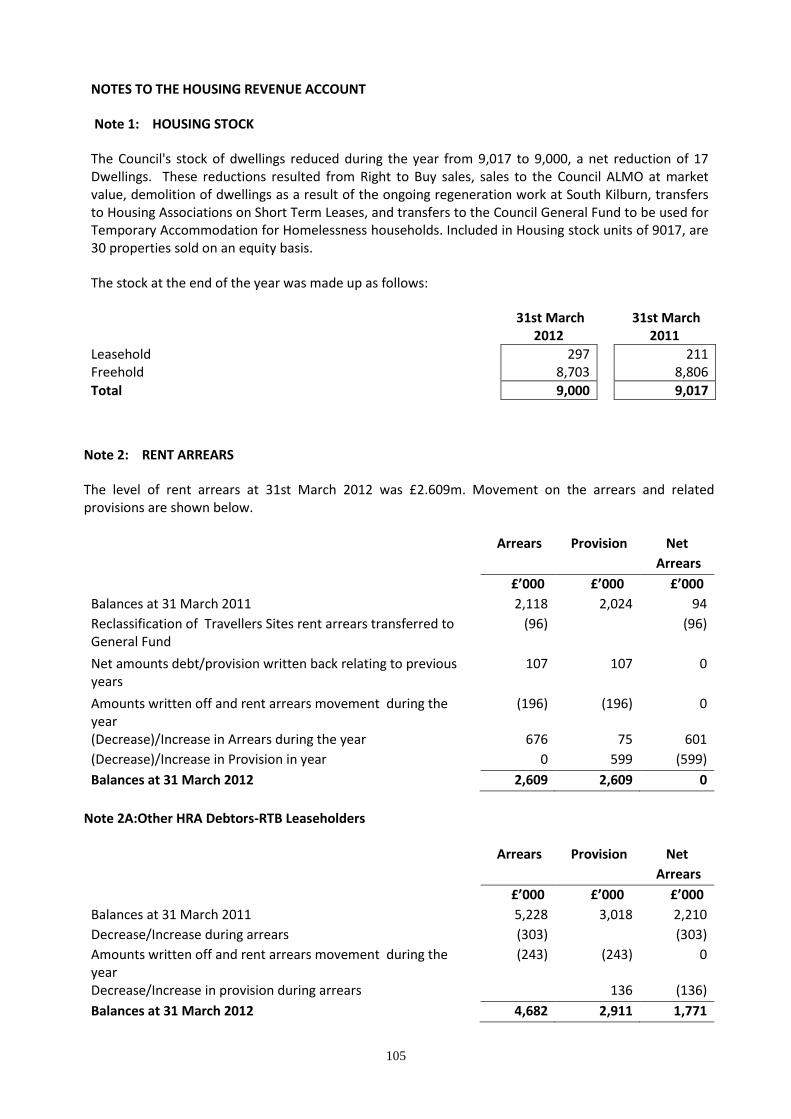
105
NOTES TO THE HOUSING REVENUE ACCOUNT
Note 1: HOUSING STOCK
The Council's stock of dwellings reduced during the year from 9,017 to 9,000, a net reduction of 17 Dwellings. These reductions resulted from Right to Buy sales, sales to the Council ALMO at market value, demolition of dwellings as a result of the ongoing regeneration work at South Kilburn, transfers to Housing Associations on Short Term Leases, and transfers to the Council General Fund to be used for Temporary Accommodation for Homelessness households. Included in Housing stock units of 9017, are 30 properties sold on an equity basis.
The stock at the end of the year was made up as follows:
31st March 2012
31st March 2011
Leasehold 297
211 Freehold 8,703
8,806
Total 9,000
9,017
Note 2: RENT ARREARS
The level of rent arrears at 31st March 2012 was £2.609m. Movement on the arrears and related provisions are shown below.
Arrears Provision Net
Arrears
£’000 £’000 £’000
Balances at 31 March 2011 2,118 2,024 94
Reclassification of Travellers Sites rent arrears transferred to General Fund
(96) (96)
Net amounts debt/provision written back relating to previous years
107 107 0
Amounts written off and rent arrears movement during the year
(196) (196) 0
(Decrease)/Increase in Arrears during the year 676 75 601
(Decrease)/Increase in Provision in year 0 599 (599)
Balances at 31 March 2012 2,609 2,609 0
Note 2A:Other HRA Debtors-RTB Leaseholders
Arrears Provision Net
Arrears
£’000 £’000 £’000
Balances at 31 March 2011 5,228 3,018 2,210
Decrease/Increase during arrears (303) (303)
Amounts written off and rent arrears movement during the year
(243) (243) 0
Decrease/Increase in provision during arrears 136 (136)
Balances at 31 March 2012 4,682 2,911 1,771
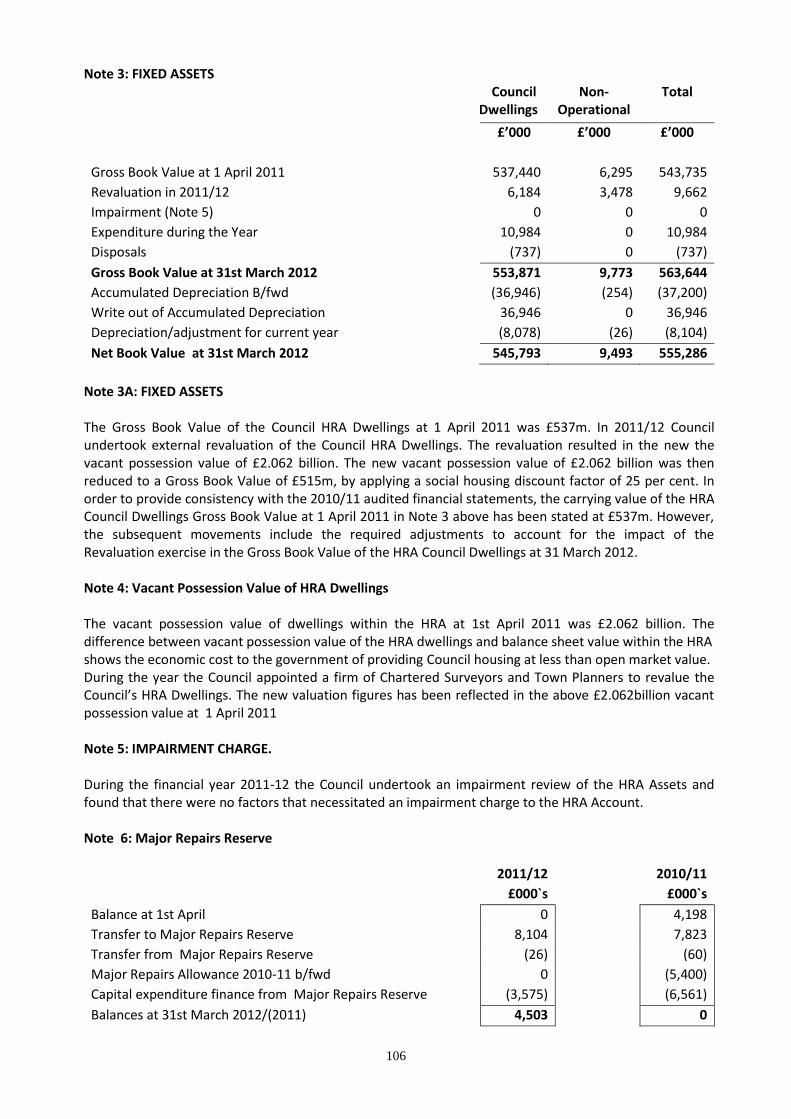
106
Note 3: FIXED ASSETS Council
Dwellings Non-
Operational Total
£’000 £’000 £’000
Gross Book Value at 1 April 2011 537,440 6,295 543,735
Revaluation in 2011/12 6,184 3,478 9,662
Impairment (Note 5) 0 0 0
Expenditure during the Year 10,984 0 10,984
Disposals (737) 0 (737)
Gross Book Value at 31st March 2012 553,871 9,773 563,644
Accumulated Depreciation B/fwd (36,946) (254) (37,200)
Write out of Accumulated Depreciation 36,946 0 36,946
Depreciation/adjustment for current year (8,078) (26) (8,104)
Net Book Value at 31st March 2012 545,793 9,493 555,286
Note 3A: FIXED ASSETS The Gross Book Value of the Council HRA Dwellings at 1 April 2011 was £537m. In 2011/12 Council undertook external revaluation of the Council HRA Dwellings. The revaluation resulted in the new the vacant possession value of £2.062 billion. The new vacant possession value of £2.062 billion was then reduced to a Gross Book Value of £515m, by applying a social housing discount factor of 25 per cent. In order to provide consistency with the 2010/11 audited financial statements, the carrying value of the HRA Council Dwellings Gross Book Value at 1 April 2011 in Note 3 above has been stated at £537m. However, the subsequent movements include the required adjustments to account for the impact of the Revaluation exercise in the Gross Book Value of the HRA Council Dwellings at 31 March 2012. Note 4: Vacant Possession Value of HRA Dwellings The vacant possession value of dwellings within the HRA at 1st April 2011 was £2.062 billion. The difference between vacant possession value of the HRA dwellings and balance sheet value within the HRA shows the economic cost to the government of providing Council housing at less than open market value. During the year the Council appointed a firm of Chartered Surveyors and Town Planners to revalue the Council’s HRA Dwellings. The new valuation figures has been reflected in the above £2.062billion vacant possession value at 1 April 2011 Note 5: IMPAIRMENT CHARGE. During the financial year 2011-12 the Council undertook an impairment review of the HRA Assets and found that there were no factors that necessitated an impairment charge to the HRA Account. Note 6: Major Repairs Reserve
2011/12 2010/11
£000`s £000`s
Balance at 1st April 0 4,198
Transfer to Major Repairs Reserve 8,104 7,823
Transfer from Major Repairs Reserve (26) (60)
Major Repairs Allowance 2010-11 b/fwd 0 (5,400)
Capital expenditure finance from Major Repairs Reserve (3,575) (6,561)
Balances at 31st March 2012/(2011) 4,503 0

107
Note 7:HRA SUBSIDY 2011/12 2010/11
£000`s £000`s
Management Allowance 7,813 7,432
Maintenance Allowance 12,953 12,239
Major Repairs Allowance 8,078 7,763
Major Repairs Allowance 2010-11 b/fwd 0 -5,400
ALMO Allowance 0 4,320
Capital Charges 22,852 20,750
Interest On Receipt (8) -10
Other Reckonable Expenditure 118 118
Interest Adjustment( HRA Self Finance Debt Settlement) (104) 0
51,702 47,212
Guideline Rent Income (43,771) (41,542)
Housing Subsidy Due 7,931 5,670
Housing Subsidy Audit Adjustment 69 0
8,000 5,670
The HRA Subsidy figures are calculated in accordance with the HRA Subsidy Determinations issued by the central government department, DCLG for the relevant Financial Year. The HRA Subsidy analysis above includes an interest adjustment of £104k. The interest adjustment relates to the HRA Debt Settlement by DCLG on 28 March 2012, as part of the implementation of the HRA Self Finance from 1 April 2012. Note 8(A):HRA CAPITAL EXPENDITURE FUNDING IN 2011/12
2011/12 2010/11
£000`s £000`s
Borrowing 3,726 2,864
External Grants and Contributions 311 0
Earmarked Reserves 0 527
Revenue Contribution 3,222 4,541
Major Repairs Reserve 3,575 6,561
Total 10,834 14,493
NOTE 8:(B) HRA CAPITAL RECEIPTS IN 2011/12
2011/12 2010/11
£000`s £000`s
Land 0 15,803
Houses 4,522 978 Other Properties 33 3,492
Total 4,555 20,273
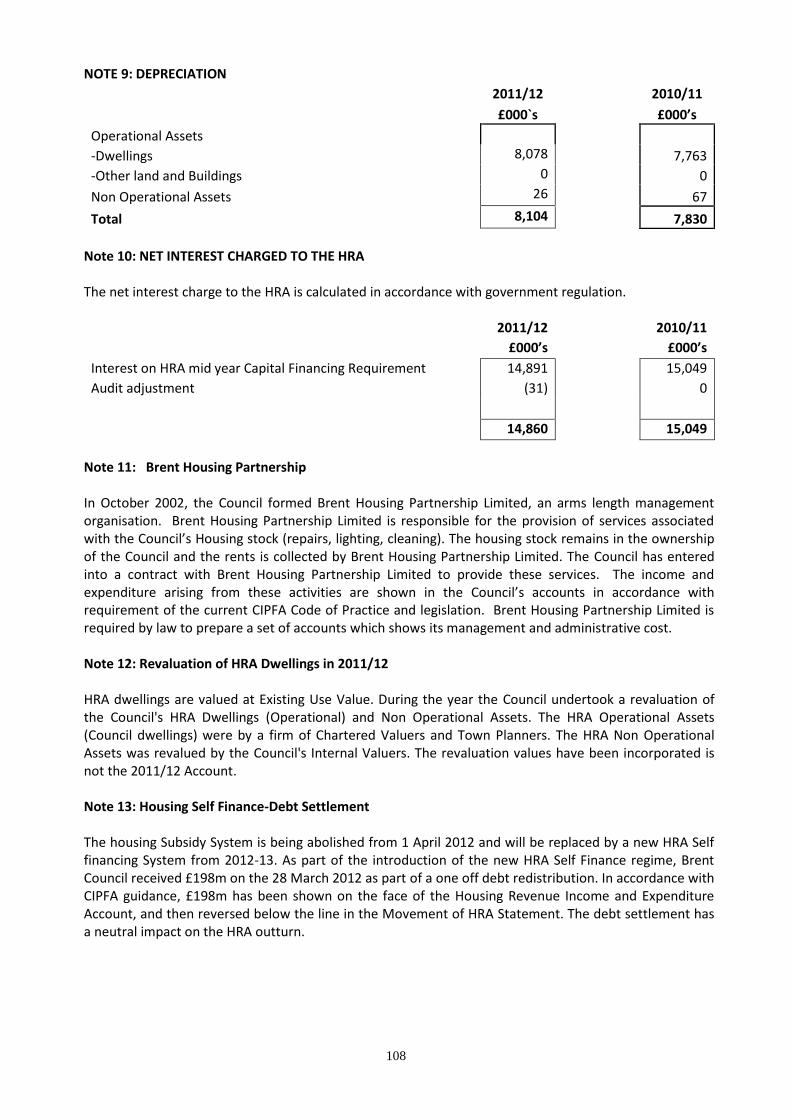
108
NOTE 9: DEPRECIATION
2011/12 2010/11
£000`s £000’s
Operational Assets
-Dwellings 8,078 7,763
-Other land and Buildings 0 0
Non Operational Assets 26 67
Total 8,104 7,830
Note 10: NET INTEREST CHARGED TO THE HRA The net interest charge to the HRA is calculated in accordance with government regulation.
2011/12 2010/11
£000’s £000’s
Interest on HRA mid year Capital Financing Requirement 14,891 15,049
Audit adjustment (31) 0
14,860 15,049
Note 11: Brent Housing Partnership In October 2002, the Council formed Brent Housing Partnership Limited, an arms length management organisation. Brent Housing Partnership Limited is responsible for the provision of services associated with the Council’s Housing stock (repairs, lighting, cleaning). The housing stock remains in the ownership of the Council and the rents is collected by Brent Housing Partnership Limited. The Council has entered into a contract with Brent Housing Partnership Limited to provide these services. The income and expenditure arising from these activities are shown in the Council’s accounts in accordance with requirement of the current CIPFA Code of Practice and legislation. Brent Housing Partnership Limited is required by law to prepare a set of accounts which shows its management and administrative cost. Note 12: Revaluation of HRA Dwellings in 2011/12 HRA dwellings are valued at Existing Use Value. During the year the Council undertook a revaluation of the Council's HRA Dwellings (Operational) and Non Operational Assets. The HRA Operational Assets (Council dwellings) were by a firm of Chartered Valuers and Town Planners. The HRA Non Operational Assets was revalued by the Council's Internal Valuers. The revaluation values have been incorporated is not the 2011/12 Account. Note 13: Housing Self Finance-Debt Settlement The housing Subsidy System is being abolished from 1 April 2012 and will be replaced by a new HRA Self financing System from 2012-13. As part of the introduction of the new HRA Self Finance regime, Brent Council received £198m on the 28 March 2012 as part of a one off debt redistribution. In accordance with CIPFA guidance, £198m has been shown on the face of the Housing Revenue Income and Expenditure Account, and then reversed below the line in the Movement of HRA Statement. The debt settlement has a neutral impact on the HRA outturn.
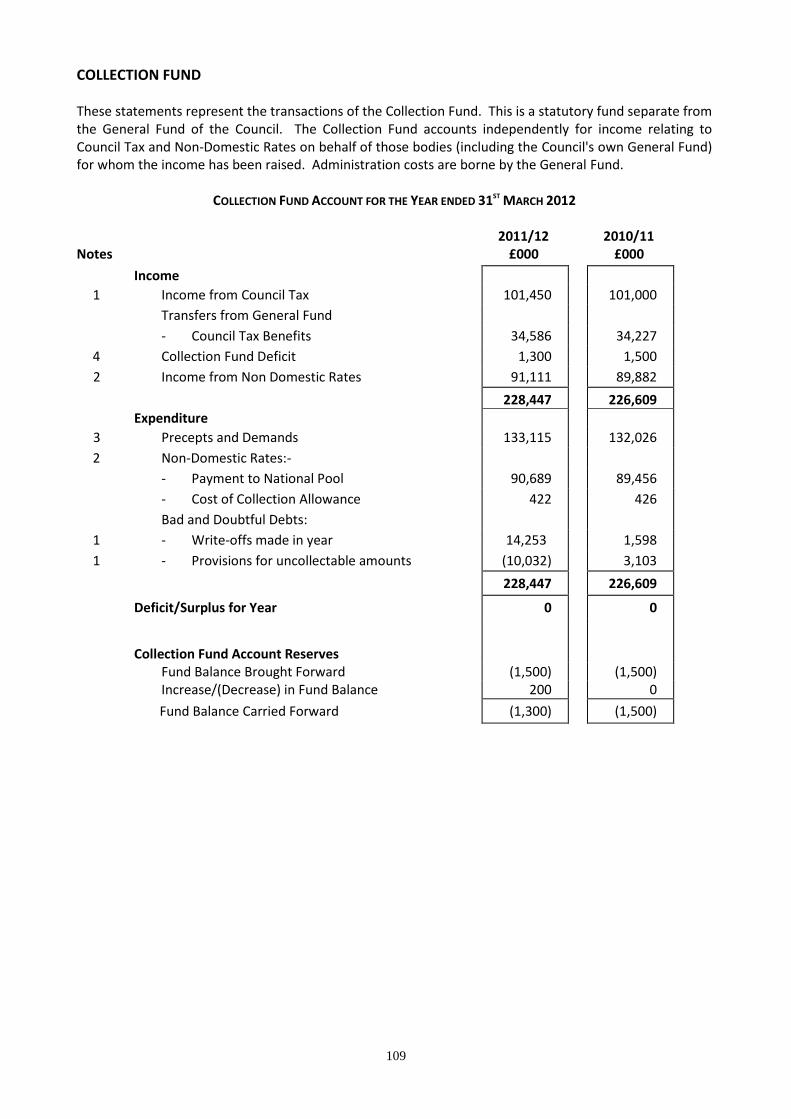
109
COLLECTION FUND These statements represent the transactions of the Collection Fund. This is a statutory fund separate from the General Fund of the Council. The Collection Fund accounts independently for income relating to Council Tax and Non-Domestic Rates on behalf of those bodies (including the Council's own General Fund) for whom the income has been raised. Administration costs are borne by the General Fund.
COLLECTION FUND ACCOUNT FOR THE YEAR ENDED 31ST MARCH 2012
2011/12 2010/11 Notes £000 £000
Income
1 Income from Council Tax 101,450 101,000
Transfers from General Fund
- Council Tax Benefits 34,586 34,227
4 Collection Fund Deficit 1,300 1,500
2 Income from Non Domestic Rates 91,111 89,882
228,447 226,609
Expenditure
3 Precepts and Demands 133,115 132,026
2 Non-Domestic Rates:-
- Payment to National Pool 90,689 89,456
- Cost of Collection Allowance 422 426
Bad and Doubtful Debts:
1 - Write-offs made in year 14,253 1,598
1 - Provisions for uncollectable amounts (10,032) 3,103
228,447 226,609
Deficit/Surplus for Year 0 0
Collection Fund Account Reserves Fund Balance Brought Forward (1,500) (1,500) Increase/(Decrease) in Fund Balance 200 0
Fund Balance Carried Forward (1,300) (1,500)
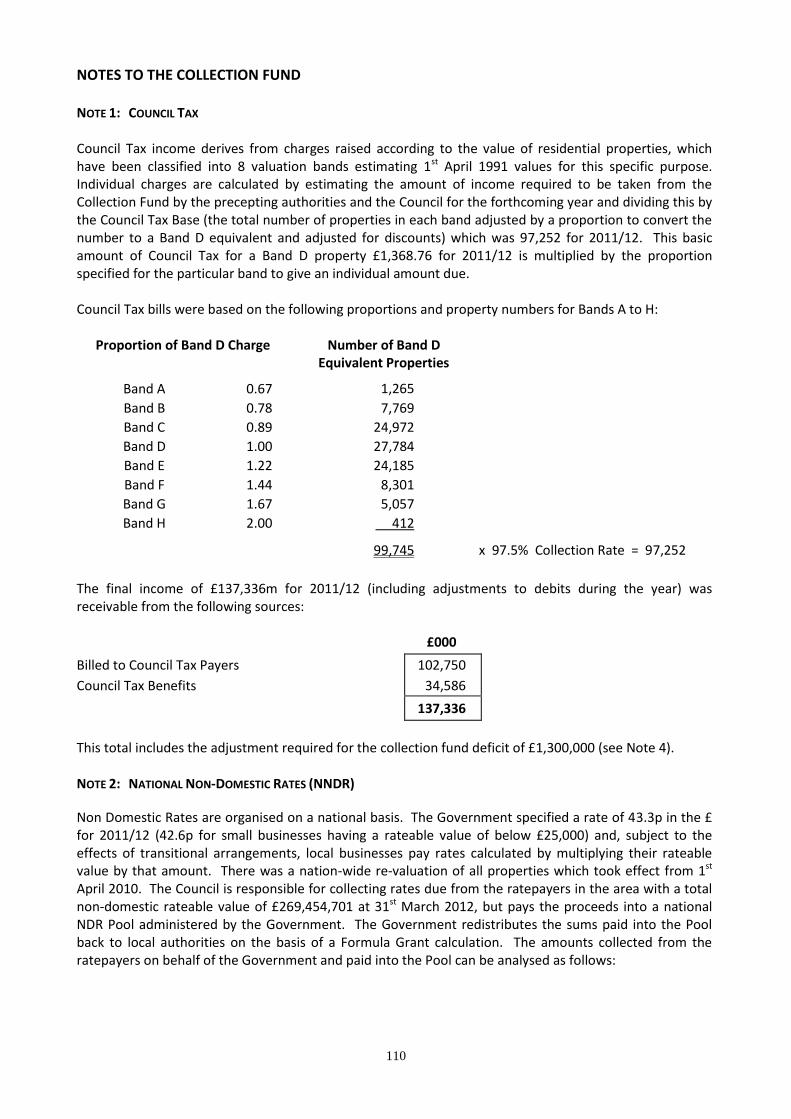
110
NOTES TO THE COLLECTION FUND NOTE 1: COUNCIL TAX Council Tax income derives from charges raised according to the value of residential properties, which have been classified into 8 valuation bands estimating 1st April 1991 values for this specific purpose. Individual charges are calculated by estimating the amount of income required to be taken from the Collection Fund by the precepting authorities and the Council for the forthcoming year and dividing this by the Council Tax Base (the total number of properties in each band adjusted by a proportion to convert the number to a Band D equivalent and adjusted for discounts) which was 97,252 for 2011/12. This basic amount of Council Tax for a Band D property £1,368.76 for 2011/12 is multiplied by the proportion specified for the particular band to give an individual amount due. Council Tax bills were based on the following proportions and property numbers for Bands A to H:
Proportion of Band D Charge Number of Band D Equivalent Properties
Band A 0.67 1,265
Band B 0.78 7,769
Band C 0.89 24,972
Band D 1.00 27,784
Band E 1.22 24,185
Band F 1.44 8,301
Band G 1.67 5,057
Band H 2.00 412
99,745 x 97.5% Collection Rate = 97,252
The final income of £137,336m for 2011/12 (including adjustments to debits during the year) was receivable from the following sources: £000
Billed to Council Tax Payers 102,750
Council Tax Benefits 34,586
137,336
This total includes the adjustment required for the collection fund deficit of £1,300,000 (see Note 4). NOTE 2: NATIONAL NON-DOMESTIC RATES (NNDR)
Non Domestic Rates are organised on a national basis. The Government specified a rate of 43.3p in the £ for 2011/12 (42.6p for small businesses having a rateable value of below £25,000) and, subject to the effects of transitional arrangements, local businesses pay rates calculated by multiplying their rateable value by that amount. There was a nation-wide re-valuation of all properties which took effect from 1st April 2010. The Council is responsible for collecting rates due from the ratepayers in the area with a total non-domestic rateable value of £269,454,701 at 31st March 2012, but pays the proceeds into a national NDR Pool administered by the Government. The Government redistributes the sums paid into the Pool back to local authorities on the basis of a Formula Grant calculation. The amounts collected from the ratepayers on behalf of the Government and paid into the Pool can be analysed as follows:
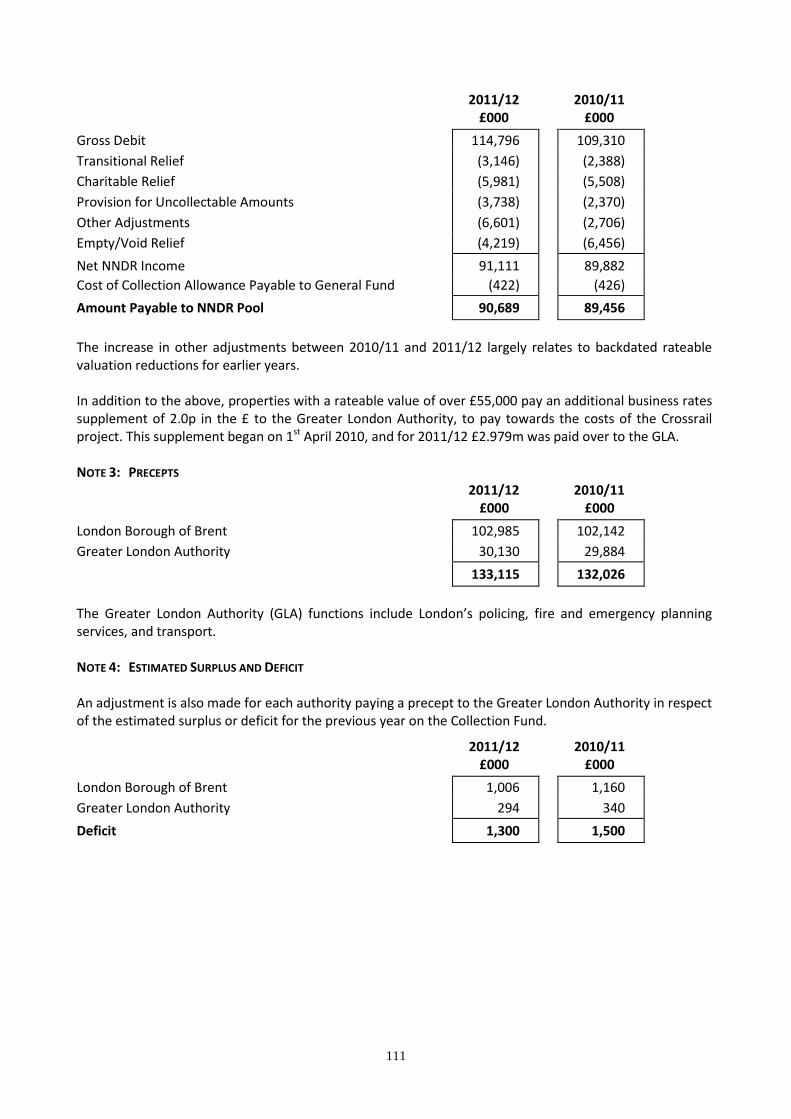
111
2011/12 2010/11 £000 £000
Gross Debit 114,796 109,310
Transitional Relief (3,146) (2,388)
Charitable Relief (5,981) (5,508)
Provision for Uncollectable Amounts (3,738) (2,370)
Other Adjustments (6,601) (2,706)
Empty/Void Relief (4,219) (6,456)
Net NNDR Income 91,111 89,882
Cost of Collection Allowance Payable to General Fund (422) (426)
Amount Payable to NNDR Pool 90,689 89,456
The increase in other adjustments between 2010/11 and 2011/12 largely relates to backdated rateable valuation reductions for earlier years. In addition to the above, properties with a rateable value of over £55,000 pay an additional business rates supplement of 2.0p in the £ to the Greater London Authority, to pay towards the costs of the Crossrail project. This supplement began on 1st April 2010, and for 2011/12 £2.979m was paid over to the GLA. NOTE 3: PRECEPTS 2011/12 2010/11 £000 £000
London Borough of Brent 102,985 102,142
Greater London Authority 30,130 29,884
133,115 132,026
The Greater London Authority (GLA) functions include London’s policing, fire and emergency planning services, and transport. NOTE 4: ESTIMATED SURPLUS AND DEFICIT An adjustment is also made for each authority paying a precept to the Greater London Authority in respect of the estimated surplus or deficit for the previous year on the Collection Fund.
2011/12 2010/11 £000 £000
London Borough of Brent 1,006 1,160
Greater London Authority 294 340
Deficit 1,300 1,500

112
GROUP ACCOUNTS
Local authorities are required to produce group accounts which include interests in subsidiaries, associates and joint ventures. Brent has one subsidiary, Brent Housing Partnership (BHP) Limited. This is an arms length management organisation (ALMO) which was set up in October 2002 to manage Council properties on behalf of Brent. BHP is a limited company. It is limited by a guarantee with no share capital. It is fully owned by the London Borough of Brent. The London Borough of Brent has an obligation to meet BHP’s pension fund liabilities. BHP’s accounts may be obtained from their financial controller, Ian Warner at Chancel House, Neasden Lane, London, NW10 2UF, e-mail address [email protected]. Thorough investigations confirmed that, as in previous years, there are no other bodies to be included in the group accounts.
BHP’s accounts have been consolidated as a subsidiary using the acquisition basis of combination.
The following group financial statements have been prepared:
- Group Income and Expenditure Account
- Reconciliation of the Single Entity Surplus or Deficit for the Year to the Group Surplus or Deficit
- Group Statement of Total Recognised Gains and Losses
- Group Balance Sheet
- Group Cash Flow Statement
A significant amount of information in these statements is identical to Brent’s accounts on the preceding pages of this document. Information has not been reproduced in the group accounts where it can be readily seen in Brent’s accounting statements. This includes accounting policies. The accounting policies for the group accounts are the same as for Brent’s single entity accounts and are shown earlier in this document.
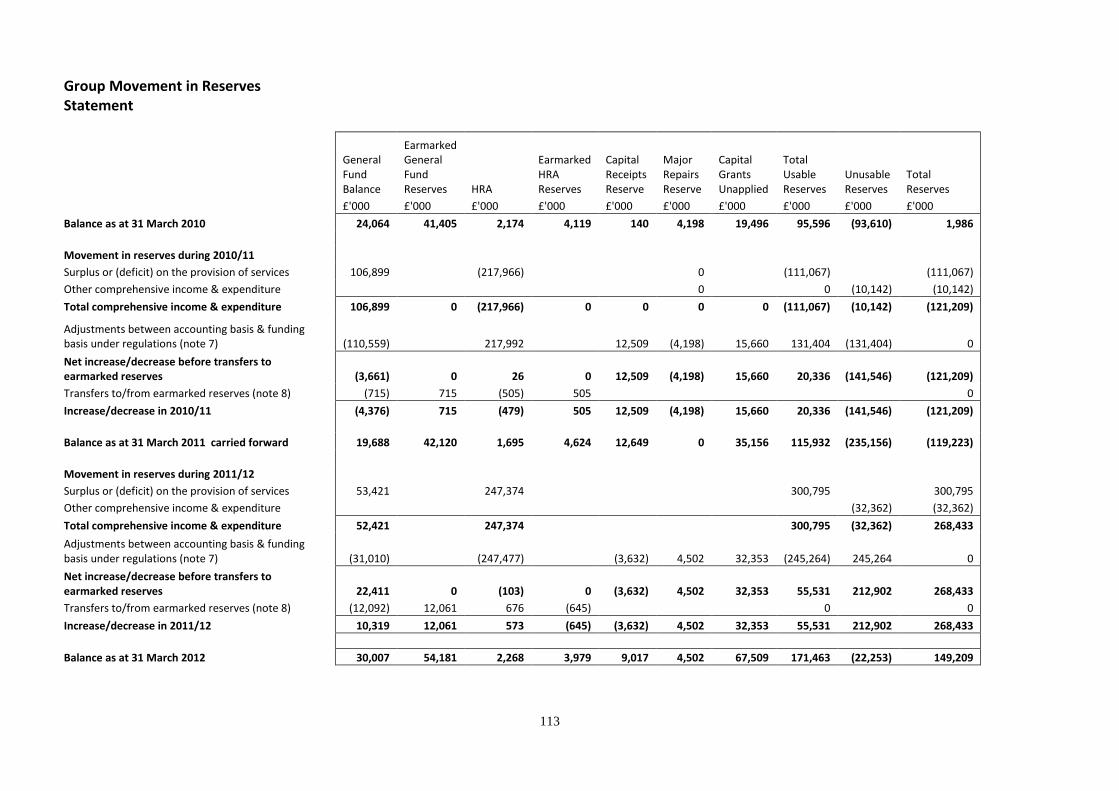
113
Group Movement in Reserves Statement
General Fund Balance
Earmarked General Fund Reserves HRA
Earmarked HRA Reserves
Capital Receipts Reserve
Major Repairs Reserve
Capital Grants Unapplied
Total Usable Reserves
Unusable Reserves
Total Reserves
£'000 £'000 £'000 £'000 £'000 £'000 £'000 £'000 £'000 £'000
Balance as at 31 March 2010 24,064 41,405 2,174 4,119 140 4,198 19,496 95,596 (93,610) 1,986
Movement in reserves during 2010/11
Surplus or (deficit) on the provision of services 106,899 (217,966) 0 (111,067) (111,067)
Other comprehensive income & expenditure 0 0 (10,142) (10,142)
Total comprehensive income & expenditure 106,899 0 (217,966) 0 0 0 0 (111,067) (10,142) (121,209)
Adjustments between accounting basis & funding basis under regulations (note 7) (110,559)
217,992 12,509 (4,198) 15,660 131,404 (131,404) 0
Net increase/decrease before transfers to earmarked reserves (3,661) 0 26 0 12,509 (4,198) 15,660 20,336 (141,546) (121,209)
Transfers to/from earmarked reserves (note 8) (715) 715 (505) 505 0
Increase/decrease in 2010/11 (4,376) 715 (479) 505 12,509 (4,198) 15,660 20,336 (141,546) (121,209)
Balance as at 31 March 2011 carried forward 19,688 42,120 1,695 4,624 12,649 0 35,156 115,932 (235,156) (119,223)
Movement in reserves during 2011/12
Surplus or (deficit) on the provision of services 53,421
247,374 300,795 300,795
Other comprehensive income & expenditure
(32,362) (32,362)
Total comprehensive income & expenditure 52,421
247,374 300,795 (32,362) 268,433
Adjustments between accounting basis & funding basis under regulations (note 7) (31,010)
(247,477) (3,632) 4,502 32,353 (245,264) 245,264 0
Net increase/decrease before transfers to earmarked reserves 22,411 0 (103) 0 (3,632) 4,502 32,353 55,531 212,902 268,433
Transfers to/from earmarked reserves (note 8) (12,092) 12,061 676 (645) 0 0
Increase/decrease in 2011/12 10,319 12,061 573 (645) (3,632) 4,502 32,353 55,531 212,902 268,433
Balance as at 31 March 2012 30,007 54,181 2,268 3,979 9,017 4,502 67,509 171,463 (22,253) 149,209

114
GROUP COMPREHENSIVE INCOME AND EXPENDITURE ACCOUNT FOR THE YEAR ENDED 31st MARCH 2012
2010/11 Restated 2011/12 Gross
Expenditure Gross
Income Net
Expenditure Gross
Expenditure Gross
Income Net
Expenditure £'000 £'000 £'000 £'000 £'000 £'000
50,289 (38,500) 11,789 Central services to the public 59,163 (46,411) 12,752 19,360 (2,984) 16,376 Culture and related services 20,579 (2,648) 17,931 32,827 (5,351) 27,476 Environment and Regulatory services 35,324 (5,055) 30,269
7,944 (3,331) 4,613
Planning 4,440 (2,466) 1,974 52,138 (4,288) 47,850
Children’s Social Care 47,266 (3,895) 43,371
398,317 (358,892) 39,425
Education and Children’s services 354,959 (323,016) 31,943 26,144 (17,249) 8,895 Highways and transport services 34,078 (29,168) 4,910 31,110 (55,690) (24,580) Local authority housing (HRA) 44,068 (105,910) (61,842)
364,678 (332,171) 32,507 Other housing services 401,812 (367,880) 33,932 122,213 (25,276) 96,937 Adult social care 118,054 (25,133) 92,921
6,470 0 6,470 Corporate and democratic core 8,609 (36) 8,573 234,654 0 234,654 Exceptional item - downward revaluation of assets 0 0 0
(117,950) 0 (117,950) Reduction in past service pension costs 0 0 0 6,264 (9,603) (3,339) Non distributed costs 1,633 0 1,633
1,234,458 (853,335) 381,123 Cost of Services 1,129,985 (911,618) 218,367
32,403 Other operating expenditure
9,190 63,926 Financing and investment income and expenditure
45,255
0 Exceptional item – HRA settlement debt redemption costs
74,213 0
Exceptional item – HRA settlement capital grant
(272,213)
(366,386) Taxation and non-specific grant income
(375,607)
111,066 (Surplus) or Deficit on Provision of Services
(300,795)
(2,368) Surplus or deficit on revaluation of Property, Plant and Equipment assets
(35,479)
Surplus or deficit on revaluation of available for sale financial assets 12,510 Actuarial gains/losses on pension assets and liabilities
67,841
10,142 Other Comprehensive Income and Expenditure
32,362
121,208 Total Comprehensive Income and Expenditure
(268,433)
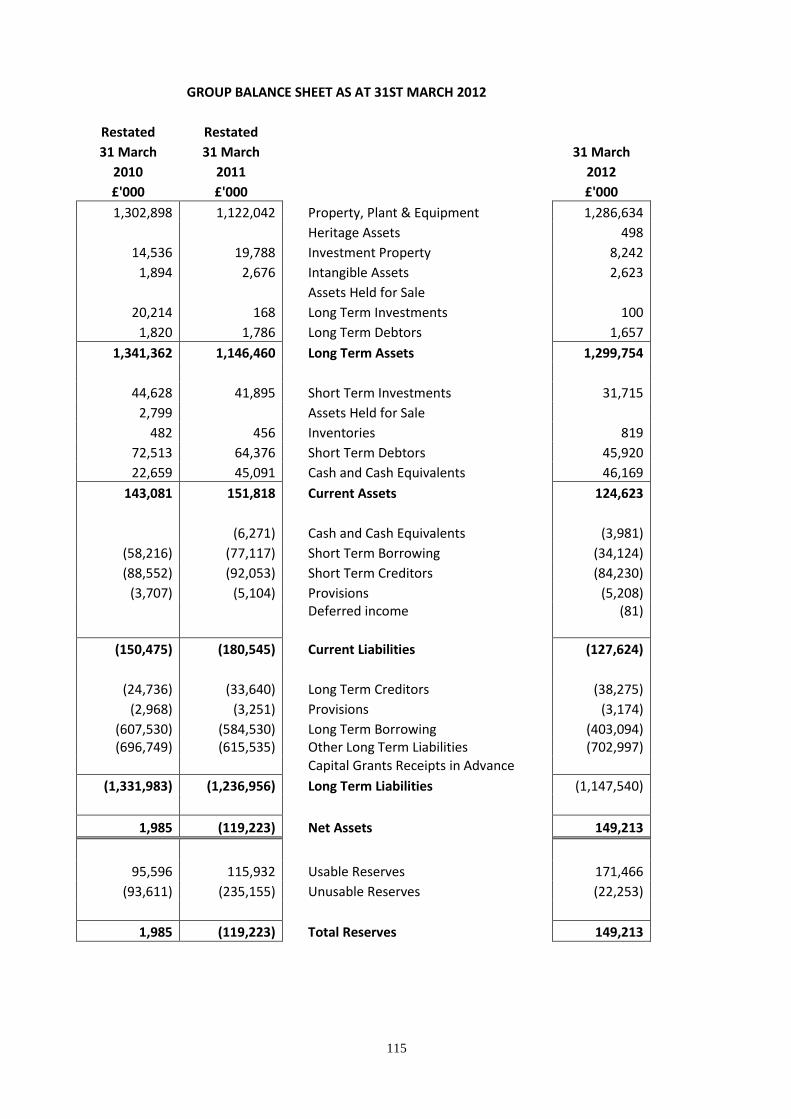
115
GROUP BALANCE SHEET AS AT 31ST MARCH 2012
Restated Restated
31 March 31 March 31 March
2010 2011 2012
£'000 £'000 £'000
1,302,898 1,122,042 Property, Plant & Equipment 1,286,634
Heritage Assets
498
14,536 19,788 Investment Property 8,242
1,894 2,676 Intangible Assets 2,623
Assets Held for Sale 20,214 168 Long Term Investments 100
1,820 1,786 Long Term Debtors 1,657
1,341,362 1,146,460 Long Term Assets 1,299,754
44,628 41,895 Short Term Investments 31,715
2,799 Assets Held for Sale 482 456 Inventories 819
72,513 64,376 Short Term Debtors 45,920
22,659 45,091 Cash and Cash Equivalents 46,169
143,081 151,818 Current Assets 124,623
(6,271) Cash and Cash Equivalents (3,981)
(58,216) (77,117) Short Term Borrowing (34,124)
(88,552) (92,053) Short Term Creditors (84,230)
(3,707) (5,104) Provisions (5,208) Deferred income (81)
(150,475) (180,545) Current Liabilities (127,624)
(24,736) (33,640) Long Term Creditors (38,275)
(2,968) (3,251) Provisions (3,174)
(607,530) (584,530) Long Term Borrowing (403,094) (696,749) (615,535) Other Long Term Liabilities (702,997)
Capital Grants Receipts in Advance
(1,331,983) (1,236,956) Long Term Liabilities (1,147,540)
1,985 (119,223) Net Assets 149,213
95,596 115,932 Usable Reserves 171,466
(93,611) (235,155) Unusable Reserves (22,253)
1,985 (119,223) Total Reserves 149,213
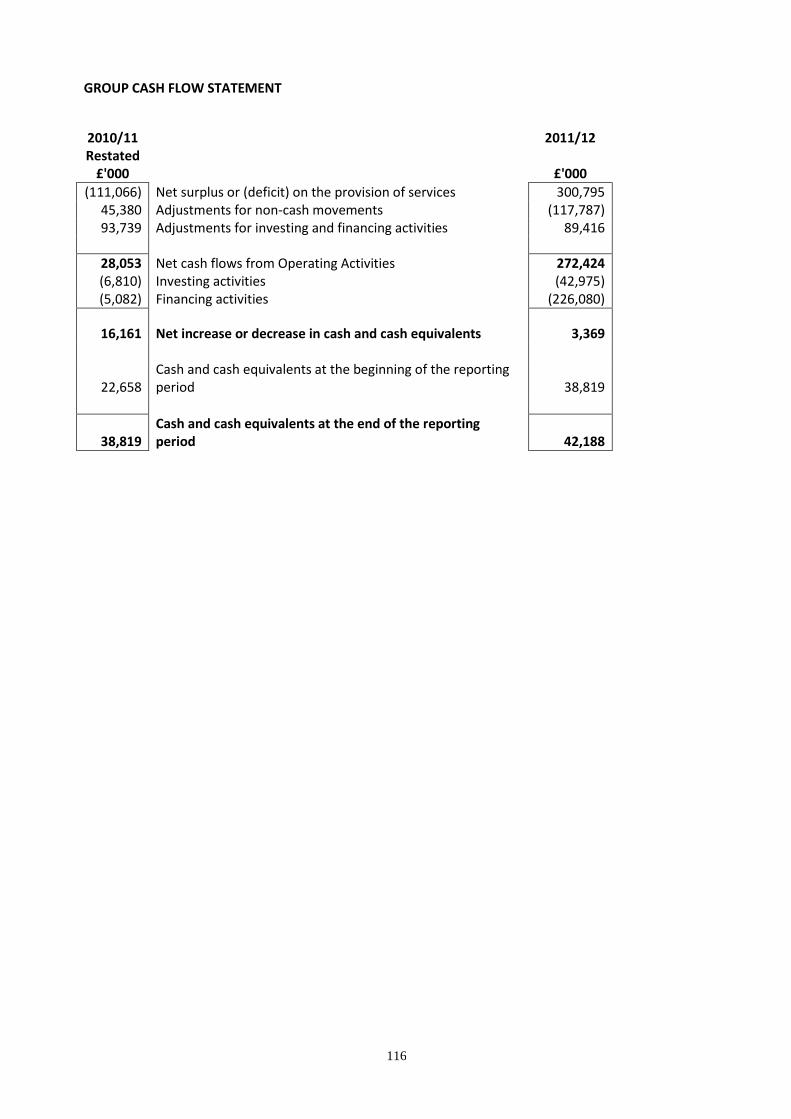
116
GROUP CASH FLOW STATEMENT
2010/11
2011/12
Restated £'000
£'000
(111,066) Net surplus or (deficit) on the provision of services 300,795 45,380 Adjustments for non-cash movements (117,787) 93,739 Adjustments for investing and financing activities 89,416
28,053 Net cash flows from Operating Activities 272,424 (6,810) Investing activities (42,975) (5,082) Financing activities (226,080)
16,161 Net increase or decrease in cash and cash equivalents 3,369
22,658
Cash and cash equivalents at the beginning of the reporting period 38,819
38,819 Cash and cash equivalents at the end of the reporting period 42,188
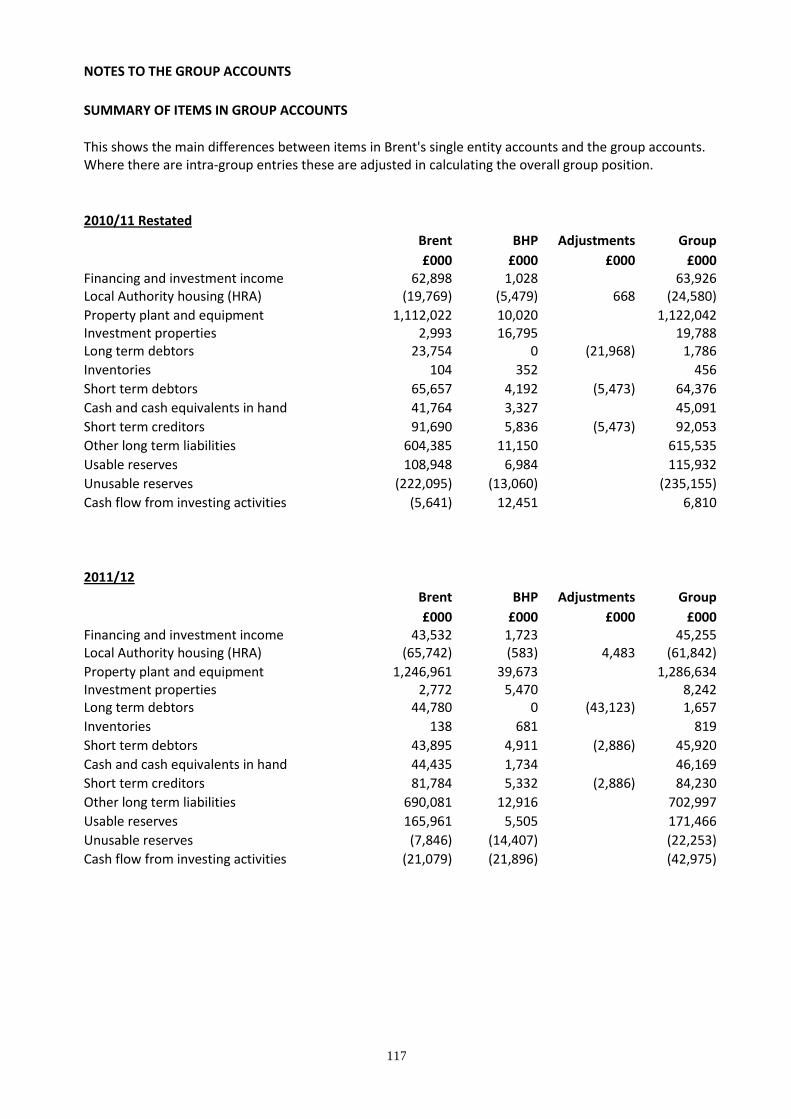
117
NOTES TO THE GROUP ACCOUNTS
SUMMARY OF ITEMS IN GROUP ACCOUNTS
This shows the main differences between items in Brent's single entity accounts and the group accounts. Where there are intra-group entries these are adjusted in calculating the overall group position.
2010/11 Restated
Brent BHP Adjustments Group
£000 £000 £000 £000
Financing and investment income Local Authority housing (HRA)
62,898 (19,769)
1,028 (5,479)
668
63,926 (24,580)
Property plant and equipment 1,112,022 10,020 1,122,042 Investment properties
Long term debtors 2,993
23,754 16,795
0
(21,968) 19,788
1,786 Inventories
104 352 456
Short term debtors
65,657 4,192 (5,473) 64,376 Cash and cash equivalents in hand
41,764 3,327 45,091
Short term creditors
91,690 5,836 (5,473) 92,053 Other long term liabilities
604,385 11,150 615,535
Usable reserves
108,948 6,984 115,932 Unusable reserves
(222,095) (13,060) (235,155)
Cash flow from investing activities (5,641) 12,451 6,810
2011/12
Brent BHP Adjustments Group
£000 £000 £000 £000
Financing and investment income Local Authority housing (HRA)
43,532 (65,742)
1,723 (583)
4,483
45,255 (61,842)
Property plant and equipment 1,246,961 39,673 1,286,634 Investment properties
Long term debtors
2,772 44,780
5,470 0 (43,123)
8,242 1,657
Inventories
138 681 819 Short term debtors
43,895 4,911 (2,886) 45,920
Cash and cash equivalents in hand
44,435 1,734 46,169 Short term creditors
81,784 5,332 (2,886) 84,230
Other long term liabilities
690,081 12,916 702,997 Usable reserves
165,961 5,505 171,466
Unusable reserves
(7,846) (14,407) (22,253) Cash flow from investing activities (21,079) (21,896) (42,975)
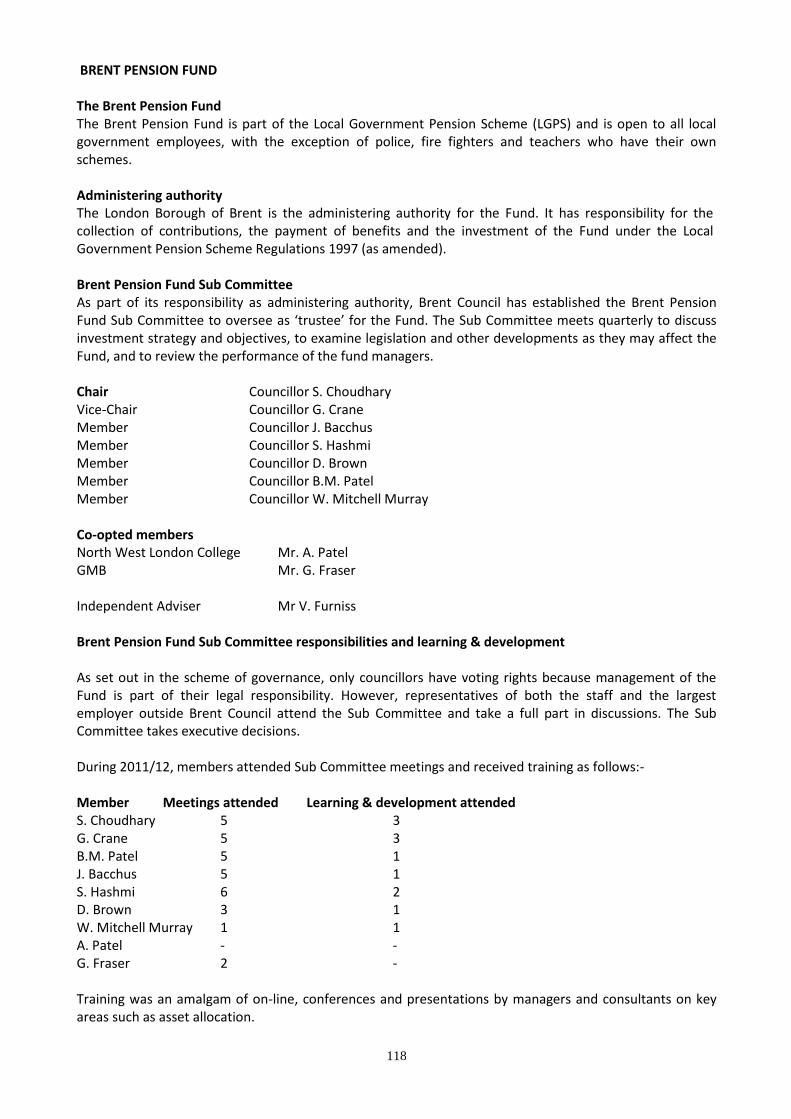
118
BRENT PENSION FUND The Brent Pension Fund The Brent Pension Fund is part of the Local Government Pension Scheme (LGPS) and is open to all local government employees, with the exception of police, fire fighters and teachers who have their own schemes. Administering authority The London Borough of Brent is the administering authority for the Fund. It has responsibility for the collection of contributions, the payment of benefits and the investment of the Fund under the Local Government Pension Scheme Regulations 1997 (as amended). Brent Pension Fund Sub Committee As part of its responsibility as administering authority, Brent Council has established the Brent Pension Fund Sub Committee to oversee as ‘trustee’ for the Fund. The Sub Committee meets quarterly to discuss investment strategy and objectives, to examine legislation and other developments as they may affect the Fund, and to review the performance of the fund managers. Chair Councillor S. Choudhary Vice-Chair Councillor G. Crane Member Councillor J. Bacchus Member Councillor S. Hashmi Member Councillor D. Brown Member Councillor B.M. Patel Member Councillor W. Mitchell Murray Co-opted members North West London College Mr. A. Patel GMB Mr. G. Fraser Independent Adviser Mr V. Furniss Brent Pension Fund Sub Committee responsibilities and learning & development As set out in the scheme of governance, only councillors have voting rights because management of the Fund is part of their legal responsibility. However, representatives of both the staff and the largest employer outside Brent Council attend the Sub Committee and take a full part in discussions. The Sub Committee takes executive decisions. During 2011/12, members attended Sub Committee meetings and received training as follows:- Member Meetings attended Learning & development attended S. Choudhary 5 3 G. Crane 5 3 B.M. Patel 5 1 J. Bacchus 5 1 S. Hashmi 6 2 D. Brown 3 1 W. Mitchell Murray 1 1 A. Patel - - G. Fraser 2 - Training was an amalgam of on-line, conferences and presentations by managers and consultants on key areas such as asset allocation.
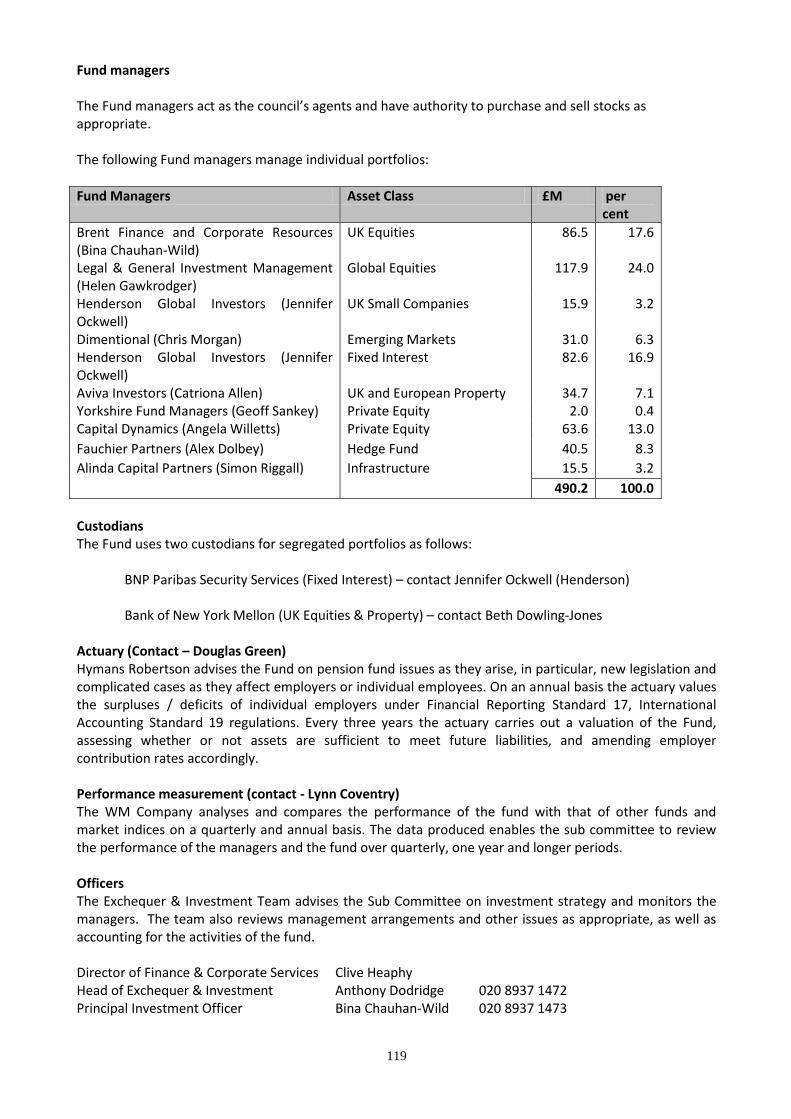
119
Fund managers The Fund managers act as the council’s agents and have authority to purchase and sell stocks as appropriate. The following Fund managers manage individual portfolios:
Fund Managers Asset Class £M per cent
Brent Finance and Corporate Resources (Bina Chauhan-Wild)
UK Equities 86.5 17.6
Legal & General Investment Management (Helen Gawkrodger)
Global Equities 117.9 24.0
Henderson Global Investors (Jennifer Ockwell)
UK Small Companies 15.9 3.2
Dimentional (Chris Morgan) Emerging Markets 31.0 6.3 Henderson Global Investors (Jennifer Ockwell)
Fixed Interest 82.6 16.9
Aviva Investors (Catriona Allen) UK and European Property 34.7 7.1 Yorkshire Fund Managers (Geoff Sankey) Private Equity 2.0 0.4 Capital Dynamics (Angela Willetts) Private Equity 63.6 13.0
Fauchier Partners (Alex Dolbey) Hedge Fund 40.5 8.3
Alinda Capital Partners (Simon Riggall) Infrastructure 15.5 3.2
490.2 100.0
Custodians The Fund uses two custodians for segregated portfolios as follows:
BNP Paribas Security Services (Fixed Interest) – contact Jennifer Ockwell (Henderson) Bank of New York Mellon (UK Equities & Property) – contact Beth Dowling-Jones
Actuary (Contact – Douglas Green) Hymans Robertson advises the Fund on pension fund issues as they arise, in particular, new legislation and complicated cases as they affect employers or individual employees. On an annual basis the actuary values the surpluses / deficits of individual employers under Financial Reporting Standard 17, International Accounting Standard 19 regulations. Every three years the actuary carries out a valuation of the Fund, assessing whether or not assets are sufficient to meet future liabilities, and amending employer contribution rates accordingly.
Performance measurement (contact - Lynn Coventry) The WM Company analyses and compares the performance of the fund with that of other funds and market indices on a quarterly and annual basis. The data produced enables the sub committee to review the performance of the managers and the fund over quarterly, one year and longer periods. Officers The Exchequer & Investment Team advises the Sub Committee on investment strategy and monitors the managers. The team also reviews management arrangements and other issues as appropriate, as well as accounting for the activities of the fund. Director of Finance & Corporate Services Clive Heaphy Head of Exchequer & Investment Anthony Dodridge 020 8937 1472 Principal Investment Officer Bina Chauhan-Wild 020 8937 1473
120
The Pensions and Payroll Team monitors and manages the pension’s contractors. The team is a contact point for employees who wish to join the scheme, for advice on procedures and for queries and complaints. Pensions Manager Andrew Gray 020 8937 3157 Principal Pensions Consultant Anna McCormack 0208 937 3936
Pensions contractors Capita Hartshead provides benefits administration – pension scheme membership records, advice, calculations and estimates. LOGICA is responsible for the actual payment of pensions and gratuities. Advice and benefit calculations Capita Hartshead Danny Snow 01737 366018 Payment of pensions LOGICA The Registrar of Occupational P O Box INN, Newcastle-Upon-Tyne Pension Schemes NE99 INN AVC Provider Clerical Medical is the AVC scheme provider – contact Simon Wildgoose. Legal Adviser The London Borough of Brent Solicitor is Fiona Ledden Banker The banker for the London Borough of Brent is National Westminster, Wembley Park Branch. Auditor The Fund is audited by the Audit Commission.

121
Actuarial valuation
London Borough of Brent
Statement of the Actuary for the year ended 31 March 2012
INTRODUCTION
The Scheme Regulations require that a full actuarial valuation is carried out every third year. The purpose of this is to establish that the London Borough of Brent Pension Fund (the Fund) is able to meet its liabilities to past and present contributors and to review employer contribution rates. The last full actuarial investigation into the financial position of the Fund was completed as at 31 March 2010 by Aon Hewitt Limited, in accordance with Regulation 36 of the Local Government Pension Scheme (Administration) Regulations 2008.
ACTUARIAL POSITION
1. Rates of contributions paid by the participating Employers during 2011/12 were based on the
actuarial valuation carried out as at 31 March 2010.
2. The valuation as at 31 March 2010 showed that the funding ratio of the Fund had decreased since the previous valuation with the market value of the Fund’s assets at that date (of £457.4M) covering 61% of the liabilities allowing, in the case of current contributors to the Fund, for future increases in pensionable remuneration.
3. The valuation also showed that the required level of contributions to be paid to the Fund by participating Employers (in aggregate) with effect from 1 April 2011 was as set out below:
13.4% of pensionable pay to meet the liabilities arising in respect of service after the valuation date.
Plus
Monetary amounts to restore the assets to 100% of the liabilities in respect of service prior to the valuation date over a recovery period of 25 years from 1 April 2011, amounting to £15.9M in 2011/12, and increasing by 5.3% p.a. thereafter, before any phasing in or 'stepping' of contribution increases.
This would imply an average employer contribution rate of about 24.6% of pensionable pay in total, if the membership remains broadly stable and pay increases are in line with the rate assumed at the valuation of 5.3% p.a.
4. The majority of Employers participating in the Fund pay different rates of contributions depending on their past experience, their current staff profile, and the recovery period agreed with the Administering Authority. In addition the Administering Authority agreed that the significant increases in contribution requirements could be phased in for some employers over periods of up to 6 years. The resulting aggregate deficiency contributions in 2011/12 are £11.9M. The aggregate deficiency contributions payable are anticipated to remain lower than indicated by point 3 above until 2015/16.
5. The rates of contributions payable by each participating Employer over the period 1 April 2011 to 31 March 2014 are set out in a certificate dated 30 March 2011 which is appended to our report of the same date on the actuarial valuation.
6. The contribution rates were calculated taking account of the Fund’s funding strategy as described in the Funding Strategy Statement, and for the majority of Employers using the projected unit actuarial method.
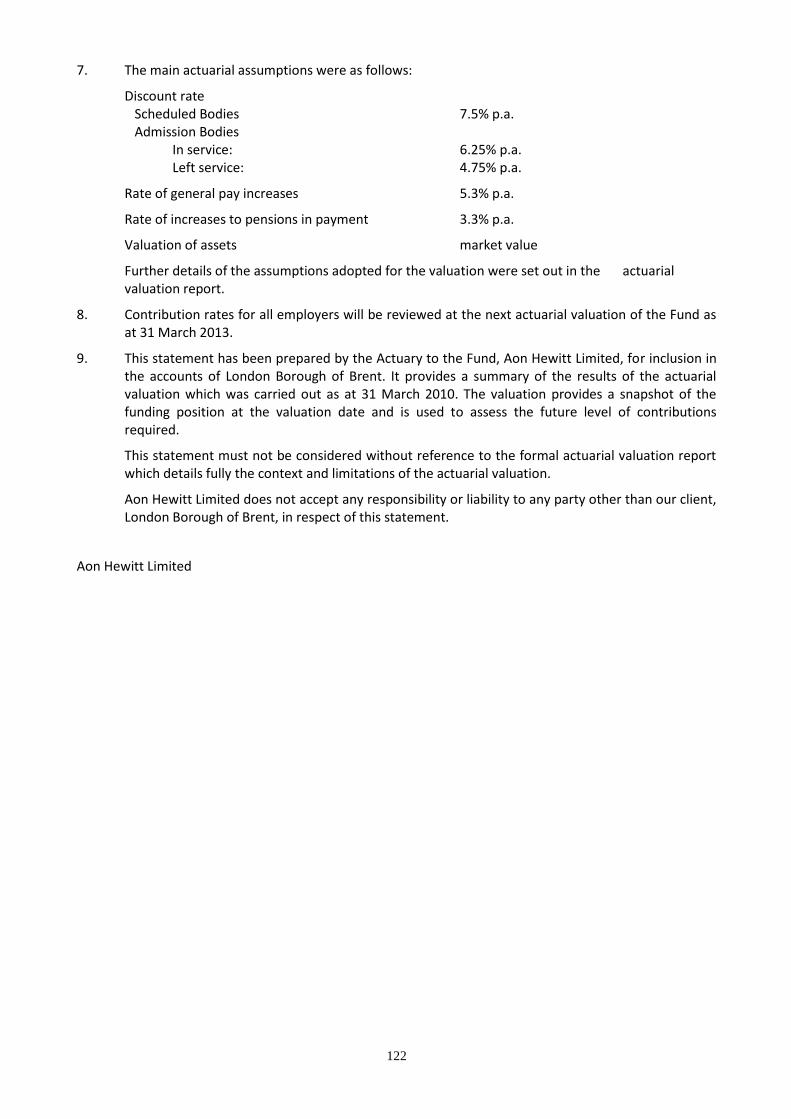
122
7. The main actuarial assumptions were as follows:
Discount rate Scheduled Bodies 7.5% p.a. Admission Bodies In service: 6.25% p.a. Left service: 4.75% p.a.
Rate of general pay increases 5.3% p.a.
Rate of increases to pensions in payment 3.3% p.a.
Valuation of assets market value
Further details of the assumptions adopted for the valuation were set out in the actuarial valuation report.
8. Contribution rates for all employers will be reviewed at the next actuarial valuation of the Fund as at 31 March 2013.
9. This statement has been prepared by the Actuary to the Fund, Aon Hewitt Limited, for inclusion in the accounts of London Borough of Brent. It provides a summary of the results of the actuarial valuation which was carried out as at 31 March 2010. The valuation provides a snapshot of the funding position at the valuation date and is used to assess the future level of contributions required.
This statement must not be considered without reference to the formal actuarial valuation report which details fully the context and limitations of the actuarial valuation.
Aon Hewitt Limited does not accept any responsibility or liability to any party other than our client, London Borough of Brent, in respect of this statement.
Aon Hewitt Limited
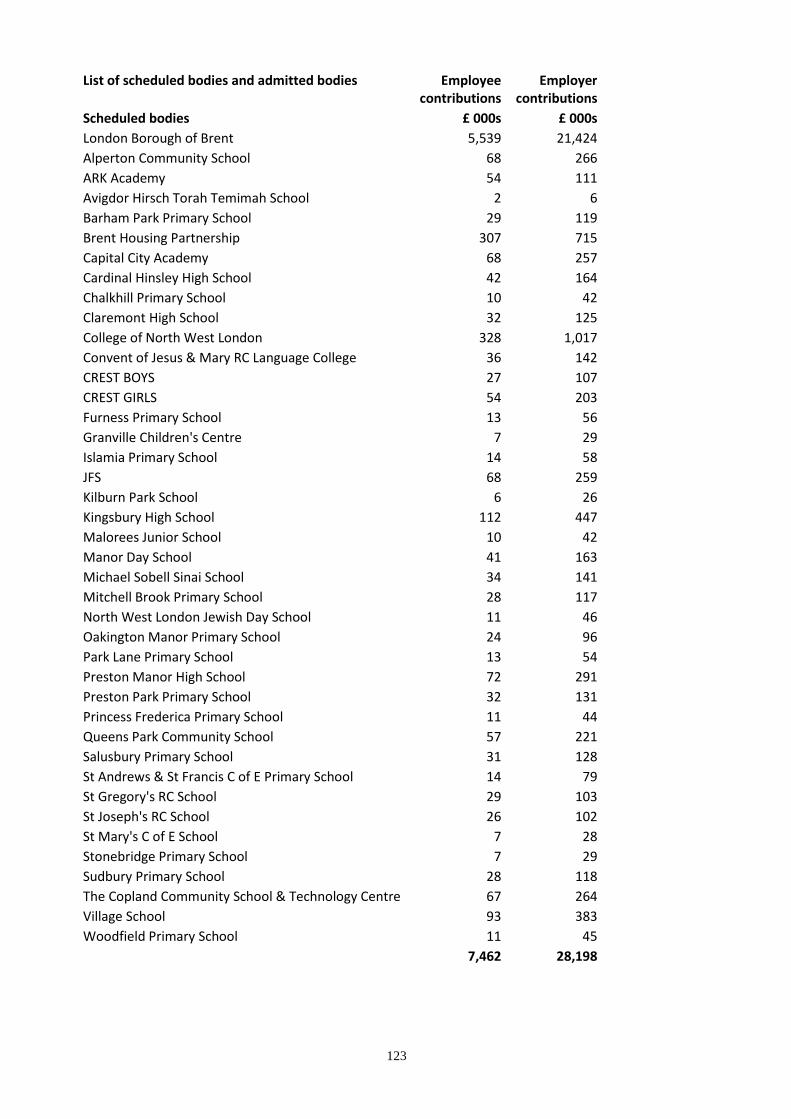
123
List of scheduled bodies and admitted bodies
Employee contributions
Employer contributions
Scheduled bodies £ 000s £ 000s
London Borough of Brent 5,539 21,424
Alperton Community School 68 266
ARK Academy 54 111
Avigdor Hirsch Torah Temimah School 2 6
Barham Park Primary School 29 119
Brent Housing Partnership 307 715
Capital City Academy 68 257
Cardinal Hinsley High School 42 164
Chalkhill Primary School 10 42
Claremont High School 32 125
College of North West London 328 1,017
Convent of Jesus & Mary RC Language College 36 142
CREST BOYS 27 107
CREST GIRLS 54 203
Furness Primary School 13 56
Granville Children's Centre 7 29
Islamia Primary School 14 58
JFS 68 259
Kilburn Park School 6 26
Kingsbury High School 112 447
Malorees Junior School 10 42
Manor Day School 41 163
Michael Sobell Sinai School 34 141
Mitchell Brook Primary School 28 117
North West London Jewish Day School 11 46
Oakington Manor Primary School 24 96
Park Lane Primary School 13 54
Preston Manor High School 72 291
Preston Park Primary School 32 131
Princess Frederica Primary School 11 44
Queens Park Community School 57 221
Salusbury Primary School 31 128
St Andrews & St Francis C of E Primary School 14 79
St Gregory's RC School 29 103
St Joseph's RC School 26 102
St Mary's C of E School 7 28
Stonebridge Primary School 7 29
Sudbury Primary School 28 118
The Copland Community School & Technology Centre 67 264
Village School 93 383
Woodfield Primary School 11 45
7,462 28,198

124
Admitted bodies: contributing
Age Concern 0 0
Brent Association of Disabled People 1 4 Brent Society for Mentally Handicapped Children (Mencap) 5 17
Capita 11 31
Churchill contracts Ltd 1 3
Goldsborough Homecare and Nursing Services Ltd 2 9
Local Employment Access Project 19 59
National Autistic Society 111 454
Sudbury Neighbourhood Centre 10 40
Wetton Cleansing Grounds Maintenance 8 58
Wetton Maintenance Services 5 20
Willow 3 13
176 708
ADMITTED BODIES: NON-CONTRIBUTING Brent Asian Professional Association Brent Black Mental Health Project Brent Community Relations Council Brent Community Transport Brent Energy Services Team Brent Family Service Unit Brent Irish Advisory Service Brent Kids Scrap Bank Brent Mind Brent Under Twenties First Aid Housing Brent Voluntary Service Council Chalkhill Asian Forum Harlesden Young Mums Project
- Family Outreach Project Harlesden Methodist Church - Harlesden Day nursery Hillside Under Fives Centre Kilburn Training Park Lane Methodist Day Nursery Pakistan Workers Association Welcome Senior Citizens Club West Indian Self Effort

125
Pension Fund – GENERAL INFORMATION Fund income The fund receives income from the following sources:
employees, at varying rates dependant on salary levels or date of joining the scheme
employers, at varying rates according to their status
investment income – dividends or interest
capital gains on investments and
transfer values from other funds Table A: Employer Contribution Rates
2010/11 per cent
2011/12 per cent
2012/13
per cent
2013/14
per cent
Brent 22.9 25.1 26.9 27.4
Table B: Fund membership and contributions 2007/08 to 2011/12
2007/08 2008/09 2009/10 2010/11 2011/12
Number of contributing employees as at 1 April
5,922
6,075
5,896
5,461
5,198
Deferred 5,380 5,713 6,096 6,595 6,891
Pensioners and dependants 5,161 5,269 5,438 5,711 5,934
£M £M £M £M £M
Employee contributions 7.4 8.5 8.8 8.3 7.8
Employer contributions 28.4 28.1 29.8 31.2 33.8
Total contributions 35.8 36.6 38.6 39.5 41.6
Table C: The total administrative cost of the fund
EXPENDITURE 2010/11 2011/12
£'000 per cent £'000 per cent
Administration and processing 1,099 40.3 944 26.1
Actuarial fees 115 4.2 69 1.9
Administration, management and custody fees
1,496 54.8 2,579 71.4
Performance measurement fees 19 0.7 20 0.6
Total Administration Costs 2,729 100.0 3,612 100
Table D: Value of the fund as at 31st March
YEARS 2008 2009 2010 2011 2012 £’000 £’000 £’000 £’000 £’000
VALUE 472,040 339,573 454,815 490,359 493,897

126
Risk management Commentary on the management of investment risk is contained within the Statement of Investment Principles, and the asset allocation for the Fund is included in table E. The risk profile of the Fund has not changed dramatically – exposure to private equity (from 10.1% of the Fund to 12.5%) and infrastructure (from 1.7% to 3.4%) have increased in line with investment plans. The asset allocation has also been amended to reflect the termination of the Global Tactical Asset Allocation mandate and the reduction in exposure to fixed interest assets. The main investment risks are:-
a) Not meeting liabilities and severe market volatility. These are mitigated by regular review of performance and asset allocation, diversification between managers and asset classes, and `taking advice from consultants, the investment adviser and managers. For example, the fund uses the core portfolio in the fixed interest fund for stability and income. Equity managers are used to utilise the equity risk premium, but some are active managers (where markets are less efficient) whereas others are index trackers that are less expensive. Other approaches used include the illiquidity premium (infrastructure and private equity) and absolute return investing (hedge funds and the satellite portfolio in fixed interest). It is also very helpful that the Fund has a surplus of income (contributions and dividends) over expenditure (payment of benefits).
b) Operational risks. In particular, the systems used by and financial health of, managers, custodians and contractors (LPFA) are assessed at appointment and on an ongoing basis by reference to annual reports, assurance reports (such as AAF 01/06 and SAS 70) and other research. Managers report their use of professional and accounting standards to make valuations. If concerns arise, these are investigated and reported to members so that issues are resolved. Managers, custodians and contractors issue reports on a regular basis, allowing opportunity for checking. Wide investment diversification also provides protection – for example, the hedge fund manager invests in around 30 underlying funds, whereas each private equity fund usually has around 15 sub managers.
c) Liquidity risks, where the Fund has insufficient liquid assets to meet benefit payments. This is met by keeping most assets either very liquid, as in cash and bonds, or semi liquid through large company equities. The Fund uses a long term cash flow (reviewed every three years) to assess the security of investment horizons and the likelihood of sudden cash calls.
d) Foreign exchange risks. These are met by holding many assets in sterling and holding a diversified portfolio across a number of currencies.
e) Credit risks. The Fund only appoints properly regulated managers, and only deals on authorised markets. Pooled funds have systems in place to protect the pooled fund from default by counterparties.
f) Finally, the status of employer bodies may also give rise to concerns, particularly with regard to admitted bodies whose financial status may be less secure. Where possible, bonds are obtained on admission and renewed as appropriate.
The quantitative risks may be assesses as follows:-
Credit There is a counter-party risk, but it is suggested that this is negligible. The main risk is
that employers may collapse, particularly as some are contractors. The risk is
mitigated by the existence of bonds. The risk is assessed as 10% of admitted body
contributions - £180,000.

127
Liquidity This is assessed as nil because the Fund is able to borrow short term and has a regular flow
of income from dividends and employers which exceed benefit payments. There are
contractual payments to private equity and infrastructure managers over the next five
years or so (up to £91.3m), but these will be met from contributions and dividends, and the
return of capital from private equity investments. Derivative payments from Henderson
Global Investors (£2m) are covered by cash reserves.
Currency All liabilities are payable in sterling, but some assets are held in overseas currencies – in
particular private equity, overseas equities, some bonds, European property and
infrastructure. Although the fixed interest has currency hedges in place, the other
managers do not hedge on the grounds that a) currencies do not tend to change much in
value over the long term and b) sterling has tended to decline in value, thus making
overseas assets more attractive.
Market Market risks, either positive or negative, are the largest risks faced by the Fund, and arise
from fluctuations in market conditions and sentiment. It is suggested that equity exposure
is most volatile – corrections of 10% over a short period are quite regular. Private equity
and infrastructure also have equity elements, but are also affected by profits and, in the
case of infrastructure, tariff contracts. If it is assumed that the potential variation may be
two standard deviations, the changes (as illustrated in the CIPFA publication on Local
Government Pension Scheme accounts – Example Accounts and Disclosure Checklist) may
be:-
Equities 25.8% of exposure +/- £m
Property 16% +/- £m
Private equity 27.6% +/- £m
Infrastructure 21.8% +/- £m
Hedge funds 12% (worst year) +/- £m
GTAA 25.8% (as equities) +/- £m
However, note that in extreme corrections (such as 1987), equity markets can fall by 33% in
a short time.
Financial performance The Fund does not construct a budget because most of the expenditure and income items cannot be controlled in this way. However, a budget is agreed for certain pensioner payroll, IT and committee support items at the beginning of each year. These budgets are adhered to strictly unless the Fund agrees to extra work items. Following increases in employer contributions, it is anticipated that the Fund will have a positive cash flow (excluding dividend and interest receipts) in future years to reduce the Fund deficit. However, reductions in employee numbers will reduce the current surplus of contributions over benefit expenditure, as may changes to the LGPS that increase employee contributions to the Fund.
128
Investments Administration of the Fund The fund managers invest in markets in accordance with their management agreements and investment regulations and the Statement of Investment Principles.
The WM Company, market leader in performance measurement and investment administration services, has measured the performance of the Fund over the year in accordance with the performance benchmarks set for the investment managers. This has been based on the asset allocation agreed for the Fund.
Sales and purchases Sales proceeds totalled £196.1 million (£279.1 million 2010/11) and the purchases totalled £213.6 million (£296.1 million 2010/11) during 2011/12. Administration Pension administration is carried out by Capita Hartshead which currently has the equivalent of five staff employed on the Brent contract.
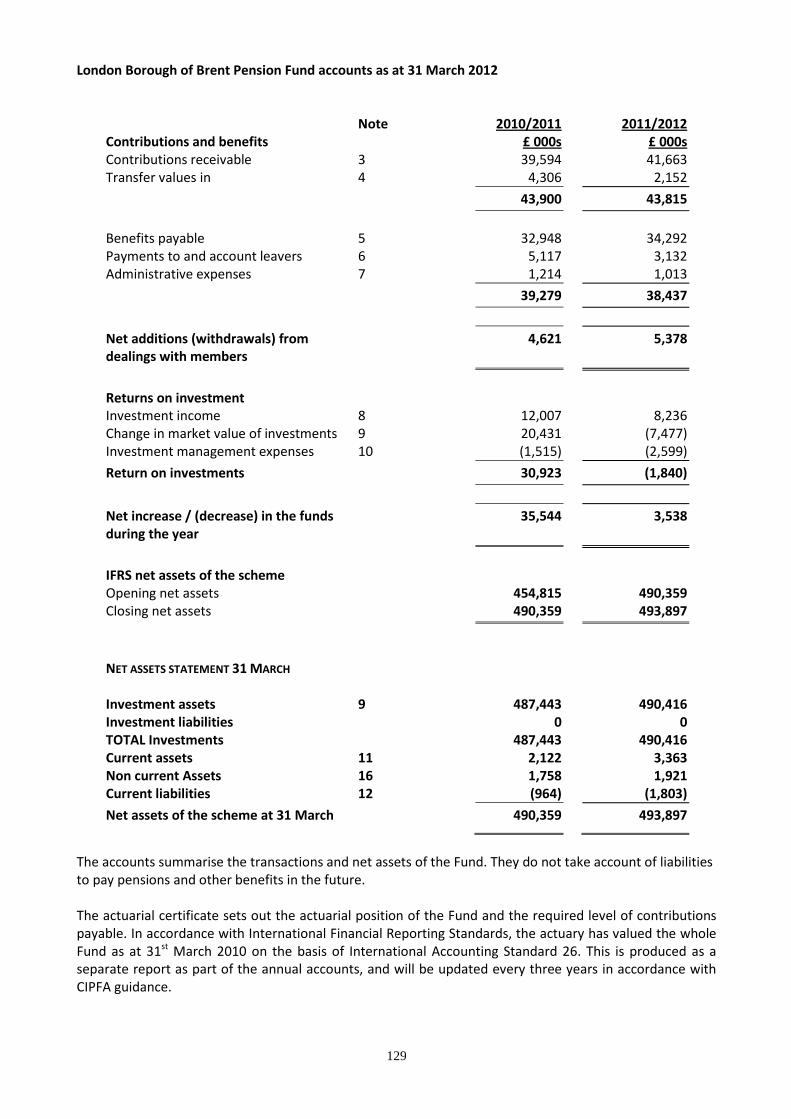
129
London Borough of Brent Pension Fund accounts as at 31 March 2012
Note
2010/2011
2011/2012
Contributions and benefits £ 000s £ 000s Contributions receivable 3 39,594 41,663 Transfer values in 4 4,306 2,152
43,900 43,815
Benefits payable 5 32,948 34,292 Payments to and account leavers 6 5,117 3,132 Administrative expenses 7 1,214 1,013
39,279 38,437
Net additions (withdrawals) from dealings with members
4,621 5,378
Returns on investment Investment income 8 12,007 8,236 Change in market value of investments 9 20,431 (7,477) Investment management expenses 10 (1,515) (2,599)
Return on investments 30,923 (1,840)
Net increase / (decrease) in the funds during the year
35,544 3,538
IFRS net assets of the scheme Opening net assets 454,815 490,359 Closing net assets 490,359 493,897
NET ASSETS STATEMENT 31 MARCH
Investment assets Investment liabilities TOTAL Investments
9 487,443 0
487,443
490,416 0
490,416 Current assets 11 2,122 3,363 Non current Assets 16 1,758 1,921 Current liabilities 12 (964) (1,803)
Net assets of the scheme at 31 March 490,359 493,897
The accounts summarise the transactions and net assets of the Fund. They do not take account of liabilities to pay pensions and other benefits in the future. The actuarial certificate sets out the actuarial position of the Fund and the required level of contributions payable. In accordance with International Financial Reporting Standards, the actuary has valued the whole Fund as at 31st March 2010 on the basis of International Accounting Standard 26. This is produced as a separate report as part of the annual accounts, and will be updated every three years in accordance with CIPFA guidance.
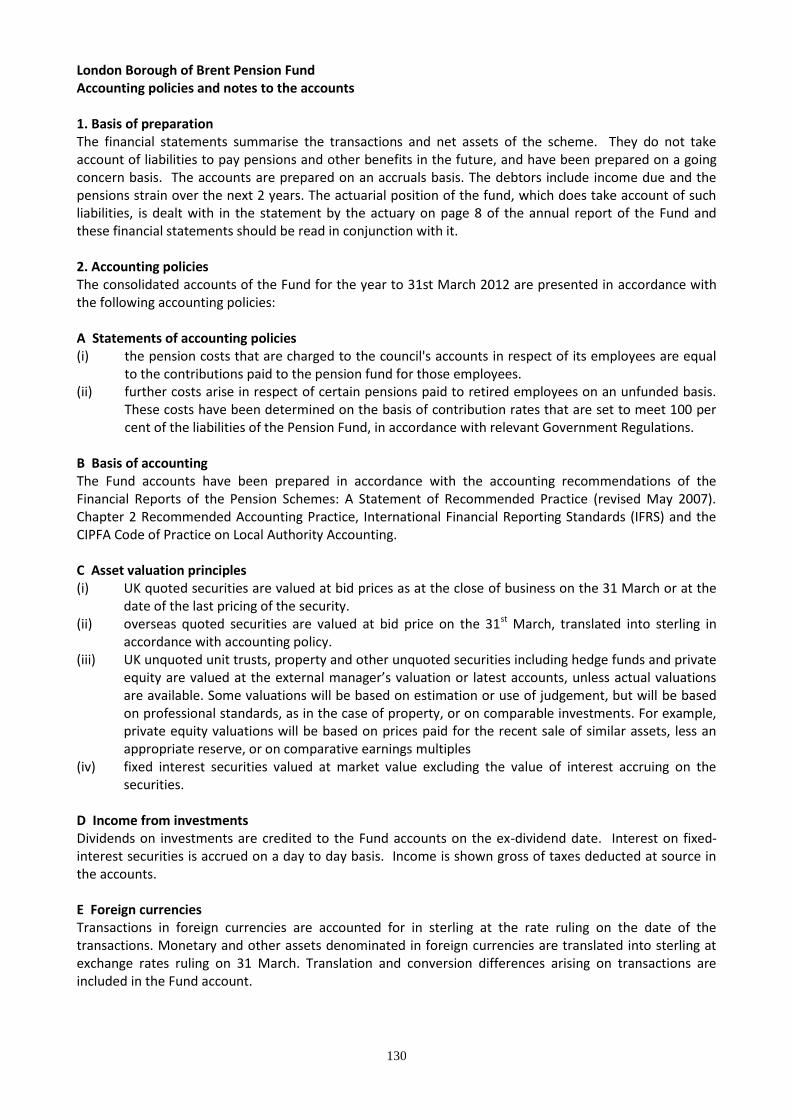
130
London Borough of Brent Pension Fund Accounting policies and notes to the accounts 1. Basis of preparation The financial statements summarise the transactions and net assets of the scheme. They do not take account of liabilities to pay pensions and other benefits in the future, and have been prepared on a going concern basis. The accounts are prepared on an accruals basis. The debtors include income due and the pensions strain over the next 2 years. The actuarial position of the fund, which does take account of such liabilities, is dealt with in the statement by the actuary on page 8 of the annual report of the Fund and these financial statements should be read in conjunction with it. 2. Accounting policies The consolidated accounts of the Fund for the year to 31st March 2012 are presented in accordance with the following accounting policies: A Statements of accounting policies (i) the pension costs that are charged to the council's accounts in respect of its employees are equal
to the contributions paid to the pension fund for those employees. (ii) further costs arise in respect of certain pensions paid to retired employees on an unfunded basis.
These costs have been determined on the basis of contribution rates that are set to meet 100 per cent of the liabilities of the Pension Fund, in accordance with relevant Government Regulations.
B Basis of accounting The Fund accounts have been prepared in accordance with the accounting recommendations of the Financial Reports of the Pension Schemes: A Statement of Recommended Practice (revised May 2007). Chapter 2 Recommended Accounting Practice, International Financial Reporting Standards (IFRS) and the CIPFA Code of Practice on Local Authority Accounting. C Asset valuation principles (i) UK quoted securities are valued at bid prices as at the close of business on the 31 March or at the
date of the last pricing of the security. (ii) overseas quoted securities are valued at bid price on the 31st March, translated into sterling in
accordance with accounting policy. (iii) UK unquoted unit trusts, property and other unquoted securities including hedge funds and private
equity are valued at the external manager’s valuation or latest accounts, unless actual valuations are available. Some valuations will be based on estimation or use of judgement, but will be based on professional standards, as in the case of property, or on comparable investments. For example, private equity valuations will be based on prices paid for the recent sale of similar assets, less an appropriate reserve, or on comparative earnings multiples
(iv) fixed interest securities valued at market value excluding the value of interest accruing on the securities.
D Income from investments Dividends on investments are credited to the Fund accounts on the ex-dividend date. Interest on fixed-interest securities is accrued on a day to day basis. Income is shown gross of taxes deducted at source in the accounts. E Foreign currencies Transactions in foreign currencies are accounted for in sterling at the rate ruling on the date of the transactions. Monetary and other assets denominated in foreign currencies are translated into sterling at exchange rates ruling on 31 March. Translation and conversion differences arising on transactions are included in the Fund account.

131
F Transfer values to and from the fund The Fund account has been prepared on cash basis. Transfer values paid to or paid out from the Fund during the year have been included. G Ex-gratia payments No ex-gratia payments were met from the Fund in 2011/2012. H Taxation (i) Investments The Fund is exempt from United Kingdom Capital Gains Tax. Income from overseas sources suffers a withholding tax in the country of origin, unless exemption is permitted as in the United States and Australia. A proportion of the tax deducted in some European countries is recovered. The amounts recovered will vary from the amounts paid due to exchange rate fluctuations. All VAT paid is recoverable. ii) Compounded pensions There is a liability to income tax on these items, which are small pensions converted into lump sums. The rate of tax is 20 per cent and the liability is minimal. I Employers’ contributions In 2011/2012 employers’ contributions of £33.9 million were paid (2010/11 £ 31.2 million). The increased contributions will support the elimination of the funding deficit over a 25 year period. J Statement of investment principles The Pension Fund Sub-committee agreed a revised Statement of Investment Principle in 2012 and will publish this both to the employers and on the Finance website. (www.brent.gov.uk/pensions) K Related party’s transactions As administering authority for the Brent Pension Fund, the London Borough of Brent is a related party to the Fund. The authority provides administrative support, elected member leadership to the Fund, and manages the UK equity portfolio in house. Other related parties would include other pension fund employers (page 8), pension fund managers and advisor’s (page 4), and senior officers and their families (page 4). - Key management personnel are the same for the pension fund as for the Council as a whole; - The 2011/2012 remuneration for Council key management personnel are presented in full in the Council accounts (this is Note 36); - It is not possible to apportion this remuneration precisely between the Council and the pension fund accounts, as the exact amount of time spent by these individuals on the pension fund is not exactly defined or measured. Hence, their remuneration is shown in full in the Council accounts, and not at all in the pension fund accounts. L Liquidity of Investments Private equity and Infrastructure investments are illiquid because the funds are established for twelve years, which may be extended. The commitments are agreed at the commencement of the Fund and cannot be changed without agreement with the General Partner. M The administrative authority’s responsibilities The authority is required to:
make arrangements for the proper administration of its financial affairs and to secure that one of their officers has the responsibility for the administration of those affairs. In this authority, that officer is the Director of Finance and Corporate Services.
manage business to secure economic, efficient and effective use of resources and safeguard assets.

132
N Responsibilities of the Deputy Director of Finance and Corporate Services The Director is responsible for the preparation of the authority's pension fund's Statement of Accounts, in terms of the Code and the Statement of Recommended Practice. The director is required to present fairly the financial position of the Fund (and its income and expenditure) for the year ended 31st March 2012. In preparing this statement of accounts, the director has: selected suitable accounting policies and applied them consistently; made judgements and estimates that were reasonable and prudent; complied with the Code; kept proper up to date accounting records; and taken reasonable steps for the prevention of fraud and other irregularities. Mick Bowden Deputy Director of Finance and Corporate Services

133
3 Contributions receivable Employees contributed £7.7 million in 2011/2012. The numbers of contributing members increased during the year. 2010/11
£000s 2010/11
£000s 2011/12
£000s 2011/12
£000s 2010/11
£000s 2011/12
£000s Employers ongoing deficit ongoing deficit
Brent 17,383 9,514 16,274 14,208 26,897 30,482 Scheduled 2,176 465 1,824 817 2,641 2,641 Admitted 1,091 633 389 371 1,724 760 Members Brent 6,892 6,593 Scheduled 904 869 Admitted 316 176
Additional contributions 220 142
20,650 10,612 18,487 15,396 39,594 41,663
4 Transfers in 2010/11
£000s 2011/12
£000s
Individual Transfers in from other schemes 4,306 2,152
5 Benefits payable On retirement or death
Pensions Brent 21,721 23,631 Scheduled 906 1,066 Admitted 795 945 Lump sum retirement benefits Brent 7,762 6,484 Scheduled 972 599 Admitted 296 722 Lump sum death benefits Brent 496 683 Scheduled 0 90 Admitted 0 72
32,948 34,292
6 Payments to and on account of leavers Refund to members leaving service (6) (3) Individual transfers to other schemes 5,123 3,135
5,117 3,132
7 Administration expenses Administration and processing
1,064
914
Actuarial fees 115 66
Audit fees 35 33
1,214 1,013
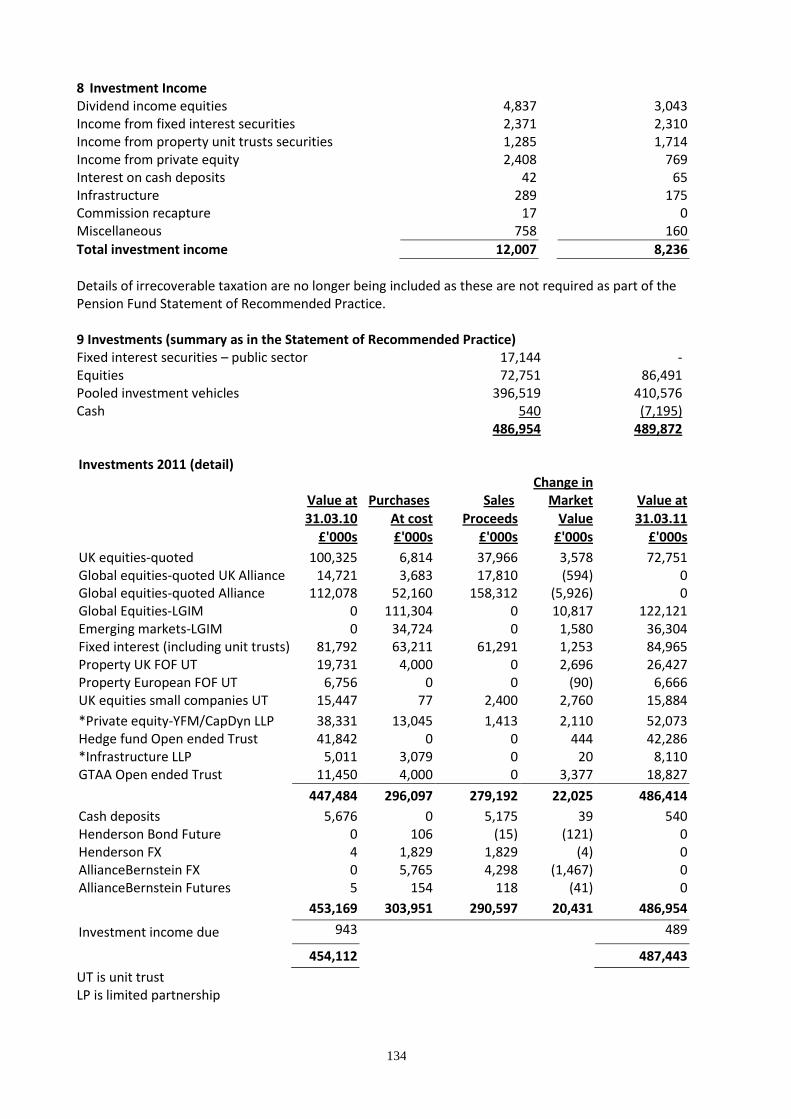
134
8 Investment Income Dividend income equities 4,837 3,043 Income from fixed interest securities 2,371 2,310 Income from property unit trusts securities 1,285 1,714 Income from private equity 2,408 769 Interest on cash deposits 42 65 Infrastructure 289 175 Commission recapture 17 0 Miscellaneous 758 160
Total investment income 12,007 8,236
Details of irrecoverable taxation are no longer being included as these are not required as part of the Pension Fund Statement of Recommended Practice. 9 Investments (summary as in the Statement of Recommended Practice) Fixed interest securities – public sector 17,144 - Equities 72,751 86,491 Pooled investment vehicles 396,519 410,576 Cash 540 (7,195) 486,954 489,872 Investments 2011 (detail)
Change in
Value at Purchases Sales Market Value at 31.03.10 At cost Proceeds Value 31.03.11 £'000s £'000s £'000s £'000s £'000s
UK equities-quoted 100,325 6,814 37,966 3,578 72,751 Global equities-quoted UK Alliance 14,721 3,683 17,810 (594) 0 Global equities-quoted Alliance 112,078 52,160 158,312 (5,926) 0 Global Equities-LGIM 0 111,304 0 10,817 122,121 Emerging markets-LGIM 0 34,724 0 1,580 36,304 Fixed interest (including unit trusts) 81,792 63,211 61,291 1,253 84,965 Property UK FOF UT 19,731 4,000 0 2,696 26,427 Property European FOF UT 6,756 0 0 (90) 6,666 UK equities small companies UT 15,447 77 2,400 2,760 15,884
*Private equity-YFM/CapDyn LLP 38,331 13,045 1,413 2,110 52,073 Hedge fund Open ended Trust 41,842 0 0 444 42,286 *Infrastructure LLP 5,011 3,079 0 20 8,110 GTAA Open ended Trust 11,450 4,000 0 3,377 18,827
447,484 296,097 279,192 22,025 486,414
Cash deposits 5,676 0 5,175 39 540 Henderson Bond Future 0 106 (15) (121) 0 Henderson FX 4 1,829 1,829 (4) 0 AllianceBernstein FX 0 5,765 4,298 (1,467) 0 AllianceBernstein Futures 5 154 118 (41) 0
453,169 303,951 290,597 20,431 486,954
Investment income due 943 489
454,112 487,443
UT is unit trust LP is limited partnership

135
The change in market value of investments during the year comprises all increases and decreases in the market value of investments held at any time during the year. *Private equity and Infrastructure Investments 2012 (detail)
Change in
Value at Purchases Sales Market Value at
31.03.11 At cost Proceeds Value 31.03.12 £'000s £'000s £'000s £'000s £'000s
UK equities-quoted 72,751 22,158 6,810 (1,608) 86,491 Global Equities-LGIM 122,121 0 3,115 (1,242) 117,764 Emerging markets-LGIM 36,304 0 35,907 (397) 0 Emerging markets-Dimentional 0 35,827 0 (4,784) 31,043 Fixed interest (including unit trusts) 84,965 128,760 126,961 3,063 89,827 Property UK FOF UT 26,427 1,200 0 818 28,445 Property European FOF UT 6,666 0 18 (354) 6,294 UK equities small companies UT 15,884 476 0 (380) 15,980
*Private equity-YFM/CapDyn LLP 52,073 17,283 4,969 1,170 65,263 Hedge fund Open ended Trust 42,286 0 0 (1,792) 40,494 *Infrastructure LLP 8,110 7,892 193 (343) 15,466 GTAA Open ended Trust 18,827 0 18,158 (669) 0
486,414 213,596 196,131 (6,518) 497,067 Cash deposits 540 7,203 (532) (7,195) Henderson Bond Future 0 213 80 (133) 0 Henderson FX 0 258 258 0 0
486,954 214,067 203,672 (7,183) 489,872
Investment income due 489 544
487,443 490,416
UT is unit trust LP is limited partnership The change in market value of investments during the year comprises all increases and decreases in the market value of investments held at any time during the year. *Private equity and Infrastructure

136
The Brent pension fund has made commitments as a limited partner to ten funds managed by Capital Dynamics, the Capital Fund for London and to the Alinda Infrastructure Fund. As at 31st March 2012, outstanding commitments totalled £89m.
Fixed interest securities 2010/11
£000s 2011/12
£000s Segregated UK public sector Pooled
17,144
-
UK corporate – open ended unit trust 23,957 - Overseas government open ended unit trust 8,257 - Secured loans open ended unit trust 4,613 - Credit opportunities open ended unit trust 9,201 9,805 Credit alpha open ended unit trust 12,516 - Currency fund open ended unit trust 646 - Absolute return fund open ended unit trust 0 66,093 Infrastructure Limited Partnership 920 1,141 Money market fund 7,711 12,788
84,965 89,827
Pooled investment vehicles (excluding fixed interest): 2010/11
£000s 2011/12
£000s Property - UK fund of funds unit trust 26,427 28,445 Property - European fund of funds unit trust 6,666 6,294 UK Equities – small companies unit trust Overseas equities – developed markets Overseas equities - emerging markets
15,884 122,121
36,304
15,980 117,764
31,043 Private equity limited partnerships 52,073 65,263 Hedge fund open ended trust 42,286 40,494 Infrastructure limited partnership 8,110 15,466 GTAA open ended trust 18,827 -
328,698 320,749
Type of derivative Expiration Economic exposure value
Fair Value
£000 Asset Liability
Henderson Euros 26 June 2012 (35) Euros 26 June 2012 35
Derivative receipts and payments represent the realised gains and losses on contracts. The various derivatives are / were held for the following purposes:-
a) Gilt futures. The manager purchases exposure to the value of gilts at a future date, paying a
margin that increases / reduces as the value of the future varies. Futures are used because the
market is liquid and costs are lower.
b) Currency exposure was obtained through futures, and had two main purposes. First, the
pooled currency fund managed by Henderson took views on currency movements, seeking to
make gains as currencies rose / fell. Second, the Fund sought to protect the value of
investments against adverse currency movements by fixing the sterling value in the future.

137
c) Global Tactical Asset Allocation (GTAA) sought to make gains through the relative movements
in currency, bonds and equities. Exposure was gained through a pooled fund managed by
Mellon.
AVC Investments Additional voluntary contributions are not included in the pension fund accounts in accordance with regulation 5(2)(c) of the Pension Scheme (Management and Investment of Funds) Regulations 1998. Individuals hold assets invested separately from the main fund in the form of with profits, equity related, or building society accounts, securing additional benefits on a money purchase basis for those members electing to pay additional voluntary contributions (AVCs). Members participating in this arrangement each receive an annual statement made up to 31st March confirming the value of their account and the movements in the year. The aggregate value of the AVC investments is as follows:- 2010/11 2011/12 £000s £000s Equitable Life 180 175 Clerical Medical 1,212 1,138
1,392 1,313
10 INVESTMENT MANAGEMENT EXPENSES 2010/11
£000s 2011/12
£000s Administration, management and custody fees 1,429 2,510 Performance measurement fees 19 20 Other advisory fees 67 69
1,515 2,599
INVESTMENT MANAGEMENT FEES INCLUDE FEES CHARGED
DIRECTLY TO THE FUND, BUT NOT FEES CHARGED WITHIN
POOLED FUNDS.
11. CURRENT ASSETS
Contributions due Employers 2,507 2,102 Employees 98 101 Additional voluntary contributions 1 2 Other miscellaneous debtors 1,274 1,157
3,880 3,363
12. CURRENT LIABILITIES Management / advisor’s fees (48) (1,642) Lump sums not paid 0 0 Accrued expenses (916) (161)
(964) (1,803)
13. Short-Term Debtors
Central government bodies 0 0 Other local authorities 0 0 NHS bodies 0 0 Public corporations and trading funds 0 0 Other entities and individuals 3,880 5,284
3,880 5,284
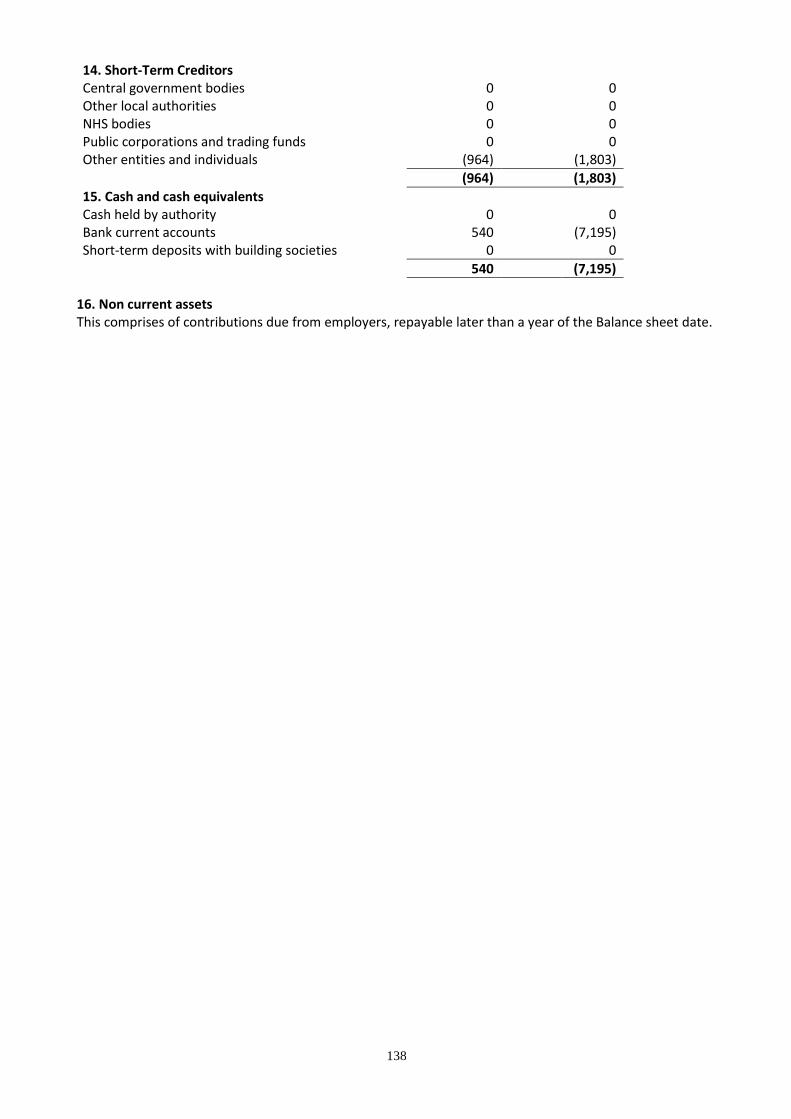
138
14. Short-Term Creditors Central government bodies 0 0
Other local authorities 0 0 NHS bodies 0 0 Public corporations and trading funds 0 0 Other entities and individuals (964) (1,803)
(964) (1,803)
15. Cash and cash equivalents Cash held by authority 0 0
Bank current accounts 540 (7,195) Short-term deposits with building societies 0 0
540 (7,195)
16. Non current assets This comprises of contributions due from employers, repayable later than a year of the Balance sheet date.
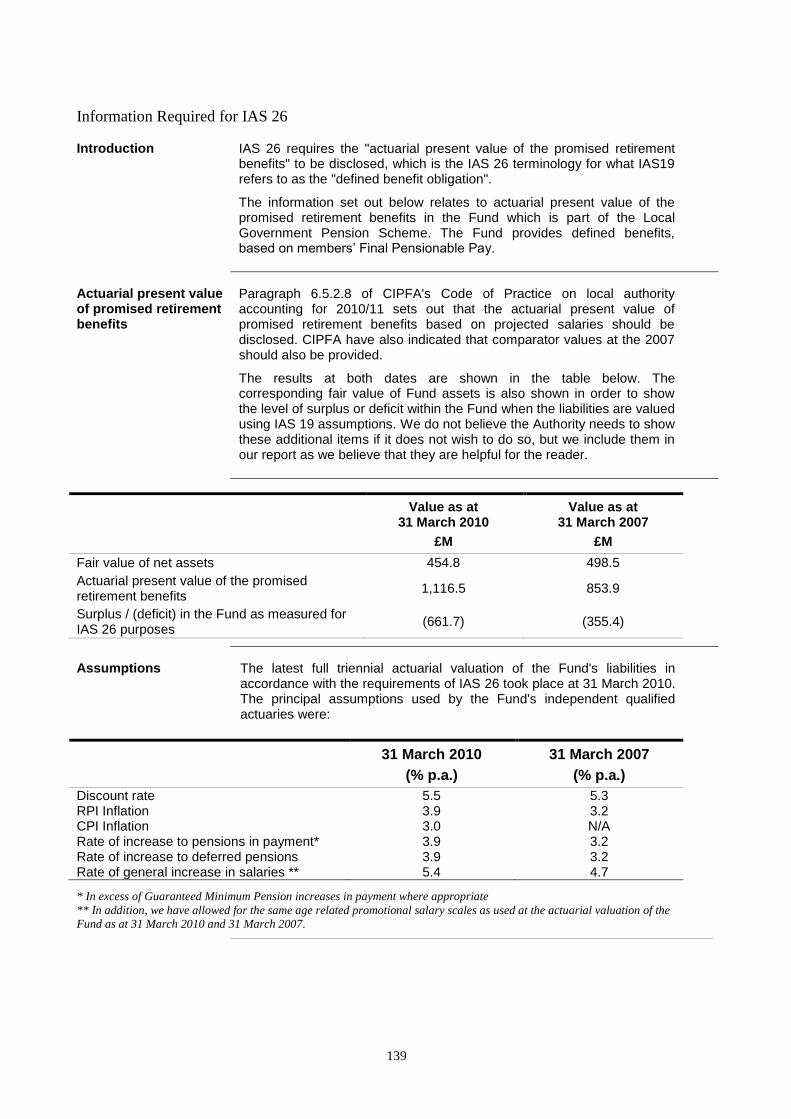
139
Information Required for IAS 26
Introduction IAS 26 requires the "actuarial present value of the promised retirement benefits" to be disclosed, which is the IAS 26 terminology for what IAS19 refers to as the "defined benefit obligation".
The information set out below relates to actuarial present value of the promised retirement benefits in the Fund which is part of the Local Government Pension Scheme. The Fund provides defined benefits, based on members’ Final Pensionable Pay.
Actuarial present value of promised retirement benefits
Paragraph 6.5.2.8 of CIPFA's Code of Practice on local authority accounting for 2010/11 sets out that the actuarial present value of promised retirement benefits based on projected salaries should be disclosed. CIPFA have also indicated that comparator values at the 2007 should also be provided.
The results at both dates are shown in the table below. The corresponding fair value of Fund assets is also shown in order to show the level of surplus or deficit within the Fund when the liabilities are valued using IAS 19 assumptions. We do not believe the Authority needs to show these additional items if it does not wish to do so, but we include them in our report as we believe that they are helpful for the reader.
Value as at 31 March 2010
£M
Value as at 31 March 2007
£M
Fair value of net assets 454.8 498.5
Actuarial present value of the promised retirement benefits
1,116.5 853.9
Surplus / (deficit) in the Fund as measured for IAS 26 purposes
(661.7) (355.4)
Assumptions The latest full triennial actuarial valuation of the Fund's liabilities in accordance with the requirements of IAS 26 took place at 31 March 2010. The principal assumptions used by the Fund's independent qualified actuaries were:
31 March 2010
(% p.a.)
31 March 2007
(% p.a.)
Discount rate 5.5 5.3 RPI Inflation 3.9 3.2 CPI Inflation 3.0 N/A Rate of increase to pensions in payment* 3.9 3.2 Rate of increase to deferred pensions 3.9 3.2 Rate of general increase in salaries ** 5.4 4.7
* In excess of Guaranteed Minimum Pension increases in payment where appropriate
** In addition, we have allowed for the same age related promotional salary scales as used at the actuarial valuation of the
Fund as at 31 March 2010 and 31 March 2007.
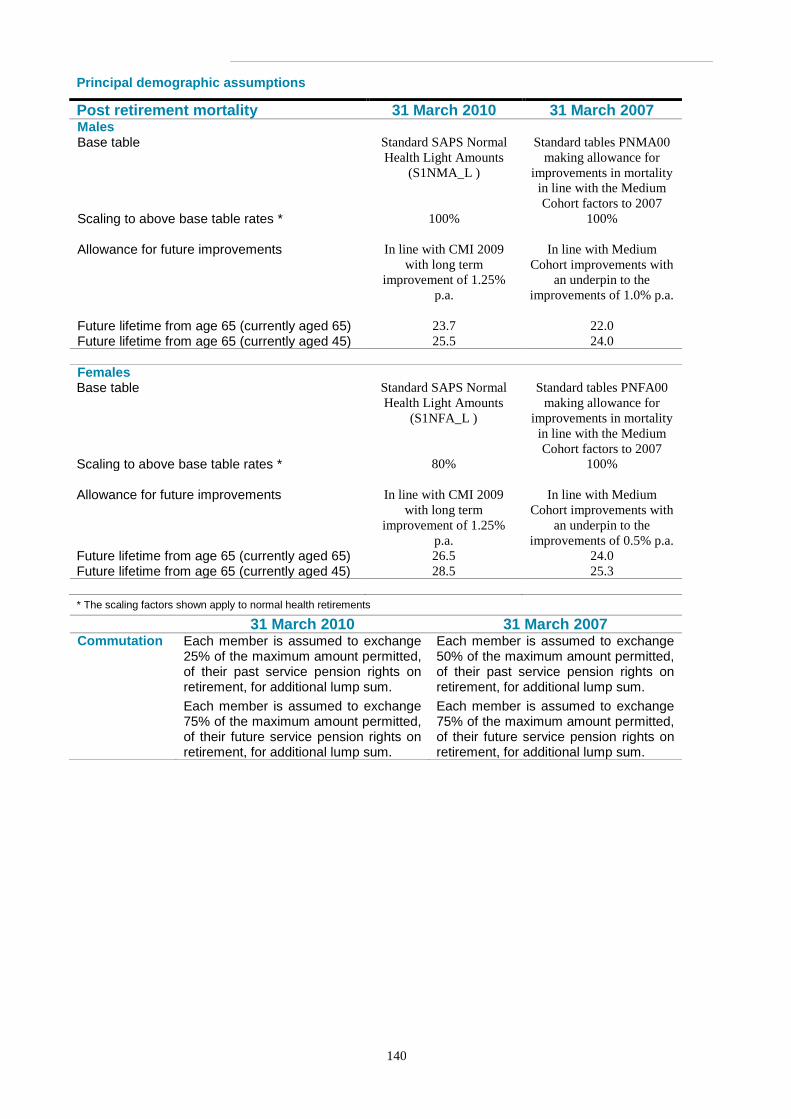
140
Principal demographic assumptions
Post retirement mortality 31 March 2010 31 March 2007 Males Base table Standard SAPS Normal
Health Light Amounts
(S1NMA_L )
Standard tables PNMA00
making allowance for
improvements in mortality
in line with the Medium
Cohort factors to 2007
Scaling to above base table rates * 100% 100%
Allowance for future improvements In line with CMI 2009
with long term
improvement of 1.25%
p.a.
In line with Medium
Cohort improvements with
an underpin to the
improvements of 1.0% p.a.
Future lifetime from age 65 (currently aged 65) 23.7 22.0
Future lifetime from age 65 (currently aged 45) 25.5 24.0
Females Base table Standard SAPS Normal
Health Light Amounts
(S1NFA_L )
Standard tables PNFA00
making allowance for
improvements in mortality
in line with the Medium
Cohort factors to 2007
Scaling to above base table rates * 80% 100%
Allowance for future improvements In line with CMI 2009
with long term
improvement of 1.25%
p.a.
In line with Medium
Cohort improvements with
an underpin to the
improvements of 0.5% p.a.
Future lifetime from age 65 (currently aged 65) 26.5 24.0
Future lifetime from age 65 (currently aged 45) 28.5 25.3
* The scaling factors shown apply to normal health retirements
31 March 2010 31 March 2007 Commutation Each member is assumed to exchange
25% of the maximum amount permitted, of their past service pension rights on retirement, for additional lump sum.
Each member is assumed to exchange 75% of the maximum amount permitted, of their future service pension rights on retirement, for additional lump sum.
Each member is assumed to exchange 50% of the maximum amount permitted, of their past service pension rights on retirement, for additional lump sum.
Each member is assumed to exchange 75% of the maximum amount permitted, of their future service pension rights on retirement, for additional lump sum.
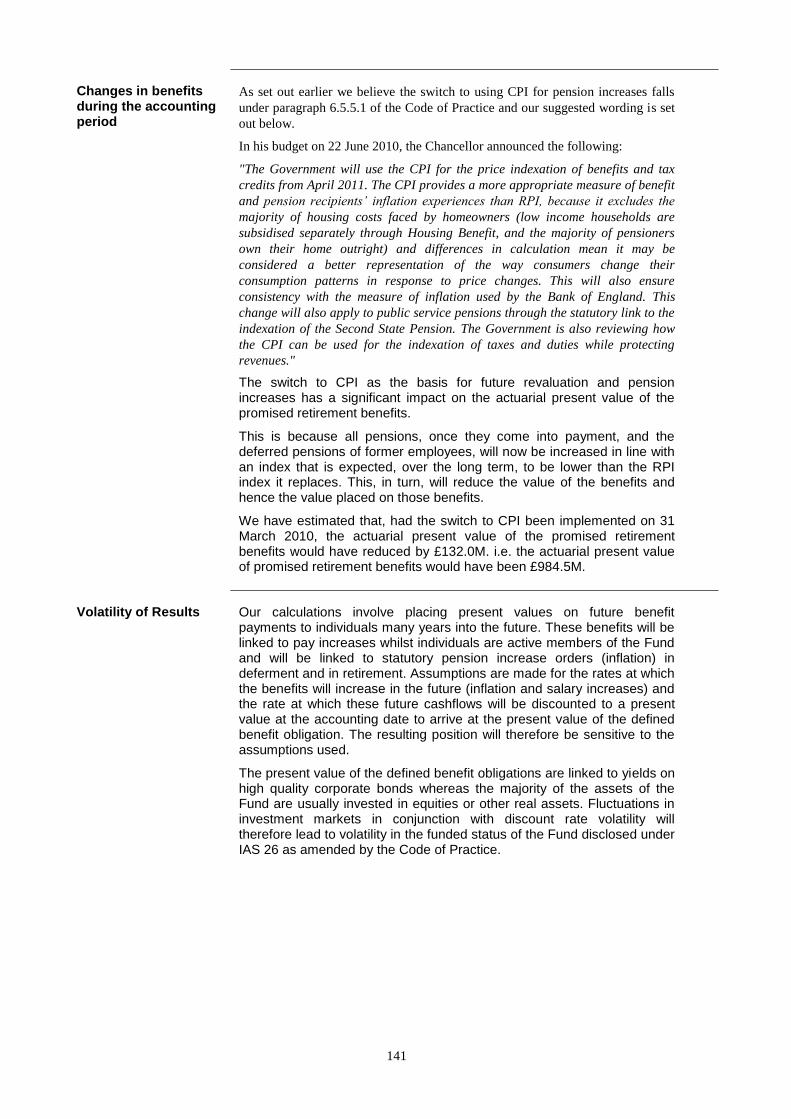
141
Changes in benefits during the accounting period
As set out earlier we believe the switch to using CPI for pension increases falls
under paragraph 6.5.5.1 of the Code of Practice and our suggested wording is set
out below.
In his budget on 22 June 2010, the Chancellor announced the following:
"The Government will use the CPI for the price indexation of benefits and tax
credits from April 2011. The CPI provides a more appropriate measure of benefit
and pension recipients’ inflation experiences than RPI, because it excludes the
majority of housing costs faced by homeowners (low income households are
subsidised separately through Housing Benefit, and the majority of pensioners
own their home outright) and differences in calculation mean it may be
considered a better representation of the way consumers change their
consumption patterns in response to price changes. This will also ensure
consistency with the measure of inflation used by the Bank of England. This
change will also apply to public service pensions through the statutory link to the
indexation of the Second State Pension. The Government is also reviewing how
the CPI can be used for the indexation of taxes and duties while protecting
revenues."
The switch to CPI as the basis for future revaluation and pension increases has a significant impact on the actuarial present value of the promised retirement benefits.
This is because all pensions, once they come into payment, and the deferred pensions of former employees, will now be increased in line with an index that is expected, over the long term, to be lower than the RPI index it replaces. This, in turn, will reduce the value of the benefits and hence the value placed on those benefits.
We have estimated that, had the switch to CPI been implemented on 31 March 2010, the actuarial present value of the promised retirement benefits would have reduced by £132.0M. i.e. the actuarial present value of promised retirement benefits would have been £984.5M.
Volatility of Results Our calculations involve placing present values on future benefit payments to individuals many years into the future. These benefits will be linked to pay increases whilst individuals are active members of the Fund and will be linked to statutory pension increase orders (inflation) in deferment and in retirement. Assumptions are made for the rates at which the benefits will increase in the future (inflation and salary increases) and the rate at which these future cashflows will be discounted to a present value at the accounting date to arrive at the present value of the defined benefit obligation. The resulting position will therefore be sensitive to the assumptions used.
The present value of the defined benefit obligations are linked to yields on high quality corporate bonds whereas the majority of the assets of the Fund are usually invested in equities or other real assets. Fluctuations in investment markets in conjunction with discount rate volatility will therefore lead to volatility in the funded status of the Fund disclosed under IAS 26 as amended by the Code of Practice.
142
GLOSSARY ACCRUALS Amounts charged to the accounts for goods and services received during the year for which payments have not been made. AREA BASED GRANT Area Based Grant is paid by the Government to local authorities starting from 2008/09. It is a non-ringfenced general grant. CAPITAL EXPENDITURE Expenditure on the acquisition of assets to be of value to the Council beyond the end of the financial year, e.g. purchase of land and buildings, construction of roads etc or revenue expenditure which the Government may exceptionally permit the Council to capitalise e.g. redundancy payments. CAPITAL RECEIPTS Money received from the sale of land, buildings and plant. A prescribed portion of receipts received for HRA dwellings must be “pooled” and paid to central government. COMMUNITY ASSETS A classification of fixed assets that the Council intends to hold in perpetuity that may have restrictions on their disposal. Examples of such assets are parks, historic buildings and works of art. CONSISTENCY The principle that the accounting treatment of like items should be treated the same from one period to the next. CORPORATE AND DEMOCRATIC CORE This comprises all activities which local authorities engage in specifically because they are elected multi-purpose authorities. The cost of these activities are thus over and above those which would be incurred by a single purpose body managing the same service. There is no logical basis for apportioning these costs to services. It comprises of Democratic Representation and Management and Corporate Management. CORPORATE MANAGEMENT Those activities which relate to the general running of the Council. These provide the infrastructure that allows services to be provided whether by the Council or not and the information required for public accountability. Activities relating to the provision of services, even indirectly, are overheads on those services, not a charge to corporate management. CREDITORS Amounts owed by the Council at 31st March for goods received or services rendered but not yet paid for. DEBTORS Amounts owed to the Council which are collectable or outstanding at 31st March.
143
GLOSSARY (Continued) DEMOCRATIC REPRESENTATION AND MANAGEMENT This concerns corporate policy making and all other member-based activities. It includes the costs of officer time spent on appropriate advice and support activities plus subscriptions to local authority associations. FINANCE LEASE A lease that transfers substantially all of the risks and rewards of ownership of an asset to the lessee (the Council) and at the end of the lease term substantially all the asset value and interest payments have been made. FIXED ASSETS Tangible assets that yield benefits to the Council and the services it provides for a period of more than one year. FORMULA GRANT The amount provided by Government to local authorities in the form of Revenue Support Grant and redistributed National Non-Domestic Rates based on relative needs and council tax base. GOING CONCERN The concept that the Council will remain in operational existence for the foreseeable future, in particular that the revenue accounts and balance sheet assume no intention to curtail significantly the scale of operations. GOVERNMENT GRANTS - SPECIFIC Assistance by Government and inter-government agencies and similar bodies, whether local, national or international, in the form of cash or transfers of assets to the Council in return for past or future compliance with certain conditions relating to the activities of the Council. INFRASTRUCTURE ASSETS A classification of fixed assets, whose life is of indefinite length and which are not usually capable of being sold, e g highways, street lighting and footpaths. LONG TERM INVESTMENTS A long-term investment is an investment that is intended to be held for use on a continuing basis in the activities of the Council. Investments should be so classified only where an intention to hold the investment for the long term can clearly be demonstrated or where there are restrictions as to the investor's ability to dispose of the investment. Investments which do not meet the above criteria should be classified as current assets. LEVIES These are payments to London-wide bodies whose costs are borne by local authorities in the area concerned.

144
GLOSSARY (Continued) LONG-TERM CONTRACTS A contract entered into for the design, manufacture or construction of a single substantial asset or the provision of a service (or a combination of assets or services which together constitute a single project), where the time taken substantially to complete the contract is such that the contract activity falls into different accounting periods. Some contracts with a shorter duration than one year should be accounted for as long-term contracts if they are sufficiently material to the activity of the period. MINIMUM REVENUE PROVISION The minimum amount the Council must charge to the revenue accounts each year to repay loans as defined by Government regulation. NATIONAL NON DOMESTIC RATE (NNDR) A flat rate in the pound set by the Central Government and levied on all non-residential premises according to their rateable value collected by the Council and paid into a central pool (NNDR POOL) which is administered by the Central Government. The total collected is then redistributed to councils as part of Formula Grant. OPERATING LEASES The lessor is paid rental for the hire of an asset for a period, which is substantially less than the useful economic life of an asset. The lessor is taking a risk on the residual value at the end of the lease. OPERATIONAL ASSETS/NON OPERATIONAL ASSETS
- Fixed assets held and occupied, used or consumed by the Council in the direct delivery of services for which it has either a statutory or discretionary responsibility.
- Non-operational assets, not directly occupied or surplus to requirements pending sale or development.
PRECEPTS A charge made by another authority on the Council to finance its net expenditure. This Council has a charge on the collection fund by the Greater London Authority. PRIOR YEAR ADJUSTMENTS Those material adjustments applicable to prior years arising from changes in accounting policies or from the correction of fundamental errors. They do not include normal recurring corrections or adjustments of accounting estimates made in prior years. PRUDENCE The concept that revenue is not anticipated but is recognised only when realised in the form either of cash or of other assets the ultimate cash realisation of which can be assessed with reasonable certainty. REVENUE SUPPORT GRANT A general grant paid to local councils from national taxation which, together with redistributed National Non Domestic Rates, makes up total Formula Grant.

145
GLOSSARY (Continued) STATEMENT OF STANDARD ACCOUNTING PRACTICE (SSAP) Guidance issued by the professional bodies on best accounting practice.
146
ABBREVIATIONS
ALMO Arms Length Management Organisation
AVC Additional Voluntary Contribution
BHP Brent Housing Partnership
CIPFA Chartered Institute of Public Finance and Accountancy
CLG Communities and Local Government
DfE Department for Education
FTE Full Time Equivalent
GLA Greater London Authority
HRA Housing Revenue Account
IFRS International Financial Reporting Standards
I&E Account Income and Expenditure Account
LABGI Local Authority Business Growth Incentive
LGPS Local Government Pension Scheme
LPFA London Pensions Fund Authority
MRA Major Repairs Allowance
MRP Minimum Revenue Provision
NNDR National Non Domestic Rates (also called Business Rates)
PFI Private Finance Initiative
PPP Public Private Partnership
PWLB Public Works Loans Board
SORP Statement of Recommended Practice
SRB Single Regeneration Budget
SSAP Statement of Standard Accounting Practice