London atlassian meetup 31 jan 2016 jira metrics-extract slides
18
Jira + Python + Data Analysis tools + Agile concepts = Powerful Actionable Insights Atlassian London User Group By Rudiger Wolf 31 Jan 2016
-
Upload
rudiger-wolf -
Category
Software
-
view
94 -
download
0
Transcript of London atlassian meetup 31 jan 2016 jira metrics-extract slides
Jira + Python + Data Analysis tools + Agile concepts
= Powerful Actionable Insights
Atlassian London User GroupBy Rudiger Wolf
31 Jan 2016
Objective
You will be able to make better use of the data captured in your Jira instance.
Get at the data.
Process the data.
Present the data in an insightful way
Agenda
Who is the speaker?
Context
Python a great all purpose tool
Actionable Agile
Jira-metrics-extract (Python Package)
The End

Who am I?
Studied Electrical & Electronics Engineering
Started Agile journey in 1998 with DSDM
Independent Consultant
Work with small and large organisations (Private and Public sector)
Couple of startups in Dot Com era
Most recently working at MOJ via Agilesphere
What's the first first question you get from your customer about your release?
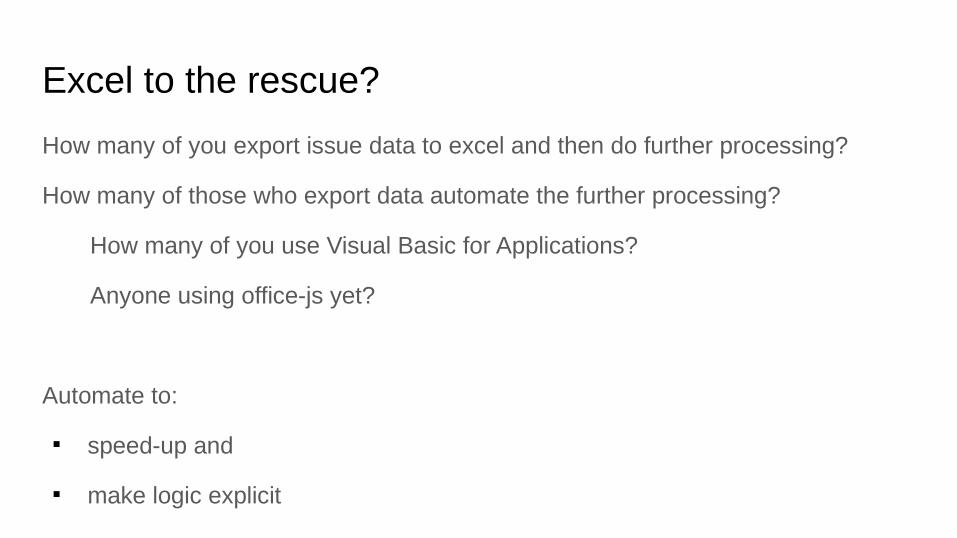
Excel to the rescue?
How many of you export issue data to excel and then do further processing?
How many of those who export data automate the further processing?
How many of you use Visual Basic for Applications?
Anyone using office-js yet?
Automate to:
speed-up and
make logic explicit
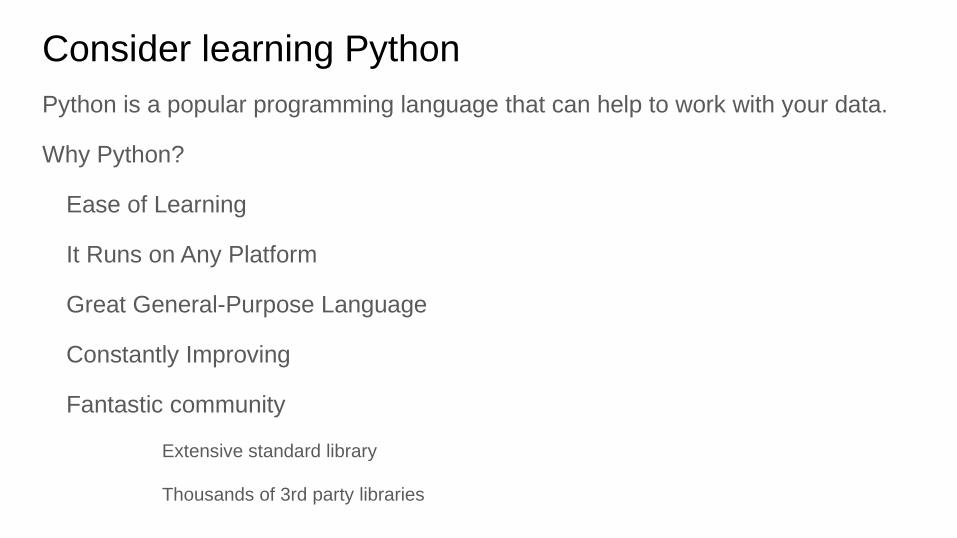
Consider learning PythonPython is a popular programming language that can help to work with your data.
Why Python?
Ease of Learning
It Runs on Any Platform
Great General-Purpose Language
Constantly Improving
Fantastic community
Extensive standard library
Thousands of 3rd party libraries
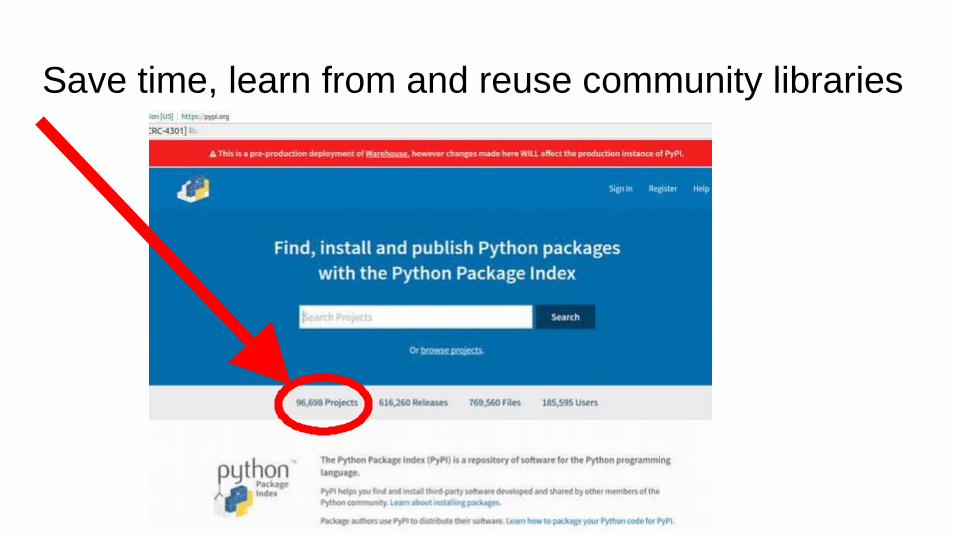
Save time, learn from and reuse community libraries
How to get started?
1 - Install Python [+ Git + text editor(Sublime,...) ]
2 - Create “Virtual Environment”
3 - Install Libraries/Packages/Modules
4 - Create your program
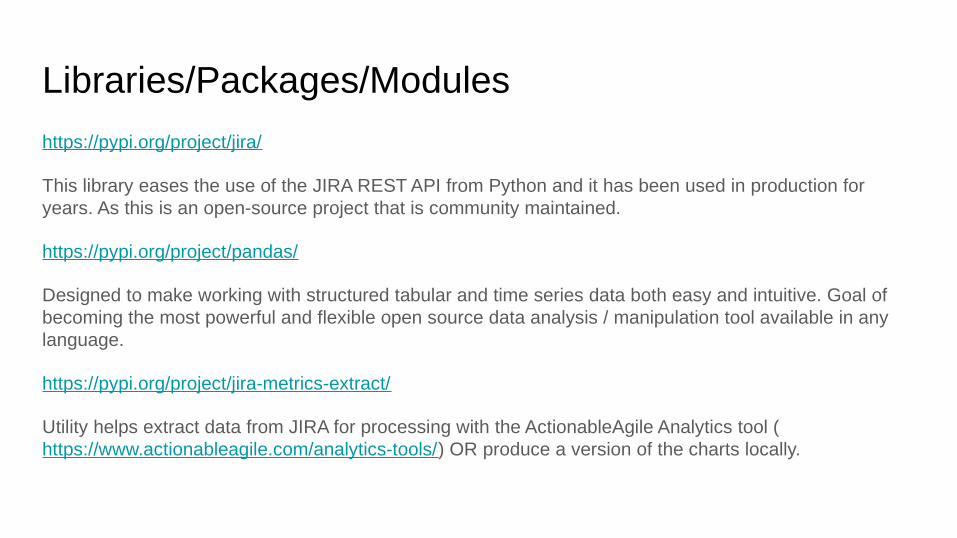
Libraries/Packages/Modules
https://pypi.org/project/jira/
This library eases the use of the JIRA REST API from Python and it has been used in production for years. As this is an open-source project that is community maintained.
https://pypi.org/project/pandas/
Designed to make working with structured tabular and time series data both easy and intuitive. Goal of becoming the most powerful and flexible open source data analysis / manipulation tool available in any language.
https://pypi.org/project/jira-metrics-extract/
Utility helps extract data from JIRA for processing with the ActionableAgile Analytics tool (https://www.actionableagile.com/analytics-tools/) OR produce a version of the charts locally.
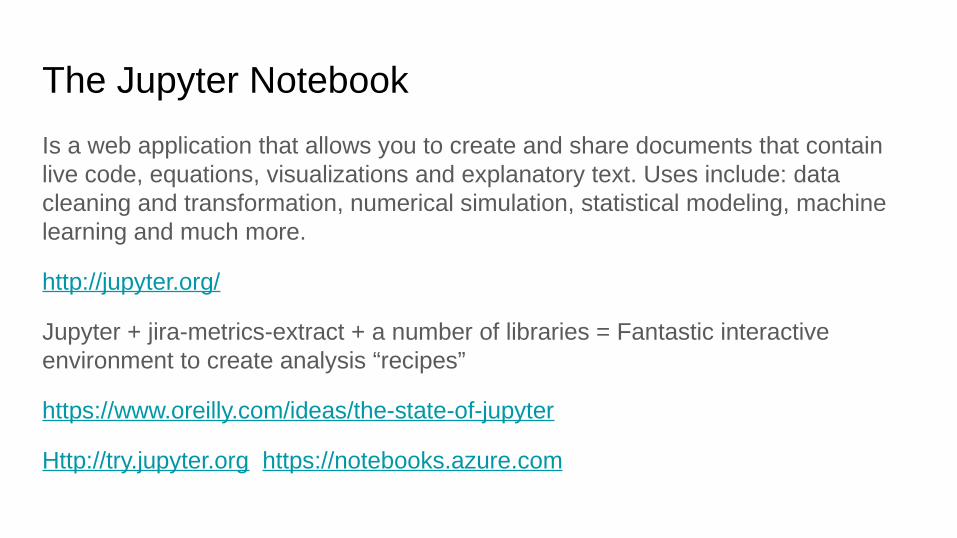
The Jupyter Notebook
Is a web application that allows you to create and share documents that contain live code, equations, visualizations and explanatory text. Uses include: data cleaning and transformation, numerical simulation, statistical modeling, machine learning and much more.
http://jupyter.org/
Jupyter + jira-metrics-extract + a number of libraries = Fantastic interactive environment to create analysis “recipes”
https://www.oreilly.com/ideas/the-state-of-jupyter
Http://try.jupyter.org https://notebooks.azure.com

Video Zero to Hero Jira Access
Run video.
How does it take to get started extracting data from Jira?
Zero To Hero With Python and Jira 2min
https://www.youtube.com/watch?v=s4hVmiLR0jo
Actionable Agile
Just get the book, watch the conference Videos…
https://leanpub.com/actionableagilemetrics
Actionable Agile Metrics for Predictability is a comprehensive guide on how to use flow metrics and analytics to get the predictability your customers crave.
By Daniel Vacanti
Other thought leaders in Probabilistic Planning
Troy Magennis – Agile Probabilistic forecasting quant @t_magennis http://focusedobjective.com/
Larry Maccherone @LMaccherone
“I got this concept that every decision is a forecast and the reason I say that is that by picking alternative a for instance, you are going to forecast that alternative a has a better outcome for you than alternatives b, c, d, and e.”
Larry Maccherone -
Director of Analytics at AgileCraft, Prior to that, Larry led the Portfolio Insights product line at Rally Software.
https://www.infoq.com/articles/maccherone-agilecraft-data
Jira-metrics-extractInstall
Configure & Run
Data Extract file
Charts
Cumulative Flow Diagram
Release Burnup with forecast (monte carlo - based on past team performance)
Enhance with Jupyter notebook recipe
Enrich Sprint number, Pivot Table
Fill in missing sprint numbers, Extract dependencies
Visualise the dependencies in clickable dependency map
Demo Video
Configure and extract data 3min
https://youtu.be/HSk_aBQmvi0
Further Demos can show you how to:
* Enrich data extract
* Create Pivot Table
* Visualise Dependencies
The End
Knowledge to create an interactive environment
So that you can extract data and iterate toward analysis “recipes”
Quickly
Repeatability
Questions
Twitter : @rnwolf