London 6 February 2018 BP p.l.c. Group results Fourth ... was $6.2 billion for full year 2017 and...
34
1 FOR IMMEDIATE RELEASE London 6 February 2018 Full year Highlights Strong delivery and growth across BP – Underlying profit up 139% – Organic cash flows back in balance – Downstream underlying profit up 24% – Upstream production up 12% – Reserves replacement ratio 143% for BP group – Share buybacks, offsetting scrip dilution, restarted • Underlying replacement cost profit* was $6.2 billion for full year 2017 and $2.1 billion for the fourth quarter, compared with $2.6 billion and $400 million for full year and fourth quarter 2016 respectively. • Operating cash flow for 2017, excluding Gulf of Mexico oil spill payments*, was $24.1 billion, compared with $17.6 billion in 2016. Gulf of Mexico oil spill payments in 2017 were $5.2 billion, compared with $6.9 billion in 2016. • Downstream earnings were very strong with underlying replacement cost profit of $7.0 billion, 24% higher than 2016. • Operational reliability was high, with refining availability* and Upstream BP-operated plant reliability* both 95%. • Seven new major projects* delivered, boosting oil and gas production. Upstream production, excluding BP’s share of Rosneft production, was 12% higher than 2016, the highest since 2010. Including Rosneft, production was 3.6 million barrels of oil equivalent a day, 10% higher than 2016. Oil and gas realizations were 25% higher. • Exploration delivered the most successful year for BP since 2004, with around 1 billion boe resources discovered. • Dividend unchanged at 10 cents per share. • BP began share buybacks in the fourth quarter, spending $343 million, fully offsetting the dilution from scrip dividends issued in the third quarter. • Non-operating items in the fourth quarter, which are excluded from underlying profit, included a $0.9 billion charge for US tax changes and a $1.7 billion post-tax charge relating to a further provision for claims associated with the oil spill. Year on year Bob Dudley – Group chief executive: “2017 was one of the strongest years in BP’s recent history. We delivered operationally and financially, with very strong earnings in the Downstream, Upstream production up 12%, and our finances rebalanced. And we did all this while maintaining safe and reliable operations. “We enter the second year of our five-year plan with real momentum, increasingly confident that we can continue to deliver growth across our business, improving cash flows and returns for shareholders out to 2021 and beyond. “At the same time, we are embracing the energy transition, seeking new opportunities in a changing, lower-carbon world.” Financial summary Fourth Third Fourth quarter quarter quarter Year Year $ million 2017 2017 2016 2017 2016 Profit for the period(a) 27 1,769 497 3,389 115 Inventory holding (gains) losses*, net of tax (610) (390) (425) (628) (1,114) RC profit (loss)* (583) 1,379 72 2,761 (999) Net (favourable) adverse impact of non-operating items* and fair value accounting effects*, net of tax 2,690 486 328 3,405 3,584 Underlying RC profit 2,107 1,865 400 6,166 2,585 RC profit (loss) per ordinary share (cents)* (2.94) 6.98 0.38 14.02 (5.33) RC profit (loss) per ADS (dollars) (0.18) 0.42 0.02 0.84 (0.32) Underlying RC profit per ordinary share (cents)* 10.64 9.44 2.11 31.31 13.79 Underlying RC profit per ADS (dollars) 0.64 0.57 0.13 1.88 0.83 (a) Profit attributable to BP shareholders. * See definitions in the Glossary on page 30. RC profit (loss), underlying RC profit, operating cash flow excluding Gulf of Mexico oil spill payments and organic capital expenditure are non-GAAP measures. The commentary above and following should be read in conjunction with the cautionary statement on page 34. 2,585 6,166 115 3,389 0 1,000 2,000 3,000 4,000 5,000 6,000 7,000 2016 2017 2016 2017 17.6 24.1 0 5 10 15 20 25 30 2016 2017 BP p.l.c. Group results Fourth quarter and full year 2017 Underlying RC profit ($ million) Profit for the period ($ million) Operating cash flow excluding Gulf of Mexico oil spill payments ($ billion)
Transcript of London 6 February 2018 BP p.l.c. Group results Fourth ... was $6.2 billion for full year 2017 and...
1
FOR IMMEDIATE RELEASE London 6 February 2018
Full year Highlights
Strong delivery and growth across BP – Underlying profit up 139% – Organic cash flows back in balance – Downstream underlying profit up 24% – Upstream production up 12% – Reserves replacement ratio 143% for BP group – Share buybacks, offsetting scrip dilution, restarted
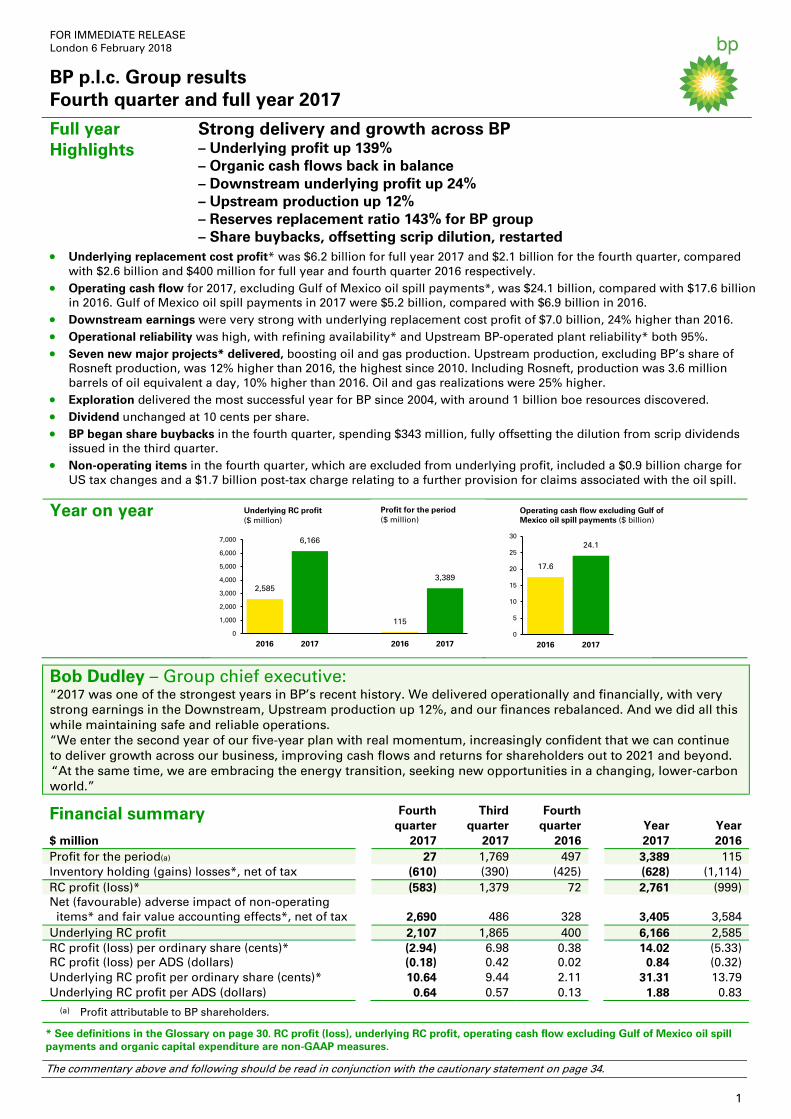
• Underlying replacement cost profit* was $6.2 billion for full year 2017 and $2.1 billion for the fourth quarter, compared with $2.6 billion and $400 million for full year and fourth quarter 2016 respectively.
• Operating cash flow for 2017, excluding Gulf of Mexico oil spill payments*, was $24.1 billion, compared with $17.6 billion in 2016. Gulf of Mexico oil spill payments in 2017 were $5.2 billion, compared with $6.9 billion in 2016.
• Downstream earnings were very strong with underlying replacement cost profit of $7.0 billion, 24% higher than 2016. • Operational reliability was high, with refining availability* and Upstream BP-operated plant reliability* both 95%. • Seven new major projects* delivered, boosting oil and gas production. Upstream production, excluding BP’s share of
Rosneft production, was 12% higher than 2016, the highest since 2010. Including Rosneft, production was 3.6 million barrels of oil equivalent a day, 10% higher than 2016. Oil and gas realizations were 25% higher.
• Exploration delivered the most successful year for BP since 2004, with around 1 billion boe resources discovered. • Dividend unchanged at 10 cents per share. • BP began share buybacks in the fourth quarter, spending $343 million, fully offsetting the dilution from scrip dividends
issued in the third quarter. • Non-operating items in the fourth quarter, which are excluded from underlying profit, included a $0.9 billion charge for
US tax changes and a $1.7 billion post-tax charge relating to a further provision for claims associated with the oil spill.
Year on year
Bob Dudley – Group chief executive: “2017 was one of the strongest years in BP’s recent history. We delivered operationally and financially, with very strong earnings in the Downstream, Upstream production up 12%, and our finances rebalanced. And we did all this while maintaining safe and reliable operations. “We enter the second year of our five-year plan with real momentum, increasingly confident that we can continue to deliver growth across our business, improving cash flows and returns for shareholders out to 2021 and beyond. “At the same time, we are embracing the energy transition, seeking new opportunities in a changing, lower-carbon world.”
Financial summary Fourth Third Fourth quarter quarter quarter Year Year
$ million 2017 2017 2016 2017 2016 Profit for the period(a) 27 1,769 497 3,389 115 Inventory holding (gains) losses*, net of tax (610) (390) (425) (628) (1,114) RC profit (loss)* (583) 1,379 72 2,761 (999) Net (favourable) adverse impact of non-operating items* and fair value accounting effects*, net of tax 2,690 486 328 3,405 3,584 Underlying RC profit 2,107 1,865 400 6,166 2,585 RC profit (loss) per ordinary share (cents)* (2.94) 6.98 0.38 14.02 (5.33) RC profit (loss) per ADS (dollars) (0.18) 0.42 0.02 0.84 (0.32) Underlying RC profit per ordinary share (cents)* 10.64 9.44 2.11 31.31 13.79 Underlying RC profit per ADS (dollars) 0.64 0.57 0.13 1.88 0.83
(a) Profit attributable to BP shareholders.
* See definitions in the Glossary on page 30. RC profit (loss), underlying RC profit, operating cash flow excluding Gulf of Mexico oil spill payments and organic capital expenditure are non-GAAP measures.
The commentary above and following should be read in conjunction with the cautionary statement on page 34.
2,585
6,166
115
3,389
0
1,000
2,000
3,000
4,000
5,000
6,000
7,000
2016 2017 2016 2017
17.6
24.1
0
5
10
15
20
25
30
2016 2017
BP p.l.c. Group results Fourth quarter and full year 2017
Underlying RC profit ($ million)
Profit for the period ($ million)
Operating cash flow excluding Gulf of Mexico oil spill payments ($ billion)
2
BP p.l.c. Group results Fourth quarter and full year 2017
Group headlines Earnings For the full year, underlying replacement cost (RC) profit was $6,166 million, compared with $2,585 million in 2016. Underlying RC profit is after adjusting for a net charge for non-operating items of $3,309 million and net adverse fair value accounting effects of $96 million (both on a post-tax basis). RC profit was $2,761 million for the full year, compared with a loss of $999 million a year ago. For the fourth quarter, underlying RC profit was $2,107 million compared with $400 million for the same period in 2016. Underlying RC profit is after adjusting for a net charge for non-operating items of $2,515 million and net adverse fair value accounting effects of $175 million (both on a post-tax basis). RC loss was $583 million for the fourth quarter, compared with a profit of $72 million for the same period in 2016. BP’s profit for the fourth quarter and full year was $27 million and $3,389 million respectively, compared with $497 million and $115 million for the same periods in 2016. See further information on page 4. Depreciation, depletion and amortization The charge for depreciation, depletion and amortization was $15.6 billion in 2017, compared with $14.5 billion in 2016. In 2018, we expect the charge to be higher than 2017. Non-operating items Non-operating items amounted to a charge of $2,325 million pre-tax and $2,515 million post-tax for the quarter and a charge of $3,622 million pre-tax and $3,309 million post-tax for the full year. The post-tax non-operating charge for the fourth quarter includes a charge of $1.7 billion relating to business economic loss and other claims associated with the Gulf of Mexico oil spill (see Note 2 on page 17) and a $0.9 billion deferred tax charge following the change in the US tax rate. See further information on page 25. Effective tax rate The effective tax rate (ETR) on RC profit or loss* for the fourth quarter and full year was significantly impacted by the effect of non-operating items and therefore it is not a meaningful measure. The adjusted ETR* is calculated by eliminating the impact of non-operating items, which for the fourth quarter includes a one-off deferred tax charge in respect of the revaluation of deferred tax assets and liabilities following the reduction in the US federal corporate income tax rate from 35% to 21% enacted in December 2017; fair value accounting effects; and the impact of a reduction in the UK supplementary tax charge in the third quarter of 2016. The adjusted ETR for the fourth quarter and full year was 27% and 38% respectively, compared with 10% and 23% for the same periods in 2016. The adjusted ETR for the fourth quarter 2017 reflects a benefit from the reassessment of the recognition of deferred tax assets. The adjusted ETR for the fourth quarter 2016 was impacted by a high proportion of equity-accounted income (which is reported net of tax in the income statement) within RC profit, and reflected a benefit from the reassessment of the recognition of deferred tax assets and other items, partly offset by charges for foreign exchange impacts.
The adjusted ETR for the full year is higher than last year predominantly due to changes in the geographical mix of profits notably the impact of the renewal of our interest in the Abu Dhabi onshore oil concession. In the current environment, and assuming no further reassessment of the recognition of deferred tax assets, the adjusted ETR in 2018 is expected to be above 40%. ETR on RC profit or loss and adjusted ETR are non-GAAP measures.
Dividend BP today announced a quarterly dividend of 10.00 cents per ordinary share ($0.600 per ADS), which is expected to be paid on 29 March 2018. The corresponding amount in sterling will be announced on 19 March 2018. See page 22 for further information.
Share buybacks BP recommenced a share buyback programme in the fourth quarter to offset the dilution of the scrip issue and repurchased 51 million ordinary shares at a cost of $343 million, including fees and stamp duty, during the fourth quarter of 2017.
Operating cash flow* Excluding post-tax amounts related to the Gulf of Mexico oil spill, operating cash flow* for the fourth quarter and full year was $6.2 billion and $24.1 billion respectively, compared with $4.5 billion and $17.6 billion for the same periods in 2016. Including amounts relating to the Gulf of Mexico oil spill, operating cash flow for the fourth quarter and full year was $5.9 billion and $18.9 billion respectively, compared with $2.4 billion and $10.7 billion for the same periods in 2016.
Capital expenditure* Organic capital expenditure* for the fourth quarter and full year was $4.6 billion and $16.5 billion respectively, compared with $4.5 billion and $16.7 billion for the same periods in 2016. In 2018, we expect organic capital expenditure to be in the range of $15-16 billion. Inorganic capital expenditure* for the fourth quarter and full year was $0.2 billion and $1.3 billion respectively, compared with $0.4 billion, and $0.8 billion for the same periods in 2016. See page 24 for further information. Divestment and other proceeds Total divestment and other proceeds for the year were $4.3 billion including proceeds of $0.8 billion received in relation to the initial public offering of BP Midstream Partners LP’s common units. Divestment proceeds* were $2.5 billion for the fourth quarter and $3.4 billion for the full year, compared with $0.5 billion and $2.6 billion for the same periods in 2016. In 2018, divestments are expected to be in the range of $2-3 billion. Net debt* Net debt at 31 December 2017 was $37.8 billion, compared with $35.5 billion a year ago. The net debt ratio* at 31 December 2017 was 27.4%, compared with 26.8% a year ago. We continue to target a net debt ratio in the range of 20-30%. Net debt and the net debt ratio are non-GAAP measures. See page 23 for more information.

3
BP p.l.c. Group results Fourth quarter and full year 2017
Reserves replacement ratio* The reserves replacement ratio on a combined basis of subsidiaries and equity-accounted entities was estimated at 143%(a) for the year. (a) Includes estimated reserves data for Rosneft. The reserves replacement ratio will be finalized and reported in BP Annual Report and Form 20-F 2017.
Brian Gilvary – Chief financial officer: “We had strong delivery and growth across BP in 2017. The full-year underlying result was more than double a year earlier, our organic cash flows are back in balance and our financial frame remains resilient. Our share buyback programme in the fourth quarter offset the dilution from scrip dividends issued in September and our intent remains to offset any ongoing scrip dilution through further buybacks over time.”
The commentary above should be read in conjunction with the cautionary statement on page 34.

4
BP p.l.c. Group results Fourth quarter and full year 2017
Analysis of underlying RC profit before interest and tax Fourth Third Fourth quarter quarter quarter Year Year $ million 2017 2017 2016 2017 2016 Underlying RC profit before interest and tax* Upstream 2,223 1,562 400 5,865 (542) Downstream 1,474 2,338 877 6,967 5,634 Rosneft 321 137 135 836 567 Other businesses and corporate (394) (398) (424) (1,598) (1,238) Consolidation adjustment – UPII* (149) (130) (132) (212) (196) Underlying RC profit before interest and tax 3,475 3,509 856 11,858 4,225 Finance costs and net finance expense relating to pensions and other post-retirement benefits (550) (444) (359) (1,801) (1,371) Taxation on an underlying RC basis (782) (1,212) (51) (3,812) (212) Non-controlling interests (36) 12 (46) (79) (57) Underlying RC profit attributable to BP shareholders 2,107 1,865 400 6,166 2,585 Reconciliations of underlying RC profit or loss to the nearest equivalent IFRS measure are provided on page 1 for the group and on pages 6-11 for the segments.
Analysis of RC profit (loss) before interest and tax and reconciliation to profit (loss) for the period
Fourth Third Fourth quarter quarter quarter Year Year
$ million 2017 2017 2016 2017 2016 RC profit (loss) before interest and tax* Upstream 1,928 1,242 692 5,221 574 Downstream 1,773 2,175 899
7,221 5,162
Rosneft 321 137 158
836 590 Other businesses and corporate(a) (2,833) (460) (1,117)
(4,445) (8,157)
Consolidation adjustment – UPII (149) (130) (132)
(212) (196) RC profit (loss) before interest and tax 1,040 2,964 500
8,621 (2,027)
Finance costs and net finance expense relating to
pensions and other post-retirement benefits (674) (566) (484)
(2,294) (1,865)
Taxation on a RC basis (913) (1,031) 102
(3,487) 2,950 Non-controlling interests (36) 12 (46)
(79) (57)
RC profit (loss) attributable to BP shareholders (583) 1,379 72 2,761 (999) Inventory holding gains (losses) 816 557 601
853 1,597
Taxation (charge) credit on inventory holding
gains and losses (206) (167) (176) (225) (483) Profit for the period attributable to BP shareholders 27 1,769 497 3,389 115
(a) Includes costs related to the Gulf of Mexico oil spill. See page 11 and also Note 2 from page 17 for further information on the accounting for the Gulf of Mexico oil spill.
5
BP p.l.c. Group results Fourth quarter and full year 2017
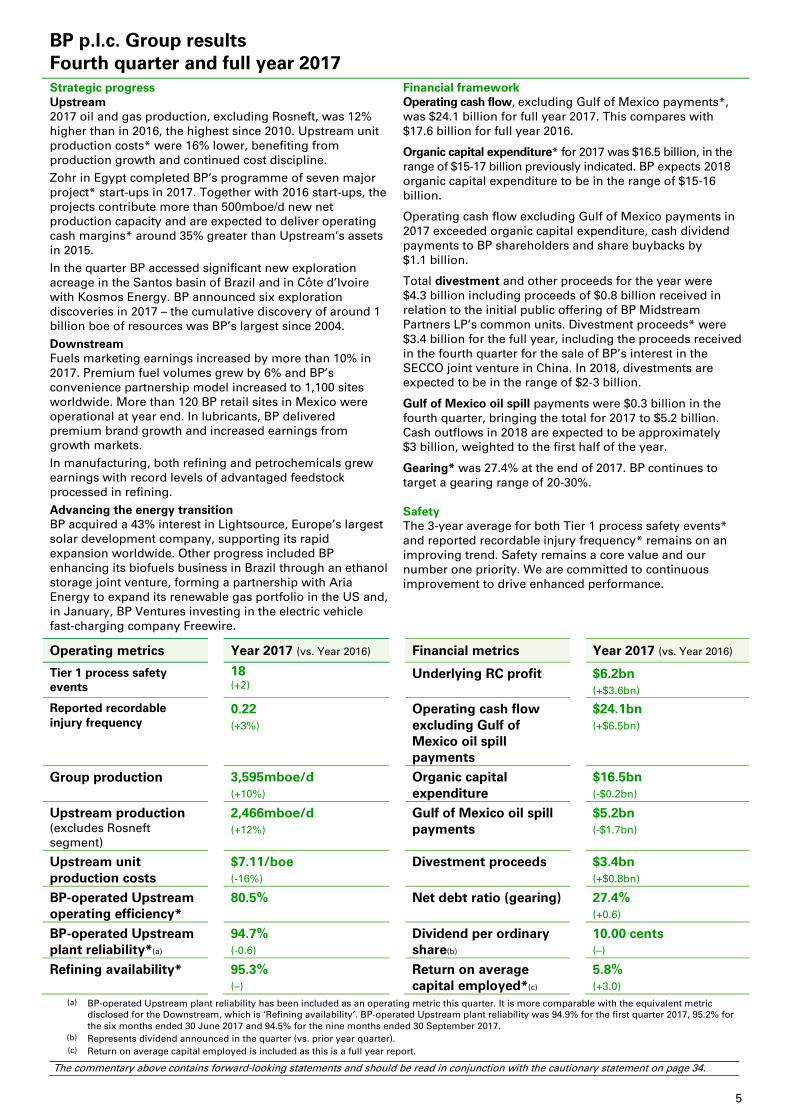
Strategic progress Financial framework Upstream 2017 oil and gas production, excluding Rosneft, was 12% higher than in 2016, the highest since 2010. Upstream unit production costs* were 16% lower, benefiting from production growth and continued cost discipline.
Zohr in Egypt completed BP’s programme of seven major project* start-ups in 2017. Together with 2016 start-ups, the projects contribute more than 500mboe/d new net production capacity and are expected to deliver operating cash margins* around 35% greater than Upstream’s assets in 2015.
In the quarter BP accessed significant new exploration acreage in the Santos basin of Brazil and in Côte d’Ivoire with Kosmos Energy. BP announced six exploration discoveries in 2017 – the cumulative discovery of around 1 billion boe of resources was BP’s largest since 2004.
Downstream Fuels marketing earnings increased by more than 10% in 2017. Premium fuel volumes grew by 6% and BP’s convenience partnership model increased to 1,100 sites worldwide. More than 120 BP retail sites in Mexico were operational at year end. In lubricants, BP delivered premium brand growth and increased earnings from growth markets.
In manufacturing, both refining and petrochemicals grew earnings with record levels of advantaged feedstock processed in refining.
Advancing the energy transition BP acquired a 43% interest in Lightsource, Europe’s largest solar development company, supporting its rapid expansion worldwide. Other progress included BP enhancing its biofuels business in Brazil through an ethanol storage joint venture, forming a partnership with Aria Energy to expand its renewable gas portfolio in the US and, in January, BP Ventures investing in the electric vehicle fast-charging company Freewire.
Operating cash flow, excluding Gulf of Mexico payments*, was $24.1 billion for full year 2017. This compares with $17.6 billion for full year 2016.
Organic capital expenditure* for 2017 was $16.5 billion, in the range of $15-17 billion previously indicated. BP expects 2018 organic capital expenditure to be in the range of $15-16 billion.
Operating cash flow excluding Gulf of Mexico payments in 2017 exceeded organic capital expenditure, cash dividend payments to BP shareholders and share buybacks by $1.1 billion.
Total divestment and other proceeds for the year were $4.3 billion including proceeds of $0.8 billion received in relation to the initial public offering of BP Midstream Partners LP’s common units. Divestment proceeds* were $3.4 billion for the full year, including the proceeds received in the fourth quarter for the sale of BP’s interest in the SECCO joint venture in China. In 2018, divestments are expected to be in the range of $2-3 billion.
Gulf of Mexico oil spill payments were $0.3 billion in the fourth quarter, bringing the total for 2017 to $5.2 billion. Cash outflows in 2018 are expected to be approximately $3 billion, weighted to the first half of the year.
Gearing* was 27.4% at the end of 2017. BP continues to target a gearing range of 20-30%. Safety The 3-year average for both Tier 1 process safety events* and reported recordable injury frequency* remains on an improving trend. Safety remains a core value and our number one priority. We are committed to continuous improvement to drive enhanced performance.
Operating metrics Year 2017 (vs. Year 2016) Financial metrics Year 2017 (vs. Year 2016)
Tier 1 process safety events
18 (+2)
Underlying RC profit
$6.2bn (+$3.6bn)
Reported recordable injury frequency
0.22 (+3%)
Operating cash flow excluding Gulf of Mexico oil spill payments
$24.1bn (+$6.5bn)
Group production
3,595mboe/d (+10%)
Organic capital expenditure
$16.5bn (-$0.2bn)
Upstream production (excludes Rosneft segment)
2,466mboe/d (+12%)
Gulf of Mexico oil spill payments
$5.2bn (-$1.7bn)
Upstream unit production costs
$7.11/boe (-16%)
Divestment proceeds
$3.4bn (+$0.8bn)
BP-operated Upstream operating efficiency*
80.5%
Net debt ratio (gearing)
27.4% (+0.6)
BP-operated Upstream plant reliability*(a)
94.7% (-0.6)
Dividend per ordinary share(b)
10.00 cents (–)
Refining availability*
95.3% (–)
Return on average capital employed*(c)
5.8% (+3.0)
(a) BP-operated Upstream plant reliability has been included as an operating metric this quarter. It is more comparable with the equivalent metric disclosed for the Downstream, which is ‘Refining availability’. BP-operated Upstream plant reliability was 94.9% for the first quarter 2017, 95.2% for the six months ended 30 June 2017 and 94.5% for the nine months ended 30 September 2017.
(b) Represents dividend announced in the quarter (vs. prior year quarter). (c) Return on average capital employed is included as this is a full year report.
The commentary above contains forward-looking statements and should be read in conjunction with the cautionary statement on page 34.

6
BP p.l.c. Group results Fourth quarter and full year 2017
Upstream Fourth Third Fourth quarter quarter quarter Year Year $ million 2017 2017 2016 2017 2016 Profit before interest and tax 1,928 1,255 711 5,229 634 Inventory holding (gains) losses* – (13) (19) (8) (60) RC profit before interest and tax 1,928 1,242 692 5,221 574 Net (favourable) adverse impact of non-operating items* and fair value accounting effects* 295 320 (292) 644 (1,116) Underlying RC profit (loss) before interest and tax*(a) 2,223 1,562 400 5,865 (542)
(a) See page 7 for a reconciliation to segment RC profit before interest and tax by region.
Financial results The replacement cost profit before interest and tax for the fourth quarter and full year was $1,928 million and $5,221 million respectively, compared with $692 million and $574 million for the same periods in 2016. The fourth quarter and full year included a net non-operating charge of $144 million and $671 million respectively, compared with a net non-operating gain of $636 million and $1,753 million for the same periods in 2016. Fair value accounting effects in the fourth quarter and full year had an adverse impact of $151 million and a favourable impact of $27 million respectively, compared with an adverse impact of $344 million and $637 million in the same periods of 2016.
After adjusting for non-operating items and fair value accounting effects, the underlying replacement cost profit before interest and tax for the fourth quarter and full year was $2,223 million and $5,865 million respectively, compared with a profit of $400 million and a loss of $542 million for the same periods in 2016. The result for the fourth quarter mainly reflected higher liquids realizations and higher production including the impact of the Abu Dhabi onshore concession renewal and major project* start-ups. The result for the full year reflected higher liquids realizations, and higher production including the impact of the Abu Dhabi onshore concession renewal and major project start-ups, partly offset by higher depreciation, depletion and amortization, and higher exploration write-offs.
Production Production for the quarter was 2,581mboe/d, 18.1% higher than the fourth quarter of 2016. Fourth quarter production reflects the fifth consecutive quarter of growth as well as the highest production since first quarter 2011. Underlying production* for the quarter increased by 11.1%, due to the ramp-up of major projects. For the full year, production was 2,466mboe/d, 11.7% higher than 2016. Underlying production for the full year was 7.9% higher than 2016 due to major project start-ups. The seven major project start-ups for 2017, together with the 2016 start-ups, contribute more than 500mboe/d of new net production capacity.
Key events On 21 November, BP agreed to sell a package of its interests in the Bruce assets in the North Sea to Serica Energy plc, subject to regulatory approvals. The Bruce assets comprise the Bruce, Keith and Rhum fields, platforms and associated subsea infrastructure.
On 18 December, BP completed the formation of Pan American Energy Group (PAEG) (BP 50%, Bridas Corporation 50%), which is a combination of Pan American Energy and Axion Energy.
On 20 December, BP confirmed that production started from the Zohr gas field, offshore Egypt (ENI operator 60%, Rosneft 30%, BP 10%), BP’s seventh major project to start in 2017.
Also on 20 December, BP and Statoil signed an extension agreement for the In Amenas production-sharing contract* with Algerian state-owned energy company Sonatrach, which has been submitted to the Algerian authorities for ratification.
On 21 December, BP and Kosmos Energy (KE) were awarded five blocks offshore Côte d’Ivoire, under agreements with the government of Côte d’Ivoire and state oil company Société Nationale d'Operations Pétrolières de la Côte d'Ivoire (PETROCI) (BP 45%, KE 45%, PETROCI 10%).
In December Rosneft announced an agreement to develop resources within the Kharampurskoe and Festivalnoye licence areas in Yamalo-Nenets Autonomous Okrug in northern Russia jointly with BP. Rosneft will hold a majority stake of 51% and BP will hold a 49% stake. Completion of the deal is subject to regulatory approvals.
On 31 January, BP announced the oil discovery Capercaillie (BP 100%) and the oil discovery Achmelvich (BP 52.6%, Shell 28%, and Chevron 19.4%) in the UK North Sea, both operated by BP. These two discoveries bring the total exploration discoveries in 2017 to six, and our most successful exploration campaign in the UK North Sea since 2008.
Outlook We expect full-year 2018 underlying production to be higher than 2017 due to the ramp-up of major projects. The actual reported outcome will depend on the exact timing of project start-ups, acquisition and divestment activities, OPEC quotas and entitlement impacts in our production-sharing agreements*. We expect first-quarter 2018 reported production to be broadly flat with the fourth quarter 2017, reflecting continued growth from the 2017 major project start-ups, offset by the expiration of the Abu Dhabi offshore concession and divestment impacts.
The commentary above contains forward-looking statements and should be read in conjunction with the cautionary statement on page 34.

7
BP p.l.c. Group results Fourth quarter and full year 2017
Upstream (continued) Fourth Third Fourth quarter quarter quarter Year Year $ million 2017 2017 2016 2017 2016 Underlying RC profit (loss) before interest and tax US 629 264 (147) 1,238 (1,270) Non-US 1,594 1,298 547 4,627 728 2,223 1,562 400 5,865 (542) Non-operating items US(a) (187) (97) 21 (330) 127 Non-US(b)(c) 43 (49) 615 (341) 1,626 (144) (146) 636 (671) 1,753 Fair value accounting effects US 8 (100) (274) 192 (379) Non-US (159) (74) (70) (165) (258) (151) (174) (344) 27 (637) RC profit (loss) before interest and tax US 450 67 (400) 1,100 (1,522) Non-US 1,478 1,175 1,092 4,121 2,096 1,928 1,242 692 5,221 574 Exploration expense US 27 190 511 282 693 Non-US(c)(d) 494 107 (197) 1,798 1,028 521 297 314 2,080 1,721 Of which: Exploration expenditure written off(c)(d) 372 217 166 1,603 1,274 Production (net of royalties)(e) Liquids* (mb/d) US 430 408 406 426 391 Europe 117 123 122 119 120 Rest of World 796 809 650 811 698 1,344 1,341 1,178 1,356 1,208 Natural gas (mmcf/d) US 1,759 1,703 1,675 1,659 1,656 Europe 186 217 268 235 264 Rest of World 5,231 4,581 3,903 4,543 3,876 7,176 6,502 5,846 6,436 5,796 Total hydrocarbons* (mboe/d) US 734 702 694 712 676 Europe 150 161 168 160 165 Rest of World 1,698 1,599 1,323 1,594 1,366 2,581 2,462 2,186 2,466 2,208 Average realizations*(f) Total liquids(g) ($/bbl) 56.16 47.45 43.89 49.92 38.27 Natural gas ($/mcf) 3.23 2.89 3.08 3.19 2.84 Total hydrocarbons ($/boe) 37.48 33.23 31.40 35.38 28.24
(a) Fourth quarter and full year 2017 include an impairment charge relating to the US Lower 48 business, partially offset by gains associated with asset divestments.
(b) Fourth quarter and full year 2017 include BP’s share of an impairment reversal recognized by the Angola LNG equity-accounted entity, partially offset by other items. In addition, full year 2017 includes an impairment charge arising following the announcement of the agreement to sell the Forties Pipeline System business to INEOS. Fourth quarter and full year 2016 principally relate to impairment reversals in India, Angola and the North Sea.
(c) See page 25 for more information on non-operating items. (d) Full year 2017 includes the write-off of exploration well and lease costs in Angola and the write-off of exploration wells in Egypt. (e) Includes BP’s share of production of equity-accounted entities in the Upstream segment. (f) Realizations are based on sales by consolidated subsidiaries only – this excludes equity-accounted entities.
(g) Includes condensate, natural gas liquids and bitumen. Because of rounding, some totals may not agree exactly with the sum of their component parts.
8
BP p.l.c. Group results Fourth quarter and full year 2017
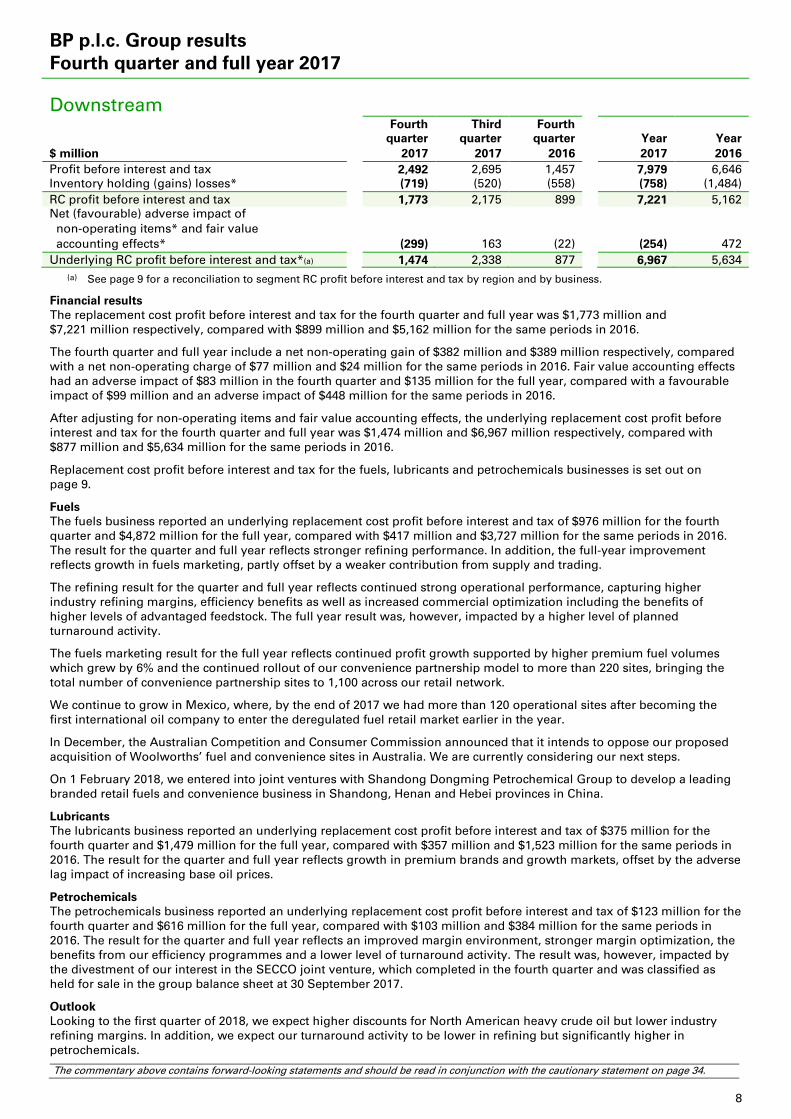
Downstream Fourth Third Fourth quarter quarter quarter Year Year $ million 2017 2017 2016 2017 2016 Profit before interest and tax 2,492 2,695 1,457 7,979 6,646 Inventory holding (gains) losses* (719) (520) (558) (758) (1,484) RC profit before interest and tax 1,773 2,175 899 7,221 5,162 Net (favourable) adverse impact of non-operating items* and fair value accounting effects* (299) 163 (22) (254) 472 Underlying RC profit before interest and tax*(a) 1,474 2,338 877 6,967 5,634
(a) See page 9 for a reconciliation to segment RC profit before interest and tax by region and by business.
Financial results The replacement cost profit before interest and tax for the fourth quarter and full year was $1,773 million and $7,221 million respectively, compared with $899 million and $5,162 million for the same periods in 2016.
The fourth quarter and full year include a net non-operating gain of $382 million and $389 million respectively, compared with a net non-operating charge of $77 million and $24 million for the same periods in 2016. Fair value accounting effects had an adverse impact of $83 million in the fourth quarter and $135 million for the full year, compared with a favourable impact of $99 million and an adverse impact of $448 million for the same periods in 2016.
After adjusting for non-operating items and fair value accounting effects, the underlying replacement cost profit before interest and tax for the fourth quarter and full year was $1,474 million and $6,967 million respectively, compared with $877 million and $5,634 million for the same periods in 2016.
Replacement cost profit before interest and tax for the fuels, lubricants and petrochemicals businesses is set out on page 9.
Fuels The fuels business reported an underlying replacement cost profit before interest and tax of $976 million for the fourth quarter and $4,872 million for the full year, compared with $417 million and $3,727 million for the same periods in 2016. The result for the quarter and full year reflects stronger refining performance. In addition, the full-year improvement reflects growth in fuels marketing, partly offset by a weaker contribution from supply and trading.
The refining result for the quarter and full year reflects continued strong operational performance, capturing higher industry refining margins, efficiency benefits as well as increased commercial optimization including the benefits of higher levels of advantaged feedstock. The full year result was, however, impacted by a higher level of planned turnaround activity.
The fuels marketing result for the full year reflects continued profit growth supported by higher premium fuel volumes which grew by 6% and the continued rollout of our convenience partnership model to more than 220 sites, bringing the total number of convenience partnership sites to 1,100 across our retail network.
We continue to grow in Mexico, where, by the end of 2017 we had more than 120 operational sites after becoming the first international oil company to enter the deregulated fuel retail market earlier in the year.
In December, the Australian Competition and Consumer Commission announced that it intends to oppose our proposed acquisition of Woolworths’ fuel and convenience sites in Australia. We are currently considering our next steps.
On 1 February 2018, we entered into joint ventures with Shandong Dongming Petrochemical Group to develop a leading branded retail fuels and convenience business in Shandong, Henan and Hebei provinces in China.
Lubricants The lubricants business reported an underlying replacement cost profit before interest and tax of $375 million for the fourth quarter and $1,479 million for the full year, compared with $357 million and $1,523 million for the same periods in 2016. The result for the quarter and full year reflects growth in premium brands and growth markets, offset by the adverse lag impact of increasing base oil prices.
Petrochemicals The petrochemicals business reported an underlying replacement cost profit before interest and tax of $123 million for the fourth quarter and $616 million for the full year, compared with $103 million and $384 million for the same periods in 2016. The result for the quarter and full year reflects an improved margin environment, stronger margin optimization, the benefits from our efficiency programmes and a lower level of turnaround activity. The result was, however, impacted by the divestment of our interest in the SECCO joint venture, which completed in the fourth quarter and was classified as held for sale in the group balance sheet at 30 September 2017.
Outlook Looking to the first quarter of 2018, we expect higher discounts for North American heavy crude oil but lower industry refining margins. In addition, we expect our turnaround activity to be lower in refining but significantly higher in petrochemicals.
The commentary above contains forward-looking statements and should be read in conjunction with the cautionary statement on page 34.

9
BP p.l.c. Group results Fourth quarter and full year 2017
Downstream (continued) Fourth Third Fourth quarter quarter quarter Year Year $ million 2017 2017 2016 2017 2016 Underlying RC profit before interest and tax - by region US 501 640 (371) 1,978 853 Non-US 973 1,698 1,248 4,989 4,781 1,474 2,338 877 6,967 5,634 Non-operating items US (25) (39) (122) (48) (48) Non-US(a) 407 (16) 45 437 24 382 (55) (77) 389 (24) Fair value accounting effects US 3 20 22 (29) (321) Non-US (86) (128) 77 (106) (127) (83) (108) 99 (135) (448) RC profit before interest and tax US 479 621 (471) 1,901 484 Non-US 1,294 1,554 1,370 5,320 4,678 1,773 2,175 899 7,221 5,162 Underlying RC profit before interest and tax - by business(b)(c) Fuels 976 1,788 417 4,872 3,727 Lubricants 375 356 357 1,479 1,523 Petrochemicals 123 194 103 616 384 1,474 2,338 877 6,967 5,634 Non-operating items and fair value accounting effects(d) Fuels (202) (154) 103 (193) (390) Lubricants (14) (3) (81) (22) (84) Petrochemicals(a) 515 (6) – 469 2 299 (163) 22 254 (472) RC profit before interest and tax(b)(c) Fuels 774 1,634 520 4,679 3,337 Lubricants 361 353 276 1,457 1,439 Petrochemicals 638 188 103 1,085 386 1,773 2,175 899 7,221 5,162
BP average refining marker margin (RMM)* ($/bbl) 14.4 16.3 11.4 14.1 11.8 Refinery throughputs (mb/d) US 714 737 604 713 646 Europe 741 768 806 773 803 Rest of World 243 240 234 216 236 1,698 1,745 1,644 1,702 1,685 Refining availability* (%) 96.1 95.3 94.9 95.3 95.3 Marketing sales of refined products (mb/d) US 1,127 1,186 1,146 1,151 1,134 Europe 1,132 1,204 1,166 1,140 1,179 Rest of World 542 480 540 508 512 2,801 2,870 2,852 2,799 2,825 Trading/supply sales of refined products 3,549 3,088 2,836 3,149 2,775 Total sales volumes of refined products 6,350 5,958 5,688 5,948 5,600 Petrochemicals production (kte) US 641 617 546 2,428 2,564 Europe 1,559 1,285 930 5,462 3,729 Rest of World 1,306 2,025 2,071 7,405 7,934 3,506 3,927 3,547 15,295 14,227
(a) Fourth quarter and full year 2017 gain primarily reflects the disposal of our shareholding in the SECCO joint venture. (b) Segment-level overhead expenses are included in the fuels business result. (c) Results from petrochemicals at our Gelsenkirchen and Mülheim sites in Germany is reported in the fuels business. (d) For Downstream, fair value accounting effects arise solely in the fuels business.
10
BP p.l.c. Group results Fourth quarter and full year 2017
Rosneft
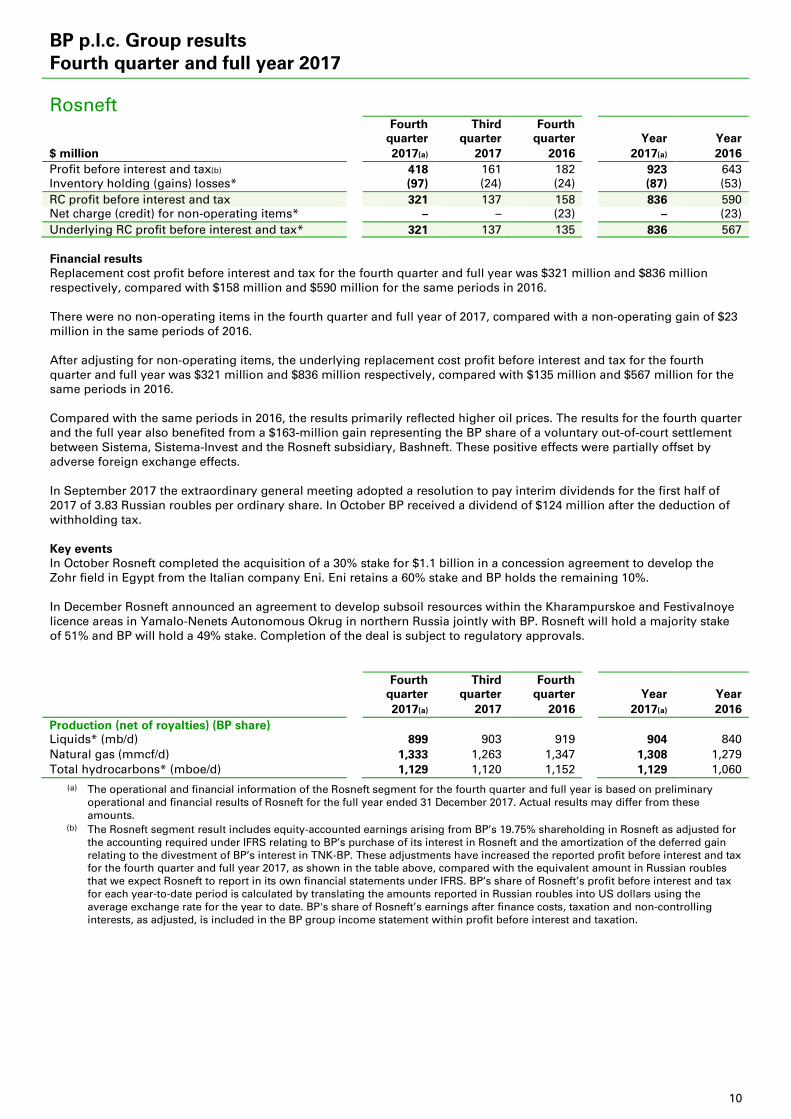
Fourth Third Fourth quarter quarter quarter Year Year $ million 2017(a) 2017 2016 2017(a) 2016 Profit before interest and tax(b) 418 161 182 923 643 Inventory holding (gains) losses* (97) (24) (24) (87) (53) RC profit before interest and tax 321 137 158 836 590 Net charge (credit) for non-operating items* – – (23) – (23) Underlying RC profit before interest and tax* 321 137 135 836 567 Financial results Replacement cost profit before interest and tax for the fourth quarter and full year was $321 million and $836 million respectively, compared with $158 million and $590 million for the same periods in 2016. There were no non-operating items in the fourth quarter and full year of 2017, compared with a non-operating gain of $23 million in the same periods of 2016. After adjusting for non-operating items, the underlying replacement cost profit before interest and tax for the fourth quarter and full year was $321 million and $836 million respectively, compared with $135 million and $567 million for the same periods in 2016. Compared with the same periods in 2016, the results primarily reflected higher oil prices. The results for the fourth quarter and the full year also benefited from a $163-million gain representing the BP share of a voluntary out-of-court settlement between Sistema, Sistema-Invest and the Rosneft subsidiary, Bashneft. These positive effects were partially offset by adverse foreign exchange effects. In September 2017 the extraordinary general meeting adopted a resolution to pay interim dividends for the first half of 2017 of 3.83 Russian roubles per ordinary share. In October BP received a dividend of $124 million after the deduction of withholding tax. Key events In October Rosneft completed the acquisition of a 30% stake for $1.1 billion in a concession agreement to develop the Zohr field in Egypt from the Italian company Eni. Eni retains a 60% stake and BP holds the remaining 10%. In December Rosneft announced an agreement to develop subsoil resources within the Kharampurskoe and Festivalnoye licence areas in Yamalo-Nenets Autonomous Okrug in northern Russia jointly with BP. Rosneft will hold a majority stake of 51% and BP will hold a 49% stake. Completion of the deal is subject to regulatory approvals. Fourth Third Fourth quarter quarter quarter Year Year 2017(a) 2017 2016 2017(a) 2016 Production (net of royalties) (BP share) Liquids* (mb/d) 899 903 919 904 840 Natural gas (mmcf/d) 1,333 1,263 1,347 1,308 1,279 Total hydrocarbons* (mboe/d) 1,129 1,120 1,152 1,129 1,060
(a) The operational and financial information of the Rosneft segment for the fourth quarter and full year is based on preliminary operational and financial results of Rosneft for the full year ended 31 December 2017. Actual results may differ from these amounts.
(b) The Rosneft segment result includes equity-accounted earnings arising from BP’s 19.75% shareholding in Rosneft as adjusted for the accounting required under IFRS relating to BP’s purchase of its interest in Rosneft and the amortization of the deferred gain relating to the divestment of BP’s interest in TNK-BP. These adjustments have increased the reported profit before interest and tax for the fourth quarter and full year 2017, as shown in the table above, compared with the equivalent amount in Russian roubles that we expect Rosneft to report in its own financial statements under IFRS. BP’s share of Rosneft’s profit before interest and tax for each year-to-date period is calculated by translating the amounts reported in Russian roubles into US dollars using the average exchange rate for the year to date. BP's share of Rosneft’s earnings after finance costs, taxation and non-controlling interests, as adjusted, is included in the BP group income statement within profit before interest and taxation.

11
BP p.l.c. Group results Fourth quarter and full year 2017
Other businesses and corporate Fourth Third Fourth quarter quarter quarter Year Year $ million 2017 2017 2016 2017 2016 Profit (loss) before interest and tax Gulf of Mexico oil spill (2,221) (84) (674) (2,687) (6,640) Other (612) (376) (443) (1,758) (1,517) Profit (loss) before interest and tax (2,833) (460) (1,117) (4,445) (8,157) Inventory holding (gains) losses* – – – – – RC profit (loss) before interest and tax (2,833) (460) (1,117) (4,445) (8,157) Net charge (credit) for non-operating items* Gulf of Mexico oil spill 2,221 84 674 2,687 6,640 Other 218 (22) 19 160 279 Net charge (credit) for non-operating items 2,439 62 693 2,847 6,919 Underlying RC profit (loss) before interest and tax* (394) (398) (424) (1,598) (1,238) Underlying RC profit (loss) before interest and tax US (29) (145) 50 (475) (276) Non-US (365) (253) (474) (1,123) (962) (394) (398) (424) (1,598) (1,238) Non-operating items US (2,381) (92) (672) (2,861) (6,824) Non-US (58) 30 (21) 14 (95) (2,439) (62) (693) (2,847) (6,919) RC profit (loss) before interest and tax US (2,410) (237) (622) (3,336) (7,100) Non-US (423) (223) (495) (1,109) (1,057) (2,833) (460) (1,117) (4,445) (8,157) Other businesses and corporate comprises our alternative energy business, shipping, treasury, corporate activities including centralized functions, and the costs of the Gulf of Mexico oil spill. Financial results The replacement cost loss before interest and tax for the fourth quarter and full year was $2,833 million and $4,445 million respectively, compared with $1,117 million and $8,157 million for the same periods in 2016. The results included a net non-operating charge of $2,439 million for the fourth quarter and $2,847 million for the full year, mainly relating to the Gulf of Mexico oil spill, compared with a net non-operating charge of $693 million and $6,919 million for the same periods in 2016. See Note 2 on page 17 for more information on the Gulf of Mexico oil spill. After adjusting for non-operating items, the underlying replacement cost loss before interest and tax for the fourth quarter and full year was $394 million and $1,598 million respectively, compared with $424 million and $1,238 million for the same periods in 2016. The underlying charge for the full year was impacted by weaker business results, higher corporate costs and adverse foreign exchange effects which had a favourable effect in 2016. Alternative energy The net ethanol-equivalent production (which includes ethanol and sugar) for the fourth quarter and full year was 188 million litres and 776 million litres respectively, compared with 98 million litres and 733 million litres for the same periods in 2016. Net wind generation capacity*(a) was 1,432MW at 31 December 2017 compared with 1,474MW at 31 December 2016. BP’s net share of wind generation for the fourth quarter and full year was 1,148GWh and 4,004GWh respectively, compared with 1,154GWh and 4,389GWh for the same periods in 2016.
(a) Capacity figures for 2016 include 23MW in the Netherlands managed by our Downstream segment. BP formed a strategic partnership with Lightsource, Europe’s largest developer of large-scale solar projects, with the aim of driving further growth of solar power development worldwide. Under the terms of the deal, which completed on 31 January 2018, BP acquired a 43% equity share in Lightsource for a total consideration of $200 million, payable over three years. The move will combine BP’s global scale, technology and trading capabilities with Lightsource’s expertise in solar development. The company will rebrand as Lightsource BP. Outlook In 2018, Other businesses and corporate average quarterly charges, excluding non-operating items, are expected to be around $350 million although this will fluctuate from quarter to quarter.
The commentary above contains forward-looking statements and should be read in conjunction with the cautionary statement on page 34.

12
BP p.l.c. Group results Fourth quarter and full year 2017
Financial statements Group income statement Fourth Third Fourth quarter quarter quarter Year Year $ million 2017 2017 2016 2017 2016 Sales and other operating revenues (Note 4) 67,816 60,018 51,007 240,208 183,008 Earnings from joint ventures – after interest and tax 581 231 489 1,177 966 Earnings from associates – after interest and tax 526 282 263 1,330 994 Interest and other income 223 185 114 657 506 Gains on sale of businesses and fixed assets 876 92 248 1,210 1,132 Total revenues and other income 70,022 60,808 52,121 244,582 186,606 Purchases(a) 51,745 44,441 37,883 179,716 132,219 Production and manufacturing expenses(b) 7,759 5,454 6,595 24,229 29,077 Production and similar taxes (Note 5)(a) 511 449 199 1,775 683 Depreciation, depletion and amortization (Note 4) 4,045 3,904 3,642 15,584 14,505 Impairment and losses on sale of businesses and fixed assets 604 108 (305) 1,216 (1,664) Exploration expense 521 297 314 2,080 1,721 Distribution and administration expenses 2,981 2,634 2,692 10,508 10,495 Profit (loss) before interest and taxation 1,856 3,521 1,101 9,474 (430) Finance costs(b) 616 511 434 2,074 1,675 Net finance expense relating to pensions and other post-retirement benefits 58 55 50 220 190 Profit (loss) before taxation 1,182 2,955 617 7,180 (2,295) Taxation(b) 1,119 1,198 74 3,712 (2,467) Profit (loss) for the period 63 1,757 543 3,468 172 Attributable to BP shareholders 27 1,769 497 3,389 115 Non-controlling interests 36 (12) 46 79 57 63 1,757 543 3,468 172 Earnings per share (Note 6) Profit (loss) for the period attributable to BP shareholders Per ordinary share (cents) Basic 0.14 8.95 2.62 17.20 0.61 Diluted 0.14 8.90 2.60 17.10 0.60 Per ADS (dollars) Basic 0.01 0.54 0.16 1.03 0.04 Diluted 0.01 0.53 0.16 1.03 0.04
(a) Amounts reported in prior quarters of 2017 for Purchases and Production and similar taxes have been amended, with no effect on profit for the period. See Note 5 for further information.
(b) See Note 2 for information on the impact of the Gulf of Mexico oil spill on these income statement line items.

13
BP p.l.c. Group results Fourth quarter and full year 2017
Group statement of comprehensive income Fourth Third Fourth quarter quarter quarter Year Year $ million 2017 2017 2016 2017 2016 Profit (loss) for the period 63 1,757 543 3,468 172 Other comprehensive income Items that may be reclassified subsequently to profit or loss Currency translation differences 264 611 (777) 1,986 254 Exchange (gains) losses on translation of foreign operations reclassified to gain or loss on sale of businesses and fixed assets (138) 13 24 (120) 30 Available-for-sale investments 11 – – 14 1 Cash flow hedges marked to market 19 49 (204) 197 (639) Cash flow hedges reclassified to the income statement 23 20 86 116 196 Cash flow hedges reclassified to the balance sheet 8 29 32 112 81 Share of items relating to equity-accounted entities, net of tax 133 128 172 564 833 Income tax relating to items that may be reclassified (81) (59) 97 (261) 13 239 791 (570) 2,608 769 Items that will not be reclassified to profit or loss Remeasurements of the net pension and other post-retirement benefit liability or asset 1,599 1,002 3,484 3,646 (2,496) Income tax relating to items that will not be reclassified (539) (351) (765) (1,238) 739 1,060 651 2,719 2,408 (1,757) Other comprehensive income 1,299 1,442 2,149 5,016 (988) Total comprehensive income 1,362 3,199 2,692 8,484 (816) Attributable to BP shareholders 1,312 3,206 2,667 8,353 (846) Non-controlling interests 50 (7) 25 131 30 1,362 3,199 2,692 8,484 (816)
14
BP p.l.c. Group results Fourth quarter and full year 2017
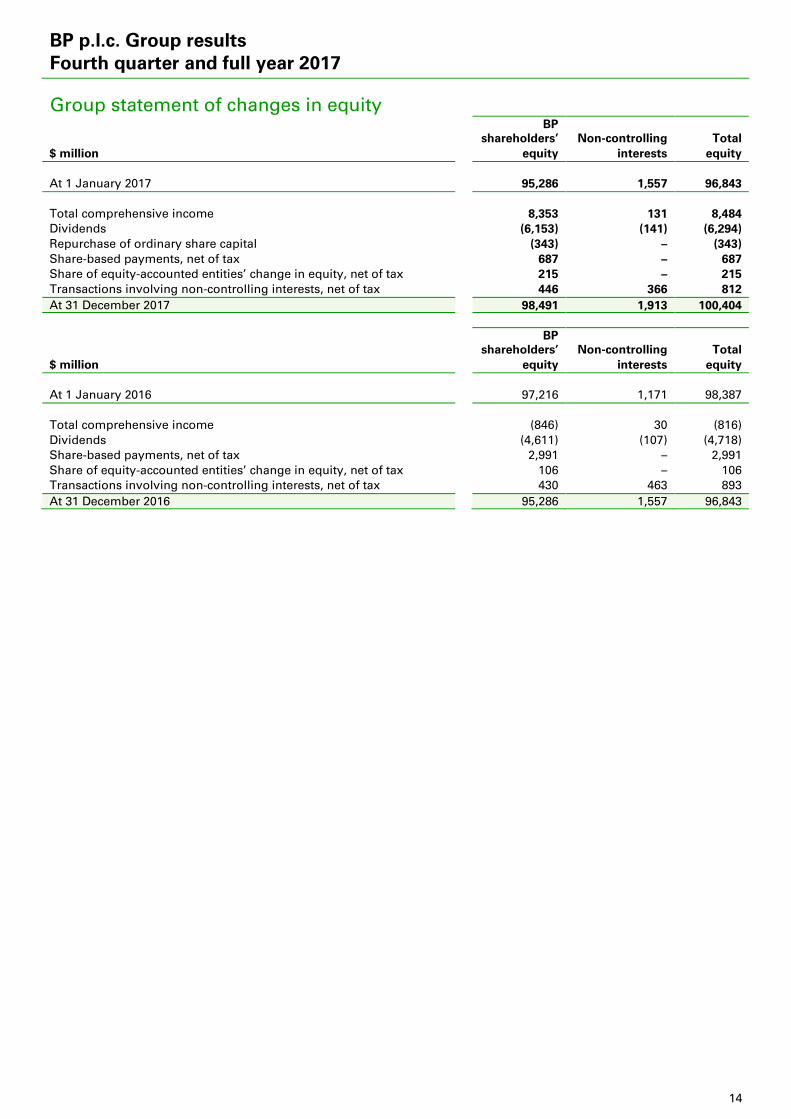
Group statement of changes in equity BP shareholders’ Non-controlling Total $ million equity interests equity At 1 January 2017 95,286 1,557 96,843 Total comprehensive income 8,353 131 8,484 Dividends (6,153) (141) (6,294) Repurchase of ordinary share capital (343) – (343) Share-based payments, net of tax 687 – 687 Share of equity-accounted entities’ change in equity, net of tax 215 – 215 Transactions involving non-controlling interests, net of tax 446 366 812 At 31 December 2017 98,491 1,913 100,404 BP shareholders’ Non-controlling Total $ million equity interests equity At 1 January 2016 97,216 1,171 98,387 Total comprehensive income (846) 30 (816) Dividends (4,611) (107) (4,718) Share-based payments, net of tax 2,991 – 2,991 Share of equity-accounted entities’ change in equity, net of tax 106 – 106 Transactions involving non-controlling interests, net of tax 430 463 893 At 31 December 2016 95,286 1,557 96,843
15
BP p.l.c. Group results Fourth quarter and full year 2017
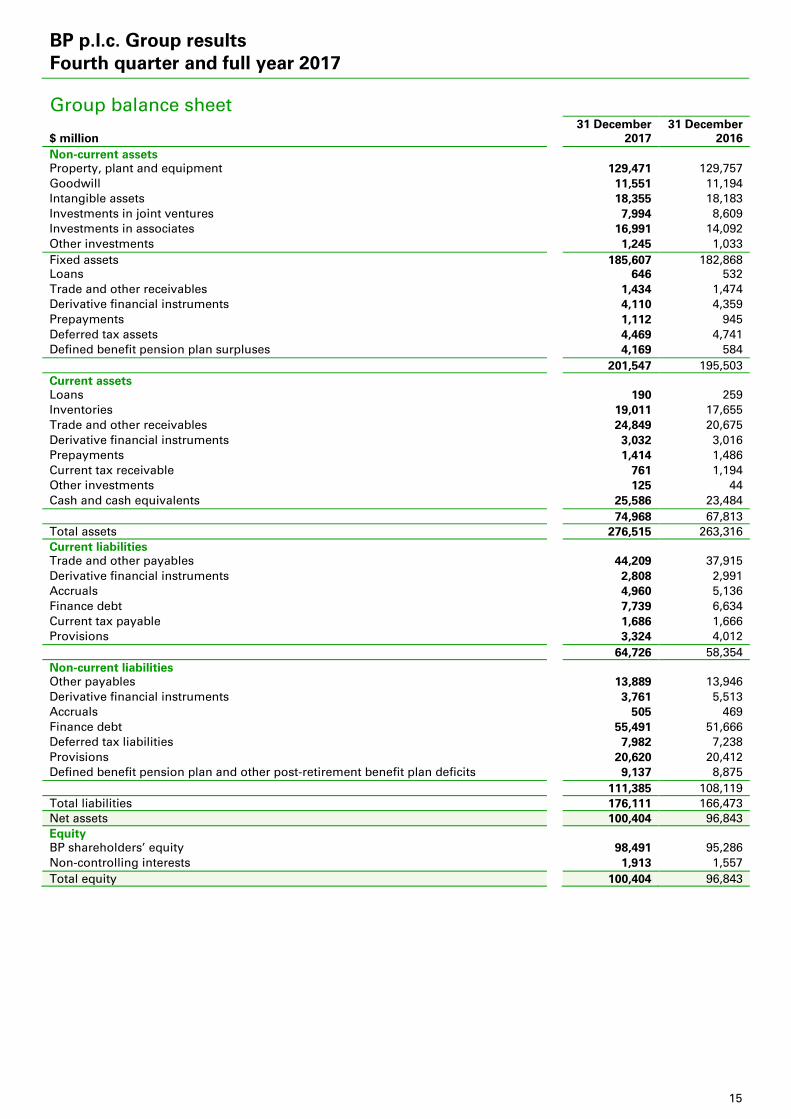
Group balance sheet 31 December 31 December $ million 2017 2016 Non-current assets Property, plant and equipment 129,471 129,757 Goodwill 11,551 11,194 Intangible assets 18,355 18,183 Investments in joint ventures 7,994 8,609 Investments in associates 16,991 14,092 Other investments 1,245 1,033 Fixed assets 185,607 182,868 Loans 646 532 Trade and other receivables 1,434 1,474 Derivative financial instruments 4,110 4,359 Prepayments 1,112 945 Deferred tax assets 4,469 4,741 Defined benefit pension plan surpluses 4,169 584 201,547 195,503 Current assets Loans 190 259 Inventories 19,011 17,655 Trade and other receivables 24,849 20,675 Derivative financial instruments 3,032 3,016 Prepayments 1,414 1,486 Current tax receivable 761 1,194 Other investments 125 44 Cash and cash equivalents 25,586 23,484 74,968 67,813 Total assets 276,515 263,316 Current liabilities Trade and other payables 44,209 37,915 Derivative financial instruments 2,808 2,991 Accruals 4,960 5,136 Finance debt 7,739 6,634 Current tax payable 1,686 1,666 Provisions 3,324 4,012 64,726 58,354 Non-current liabilities Other payables 13,889 13,946 Derivative financial instruments 3,761 5,513 Accruals 505 469 Finance debt 55,491 51,666 Deferred tax liabilities 7,982 7,238 Provisions 20,620 20,412 Defined benefit pension plan and other post-retirement benefit plan deficits 9,137 8,875 111,385 108,119 Total liabilities 176,111 166,473 Net assets 100,404 96,843 Equity BP shareholders’ equity 98,491 95,286 Non-controlling interests 1,913 1,557 Total equity 100,404 96,843

16
BP p.l.c. Group results Fourth quarter and full year 2017
Condensed group cash flow statement Fourth Third Fourth quarter quarter quarter Year Year $ million 2017 2017 2016 2017 2016 Operating activities Profit (loss) before taxation 1,182 2,955 617 7,180 (2,295) Adjustments to reconcile profit (loss) before
taxation to net cash provided by operating activities Depreciation, depletion and amortization and exploration expenditure written off 4,417 4,121 3,808 17,187 15,779 Impairment and (gain) loss on sale of businesses and fixed assets (272) 16 (553) 6 (2,796) Earnings from equity-accounted entities, less dividends received (820) (111) (605) (1,254) (855) Net charge for interest and other finance expense, less net interest paid 294 163 310 793 795 Share-based payments 166 177 150 661 779 Net operating charge for pensions and other post- retirement benefits, less contributions and benefit payments for unfunded plans (215) (160) (347) (394) (467) Net charge for provisions, less payments 2,244 (144) (629) 2,106 4,487 Movements in inventories and other current and non-current assets and liabilities (60) 305 393 (3,352) (3,198) Income taxes paid (1,033) (1,298) (716) (4,002) (1,538) Net cash provided by operating activities 5,903 6,024 2,428 18,931 10,691 Investing activities Expenditure on property, plant and equipment, intangible and other assets (4,422) (4,136) (4,658) (16,562) (16,701) Acquisitions, net of cash acquired (16) (146) (1) (327) (1) Investment in joint ventures (15) (5) (37) (50) (50) Investment in associates (368) (176) (226) (901) (700) Total cash capital expenditure (4,821) (4,463) (4,922) (17,840) (17,452) Proceeds from disposal of fixed assets 2,287 149 391 2,936 1,372 Proceeds from disposal of businesses, net of cash disposed 173 92 78 478 1,259 Proceeds from loan repayments 8 308 7 349 68 Net cash used in investing activities (2,353) (3,914) (4,446) (14,077) (14,753) Financing activities Net issue (repurchase) of shares (343) – – (343) – Proceeds from long-term financing 201 3,078 3,069 8,712 12,442 Repayments of long-term financing (2,657) (1,239) (1,733) (6,276) (6,685) Net increase (decrease) in short-term debt (297) 123 375 (158) 51 Net increase (decrease) in non-controlling interests 982 – 126 1,063 887 Dividends paid - BP shareholders (1,627) (1,676) (1,182) (6,153) (4,611) - non-controlling interests (32) (32) (24) (141) (107) Net cash provided by (used in) financing activities (3,773) 254 631 (3,296) 1,977 Currency translation differences relating to cash and cash equivalents 29 146 (649) 544 (820) Increase (decrease) in cash and cash equivalents (194) 2,510 (2,036) 2,102 (2,905) Cash and cash equivalents at beginning of period 25,780 23,270 25,520 23,484 26,389 Cash and cash equivalents at end of period 25,586 25,780 23,484 25,586 23,484
17
BP p.l.c. Group results Fourth quarter and full year 2017
Notes Note 1. Basis of preparation The results for the interim periods and for the year ended 31 December 2017 are unaudited and, in the opinion of management, include all adjustments necessary for a fair presentation of the results for each period. All such adjustments are of a normal recurring nature. This report should be read in conjunction with the consolidated financial statements and related notes for the year ended 31 December 2016 included in BP Annual Report and Form 20-F 2016. BP prepares its consolidated financial statements included within BP Annual Report and Form 20-F on the basis of International Financial Reporting Standards (IFRS) as issued by the International Accounting Standards Board (IASB), IFRS as adopted by the European Union (EU) and in accordance with the provisions of the UK Companies Act 2006. IFRS as adopted by the EU differs in certain respects from IFRS as issued by the IASB. The differences have no impact on the group’s consolidated financial statements for the periods presented. The financial information presented herein has been prepared in accordance with the accounting policies expected to be used in preparing BP Annual Report and Form 20-F 2017, which do not differ significantly from those used in BP Annual Report and Form 20-F 2016.
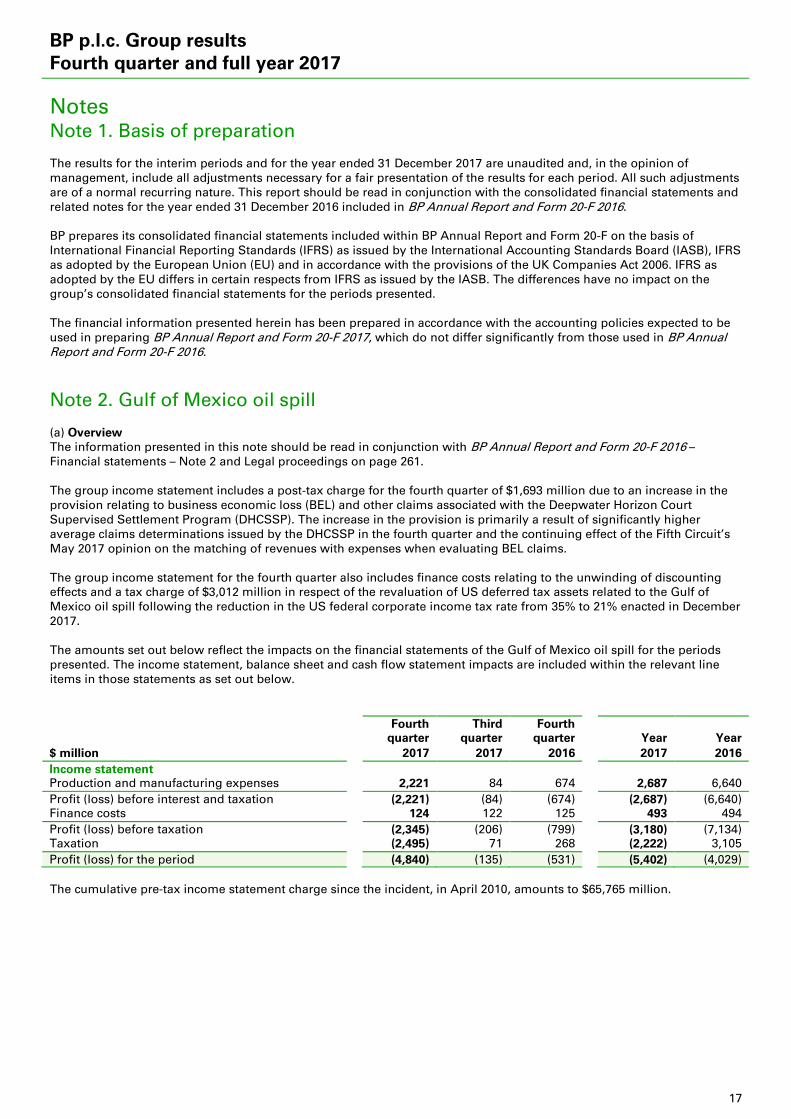
Note 2. Gulf of Mexico oil spill (a) Overview The information presented in this note should be read in conjunction with BP Annual Report and Form 20-F 2016 – Financial statements – Note 2 and Legal proceedings on page 261. The group income statement includes a post-tax charge for the fourth quarter of $1,693 million due to an increase in the provision relating to business economic loss (BEL) and other claims associated with the Deepwater Horizon Court Supervised Settlement Program (DHCSSP). The increase in the provision is primarily a result of significantly higher average claims determinations issued by the DHCSSP in the fourth quarter and the continuing effect of the Fifth Circuit’s May 2017 opinion on the matching of revenues with expenses when evaluating BEL claims. The group income statement for the fourth quarter also includes finance costs relating to the unwinding of discounting effects and a tax charge of $3,012 million in respect of the revaluation of US deferred tax assets related to the Gulf of Mexico oil spill following the reduction in the US federal corporate income tax rate from 35% to 21% enacted in December 2017. The amounts set out below reflect the impacts on the financial statements of the Gulf of Mexico oil spill for the periods presented. The income statement, balance sheet and cash flow statement impacts are included within the relevant line items in those statements as set out below.
Fourth Third Fourth quarter quarter quarter Year Year $ million 2017 2017 2016 2017 2016 Income statement Production and manufacturing expenses 2,221 84 674 2,687 6,640 Profit (loss) before interest and taxation (2,221) (84) (674) (2,687) (6,640) Finance costs 124 122 125 493 494 Profit (loss) before taxation (2,345) (206) (799) (3,180) (7,134) Taxation (2,495) 71 268 (2,222) 3,105 Profit (loss) for the period (4,840) (135) (531) (5,402) (4,029) The cumulative pre-tax income statement charge since the incident, in April 2010, amounts to $65,765 million.

18
BP p.l.c. Group results Fourth quarter and full year 2017
Note 2. Gulf of Mexico oil spill (continued) 31 December 31 December $ million 2017 2016 Balance sheet Current assets Trade and other receivables 252 194 Current liabilities Trade and other payables (2,089) (3,056) Provisions (1,439) (2,330) Net current assets (liabilities) (3,276) (5,192) Non-current assets Deferred tax assets 2,067 2,973 Non-current liabilities Other payables (12,253) (13,522) Provisions (1,141) (112) Deferred tax liabilities 3,634 5,119 Net non-current assets (liabilities) (7,693) (5,542) Net assets (liabilities) (10,969) (10,734) Fourth Third Fourth quarter quarter quarter Year Year $ million 2017 2017 2016 2017 2016 Cash flow statement - Operating activities Profit (loss) before taxation (2,345) (206) (799) (3,180) (7,134) Adjustments to reconcile profit (loss) before taxation to net cash provided by operating activities Net charge for interest and other finance expense, less net interest paid 124 122 125 493 494 Net charge for provisions, less payments 2,181 68 (376) 2,542 4,353 Movements in inventories and other current and non-current assets and liabilities (413) (548) (993) (5,191) (4,818) Pre-tax cash flows (453) (564) (2,043) (5,336) (7,105) Cash outflows in 2016 and 2017 include payments made under the 2012 agreement with the US government to resolve all federal criminal claims arising from the incident and the 2016 consent decree and settlement agreement with the United States and the five Gulf coast states. Net cash from operating activities relating to the Gulf of Mexico oil spill, on a post-tax basis, amounted to an outflow of $284 million and $5,167 million in the fourth quarter and full year of 2017 respectively. For the same periods in 2016, the amount was an outflow of $2,043 million and $6,892 million respectively.
19
BP p.l.c. Group results Fourth quarter and full year 2017
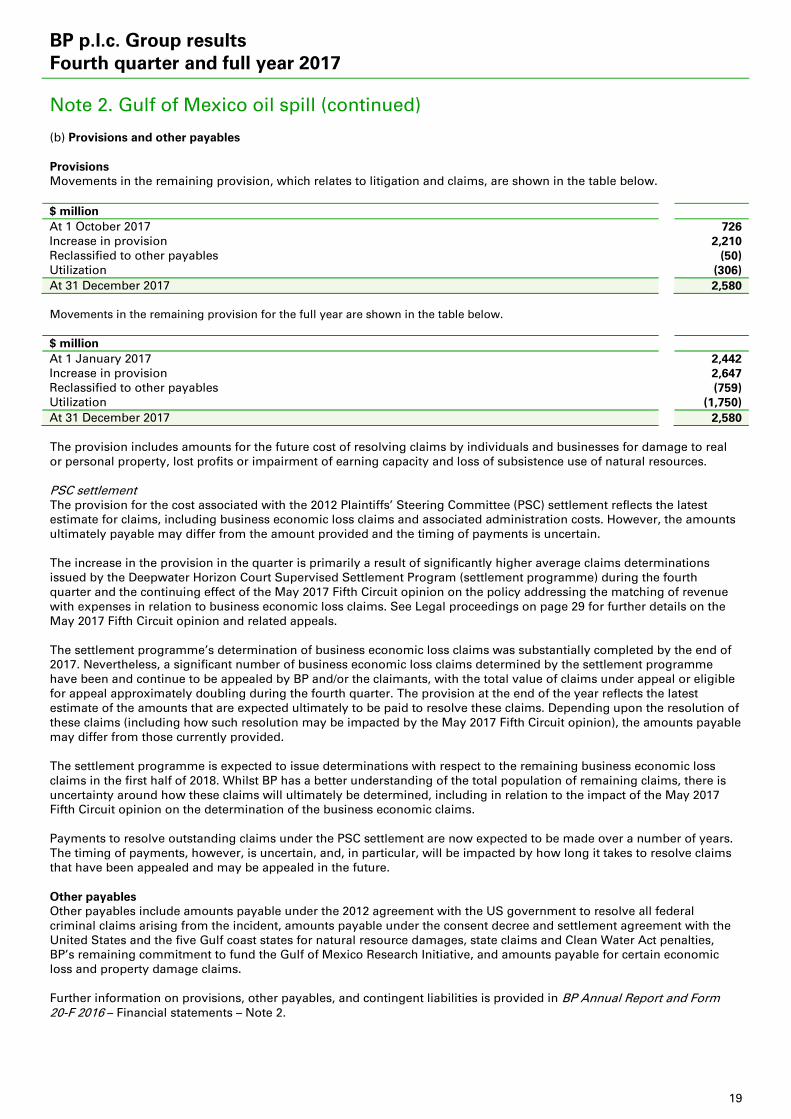
Note 2. Gulf of Mexico oil spill (continued) (b) Provisions and other payables Provisions Movements in the remaining provision, which relates to litigation and claims, are shown in the table below. $ million At 1 October 2017 726 Increase in provision 2,210 Reclassified to other payables (50) Utilization (306) At 31 December 2017 2,580 Movements in the remaining provision for the full year are shown in the table below. $ million At 1 January 2017 2,442 Increase in provision 2,647 Reclassified to other payables (759) Utilization (1,750) At 31 December 2017 2,580 The provision includes amounts for the future cost of resolving claims by individuals and businesses for damage to real or personal property, lost profits or impairment of earning capacity and loss of subsistence use of natural resources. PSC settlement The provision for the cost associated with the 2012 Plaintiffs’ Steering Committee (PSC) settlement reflects the latest estimate for claims, including business economic loss claims and associated administration costs. However, the amounts ultimately payable may differ from the amount provided and the timing of payments is uncertain. The increase in the provision in the quarter is primarily a result of significantly higher average claims determinations issued by the Deepwater Horizon Court Supervised Settlement Program (settlement programme) during the fourth quarter and the continuing effect of the May 2017 Fifth Circuit opinion on the policy addressing the matching of revenue with expenses in relation to business economic loss claims. See Legal proceedings on page 29 for further details on the May 2017 Fifth Circuit opinion and related appeals. The settlement programme’s determination of business economic loss claims was substantially completed by the end of 2017. Nevertheless, a significant number of business economic loss claims determined by the settlement programme have been and continue to be appealed by BP and/or the claimants, with the total value of claims under appeal or eligible for appeal approximately doubling during the fourth quarter. The provision at the end of the year reflects the latest estimate of the amounts that are expected ultimately to be paid to resolve these claims. Depending upon the resolution of these claims (including how such resolution may be impacted by the May 2017 Fifth Circuit opinion), the amounts payable may differ from those currently provided. The settlement programme is expected to issue determinations with respect to the remaining business economic loss claims in the first half of 2018. Whilst BP has a better understanding of the total population of remaining claims, there is uncertainty around how these claims will ultimately be determined, including in relation to the impact of the May 2017 Fifth Circuit opinion on the determination of the business economic claims. Payments to resolve outstanding claims under the PSC settlement are now expected to be made over a number of years. The timing of payments, however, is uncertain, and, in particular, will be impacted by how long it takes to resolve claims that have been appealed and may be appealed in the future. Other payables Other payables include amounts payable under the 2012 agreement with the US government to resolve all federal criminal claims arising from the incident, amounts payable under the consent decree and settlement agreement with the United States and the five Gulf coast states for natural resource damages, state claims and Clean Water Act penalties, BP’s remaining commitment to fund the Gulf of Mexico Research Initiative, and amounts payable for certain economic loss and property damage claims. Further information on provisions, other payables, and contingent liabilities is provided in BP Annual Report and Form 20-F 2016 – Financial statements – Note 2.

20
BP p.l.c. Group results Fourth quarter and full year 2017
Note 3. Analysis of replacement cost profit (loss) before interest and tax and reconciliation to profit (loss) before taxation Fourth Third Fourth quarter quarter quarter Year Year $ million 2017 2017 2016 2017 2016 Upstream 1,928 1,242 692 5,221 574 Downstream 1,773 2,175 899 7,221 5,162 Rosneft 321 137 158 836 590 Other businesses and corporate(a) (2,833) (460) (1,117) (4,445) (8,157) 1,189 3,094 632 8,833 (1,831) Consolidation adjustment – UPII* (149) (130) (132) (212) (196) RC profit (loss) before interest and tax* 1,040 2,964 500 8,621 (2,027) Inventory holding gains (losses)* Upstream – 13 19 8 60 Downstream 719 520 558 758 1,484 Rosneft (net of tax) 97 24 24 87 53 Profit (loss) before interest and tax 1,856 3,521 1,101 9,474 (430) Finance costs 616 511 434 2,074 1,675 Net finance expense relating to pensions and other post-retirement benefits 58 55 50 220 190 Profit (loss) before taxation 1,182 2,955 617 7,180 (2,295)
RC profit (loss) before interest and tax* US (1,509) 428 (1,646) (266) (8,311) Non-US 2,549 2,536 2,146 8,887 6,284 1,040 2,964 500 8,621 (2,027)
(a) Includes costs related to the Gulf of Mexico oil spill. See Note 2 for further information.
21
BP p.l.c. Group results Fourth quarter and full year 2017
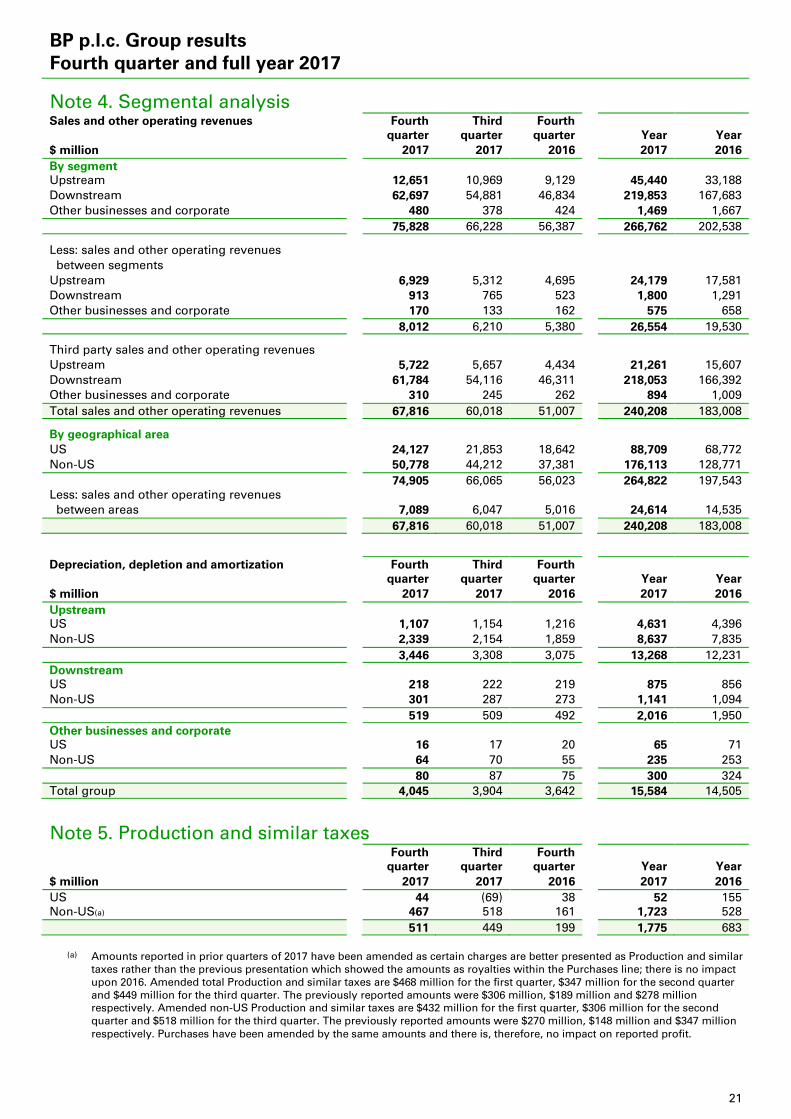
Note 4. Segmental analysis Sales and other operating revenues Fourth Third Fourth quarter quarter quarter Year Year $ million 2017 2017 2016 2017 2016 By segment Upstream 12,651 10,969 9,129 45,440 33,188 Downstream 62,697 54,881 46,834 219,853 167,683 Other businesses and corporate 480 378 424 1,469 1,667 75,828 66,228 56,387 266,762 202,538
Less: sales and other operating revenues between segments Upstream 6,929 5,312 4,695 24,179 17,581 Downstream 913 765 523 1,800 1,291 Other businesses and corporate 170 133 162 575 658 8,012 6,210 5,380 26,554 19,530
Third party sales and other operating revenues Upstream 5,722 5,657 4,434 21,261 15,607 Downstream 61,784 54,116 46,311 218,053 166,392 Other businesses and corporate 310 245 262 894 1,009 Total sales and other operating revenues 67,816 60,018 51,007 240,208 183,008
By geographical area US 24,127 21,853 18,642 88,709 68,772 Non-US 50,778 44,212 37,381 176,113 128,771 74,905 66,065 56,023 264,822 197,543 Less: sales and other operating revenues between areas 7,089 6,047 5,016 24,614 14,535
67,816 60,018 51,007 240,208 183,008
Depreciation, depletion and amortization Fourth Third Fourth quarter quarter quarter Year Year $ million 2017 2017 2016 2017 2016 Upstream US 1,107 1,154 1,216 4,631 4,396 Non-US 2,339 2,154 1,859 8,637 7,835 3,446 3,308 3,075 13,268 12,231 Downstream US 218 222 219 875 856 Non-US 301 287 273 1,141 1,094 519 509 492 2,016 1,950 Other businesses and corporate US 16 17 20 65 71 Non-US 64 70 55 235 253 80 87 75 300 324 Total group 4,045 3,904 3,642 15,584 14,505
Note 5. Production and similar taxes Fourth Third Fourth quarter quarter quarter Year Year $ million 2017 2017 2016 2017 2016 US 44 (69) 38 52 155 Non-US(a) 467 518 161 1,723 528
511 449 199 1,775 683
(a) Amounts reported in prior quarters of 2017 have been amended as certain charges are better presented as Production and similar taxes rather than the previous presentation which showed the amounts as royalties within the Purchases line; there is no impact upon 2016. Amended total Production and similar taxes are $468 million for the first quarter, $347 million for the second quarter and $449 million for the third quarter. The previously reported amounts were $306 million, $189 million and $278 million respectively. Amended non-US Production and similar taxes are $432 million for the first quarter, $306 million for the second quarter and $518 million for the third quarter. The previously reported amounts were $270 million, $148 million and $347 million respectively. Purchases have been amended by the same amounts and there is, therefore, no impact on reported profit.

22
BP p.l.c. Group results Fourth quarter and full year 2017
Note 6. Earnings per share and shares in issue Basic earnings per ordinary share (EpS) amounts are calculated by dividing the profit (loss) for the period attributable to ordinary shareholders by the weighted average number of ordinary shares outstanding during the period. During the quarter the company repurchased 51 million ordinary shares for a total consideration of $343 million, including transaction costs of $2 million, as part of the share buyback programme as announced on 31 October 2017. The number of shares in issue is reduced when shares are repurchased. The calculation of EpS is performed separately for each discrete quarterly period, and for the year-to-date period. As a result, the sum of the discrete quarterly EpS amounts in any particular year-to-date period may not be equal to the EpS amount for the year-to-date period. For the diluted EpS calculation the weighted average number of shares outstanding during the period is adjusted for the number of shares that are potentially issuable in connection with employee share-based payment plans using the treasury stock method.
Fourth Third Fourth quarter quarter quarter Year Year $ million 2017 2017 2016 2017 2016 Results for the period Profit (loss) for the period attributable to BP shareholders 27 1,769 497 3,389 115 Less: preference dividend – – – 1 1 Profit (loss) attributable to BP ordinary shareholders 27 1,769 497 3,388 114 Number of shares (thousand)(a) Basic weighted average number of shares outstanding 19,804,932 19,756,117 18,995,725 19,692,613 18,744,800 ADS equivalent 3,300,822 3,292,686 3,165,954 3,282,102 3,124,133 Weighted average number of shares outstanding used to calculate diluted earnings per share 19,929,655 19,866,745 19,107,599 19,816,442 18,855,319 ADS equivalent 3,321,609 3,311,124 3,184,599 3,302,740 3,142,553 Shares in issue at period-end 19,817,325 19,797,657 19,438,990 19,817,325 19,438,990 ADS equivalent 3,302,887 3,299,609 3,239,831 3,302,887 3,239,831
(a) Excludes treasury shares and includes certain shares that will be issued in the future under employee share-based payment plans.
Note 7. Dividends Dividends payable BP today announced an interim dividend of 10.00 cents per ordinary share which is expected to be paid on 29 March 2018 to shareholders and American Depositary Share (ADS) holders on the register on 16 February 2018. The corresponding amount in sterling is due to be announced on 19 March 2018, calculated based on the average of the market exchange rates for the four dealing days commencing on 13 March 2018. Holders of ADSs are expected to receive $0.600 per ADS (less applicable fees). A scrip dividend alternative is available, allowing shareholders to elect to receive their dividend in the form of new ordinary shares and ADS holders in the form of new ADSs. Details of the fourth quarter dividend and timetable are available at bp.com/dividends and details of the scrip dividend programme are available at bp.com/scrip.
Fourth Third Fourth quarter quarter quarter Year Year 2017 2017 2016 2017 2016 Dividends paid per ordinary share cents 10.000 10.000 10.000 40.000 40.000 pence 7.443 7.621 7.931 30.979 29.418 Dividends paid per ADS (cents) 60.00 60.00 60.00 240.00 240.00 Scrip dividends Number of shares issued (millions) 53.3 51.3 129.2 289.8 548.0 Value of shares issued ($ million) 354 298 710 1,714 2,858

23
BP p.l.c. Group results Fourth quarter and full year 2017
Note 8. Net Debt* Net debt ratio * Fourth Third Fourth quarter quarter quarter Year Year $ million 2017 2017 2016 2017 2016 Gross debt 63,230 65,784 58,300 63,230 58,300 Fair value (asset) liability of hedges related to finance debt(a) 175 (227) 697 175 697 63,405 65,557 58,997 63,405 58,997 Less: cash and cash equivalents 25,586 25,780 23,484 25,586 23,484 Net debt 37,819 39,777 35,513 37,819 35,513 Equity 100,404 100,138 96,843 100,404 96,843 Net debt ratio 27.4% 28.4% 26.8% 27.4% 26.8% Analysis of changes in net debt Fourth Third Fourth quarter quarter quarter Year Year $ million 2017 2017 2016 2017 2016 Opening balance Finance debt 65,784 63,004 58,997 58,300 53,168 Fair value (asset) liability of hedges related to finance debt(a) (227) 60 (1,113) 697 379 Less: cash and cash equivalents 25,780 23,270 25,520 23,484 26,389 Opening net debt 39,777 39,794 32,364 35,513 27,158 Closing balance Finance debt 63,230 65,784 58,300 63,230 58,300 Fair value (asset) liability of hedges related to finance debt(a) 175 (227) 697 175 697 Less: cash and cash equivalents 25,586 25,780 23,484 25,586 23,484 Closing net debt 37,819 39,777 35,513 37,819 35,513 Decrease (increase) in net debt 1,958 17 (3,149) (2,306) (8,355) Movement in cash and cash equivalents (excluding exchange adjustments) (223) 2,364 (1,387) 1,558 (2,085) Net cash outflow (inflow) from financing(b) 2,753 (1,962) (1,711) (2,278) (5,808) Other movements (299) (186) (146) (564) 278 Movement in net debt before exchange effects 2,231 216 (3,244) (1,284) (7,615) Exchange adjustments (273) (199) 95 (1,022) (740) Decrease (increase) in net debt 1,958 17 (3,149) (2,306) (8,355)
(a) Derivative financial instruments entered into for the purpose of managing interest rate and foreign currency exchange risk associated with net debt with a fair value liability position of $634 million (third quarter 2017 liability of $883 million and fourth quarter 2016 liability of $1,962 million) are not included in the calculation of net debt shown above as hedge accounting is not applied for these instruments.
(b) Comprises proceeds and repayments of long-term financing and net (increase) decrease in short-term debt.
Note 9. Inventory valuation A provision of $474 million was held at 31 December 2017 ($501 million at 30 September 2017 and $501 million at 31 December 2016) to write inventories down to their net realizable value. The net movement credited to the income statement during the fourth quarter 2017 was $24 million (third quarter 2017 was a credit of $131 million and fourth quarter 2016 was a charge of $13 million).
Note 10. Statutory accounts The financial information shown in this publication, which was approved by the Board of Directors on 5 February 2018, is unaudited and does not constitute statutory financial statements. Audited financial information will be published in BP Annual Report and Form 20-F 2017. BP Annual Report and Form 20-F 2016 has been filed with the Registrar of Companies in England and Wales. The report of the auditor on those accounts was unqualified and did not contain a statement under section 498(2) or section 498(3) of the UK Companies Act 2006.

24
BP p.l.c. Group results Fourth quarter and full year 2017
Additional information Capital expenditure* Fourth Third Fourth quarter quarter quarter Year Year $ million 2017 2017 2016 2017 2016 Capital expenditure on a cash basis Organic capital expenditure* 4,622 3,993 4,473 16,501 16,675 Inorganic capital expenditure*(a) 199 470 449 1,339 777 4,821 4,463 4,922 17,840 17,452 Fourth Third Fourth quarter quarter quarter Year Year $ million 2017 2017 2016 2017 2016 Organic capital expenditure by segment Upstream US 726 827 602 2,999 3,415 Non-US 2,819 2,601 2,918 10,764 10,929 3,545 3,428 3,520 13,763 14,344 Downstream US 349 159 303 809 774 Non-US 598 356 530 1,590 1,328 947 515 833 2,399 2,102 Other businesses and corporate US 30 10 25 64 32 Non-US 100 40 95 275 197 130 50 120 339 229 4,622 3,993 4,473 16,501 16,675 Organic capital expenditure by geographical area US 1,105 996 930 3,872 4,221 Non-US 3,517 2,997 3,543 12,629 12,454 4,622 3,993 4,473 16,501 16,675
(a) Third quarter and full year 2017 include amounts paid to acquire interests in Mauritania and Senegal and other items. Full year 2017 also includes amounts paid to purchase an interest in the Zohr gas field in Egypt and in exploration blocks in Senegal.

25
BP p.l.c. Group results Fourth quarter and full year 2017
Non-operating items* Fourth Third Fourth quarter quarter quarter Year Year $ million 2017 2017 2016 2017 2016 Upstream Impairment and gain (loss) on sale of businesses and fixed assets(a)(b) (181) 18 479 (563) 2,391 Environmental and other provisions 1 – – 1 (8) Restructuring, integration and rationalization costs (4) (3) (71) (24) (373) Fair value gain (loss) on embedded derivatives 2 1 (17) 33 32 Other(b)(c) 38 (162) 245 (118) (289) (144) (146) 636 (671) 1,753 Downstream Impairment and gain (loss) on sale of businesses and fixed assets(d) 469 (35) 72 579 405 Environmental and other provisions (19) – 2 (19) (73) Restructuring, integration and rationalization costs (69) (19) (103) (171) (300) Fair value gain (loss) on embedded derivatives – – – – – Other 1 (1) (48) – (56) 382 (55) (77) 389 (24) Rosneft Impairment and gain (loss) on sale of businesses and fixed assets – – 62 – 62 Environmental and other provisions – – – – – Restructuring, integration and rationalization costs – – – – – Fair value gain (loss) on embedded derivatives – – – – – Other – – (39) – (39) – – 23 – 23 Other businesses and corporate Impairment and gain (loss) on sale of businesses and fixed assets (16) 1 2 (22) – Environmental and other provisions (153) – – (156) (134) Restructuring, integration and rationalization costs (35) (6) (21) (72) (90) Fair value gain (loss) on embedded derivatives – – – – – Gulf of Mexico oil spill(e) (2,221) (84) (674) (2,687) (6,640) Other (14) 27 – 90 (55) (2,439) (62) (693) (2,847) (6,919) Total before interest and taxation (2,201) (263) (111) (3,129) (5,167) Finance costs(e) (124) (122) (125) (493) (494) Total before taxation (2,325) (385) (236) (3,622) (5,661) Taxation credit (charge) on non-operating items(f) 669 111 56 1,172 2,833 Taxation – impact of US tax reform(g) (859) – – (859) – Total after taxation for period (2,515) (274) (180) (3,309) (2,828)
(a) Fourth quarter and full year 2017 include an impairment charge relating to the US Lower 48 business, partially offset by gains associated with asset divestments. In addition, full year 2017 includes an impairment charge arising following the announcement of the agreement to sell the Forties Pipeline System business to INEOS. Fourth quarter and full year 2016 principally relate to impairment reversals.
(b) Fourth quarter and full year 2016 include a $319-million exploration write-back relating to Block KG D6 in India. In addition, an impairment reversal of $234 million was also recorded in relation to this block.
(c) Fourth quarter and full year 2017 include BP’s share of an impairment reversal recognized by the Angola LNG equity-accounted entity, partially offset by other items. Third quarter and full year 2017 include the write-off of $145 million in relation to the value ascribed to certain licences in the deepwater Gulf of Mexico as part of the accounting for the acquisition of upstream assets from Devon Energy in 2011. Full year 2016 includes the write-off of $334 million in relation to the value ascribed to the licence in Brazil as part of the accounting for the acquisition of upstream assets from Devon Energy in 2011.
(d) Fourth quarter and full year 2017 gain primarily reflects the disposal of our shareholding in the SECCO joint venture. (e) See Note 2 for further details regarding costs relating to the Gulf of Mexico oil spill. (f) Fourth quarter and full year 2017 include the tax effect of the increase in the provision in the fourth quarter for business economic
loss and other claims associated with the Deepwater Horizon Court Supervised Settlement Program (DHCSSP) at the new US tax rate.
(g) Fourth quarter and full year 2017 include the impact of US tax reform, which reduced the US federal corporate income tax rate from 35% to 21% effective from 1 January 2018. The impact disclosed has been calculated as the change in deferred tax balances at 31 December 2017, excluding the increase in the provision in the fourth quarter for business economic loss and other claims associated with the DHCSSP, which arises following the reduction in the tax rate. The impact of the US tax reform has been treated as a non-operating item because it is not considered to be part of underlying business operations, has a material impact upon the reported result and is substantially impacted by Gulf of Mexico oil spill charges, which are also treated as non-operating items. Separate disclosure is considered meaningful and relevant to investors.

26
BP p.l.c. Group results Fourth quarter and full year 2017
Non-GAAP information on fair value accounting effects Fourth Third Fourth quarter quarter quarter Year Year $ million 2017 2017 2016 2017 2016 Favourable (adverse) impact relative to management’s measure of performance Upstream (151) (174) (344) 27 (637) Downstream (83) (108) 99 (135) (448) (234) (282) (245) (108) (1,085) Taxation credit (charge) 59 70 97 12 329 (175) (212) (148) (96) (756) BP uses derivative instruments to manage the economic exposure relating to inventories above normal operating requirements of crude oil, natural gas and petroleum products. Under IFRS, these inventories are recorded at historical cost. The related derivative instruments, however, are required to be recorded at fair value with gains and losses recognized in the income statement. This is because hedge accounting is either not permitted or not followed, principally due to the impracticality of effectiveness-testing requirements. Therefore, measurement differences in relation to recognition of gains and losses occur. Gains and losses on these inventories are not recognized until the commodity is sold in a subsequent accounting period. Gains and losses on the related derivative commodity contracts are recognized in the income statement, from the time the derivative commodity contract is entered into, on a fair value basis using forward prices consistent with the contract maturity. BP enters into physical commodity contracts to meet certain business requirements, such as the purchase of crude for a refinery or the sale of BP’s gas production. Under IFRS these physical contracts are treated as derivatives and are required to be fair valued when they are managed as part of a larger portfolio of similar transactions. In addition, derivative instruments are used to manage the price risk associated with certain future natural gas sales. Gains and losses arising are recognized in the income statement from the time the derivative commodity contract is entered into. IFRS require that inventory held for trading is recorded at its fair value using period-end spot prices, whereas any related derivative commodity instruments are required to be recorded at values based on forward prices consistent with the contract maturity. Depending on market conditions, these forward prices can be either higher or lower than spot prices, resulting in measurement differences. BP enters into contracts for pipelines and storage capacity, oil and gas processing and liquefied natural gas (LNG) that, under IFRS, are recorded on an accruals basis. These contracts are risk-managed using a variety of derivative instruments that are fair valued under IFRS. This results in measurement differences in relation to recognition of gains and losses. The way that BP manages the economic exposures described above, and measures performance internally, differs from the way these activities are measured under IFRS. BP calculates this difference for consolidated entities by comparing the IFRS result with management’s internal measure of performance. Under management’s internal measure of performance the inventory and capacity contracts in question are valued based on fair value using relevant forward prices prevailing at the end of the period. The fair values of certain derivative instruments used to risk manage certain LNG and oil and gas contracts and gas sales contracts, are deferred to match with the underlying exposure and the commodity contracts for business requirements are accounted for on an accruals basis. We believe that disclosing management’s estimate of this difference provides useful information for investors because it enables investors to see the economic effect of these activities as a whole. The impacts of fair value accounting effects, relative to management’s internal measure of performance, are shown in the table above. A reconciliation to GAAP information is set out below.
Fourth Third Fourth quarter quarter quarter Year Year $ million 2017 2017 2016 2017 2016 Upstream Replacement cost profit before interest and tax adjusted for fair value accounting effects 2,079 1,416 1,036 5,194 1,211 Impact of fair value accounting effects (151) (174) (344) 27 (637) Replacement cost profit before interest and tax 1,928 1,242 692 5,221 574 Downstream Replacement cost profit before interest and tax adjusted for fair value accounting effects 1,856 2,283 800 7,356 5,610 Impact of fair value accounting effects (83) (108) 99 (135) (448) Replacement cost profit before interest and tax 1,773 2,175 899 7,221 5,162 Total group Profit (loss) before interest and tax adjusted for fair value accounting effects 2,090 3,803 1,346 9,582 655 Impact of fair value accounting effects (234) (282) (245) (108) (1,085) Profit (loss) before interest and tax 1,856 3,521 1,101 9,474 (430)

27
BP p.l.c. Group results Fourth quarter and full year 2017
Readily marketable inventory* (RMI) 31 December 31 December $ million 2017 2016 RMI at fair value* 5,661 5,952 Paid-up RMI* 2,688 2,705 Readily marketable inventory (RMI) is oil and oil products inventory held and price risk-managed by BP’s integrated supply and trading function (IST) which could be sold to generate funds if required. Paid-up RMI is RMI that BP has paid for. We believe that disclosing the amounts of RMI and paid-up RMI is useful to investors as it enables them to better understand and evaluate the group’s inventories and liquidity position by enabling them to see the level of discretionary inventory held by IST and to see builds or releases of liquid trading inventory. See the Glossary on page 30 for a more detailed definition of RMI. RMI, RMI at fair value, paid-up RMI and unpaid RMI are non-GAAP measures. A reconciliation of total inventory as reported on the group balance sheet to paid-up RMI is provided below. 31 December 31 December $ million 2017 2016 Reconciliation of total inventory to paid-up RMI Inventories as reported on the group balance sheet 19,011 17,655 Less: (a) inventories which are not oil and oil products and (b) oil and oil product inventories which are not risk-managed by IST (13,929) (12,131) RMI on an IFRS basis 5,082 5,524 Plus: difference between RMI at fair value and RMI on an IFRS basis 579 428 RMI at fair value 5,661 5,952 Less: unpaid RMI* at fair value (2,973) (3,247) Paid-up RMI 2,688 2,705

28
BP p.l.c. Group results Fourth and full year 2017
Realizations* and marker prices Fourth Third Fourth quarter quarter quarter Year Year 2017 2017 2016 2017 2016 Average realizations(a) Liquids* ($/bbl) US 51.50 43.58 41.93 46.55 36.25 Europe 57.92 50.02 45.66 52.13 40.53 Rest of World(b) 59.09 49.54 45.27 51.83 39.29 BP Average(b) 56.16 47.45 43.89 49.92 38.27 Natural gas ($/mcf) US 2.28 2.34 2.29 2.36 1.90 Europe 5.56 5.10 4.81 5.09 4.40 Rest of World 3.51 3.03 3.35 3.45 3.19 BP Average 3.23 2.89 3.08 3.19 2.84 Total hydrocarbons* ($/boe) US 35.75 31.30 30.32 33.47 25.76 Europe 52.17 45.26 40.48 46.09 36.31 Rest of World(b) 37.27 33.13 30.98 35.44 28.62 BP Average(b) 37.48 33.23 31.40 35.38 28.24 Average oil marker prices ($/bbl) Brent 61.26 52.08 49.33 54.19 43.73 West Texas Intermediate 55.23 48.18 49.23 50.79 43.34 Western Canadian Select 38.74 38.16 35.44 38.55 30.78 Alaska North Slope 61.31 52.04 50.06 54.43 43.67 Mars 57.70 48.46 46.23 50.65 40.14 Urals (NWE – cif) 60.17 50.73 47.73 52.84 41.68 Average natural gas marker prices Henry Hub gas price(c) ($/mmBtu) 2.93 2.99 2.98 3.11 2.46 UK Gas – National Balancing Point (p/therm) 51.94 41.59 45.76 44.95 34.63
(a) Based on sales of consolidated subsidiaries only – this excludes equity-accounted entities. (b) Production volume recognition methodology for our Technical Service Contract arrangement in Iraq has been simplified to
exclude the impact of oil price movements on lifting imbalances. A minor adjustment has been made to fourth quarter and full year 2016. There is no impact on the financial results.
(c) Henry Hub First of Month Index.
Exchange rates Fourth Third Fourth quarter quarter quarter Year Year 2017 2017 2016 2017 2016 $/£ average rate for the period 1.33 1.31 1.24 1.29 1.35 $/£ period-end rate 1.34 1.34 1.22 1.34 1.22
$/€ average rate for the period 1.18 1.17 1.08 1.13 1.11 $/€ period-end rate 1.19 1.18 1.05 1.19 1.05
Rouble/$ average rate for the period 58.46 58.99 63.12 58.36 67.06 Rouble/$ period-end rate 57.60 57.94 60.63 57.60 60.63
29
BP p.l.c. Group results Fourth quarter and full year 2017
Legal proceedings The following discussion sets out the material developments in the group’s material legal proceedings during the fourth quarter. For a full discussion of the group’s material legal proceedings, see pages 261-265 of BP Annual Report and Form 20-F 2016, and page 35 of BP p.l.c. Group results second quarter and half year 2017. Matters relating to the Deepwater Horizon accident and oil spill (the Incident) Plaintiffs’ Steering Committee (PSC) settlements – Economic and Property Damages Settlement Agreement The Economic and Property Damages Settlement established a court-supervised settlement programme (CSSP) to resolve certain economic and property damage claims arising from the Incident. Following numerous court decisions, on 31 March 2015, the United States district court in New Orleans denied the PSC motion seeking to alter or amend a revised policy relating to business economic loss claims. Such policy required the matching of revenue with the expenses incurred by claimants to generate that revenue, even where the revenue and expenses were recorded at different times. The PSC appealed the district court decision and, on 22 May 2017, the Fifth Circuit issued an opinion upholding the policy in part and reversing the policy in part. The Fifth Circuit ordered that the portion of the policy upheld, which covers the substantial majority of the remaining business economic loss claims, be applied as the governing methodology for all applicable business economic loss claims. BP filed a petition for a rehearing which was denied on 21 June 2017. In May to July 2017, the district court issued a series of orders instructing the CSSP on how to implement the Fifth Circuit’s opinion. On 10 August 2017, the district court denied BP’s motion to clarify or reconsider these orders. BP appealed all of these orders and decisions on 8 September 2017; the appeals have been consolidated with four appeals filed by claimants in early to mid-September 2017 challenging the same set of orders and decisions, albeit raising different issues than are raised by BP’s appeal. These appeals are currently pending before the Fifth Circuit. As a result of significantly higher average claims determinations issued by the CSSP in the period and the continuing effect of the May 2017 Fifth Circuit opinion, the provision for the costs associated with the 2012 PSC settlement was increased in the fourth quarter of 2017. The amounts ultimately payable may differ from the amount provided and the timing of payments is uncertain. See Note 2 on page 17 for further details. Other civil complaints Following numerous court decisions, on 11 January 2018, the United States district court in New Orleans issued an order requiring all remaining private plaintiffs with economic loss or property damage claims outside of the CSSP to file by 11 April 2018 a verified sworn statement regarding the actual damages each such plaintiff seeks in its pending litigation and an explanation of how those alleged damages were causally related to the Incident. Non-US government lawsuits On 3 December 2015 and 29 March 2016, Acciones Colectivas de Sinaloa filed two class actions (which have since been consolidated) in a Mexican Federal District Court on behalf of several Mexican states against BP Exploration & Production Inc., BP America Production Company (BPAPC), and other purported BP subsidiaries. In these class actions, plaintiffs seek an order requiring the BP defendants to repair the damage to the Gulf of Mexico, to pay penalties, and to compensate plaintiffs for damage to property, to health and for economic loss. BP was formally served with the action on 8 December 2017. Other legal proceedings California False Claims Act matters On 4 November 2014, the California Attorney General filed a notice in California state court that it was intervening in a previously-sealed California False Claims Act (CFCA) lawsuit filed by relator Christopher Schroen against BP, BP Energy Company, BP Corporation North America Inc., BP Products and BPAPC. On 7 January 2015, the California Attorney General filed a complaint in intervention alleging that BP violated the CFCA and the California Unfair Competition Law by falsely and fraudulently overcharging California state entities for natural gas and making similar allegations in addition to individual claims. In January 2018 the parties reached a settlement pursuant to which BP, while denying liability, agreed to pay $102 million to the state of California.
30
BP p.l.c. Group results Fourth quarter and full year 2017
Glossary Non-GAAP measures are provided for investors because they are closely tracked by management to evaluate BP’s operating performance and to make financial, strategic and operating decisions. Adjusted effective tax rate (ETR) is a non-GAAP measure. The adjusted ETR is calculated by dividing taxation on an underlying RC basis by underlying RC profit or loss before tax. Taxation on an underlying RC basis is taxation on a RC basis for the period adjusted for taxation on non-operating items and fair value accounting effects. For the 2016 calculation, taxation on an underlying RC basis also reflects an adjustment to eliminate a $434-million credit that arises from the reduction in the rate of the North Sea supplementary charge in the third quarter of 2016. Information on underlying RC profit or loss is provided below. BP believes it is helpful to disclose the adjusted ETR because this measure may help investors to understand and evaluate, in the same manner as management, the underlying trends in BP’s operational performance on a comparable basis, period on period. The nearest equivalent measure on an IFRS basis is the ETR on profit or loss for the period. BP-operated Upstream plant reliability is calculated taking 100% less the ratio of total unplanned plant deferrals divided by installed production capacity. Unplanned plant deferrals are associated with the topside plant and where applicable the subsea equipment (excluding wells and reservoir). Unplanned plant deferrals include breakdowns, which does not include weather related downtime. Capital expenditure is total cash capital expenditure as stated in the condensed group cash flow statement. Consolidation adjustment – UPII is unrealized profit in inventory arising on inter-segment transactions. Divestment proceeds are disposal proceeds as per the condensed group cash flow statement. Effective tax rate (ETR) on replacement cost (RC) profit or loss is a non-GAAP measure. The ETR on RC profit or loss is calculated by dividing taxation on a RC basis by RC profit or loss before tax. Information on RC profit or loss is provided below. BP believes it is helpful to disclose the ETR on RC profit or loss because this measure excludes the impact of price changes on the replacement of inventories and allows for more meaningful comparisons between reporting periods. The nearest equivalent measure on an IFRS basis is the ETR on profit or loss for the period. Fair value accounting effects are non-GAAP adjustments to our IFRS profit (loss) relating to certain physical inventories, pipelines and storage capacity. Management uses a fair-value basis to value these items which, under IFRS, are accounted for on an accruals basis with the exception of trading inventories, which are valued using spot prices. The adjustments have the effect of aligning the valuation basis of the physical positions with that of any associated derivative instruments, which are required to be fair valued under IFRS, in order to provide a more representative view of the ultimate economic value. Further information is provided on page 26. Gearing – See Net debt and net debt ratio definition. Hydrocarbons – Liquids and natural gas. Natural gas is converted to oil equivalent at 5.8 billion cubic feet = 1 million barrels. Inorganic capital expenditure is a subset of capital expenditure and is a non-GAAP measure. Inorganic capital expenditure comprises consideration in business combinations and certain other significant investments made by the group. It is reported on a cash basis. BP believes that this measure provides useful information as it allows investors to understand how BP’s management invests funds in projects which expand the group’s activities through acquisition. Further information and a reconciliation to GAAP information is provided on page 24. Inventory holding gains and losses represent the difference between the cost of sales calculated using the replacement cost of inventory and the cost of sales calculated on the first-in first-out (FIFO) method after adjusting for any changes in provisions where the net realizable value of the inventory is lower than its cost. Under the FIFO method, which we use for IFRS reporting, the cost of inventory charged to the income statement is based on its historical cost of purchase or manufacture, rather than its replacement cost. In volatile energy markets, this can have a significant distorting effect on reported income. The amounts disclosed represent the difference between the charge to the income statement for inventory on a FIFO basis (after adjusting for any related movements in net realizable value provisions) and the charge that would have arisen based on the replacement cost of inventory. For this purpose, the replacement cost of inventory is calculated using data from each operation’s production and manufacturing system, either on a monthly basis, or separately for each transaction where the system allows this approach. The amounts disclosed are not separately reflected in the financial statements as a gain or loss. No adjustment is made in respect of the cost of inventories held as part of a trading position and certain other temporary inventory positions. See Replacement cost (RC) profit or loss definition below. Liquids – Liquids for Upstream and Rosneft comprises crude oil, condensate and natural gas liquids. For Upstream, liquids also includes bitumen.
31
BP p.l.c. Group results Fourth quarter and full year 2017
Glossary (continued) Major projects have a BP net investment of at least $250 million, or are considered to be of strategic importance to BP or of a high degree of complexity. Net debt and net debt ratio are non-GAAP measures. Net debt is calculated as gross finance debt, as shown in the balance sheet, plus the fair value of associated derivative financial instruments that are used to hedge foreign currency exchange and interest rate risks relating to finance debt, for which hedge accounting is applied, less cash and cash equivalents. The net debt ratio is defined as the ratio of net debt to the total of net debt plus shareholders’ equity. All components of equity are included in the denominator of the calculation. BP believes these measures provide useful information to investors. Net debt enables investors to see the economic effect of gross debt, related hedges and cash and cash equivalents in total. The net debt ratio enables investors to see how significant net debt is relative to equity from shareholders. The derivatives are reported on the balance sheet within the headings ‘Derivative financial instruments’. The nearest equivalent GAAP measures on an IFRS basis are gross debt and gross debt ratio. A reconciliation of gross debt to net debt is provided on page 23. Net wind generation capacity is the sum of the rated capacities of the assets/turbines that have entered into commercial operation, including BP’s share of equity-accounted entities. The gross data is the equivalent capacity on a gross-JV basis, which includes 100% of the capacity of equity-accounted entities where BP has partial ownership. Non-operating items are charges and credits included in the financial statements that BP discloses separately because it considers such disclosures to be meaningful and relevant to investors. They are items that management considers not to be part of underlying business operations and are disclosed in order to enable investors better to understand and evaluate the group’s reported financial performance. Non-operating items within equity-accounted earnings are reported net of incremental income tax reported by the equity-accounted entity. An analysis of non-operating items by region is shown on pages 7, 9 and 11, and by segment and type is shown on page 25. Operating cash flow is net cash provided by (used in) operating activities as stated in the condensed group cash flow statement. When used in the context of a segment rather than the group, the terms refer to the segment’s share thereof. Operating cash flow excluding amounts related to the Gulf of Mexico oil spill / Gulf of Mexico oil spill payments or Underlying operating cash flow is a non-GAAP measure calculated by excluding post-tax operating cash flows relating to the Gulf of Mexico oil spill as reported in Note 2 from Net cash provided by operating activities as reported in the condensed group cash flow statement. BP believes it is helpful to disclose net cash provided by operating activities excluding amounts related to the Gulf of Mexico oil spill because this measure allows for more meaningful comparisons between reporting periods. The nearest equivalent measure on an IFRS basis is Net cash provided by operating activities. Operating cash margin is operating cash flow divided by the applicable number of barrels of oil equivalent produced, at $52/bbl flat oil prices. Expected operating cash margins are calculated over the period 2016-2025. Organic balance and organic cash balance are non-GAAP terms that refer to the point BP’s organic sources of cash equal organic uses of cash. Organic sources of cash and organic uses of cash are referred to as organic cash flows which is also a non-GAAP measure. Organic sources of cash is the sum of operating cash flow, excluding amounts related to the Gulf of Mexico oil spill, and proceeds of loan repayments. Organic uses of cash is organic capital expenditure plus dividends. BP believes that the organic balance point is useful for investors because it is closely tracked by management to evaluate BP’s financial performance and to make financial, strategic and operating decisions and because it may help investors to understand and evaluate, in the same manner as management. The nearest equivalent measure on an IFRS basis for organic sources of cash is net cash provided by operating activities and the nearest equivalent measures on an IFRS basis for organic uses of cash are total cash capital expenditure and dividends paid – BP shareholders. Organic capital expenditure is a subset of capital expenditure and is a non-GAAP measure. Organic capital expenditure comprises capital expenditure less inorganic capital expenditure. BP believes that this measure provides useful information as it allows investors to understand how BP’s management invests funds in developing and maintaining the group’s assets. An analysis of organic capital expenditure by segment and region, and a reconciliation to GAAP information is provided on page 24. Production-sharing agreement (PSA) / Production-sharing contract is an arrangement through which an oil company bears the risks and costs of exploration, development and production. In return, if exploration is successful, the oil company receives entitlement to variable physical volumes of hydrocarbons, representing recovery of the costs incurred and a stipulated share of the production remaining after such cost recovery.

32
BP p.l.c. Group results Fourth quarter and full year 2017
Glossary (continued) Readily marketable inventory (RMI) is inventory held and price risk-managed by our integrated supply and trading function (IST) which could be sold to generate funds if required. It comprises oil and oil products for which liquid markets are available and excludes inventory which is required to meet operational requirements and other inventory which is not price risk-managed. RMI is reported at fair value. Inventory held by the Downstream fuels business for the purpose of sales and marketing, and all inventories relating to the lubricants and petrochemicals businesses, are not included in RMI. Paid-up RMI excludes RMI which has not yet been paid for. For inventory that is held in storage, a first-in first-out (FIFO) approach is used to determine whether inventory has been paid for or not. Unpaid RMI is RMI which has not yet been paid for by BP. RMI, RMI at fair value, Paid-up RMI and Unpaid RMI are non-GAAP measures. Further information is provided on page 27. Realizations are the result of dividing revenue generated from hydrocarbon sales, excluding revenue generated from purchases made for resale and royalty volumes, by revenue generating hydrocarbon production volumes. Revenue generating hydrocarbon production reflects the BP share of production as adjusted for any production which does not generate revenue. Adjustments may include losses due to shrinkage, amounts consumed during processing, and contractual or regulatory host committed volumes such as royalties. Refining availability represents Solomon Associates’ operational availability, which is defined as the percentage of the year that a unit is available for processing after subtracting the annualized time lost due to turnaround activity and all planned mechanical, process and regulatory downtime. The Refining marker margin (RMM) is the average of regional indicator margins weighted for BP’s crude refining capacity in each region. Each regional marker margin is based on product yields and a marker crude oil deemed appropriate for the region. The regional indicator margins may not be representative of the margins achieved by BP in any period because of BP’s particular refinery configurations and crude and product slate. Replacement cost (RC) profit or loss reflects the replacement cost of inventories sold in the period and is arrived at by excluding inventory holding gains and losses from profit or loss. RC profit or loss is the measure of profit or loss that is required to be disclosed for each operating segment under IFRS. RC profit or loss for the group is not a recognized GAAP measure. BP believes this measure is useful to illustrate to investors the fact that crude oil and product prices can vary significantly from period to period and that the impact on our reported result under IFRS can be significant. Inventory holding gains and losses vary from period to period due to changes in prices as well as changes in underlying inventory levels. In order for investors to understand the operating performance of the group excluding the impact of price changes on the replacement of inventories, and to make comparisons of operating performance between reporting periods, BP’s management believes it is helpful to disclose this measure. The nearest equivalent measure on an IFRS basis is profit or loss attributable to BP shareholders. RC profit or loss per share is a non-GAAP measure. Earnings per share is defined in Note 6. RC profit or loss per share is calculated using the same denominator. The numerator used is RC profit or loss attributable to BP shareholders rather than profit or loss attributable to BP shareholders. BP believes it is helpful to disclose the RC profit or loss per share because this measure excludes the impact of price changes on the replacement of inventories and allows for more meaningful comparisons between reporting periods. The nearest equivalent measure on an IFRS basis is basic earnings per share based on profit or loss for the period attributable to BP shareholders. Reported recordable injury frequency measures the number of reported work-related employee and contractor incidents that result in a fatality or injury per 200,000 hours worked. This represents reported incidents occurring within BP’s operational HSSE reporting boundary. That boundary includes BP’s own operated facilities and certain other locations or situations. Reserves replacement ratio is the extent to which production is replaced by proved reserves additions. This ratio is expressed in oil equivalent terms and includes changes resulting from revisions to previous estimates, improved recovery, and extensions and discoveries. Return on average capital employed (ROACE) is a non-GAAP measure and is underlying replacement cost profit, after adding back non-controlling interest and interest expense net of notional tax at an assumed 35%, divided by average capital employed, excluding cash and cash equivalents and goodwill. Interest expense is finance cost excluding the unwinding of the discount on provisions and other payables, and for full year 2017 interest expense was $1,421 million before tax. BP believes it is helpful to disclose the ROACE because this measure gives an indication of the company’s capital efficiency. The nearest GAAP measures of the numerator and denominator are profit or loss for the period attributable to BP shareholders and average capital employed respectively. Tier 1 process safety events are losses of primary containment from a process of greatest consequence – causing harm to a member of the workforce, costly damage to equipment or exceeding defined quantities. This represents reported incidents occurring within BP’s operational HSSE reporting boundary. That boundary includes BP’s own operated facilities and certain other locations or situations.

33
BP p.l.c. Group results Fourth quarter and full year 2017
Glossary (continued) Underlying production is production after adjusting for divestments and entitlement impacts in our production-sharing agreements. 2017 underlying production does not include the Abu Dhabi onshore concession renewal. Underlying RC profit or loss is RC profit or loss after adjusting for non-operating items and fair value accounting effects. Underlying RC profit or loss and adjustments for fair value accounting effects are not recognized GAAP measures. See pages 25 and 26 for additional information on the non-operating items and fair value accounting effects that are used to arrive at underlying RC profit or loss in order to enable a full understanding of the events and their financial impact. BP believes that underlying RC profit or loss is a useful measure for investors because it is a measure closely tracked by management to evaluate BP’s operating performance and to make financial, strategic and operating decisions and because it may help investors to understand and evaluate, in the same manner as management, the underlying trends in BP’s operational performance on a comparable basis, period on period, by adjusting for the effects of these non-operating items and fair value accounting effects. The nearest equivalent measure on an IFRS basis for the group is profit or loss attributable to BP shareholders. The nearest equivalent measure on an IFRS basis for segments is RC profit or loss before interest and taxation. Underlying profit in the headline on page 1 refers to full year underlying RC profit for the group. Underlying RC profit or loss per share is a non-GAAP measure. Earnings per share is defined in Note 6. Underlying RC profit or loss per share is calculated using the same denominator. The numerator used is underlying RC profit or loss attributable to BP shareholders rather than profit or loss attributable to BP shareholders. BP believes it is helpful to disclose the underlying RC profit or loss per share because this measure may help investors to understand and evaluate, in the same manner as management, the underlying trends in BP’s operational performance on a comparable basis, period on period. The nearest equivalent measure on an IFRS basis is basic earnings per share based on profit or loss for the period attributable to BP shareholders. Upstream operating efficiency is calculated as production for BP-operated sites, excluding US Lower 48 and adjusted for certain items including entitlement impacts in our production-sharing agreements divided by installed production capacity for BP-operated sites, excluding US Lower 48. Installed production capacity is the agreed rate achievable (measured at the export end of the system) when the installed production system (reservoir, wells, plant and export) is fully optimized and operated at full rate with no planned or unplanned deferrals. Upstream unit production cost is calculated as production cost divided by units of production. Production cost does not include ad valorem and severance taxes. Units of production are barrels for liquids and thousands of cubic feet for gas. Amounts disclosed are for BP subsidiaries only and do not include BP’s share of equity-accounted entities.

34
BP p.l.c. Group results Fourth quarter and full year 2017
Cautionary statement In order to utilize the ‘safe harbor’ provisions of the United States Private Securities Litigation Reform Act of 1995 (the ‘PSLRA’), BP is providing the following cautionary statement: The discussion in this results announcement contains certain forecasts, projections and forward-looking statements – that is, statements related to future, not past events – with respect to the financial condition, results of operations and businesses of BP and certain of the plans and objectives of BP with respect to these items. These statements may generally, but not always, be identified by the use of words such as ‘will’, ‘expects’, ‘is expected to’, ‘aims’, ‘should’, ‘may’, ‘objective’, ‘is likely to’, ‘intends’, ‘believes’, ‘anticipates’, ‘plans’, ‘we see’ or similar expressions. In particular, the following, among other statements, are all forward looking in nature: expectations regarding the expected quarterly dividend payment and timing of such payment; plans and expectations regarding cash flows and returns to 2021 and beyond; expectations regarding 2018 organic capital expenditure and depreciation, depletion and amortization charges; plans and expectations with respect to gearing including to target gearing within a 20-30% band; plans and expectations to target a net debt ratio of 20-30%; expectations regarding divestment transactions and the amount and timing of divestment proceeds; expectations regarding the adjusted effective tax rate in 2018; plans and expectations regarding the continuation of the share buyback programme; expectations regarding Upstream 2018 underlying production and first-quarter 2018 reported production; expectations regarding Downstream first-quarter 2018 refining margins, turnaround activity and discounts for North American heavy crude oil; expectations regarding Other businesses and corporate 2018 average quarterly charges; expectations with respect to cash margins of 2016 and 2017 Upstream project start-ups; plans and expectations regarding the joint development agreement with Rosneft with respect to subsoil resources within the Kharampurskoe and Festivalnoye licence areas; plans and expectations regarding the joint ventures with Shandong Dongming Petrochemical Group; plans and expectations regarding the strategic partnership with Lightsource; expectations regarding the determination of business economic loss claims in respect of the 2012 PSC settlement; and expectations with respect to the timing and amount of future payments relating to the Gulf of Mexico oil spill including 2012 PSC settlement payments. By their nature, forward-looking statements involve risk and uncertainty because they relate to events and depend on circumstances that will or may occur in the future and are outside the control of BP. Actual results may differ materially from those expressed in such statements, depending on a variety of factors, including: the specific factors identified in the discussions accompanying such forward-looking statements; the receipt of relevant third party and/or regulatory approvals; the timing and level of maintenance and/or turnaround activity; the timing and volume of refinery additions and outages; the timing of bringing new fields onstream; the timing, quantum and nature of certain divestments; future levels of industry product supply, demand and pricing, including supply growth in North America; OPEC quota restrictions; PSA effects; operational and safety problems; potential lapses in product quality; economic and financial market conditions generally or in various countries and regions; political stability and economic growth in relevant areas of the world; changes in laws and governmental regulations; regulatory or legal actions including the types of enforcement action pursued and the nature of remedies sought or imposed; the actions of prosecutors, regulatory authorities and courts; delays in the processes for resolving claims; amounts ultimately payable and timing of payments relating to the Gulf of Mexico oil spill; exchange rate fluctuations; development and use of new technology; recruitment and retention of a skilled workforce; the success or otherwise of partnering; the actions of competitors, trading partners, contractors, subcontractors, creditors, rating agencies and others; our access to future credit resources; business disruption and crisis management; the impact on our reputation of ethical misconduct and non-compliance with regulatory obligations; trading losses; major uninsured losses; decisions by Rosneft’s management and board of directors; the actions of contractors; natural disasters and adverse weather conditions; changes in public expectations and other changes to business conditions; wars and acts of terrorism; cyber-attacks or sabotage; and other factors discussed elsewhere in this report, under “Principal risks and uncertainties” in our Form 6-K for the period ended 30 June 2017 and under “Risk factors” in BP Annual Report and Form 20-F 2016 as filed with the US Securities and Exchange Commission. This document contains references to non-proved resources and production outlooks based on non-proved resources that the SEC's rules prohibit us from including in our filings with the SEC. U.S. investors are urged to consider closely the disclosures in our Form 20-F, SEC File No. 1-06262. This form is available on our website at www.bp.com. You can also obtain this form from the SEC by calling 1-800-SEC-0330 or by logging on to their website at www.sec.gov.
Contacts
London Houston
Press Office David Nicholas Brett Clanton +44 (0)20 7496 4708 +1 281 366 8346 Investor Relations Craig Marshall Brian Sullivan bp.com/investors +44 (0)20 7496 5183 +1 281 892 3421