Logical modelling of cellular decision processes with...
25
Logical modelling of cellular decision processes with GINsim JOBIM, Rennes, July 5h, 2012 C. Chaouiya, A. Naldi, L. Spinelli, P. Monteiro, D. Berenguier, L. Grieco, A. Mbodj,S. Collombet, A. Niarakis, L. Tichit, E. Remy & D. Thieffry
Transcript of Logical modelling of cellular decision processes with...

Logical modelling of cellular decision processes with GINsim
JOBIM, Rennes, July 5h, 2012
C. Chaouiya, A. Naldi, L. Spinelli, P. Monteiro, D. Berenguier, L. Grieco, A. Mbodj,S. Collombet, A. Niarakis, L. Tichit,
E. Remy & D. Thieffry
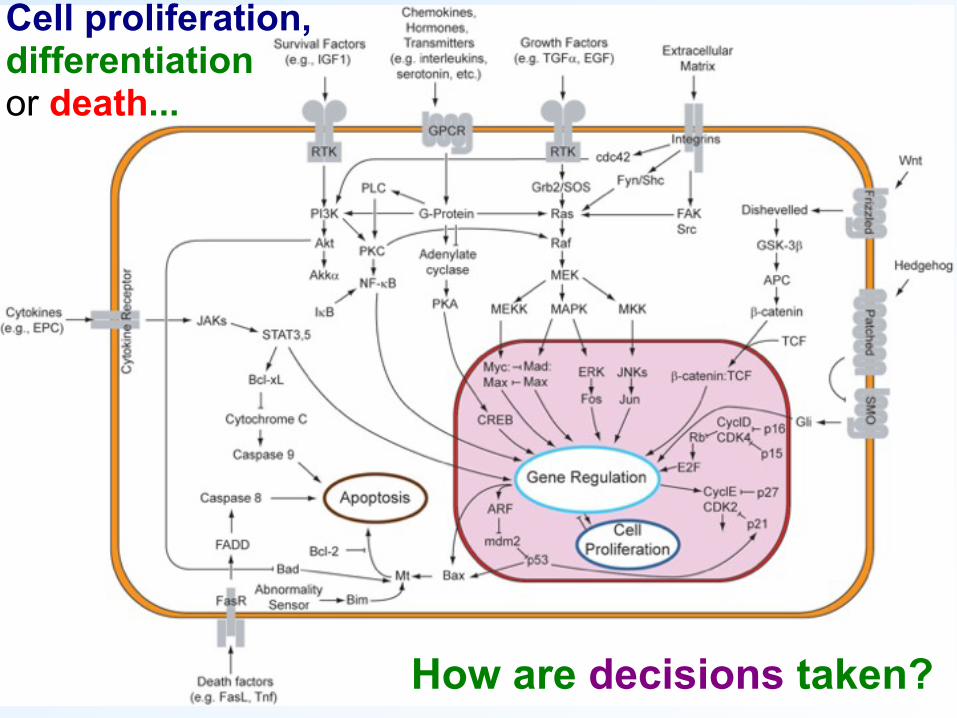
Cell proliferation, differentiation or death...
How are decisions taken?
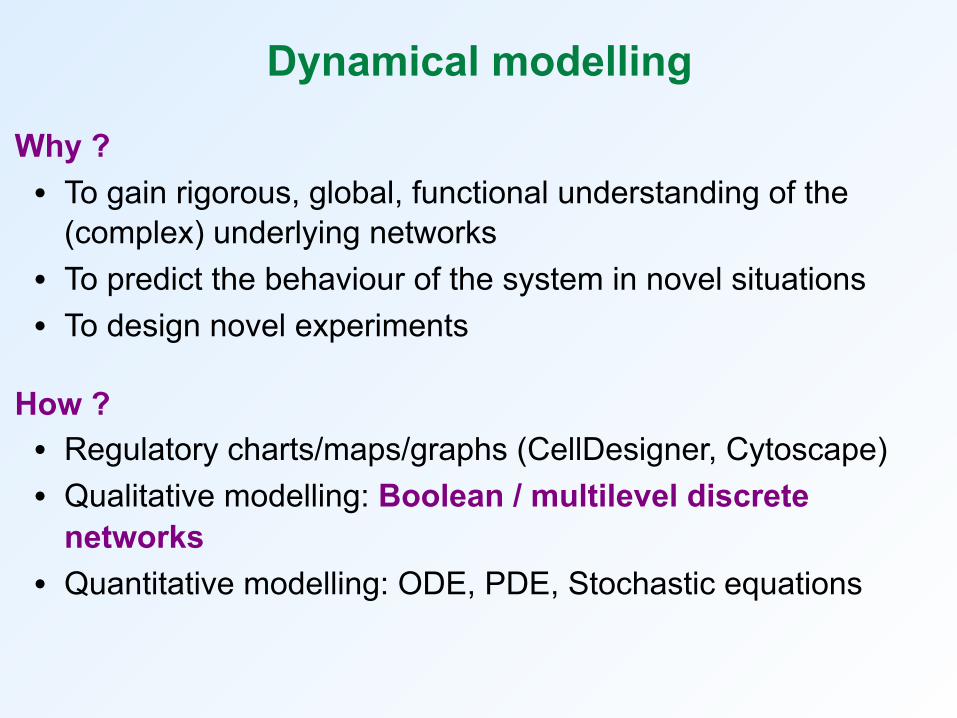
Dynamical modelling
Why ?• To gain rigorous, global, functional understanding of the
(complex) underlying networks• To predict the behaviour of the system in novel situations• To design novel experiments
How ?• Regulatory charts/maps/graphs (CellDesigner, Cytoscape)• Qualitative modelling: Boolean / multilevel discrete
networks• Quantitative modelling: ODE, PDE, Stochastic equations

Boolean networks - Stuart Kauffman (1969)
The Boolean vector x represents the state of the systemRandom connections, nodes with predefined degree
Canalizing Boolean functionsFocus on asymptotic behaviourTwo types of attractors: stable states and (simple) cyclesDeterministic behaviour (only one possible following state)
xt+1 = B(xt )

Kinetic logic - René Thomas (1973)Xi (image or logical function) specifies whether gene i is currently transcribed xi (logical variable) denotes the presence (above a threshold of the functional product of gene i
X = B(x)
t
Xi
Gene i switched ON Gene i switched OFF
1
0
xi
1
0
Delay dOFFDelay dON
Asynchronous, potentially non deterministic behaviour!

Logical modelling of regulatory networks
A graph describes the interactions between genes or regulatory products
Logical rules/parameters
KA = 2 IFF (C=0)KA = 0 otherwise
Discrete levels of expression associated to each regulatory component and interaction
KC = 1 IFF (B=1) AND (C=0)KC = 0 otherwise
B
C C
00 01
C
Decision trees
02
C
C=0 1
KB = 1 IFF (A=1)KB = 0 otherwise
010
A
0 21
[1]
[2]
B
C
A

Logical modelling of regulatory networks
A graph describes the interactions between genes or regulatory products
Logical rules/parameters
02
C
Discrete levels of expression associated to each regulatory component and interaction
B
C
01
01
A
Decision diagrams
KA = 2 IFF (C=0)KA = 0 otherwise
KB = 1 IFF (A=1)KB = 0 otherwise
KC = 1 IFF (B=1) AND (C=0)KC = 0 otherwise
C=0 10 2
1
[1]
[2]
B
C
A

Logical state transition graphs
Asynchronous updating (R Thomas, L Glass)
ABC
C↑
C↓
B↓B↓
A↑
Regulatory graph + Logical rules => simulations / dynamical analysis
State transition
graph
Stable state
[1]
[2]
B
C
A

Logical state transition graphs
ABC
Stable state
+ Logical rules
Cycle
Cycle
B↓ C↓
C↓
State transition
graph
Synchronous updating (S Kauffman)
A↑ C↑
A↑
[1]
[2]
B
C
A

GINsim (Gene Interaction Networks simulation)
analysis toolbox
core simulator
GINML parser
user interface
graph analysis
graph editor simulation
State transition graph
Regulatory graph
Available at http://gin.univ-mrs.fr/GINsim
Aurélien NALDIFabrice LOPEZDuncan BERENGIERClaudine CHAOUIYA
Naldi et al (2009) BioSystems 97: 134-9Chaouiya et al (2012) Methods in Molecular Biology 804: 463-79

Development of dynamical analysis tools Decision diagrams • Identification of attractors [Naldi et al, 2007]• Analysis of regulatory circuits [Naldi et al, 2007]• Model reduction [Naldi et al, 2010]• Compression of state transition graphs
[Berenguier et al, in prep]
Priority classes • Mixed a/synchronous simulations [Fauré et al, 2006] Petri nets (standard or coloured) Model checking• Verification of dynamical properties (temporal logic)
[Sanchez et al, 2008] Constraint programming• Model identification (regulatory interactions, thresholds, rules)
[Corblin et al, 2001]

Coping with the exponential growth of logical state transition graphs
Model reduction
Attractor identification
Temporisation (e.g. priorities, delays, etc.)
Compaction of state transition graphs

IRF1
IL4
CGC
IFNB_e IL12_e
STAT3
IL12RB2
IL4R
IL17
TBET
IL10
IL23R
GP130
IL21
STAT6
IL6_e
proliferation
APCIL15_e
CD28
IL2
IL12RB1IFNGR1
IFNGR
STAT4
SMAD3
IL2R
IL4_e
IFNG
IL6RA IL4RA
STAT1
IFNGR2 IL15RA
IKB
TCR
IL10_e
IL15R
TGFB_eIFNG_e
IL10RB
IL10R
IL23_e
IL2RA
NFKB
STAT5NFAT
IL27RA
IL27_e IL2_e
TGFBR
RORGTRUNX3
IFNBR
IL10RA
IL21R
GATA3
IL21_e
IL6R
TGFBIL23
IL27R IL12R
FOXP3
IL2RB
13 input components, 52 internal components, 339 circuits => too large to perform simulations
Logical model of the Th network
Naldi et al (2010) PLoS Comput Biol 6: e1000912.
IFNBR => 1 IFF IFNR_e =1
STAT1 => 1 IFF INFGR=1 OR IL7R=1 OR IFNB_e =1

Reduced Th model
13 input components21 internal components
Naldi et al (2011) Theoretical Computer Science 412: 2207-18

State transition graph (704 nodes)
Pathways? Crucial decisions?
TH0 + (APC, IL4_e, IL6_e, IL12) ON
2 reachable stable statesTh2Th1

Graph of strongly connected components
Also 704 nodes!
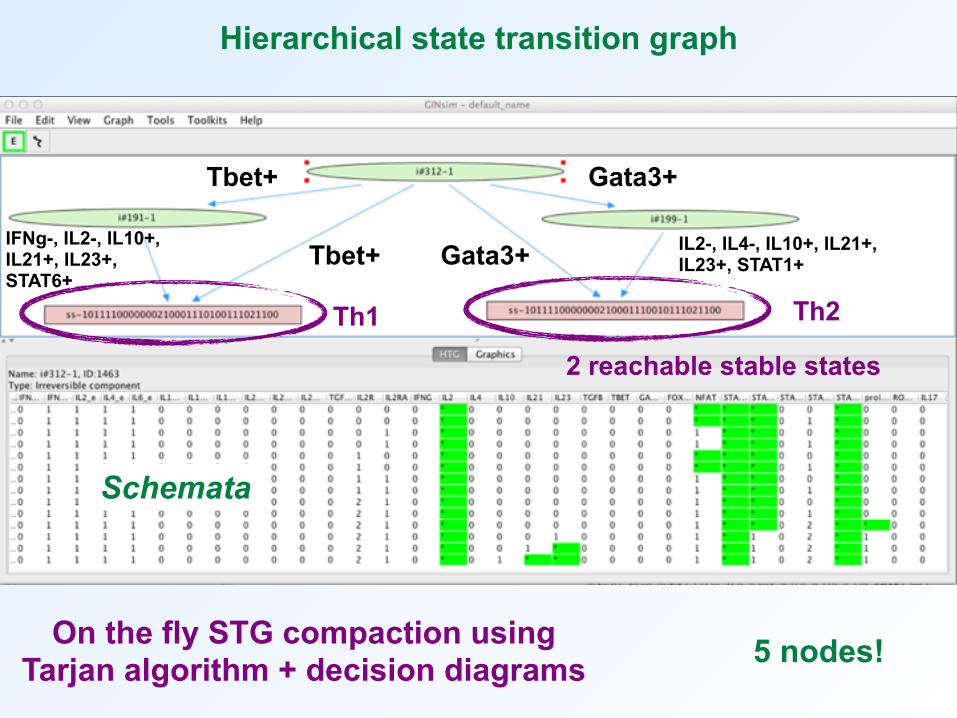
Hierarchical state transition graph
2 reachable stable states
Tbet+ Gata3+
Gata3+Tbet+ IL2-, IL4-, IL10+, IL21+, IL23+, STAT1+
IFNg-, IL2-, IL10+, IL21+, IL23+, STAT6+
Th2Th1
5 nodes!On the fly STG compaction using Tarjan algorithm + decision diagrams
Schemata

Overview of the simulation results for ≠ micro-environmentsAbsence ofstimulation
Pro-Th1IL2 & IFNg
or IL12
APC only
Pro-Th2IL4 & IL6
Pro-TregIL2 & TGFb
or IL10
Pro-Th17IL6 & TGFb
GATA3 Tbet Foxp3 RORγt
Naldi et al (2010) PLoS Comput Biol 6: e1000912.

Main biological applications Drosophila development • Segmentation genetic network [Sanchez et al, 2008]• Mesoderm specification (heart, muscle, with E Furlong)
[Mbodj et al, in prep]
Heamatopoietic cell differentiation and activation• TCR signalling & T cell activation/differentiation (with V Soumelis)
[Naldi et al, 2010]• Mast cell activation (with M Daëron & B Malissen)• Specification of haematopoietic lineages (with T Graf)
[Collombet et al, in prep]
Cell proliferation (DIAMONDS, FP6) [Fauré et al, 2006 & 2009; Sahin et al, 2009]
Apoptosis (APO-SYS, FP7) [Calzone et al, 2010]
MAPK network [Grieco et al, in prep]

Computational modelling of FcεRI signalling during mast cell activation.
Anna Niarakis1, Emrah Kamali1, Yacine Bounab2,3, Marc Daëron2,3, Denis Thieffry1 1IBENS (CNRS UMR 8197 / INSERM U1024), Paris, France
2Institut Pasteur, Département d’Immunologie, Unité d’Allergologie Moléculaire et Cellulaire, Paris, France3Inserm, Unité 760, Institut Pasteur, Paris, France
IntroductionMast cell activation (Figure 1) is a pivotal event in the initiation of inflammatory reactions associated with allergic disorders. It is triggered by the aggregation of high-affinity IgE receptors (FcεRI), on the mast cell surface [1]. FcεRI aggregation is induced by the binding of a multivalent allergen to FcεRI-bound IgE antibodies. Mast cell activation is a complex process relying on multiple layers of tightly controlled intracellular signalling molecules, which form an intricate network [2, 3].A global and rigorous understanding of the signalling and cross-regulatory processes involved in mast cell activation requires the integration of public and novel data into a comprehensive computational model. Based on a survey of relevant data published in scientific journals or available in public databases, we are currently building and annotating a comprehensive regulatory map using the software CellDesigner [4].
Ultimately, our modelling analysis should contribute to deepen our understanding of how the different functional outcomes of mast cell activation (degranulation, synthesis of lipidic mediators, induction of cytokine transcription) are articulated at the level of the underlying molecular network, and to delineate means to uncouple these functions and control them separately or collectively.
References[1] Turner et al. (1999). Nature Reviews 402: B24-30. [2] Cao et al. (2007). Journal of Immunology 179: 5864-76.[3] Gilfillan et al.(2009). Immunological Reviews 228: 149-69. [4] Funahashi et al. (2008). Proceedings IEEE 96: 1254-65.[5] Le Bouteiller et al. (1976). European Journal of Immunology 6, 326-32.[6] Naldi et al. (2009). Biosystems 97: 134-9.[7] Naldi et al. (2010). PLoS Computational Biology 6: e100.[8] Naldi et al. (2011).Theoretical Computer Science 412: 2207-18.
Current StatusThis regulatory map currently encompasses 60 components and over 300 interactions, along with annotations and links to databases such as PubMED, EntrezGene and UniProt. This mast cell activation map will serve as a scaffold to generate a dynamical model of the underlying network, using a sophisticated logical modelling approach and the software GINsim [6, 7, 8].
ProspectsNovel proteomic data will be used to delineate salient dynamical features of mast cell response under different conditions (e.g. how the FcεRI signalling network operates in the absence or in the presence of negative regulatory signals triggered by the FcγRIIB or by the transmembrane adaptor LAT2). To progressively improve the predictive power of the resulting model, computational results will be systematically confronted with experimental data.
Figure 2. Partial view of the molecular interaction map of FcεRI related mast cell activation. This map has been built with the software CellDesigner (version 4.2).
Figure 1.Picture of a mast cell releasing granules containing vasoactive amines and proteases.Reprinted from [5].
Anna NIARAKISPoster 12

MAPK signalling
Bibliographical references
Logical model Simulation results
Logical modelling of MAPK pathwaysLogical modelling of MAPK pathways
Mammalian Mitogen-Activated Protein Kinases (MAPKs) can be activated by a wide variety of stimuli,
including growth factors and environmental stresses. Activation of MAPK pathways affects diverse
cellular activities, including gene expression, cell cycle machinery, survival, apoptosis and differentiation.
To date, three groups of MAPKs have been extensively studied: extracellular regulated kinases
(ERK1/2), Jun NH2 terminal kinases (JNK1/2/3), and p38 kinases (p38 α/β/γ/δ).
Given the wide spectrum of stimuli and the large number of processes regulated, a fundamental and
debated question is how signalling specificity is achieved.
At least five inter-related mechanisms have been proposed:
[1] E. Zehorai, Z. Yao, A. Plotnikov and R. Seger. The subcellular localization of MEK and ERK – a novel nuclear
translocation signal (NTS) paves a way to the nucleus. Mol. Cell. Endocrinol. 314: 213-220, 2010.
[2] A. Funahashi, Y. Matsuoka, A. Jouraku, M. Morohashi, N. Kikuchi and H. Kitano. CellDesigner 3.5: A Versatile
Modeling Tool for Biochemical Networks. Proc. IEEE 96: 1254-1265, 2008.
[3] A. Naldi, D. Berenguier, A. Fauré, F. Lopez, D. Thieffry and C. Chaouiya. Logical modelling of regulatory networks
with GINsim 2.3. BioSystems 97: 134-139, 2009.
[4] A. Naldi, E. Remy, D. Thieffry, C. Chaouiya. Dynamically consistent reduction of logical regulatory graphs. Theor.
Comput. Sci. 412: 2207-18, 2011.
Luca GRIECO1,2,4, Laurence CALZONE3, Andrei ZINOVYEV3, Brigitte KAHN-PERLES2, Denis THIEFFRY2,4
1Université de la Méditerranée, Marseille, France; 2TAGC (INSERM U1090), Marseille, France;3INSERM U900, Institut Curie, Paris, France;
4IBENS (CNRS UMR 8197 / INSERM U1024), Ecole Normale Supérieure, Paris, France
Using the CellDesigner map as a reference, we derived a comprehensive logical model for the MAPK network,
with the aim to reproduce the response of MAPK cascades to different stimuli and better understand their
contributions to cell fate decision (between proliferation, apoptosis and growth arrest). The resulting logical
model encompasses the three main MAPK cascades in response to four inputs: EGFR, FGFR3, TGFβ, and
DNA damage. The model was built using the GINsim software [3], and encompasses 54 Boolean components.
The figure below shows the corresponding regulatory graph (nodes represent regulatory components, each
associated with a logical rule, while green and red arcs represent activation and negative interactions,
respectively).
Name TypeEGF
(input)
FGF3
(input)
TGFB
(input)
DNA_damage
(input)Apoptosis Proliferation Growth_Arrest ERK p38 JNK EGFR p53 FRS2 PI3K
a1 steady state 0 0 0 0 0 0 0 0 0 0 0 0 0 0
a2 steady state 0 0 0 0 0 0 0 0 0 0 0 0 0 1
a3 steady state 0 0 0 1 1 0 1 0 1 1 0 1 0 0
a4 steady state 0 0 0 1 0 0 1 0 1 1 0 1 0 1
a5 SCC (16 states) 0 0 1 0 * 0 * 0 * * 0 0 0 0
a6 SCC (8 states) 0 0 1 0 0 0 * 0 * * 0 0 0 1
a7 steady state 0 0 1 1 0 0 1 0 1 1 0 1 0 1
a8 steady state 0 0 1 1 1 0 1 0 1 1 0 1 0 0
a9 steady state 0 1 0 0 0 0 1 1 0 0 0 0 0 0
a10 steady state 0 1 0 0 0 1 0 1 0 0 0 0 0 1
a11 SCC (2 states) 0 1 0 1 0 0 1 0 1 1 0 1 * 1
a12 steady state 0 1 1 0 0 0 1 1 0 0 0 0 0 0
a13 steady state 0 1 1 0 0 1 0 1 0 0 0 0 0 1
a14 SCC (2 states) 0 1 1 1 0 0 1 0 1 1 0 1 * 1
a15 steady state 1 0 0 0 0 1 0 1 0 0 1 0 0 1
a16 SCC (2 states) 1 0 0 1 0 0 1 0 1 1 * 1 0 1
a17 steady state 1 0 1 0 0 1 0 1 0 0 1 0 0 1
a18 SCC (2 states) 1 0 1 1 0 0 1 0 1 1 * 1 0 1
a19 steady state 1 1 0 0 0 1 0 1 0 0 1 0 0 1
a20 SCC (2 states) 1 1 0 1 0 0 1 0 1 1 0 1 * 1
a21 steady state 1 1 1 0 0 1 0 1 0 0 1 0 0 1
a22 SCC (2 states) 1 1 1 1 0 0 1 0 1 1 0 1 * 1
To analyse the dynamical properties of this large logical model, we took advantage of a novel model reduction
function implemented into GINsim [4], which preserves the attractors of the systems. Using this reduction
algorithm we obtained a 14-component model, on which we performed an attractor analysis. The table shows
the results obtained through our reduced model simulations, according to an asynchronous updating strategy.
(SCC stands for strongly connected component; * denotes the values 0 or 1)
We simulated various mutant situations (data not shown), either to further check the coherence of the model
with known facts or to predict novel mechanisms.
Recapitulation of documented phenomena
✔ In the absence of growth factors (EGF and FGF3), Growth_arrest steady states are obtained by
DNA_damage (with or without TGFB) (a4,a7). Apoptosis is present only when PI3K is absent (a3,a8).
✔ EGF stimulus alone is able to activate the ERK cascade, and to block p38 and JNK, causing Proliferation
(a15). FGF3 stimulus is weaker than EGF, leading to bistability: a Proliferation steady state and a
Growth_arrest steady state are both possible, accompanied by active ERK and inactive p38/JNK (a9,a10).
Simulations revealing novel tentative regulatory functions
✔ Role of p53: in wild type, DNA_damage (but not TGFB) is sufficient for apoptosis (a3-a6);
upon p53 deletion, both DNA_damage and TGFB are needed for apoptosis induction.
Conclusion: following loss of p53, TGFB might play an important role in triggering Apoptosis, by sinergysing
with DNA_damage stimulus
✔ Role of ERK: upon removal of all ERK feedbacks towards EGFR/FRS2, growth arrest is completely lost in
the presence of FGF3 stimulus (a11-a14).
Conclusion: ERK might play a fundamental role in determining the phenotype differences observed
following EGF versus FGF3 stimuli
presence of multiple components with different roles in each level of the cascade; interaction with
scaffold proteins that direct each component to distinct upstream regulators and downstream targets;
distinct sub-cellular locations of cascade components and their targets; distinct duration and strength of
the signal; cross-talks among signalling cascades that are activated simultaneously [1].
To address this question, we have integrated published data on the MAPK network using using the
CellDesigner software [2]. Our current annotated map includes 91 components (proteins/genes) and 178
interactions.
Attr.
Luca GRIECOPoster 13

Macrophage and B cell specification• We focused on the core network controlling B cell and macrophage diferentiation :• common Progenitors (LMPP) maintenance necessitates PU1, CEBPb and E2a;• B-cell genes (blue nodes) are controlled by transcription factors EBF, E2a, Pax5, FoxO1 and PU1;• macrophage genes (red nodes) are controlled by CEBPa, CEBPb and PU1.
Binary/ternary components are denoted by ellipsoid/rectangular nodes. Red/green arcs denotesactivatory/inhibitory regulations. Thick edges represent regulations with converging data from thelitterature and ChIP-seq analysis during trans-differentiation; thin edges represent interactions supportedby ChIP-seq data only; doted arcs represent interactions supported by data from the litterature only(potentially undirect).
Multiple perturbation and preB reprogramming• Pax5 and EBF (but not E2a) forced expression (FE) decrease the efficiency of CEBPa induced trans-differentiation (as shown in [4]).
Lineage differentiation and stability• Transient stimulation by Il3/Il7 can induced differentiation of LMPP into macrophage/B cell.• PU.1 KO impairs LMPP and macrophages stability and differentiation, but not B cell stability.• CEBPa or CEBPb KO impairs macrophages differentiation.• Each B factor KO impairs B cell differentiation and stability.
Computing stable states• For the logical rules selected, we found five stable states :→ 3 corresponding to wild type cell types.→ 1 corresponding to PU.1 knock-own preB (found experimentaly in [2]).→ 1 stable state with all components off.
Transdifferentiation of proB into macrophages• Ectopic expression of the transcription factor Cebpa (or Cebpb) in proB can induced their trans-differentiation into macrophages.
Logical modeling of hematopoietic cell specificationSamuel COLLOMBET 1, Cyrille LEPOIVRE 2,3, Denis PUTHIER 2, Thomas GRAF 3, Denis THIEFFRY4
IBENS (CNRS UMR8197 / Inserm U1024), Paris, FranceTAGC (Inserm U1090), Marseille, France
CRG, Barcelona, Spain
IntroductionBlood cells are derived from a common set of stem cells, which differentiate into more specificprogenitors of erythroid, myeloid and lymphoid lineages, ultimately leading to functional cells such aserythrocytes, macrophages, B and T lymphocytes. This ontogenesis is controlled by a complex regulatorynetwork involving environmental signals, as well as transcriptional and epigenetic factors.These factors regulate each other’s expression in a complex way, with some of them being expressed andrequired in different cell types [1]. The ectopic expression of some of these factors can induce thereprogramming of one cell type into another. For example, B cells can be reprogrammed intomacrophages by forcing the ectopic expression of CEBPa [2].Using public data from molecular genetic experiments (qPCR, western blot, EMSA) or genome-wideessays (DNA-chip, ChIP-seq), we have built a comprehensive map of the regulatory network oftranscription factors and signaling components involved in hematopoietic development (to dateencompassing 84 factors and 281 regulations). Based on this map and focusing on macrophage and B celldevelopment, we have developed a dynamical model using the logical modelling software GINsim [3]and reproduced in sillico differentiation and reprogramming experiments.
Logical modelling• Genes or proteins are associated with discrete variables representing their level of relative activity;multivalued variable (rectangle on the network) were used only when necessary to minimize complexity.
• The level of a variable is defined by a logical function of the level of its regulators. For example :PU1→ 1 if [(CEBPa | CEBPb | PU1) & !((CEBPa & CEBPb & PU1) | (PU1 & CEBPb : 2))]PU1→ 2 if [(CEBPa & CEBPb & PU1) | (PU1 & CEBPb : 2)]PU1→ 0 otherwise
Where &, | and ! stand for AND, OR, NOT, andA→ x mean that the value of variableA tends to x.
• Initially, all activators and none of the inhibitors are considered to be required for activation; theselogical functions are then refined to fit experimental evidences (effects of gain- or loss-of-functions onthe expression of other factors).
• Cell types are defined as a vector of variable values, corresponding to qualitative levels of activity forall factors, based on data from the literature.
PreB trans-differentiation into macrophage• CEBPa ectopic expression (EE) in preB induces trans-differentiation into macrophages (left).- Transient expression can be sufficient if long enough.
• Only constant CEBPb ectopic expression can induce preB trans-differentiation.- When CEBPb expression stops, cells re-differentiate into preB.
Prospects• Analysis of the functionality of regulatory circuits for differentiation and reprogramming.• Predictive simulation (multiple perturbations, macrophages reprogramming).• Refinement of the model (data on chromatin marks, cytokines pathways).• Extension the network to cover Neutrophil and T-cell development.
References[1] C. V. Laiosa et al. (2006) Annual Review of Immunology 24:705[2] H. Xie et al. (2004) Cell 117:663[3] C. Chaouiya et al. (2012) Methods in Molecular Biology 804:463[4] L. H. Bussmann et al. (2009) Cell Stem Cell 5:554
Conclusion• This study shows how high-throughtput data (transcriptome, ChIP-seq) can be used to complete apredictive (qualitative) dynamical model.• Our model currently reacpitulate published differentiation and reprogramming experiments.• Logical rules prove to be sufficient to capture the most essential dynamical properties of this system.
PreB Mac
Samuel COLLOMBET
Poster 14

Mesoderm specification map and regulatory network Expression of the main genes uderlying mesoderm specification
Recapitulation of published data
Regulatory graph encompassing the main regulatory factors and interactions involved in mesoderm specification ( stages 8-10). Ellipses denote Boolean nodes, whereas rectangles denote multilevel nodes. Light green nodes denote factors acting from the ectoderm. Green arrows denote activations, whereas red T-arrows denote inhibitions. This model has been defined and analysed using our software GINsim. To each regulatory node is associated a logical rule defining its behaviour depending on regulatory inputs.
Combinations of inputs corresponding to the initial states used to simulate the formation each tissue
Simulations of known mutants
Dpp Visceral muscle
Heart
Somatic muscle
Fat body
Wg, SlpHh, Eve, En
Da Dl Dpp En Hh Jak/Stat Pyr Ths Spi WgVisceral muscle
Heart
Somatic muscle
Fat Body
Dpp
WgHh, En
Somaticmuscle
HeartVisceralmuscle
Fat body
Mesoderm
level 1
Level 0
level 2
level 3
Input Dl, Dpp, Pyr, Ths, Hh
Dl, Dpp, Spi, Pyr, Ths,Jak/Stat, Wg
Da, Pyr, Ths, Wg
Dl, Pyr, Ths, Hh
Ci
Htl
Mad
Med
Nicd
Pan
Pnt
Stat92E
BapBinDaDocDsix4EnEveEyaMef2PnrPoxmSlpSrpTinTwiZfh1
Ecto
derm
al si
gnal
sM
esod
erm
al g
enes
Tissue Type Visceral muscle Heart Somatic
muscle Fat body
Ci
Dl
Dpp
Hh
Htl
Jak/Stat
Mad
Med
Nicd
Notch
Pan
Pnt
Pyr
Stat92ESpi
Ths
Wg
Bap
Bin
Brk
Da
Der
Dome
Dsix4
Emc
En
Eve
E_Spl
Eya
Gbb
Hh
Hbr
Hop
MAPK
Mef2
Notch
Pka
Pnr
Poxm
Ptc
Ras
Sax
Screw
Shn
Slp
Smo
Sog
Srp
Su_H_CSL
Tld
Tin
Tkv
Tsg
Twi
Zfh1
Abibatou MBODJ1, Guillaume JUNION2, Duncan BERENGUIER1, Eileen FURLONG2 and Denis THIEFFRY1,3 1 TAGC - U1090 INSERM, 163, Avenue de Luminy, 13009, Marseille, Cedex 09, France
2 EMBL, Heidelberg, Meyerhofstraße 1, 69117 Heidelberg, Germany3 IBENS - CNRS UMR 8197 / INSERM U1024, Ecole Normale Supérieure, Paris, France
Logical modelling of mesoderm specification in Drosophila melanogaster
Wg (Slp) lof
Azpiazu et al., (1996); wu et al.(1995); Frasch et al. (1999)
Hh + Dpp gof; Wg (Slp) lof
Azpiazu et al.(1996)
Tin lof
Bordmer et al.(1993); Azpiazu et al.(1993); Riechmann et al. (1997
Wg + Dpp gof; Hh (Eve, En) lof
Azpiazu et al.(1996)
Prediction of the phenotypes of single and double perturbations
Slp (En, Eve, Hh) gof ; Doc gof
Doc gof Slp (En, Hh, Eve) gof
338 mutants
Experimental validation of 12 mutants in progress
Map representing the different tissues formed during mesoderm specification ( stages 8-10 of development).
Expression patterns for the 55 mesoderm specification network components
Key markers genes used to define the identity of each kind of cell or tissue.
Colour code denotes the visual signature of each tissue (blue: visceral muscle (VM) ; red : heart (H) ; orange: somatic muscle (SM) ; green: fat body (FB) ).
Schematisation of wild-type mesoderm specification
Abibatou MBODJ
Poster 52

Contributors & supports★ ENS (Paris)
• Samuel Collombet• Luca Grieco• Anna Niarakis
★ CRG (Barcelona)• Thomas Graf• Chris van Oeven
★ TAGC (Marseille)• Cyrille Lepoivre• Denis Puthier• Jacques van Helden• Duncan Berenguier
★ IML (Marseille)• Elisabeth Rémy
★ IGC (Lisboa)• Claudine Chaouiya• Jorge Carneiro
★ UniL (Lausanne)• Aurélien Naldi
Belgian Inter-university Attraction PoleBioinformatics and Modelling : from Genomes to Networks

Selected references Bérenguier D, Tichit L, Chaouiya C, Naldi A, Graf T, Thieffry D, Remy E (Submitted). Hierarchical transition
graphs, a new compressed, yet instructive, view for the dynamics of logical models. Calzone L, Tournier L, Fourquet S, Thieffry D, Zhivotovsky B, Barillot E, Zinovyev A (2010). Mathematical
Modelling of Cell-Fate Decision in Response to Death Receptor Engagement. PLoS Computational Biology 6: e1000702.
Chaouiya C, Naldi A, Remy E, Thieffry D (2011). Petri net representation of multi-valued logical regulatory graphs. Natural Computing 10: 727-50.
Coolen M, Thieffry D, Drivenes Ø, Becker TS, Bally-Cuif L. (2012). miR-9 controls the timing of neurogenesis through the direct inhibition of antagonistic factors. Developmental Cell 22:1052-64.
Fauré A, Naldi A, Lopez F, Chaouiya C, Ciliberto A. Thieffry D (2009). Modular logical modelling of the budding Yeast cell cycle. Molecular Biosystems 5: 1787–96.
González AG, Chaouiya C, Thieffry D (2008). Qualitative dynamical modelling of the formation of the anterior-posterior compartment boundary in the Drosophila wing imaginal disc. Bioinformatics 24: i234-40.
Naldi A, Thieffry D, Chaouiya C (2007). Decision diagrams for the representation and analysis of logical models of genetic networks. Lecture Notes in Bioinformatics 4695: 233-47.
Naldi A, Remy E, Thieffry D, Chaouiya C (2011). Dynamically consistent reduction of logical regulatory graphs. Theoretical Computer Science 412: 2207-18.
Naldi A, Carneiro J, Chaouiya C, Thieffry D (2010). Diversity and plasticity of Th cell types predicted from regulatory network modelling. PLoS Computational Biology 6: e1000912.
Sánchez L, Chaouiya C, Thieffry D (2008). Segmenting the fly embryo: logical analysis of the role of the Segment Polarity cross-regulatory module. International Journal of Developmental Biology 52: 1059-75.
Sahin O, Fröhlich H, Löbke C, Korf U, Burmester S, Majety M, Mattern J, Schupp I, Chaouiya C, Thieffry D, Poustka A, Wiemann S, Beissbarth T, Arlt D (2009). Modeling ERBB receptor-regulated G1/S transition to find targets for de novo trastuzumab resistance. BMC Systems Biology 3: 1.
Thieffry D (2007). Dynamical roles of biological regulatory circuits. Briefings in Bioinformatics 8: 220-5.