
Logic Models & Performance Measures: Telling Your ... · PDF fileLogic Models & Performance...
63
1 Logic Models & Performance Measures: Telling Your Performance Story Sustainable Communities Conference March 11, 2009 Presented by: Yvonne M. Watson U.S. Environmental Protection Agency National Center for Environmental Innovation Evaluation Support Division
Transcript of Logic Models & Performance Measures: Telling Your ... · PDF fileLogic Models & Performance...
1
Logic Models & Performance Measures: Telling Your Performance
Story
Sustainable Communities Conference
March 11, 2009
Presented by:
Yvonne M. Watson
U.S. Environmental Protection Agency
National Center for Environmental Innovation
Evaluation Support Division
2
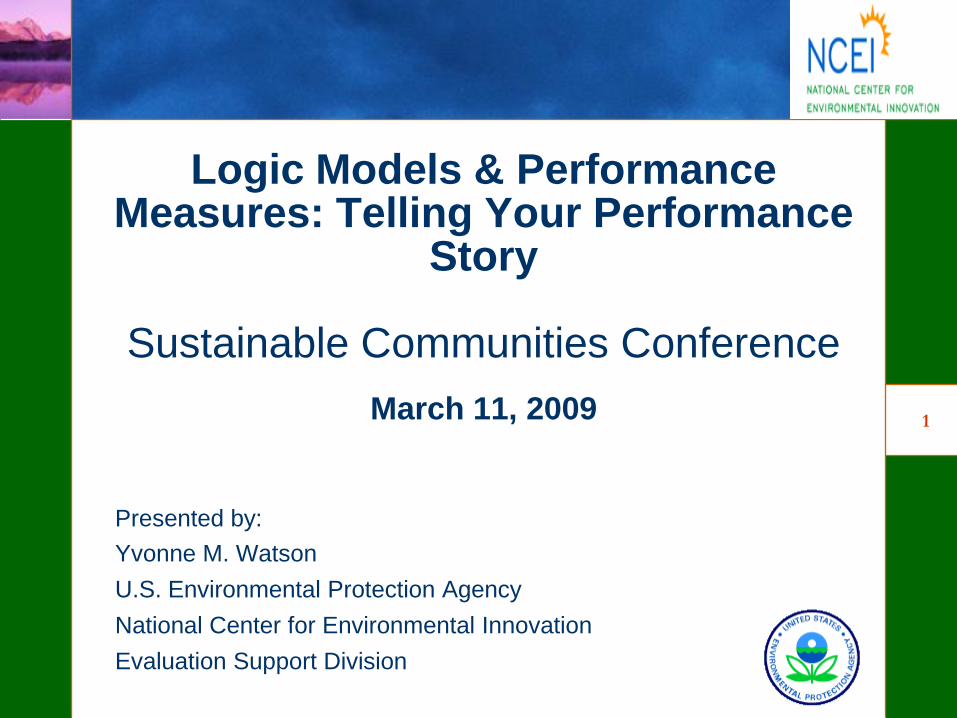
You Will Learn How to:
• Develop a logic model of your program/project
• Use the logic model to develop a results
oriented work plan
• Identify performance measures
• Use the logic model to respond to
Environmental Results Order 5700.7
3
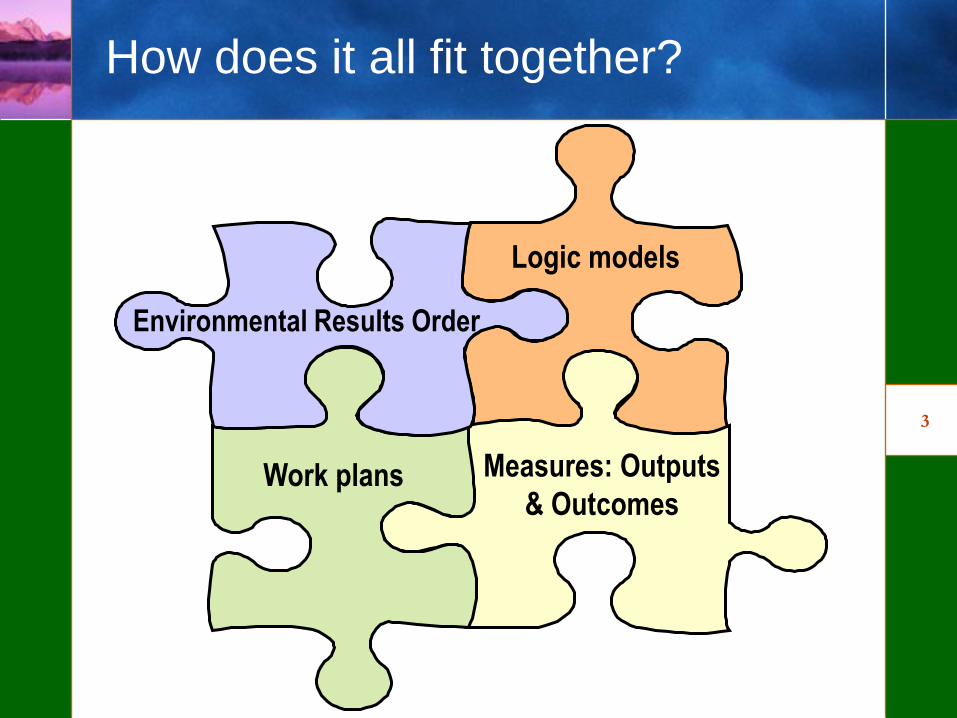
How does it all fit together?
Work plans
Logic models
Measures: Outputs
& Outcomes
Environmental Results Order
4
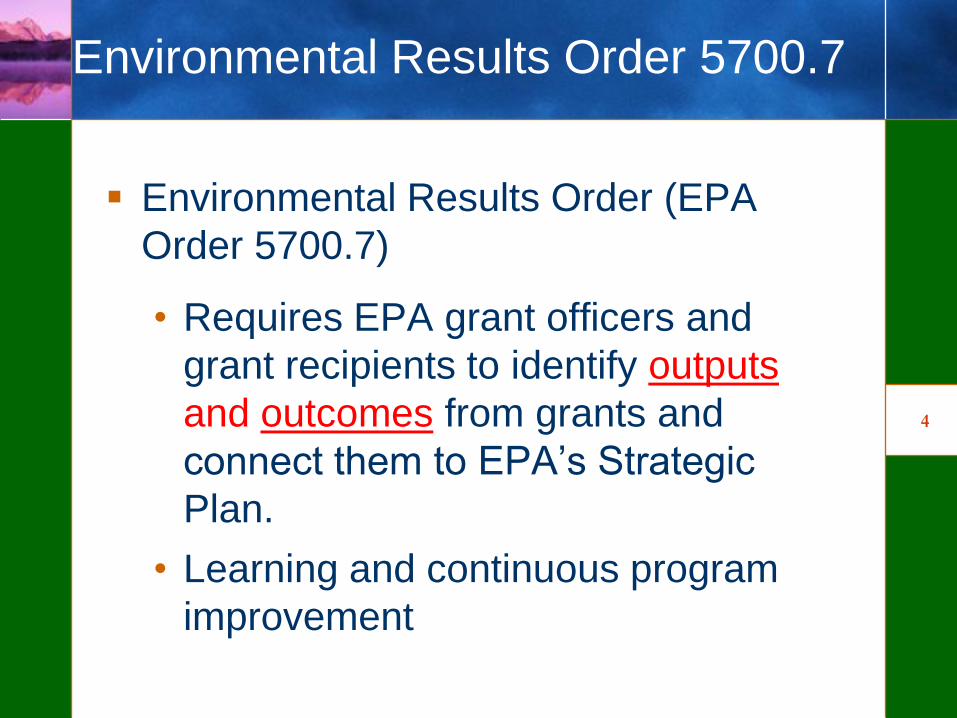
Environmental Results Order 5700.7
Environmental Results Order (EPA
Order 5700.7)
• Requires EPA grant officers and
grant recipients to identify outputs
and outcomes from grants and
connect them to EPA‘s Strategic
Plan.
• Learning and continuous program
improvement
5
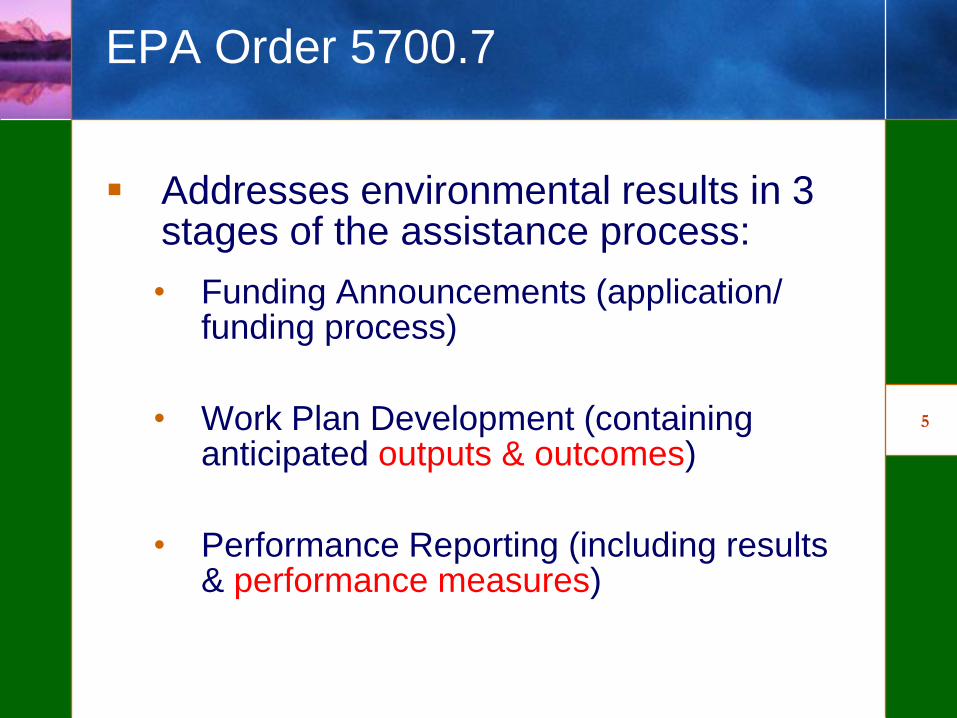
EPA Order 5700.7
Addresses environmental results in 3 stages of the assistance process:
• Funding Announcements (application/ funding process)
• Work Plan Development (containing anticipated outputs & outcomes)
• Performance Reporting (including results & performance measures)
6
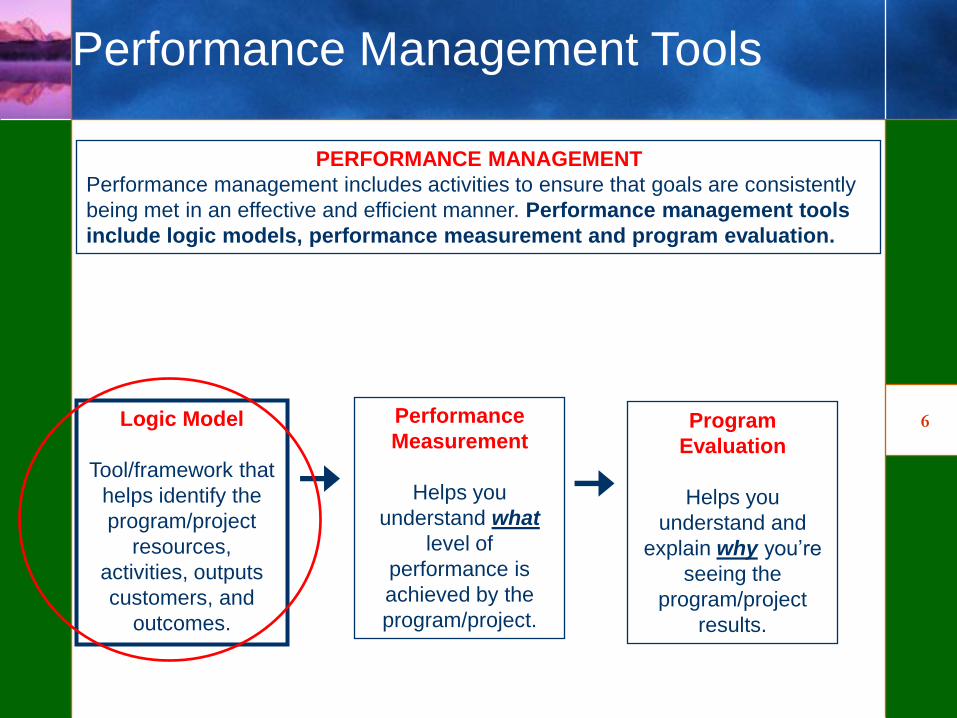
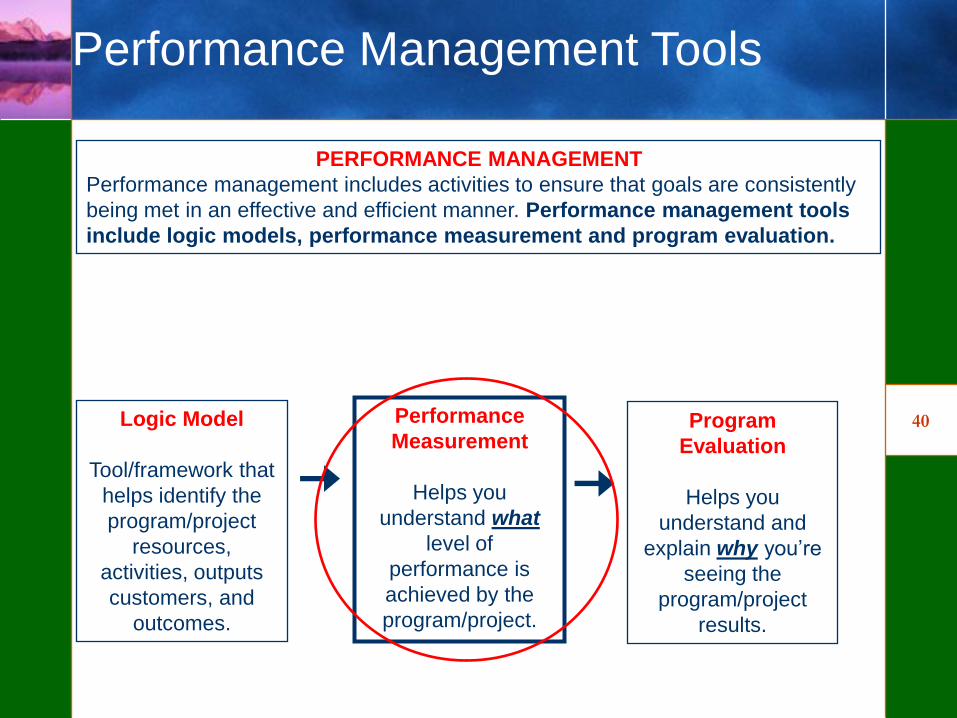
PERFORMANCE MANAGEMENT
Performance management includes activities to ensure that goals are consistently
being met in an effective and efficient manner. Performance management tools
include logic models, performance measurement and program evaluation.
Logic Model
Tool/framework that
helps identify the
program/project
resources,
activities, outputs
customers, and
outcomes.
Performance
Measurement
Helps you
understand what
level of
performance is
achieved by the
program/project.
Program
Evaluation
Helps you
understand and
explain why you‘re
seeing the
program/project
results.
Performance Management Tools
7
Module 1:
Picturing Your Program: Developing a Logic Model
8
9
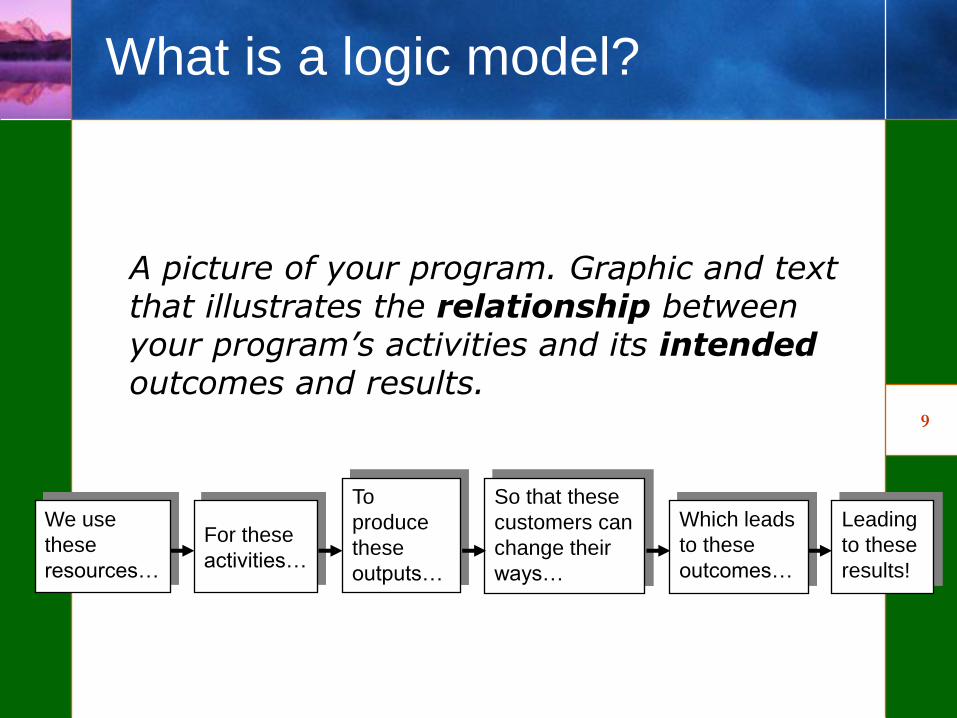
What is a logic model?
A picture of your program. Graphic and text that illustrates the relationship between your program’s activities and its intended outcomes and results.
We use
these
resources…
For these
activities…
To
produce
these
outputs…
So that these
customers can
change their
ways…
Which leads
to these
outcomes…
Leading
to these
results!
10
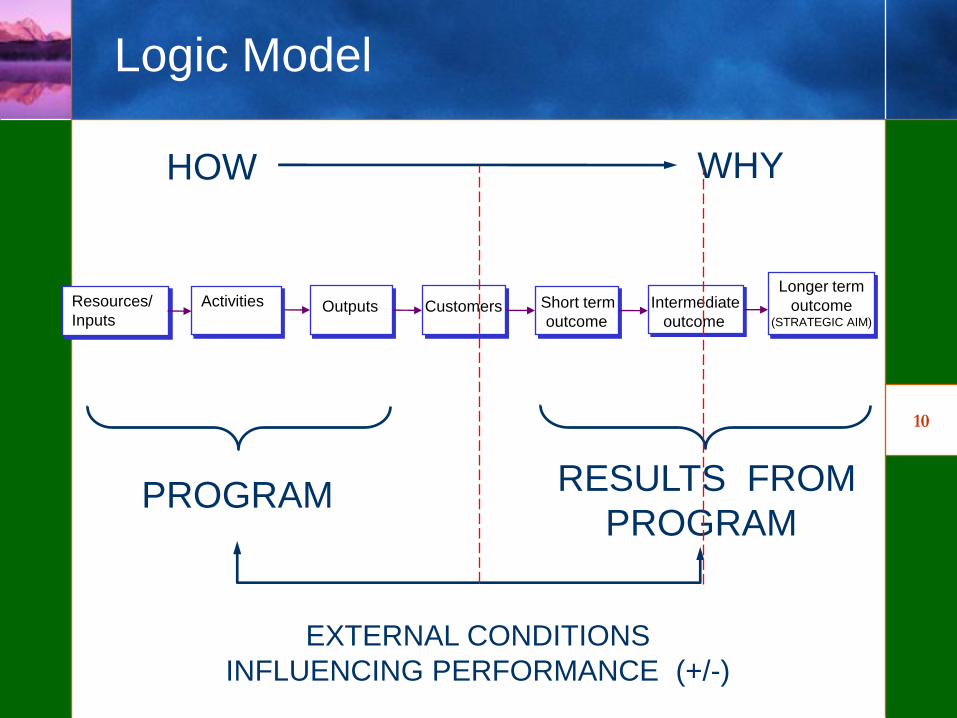
Logic Model
Longer term
outcome(STRATEGIC AIM)
Short term
outcomeCustomersOutputs
WHYHOW
PROGRAM RESULTS FROM
PROGRAM
EXTERNAL CONDITIONS
INFLUENCING PERFORMANCE (+/-)
Intermediate
outcome
ActivitiesResources/
Inputs
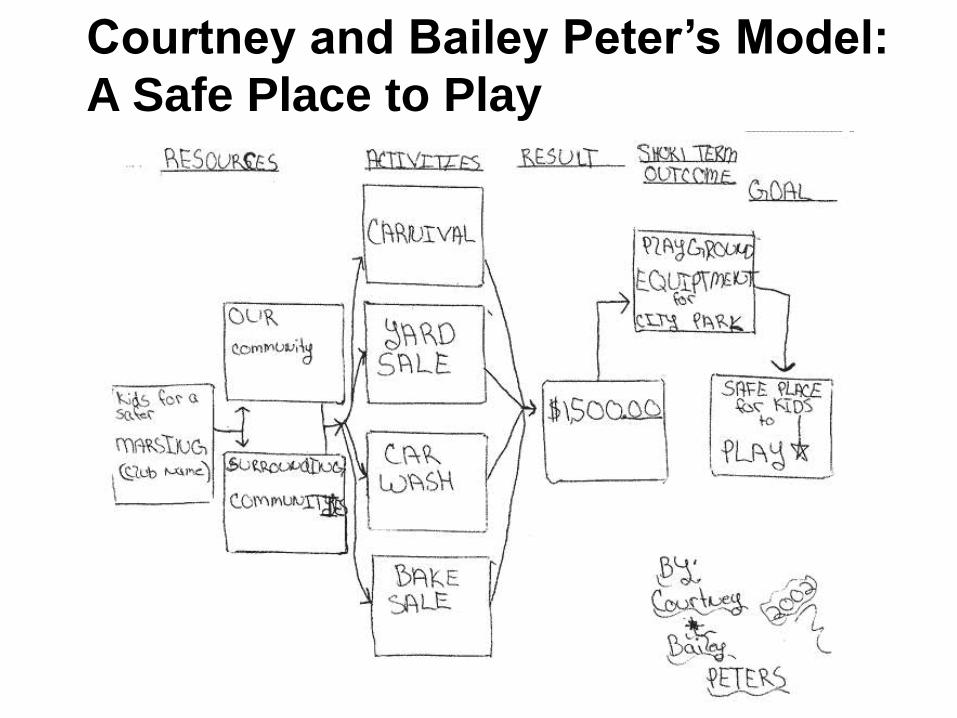
Courtney and Bailey Peter’s Model:
A Safe Place to Play
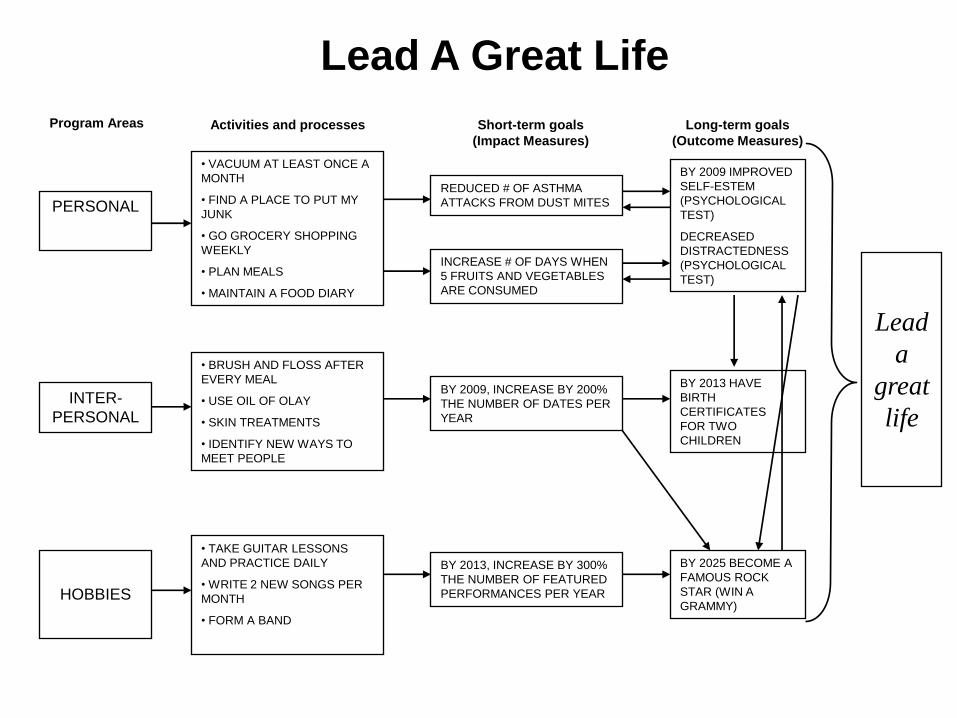
PERSONAL
Lead A Great Life
Program Areas Activities and processes Short-term goals
(Impact Measures)
Long-term goals
(Outcome Measures)
INTER-
PERSONAL
HOBBIES
• VACUUM AT LEAST ONCE A
MONTH
• FIND A PLACE TO PUT MY
JUNK
• GO GROCERY SHOPPING
WEEKLY
• PLAN MEALS
• MAINTAIN A FOOD DIARY
• BRUSH AND FLOSS AFTER
EVERY MEAL
• USE OIL OF OLAY
• SKIN TREATMENTS
• IDENTIFY NEW WAYS TO
MEET PEOPLE
• TAKE GUITAR LESSONS
AND PRACTICE DAILY
• WRITE 2 NEW SONGS PER
MONTH
• FORM A BAND
REDUCED # OF ASTHMA
ATTACKS FROM DUST MITES
INCREASE # OF DAYS WHEN
5 FRUITS AND VEGETABLES
ARE CONSUMED
BY 2009, INCREASE BY 200%
THE NUMBER OF DATES PER
YEAR
BY 2013, INCREASE BY 300%
THE NUMBER OF FEATURED
PERFORMANCES PER YEAR
BY 2009 IMPROVED
SELF-ESTEM
(PSYCHOLOGICAL
TEST)
DECREASED
DISTRACTEDNESS
(PSYCHOLOGICAL
TEST)
BY 2013 HAVE
BIRTH
CERTIFICATES
FOR TWO
CHILDREN
BY 2025 BECOME A
FAMOUS ROCK
STAR (WIN A
GRAMMY)
Lead
a
great
life
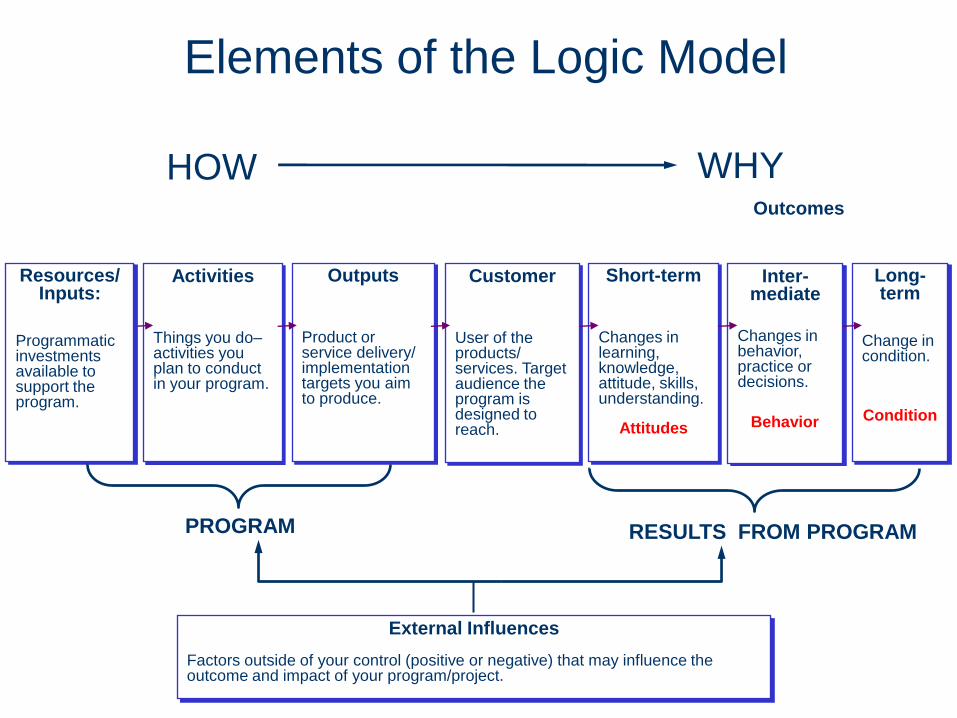
Elements of the Logic Model
Inter-mediate
Changes in behavior, practice or decisions.
Behavior
Customer
User of the products/ services. Target audience the program is designed to reach.
Activities
Things you do–activities you plan to conduct in your program.
Outputs
Product or service delivery/ implementation targets you aim to produce.
Resources/ Inputs:
Programmatic investments available to support the program.
Short-term
Changes in learning, knowledge, attitude, skills, understanding.
Attitudes
Long-term
Change in condition.
Condition
External Influences
Factors outside of your control (positive or negative) that may influence the outcome and impact of your program/project.
Outcomes
WHYHOW
PROGRAM RESULTS FROM PROGRAM

14
Outputs and Outcomes
Output: Products and services provided as a
direct result of program/proposal activities.
Outcome: Changes or benefits resulting
from activities and outputs. Accomplishment
of program goals and objectives.
• short-term (Change in knowledge, skills,
understanding, attitude)
• intermediate outcomes (Change in behavior)
• long-term outcomes—impacts (Change in the
environment)
15
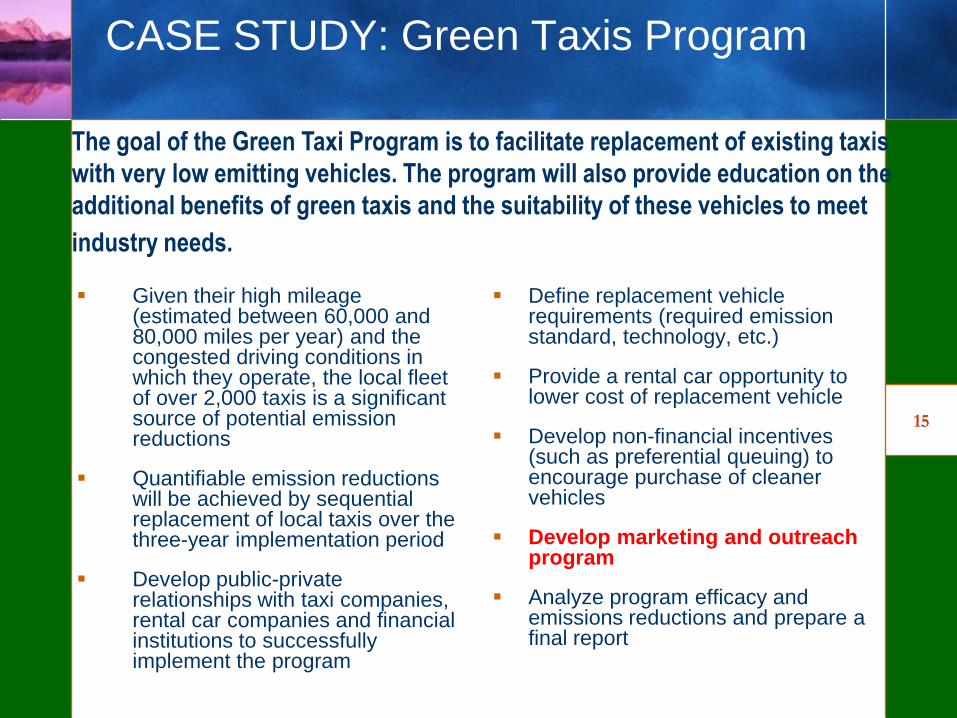
CASE STUDY: Green Taxis Program
Given their high mileage (estimated between 60,000 and 80,000 miles per year) and the congested driving conditions in which they operate, the local fleet of over 2,000 taxis is a significant source of potential emission reductions
Quantifiable emission reductions will be achieved by sequential replacement of local taxis over the three-year implementation period
Develop public-private relationships with taxi companies, rental car companies and financial institutions to successfully implement the program
Define replacement vehicle requirements (required emission standard, technology, etc.)
Provide a rental car opportunity to lower cost of replacement vehicle
Develop non-financial incentives (such as preferential queuing) to encourage purchase of cleaner vehicles
Develop marketing and outreach program
Analyze program efficacy and emissions reductions and prepare a final report
The goal of the Green Taxi Program is to facilitate replacement of existing taxis
with very low emitting vehicles. The program will also provide education on the
additional benefits of green taxis and the suitability of these vehicles to meet
industry needs.

16
Exercise 1: Types of Program Elements
1. Increased awareness of
incentives and eligibility
criteria
2. Develop marketing and
outreach plan
3. City of Dallas, EPA Region 6,
TCEQ Staff
4. Green Taxi Brand
5. Improved air quality
1. _________________
2. _________________
3. _________________
4. _________________
5. __________________
Example Type of Program Element
17
What are Logic Models Used For?
Planning tool
Communication tool
Implementation tool
Measurement design
Evaluation design

18
What are the Benefits of Logic Models?
Illustrates the logic or theory of the program or project.
Focuses attention on the most important connections between actions and results.
Builds a common understanding among staff and with stakeholders.
Helps staff ―manage for results‖ and informs program design.
Finds ―gaps‖ in the logic of a program and work to resolve them.
19
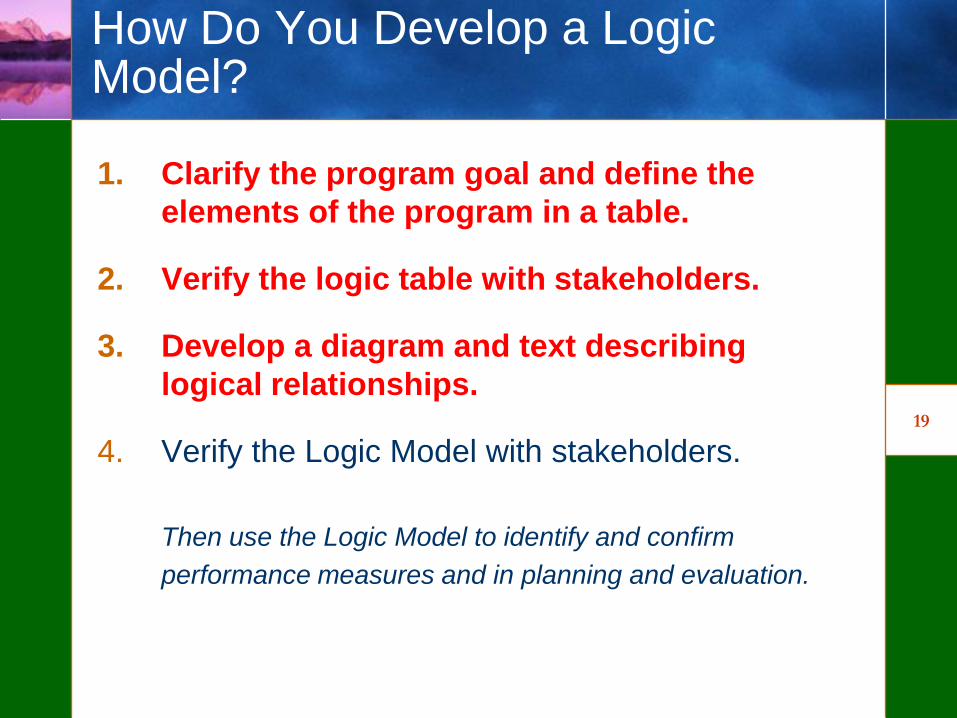
How Do You Develop a Logic Model?
1. Clarify the program goal and define the
elements of the program in a table.
2. Verify the logic table with stakeholders.
3. Develop a diagram and text describing
logical relationships.
4. Verify the Logic Model with stakeholders.
Then use the Logic Model to identify and confirm
performance measures and in planning and evaluation.

20
Program
outcomes
related to
factor(s)
- HOW - WHOWHAT and WHY
Step 1. Clarify the program goal and define the
elements of the program in a table
External Influences:
Outcomes
Resources/
InputsActivities Outputs Customers
reached
Short-term(change in attitude)
Intermediate(Change in behavior)
Long-term(change in condition)
21
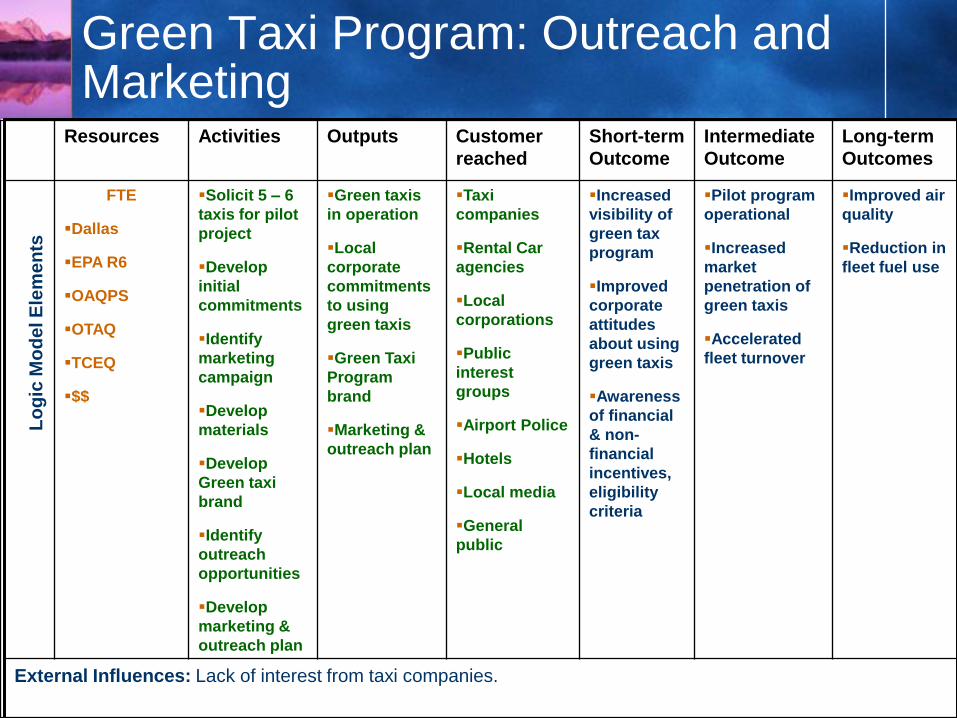
Green Taxi Program: Outreach and Marketing
Resources Activities Outputs Customer
reached
Short-term
Outcome
Intermediate
Outcome
Long-term
Outcomes
FTE
Dallas
EPA R6
OAQPS
OTAQ
TCEQ
$$
Solicit 5 – 6
taxis for pilot
project
Develop
initial
commitments
Identify
marketing
campaign
Develop
materials
Develop
Green taxi
brand
Identify
outreach
opportunities
Develop
marketing &
outreach plan
Green taxis
in operation
Local
corporate
commitments
to using
green taxis
Green Taxi
Program
brand
Marketing &
outreach plan
Taxi
companies
Rental Car
agencies
Local
corporations
Public
interest
groups
Airport Police
Hotels
Local media
General
public
Increased
visibility of
green tax
program
Improved
corporate
attitudes
about using
green taxis
Awareness
of financial
& non-
financial
incentives,
eligibility
criteria
Pilot program
operational
Increased
market
penetration of
green taxis
Accelerated
fleet turnover
Improved air
quality
Reduction in
fleet fuel use
External Influences: Lack of interest from taxi companies.
Lo
gic
Mo
de
l E
lem
en
ts
22
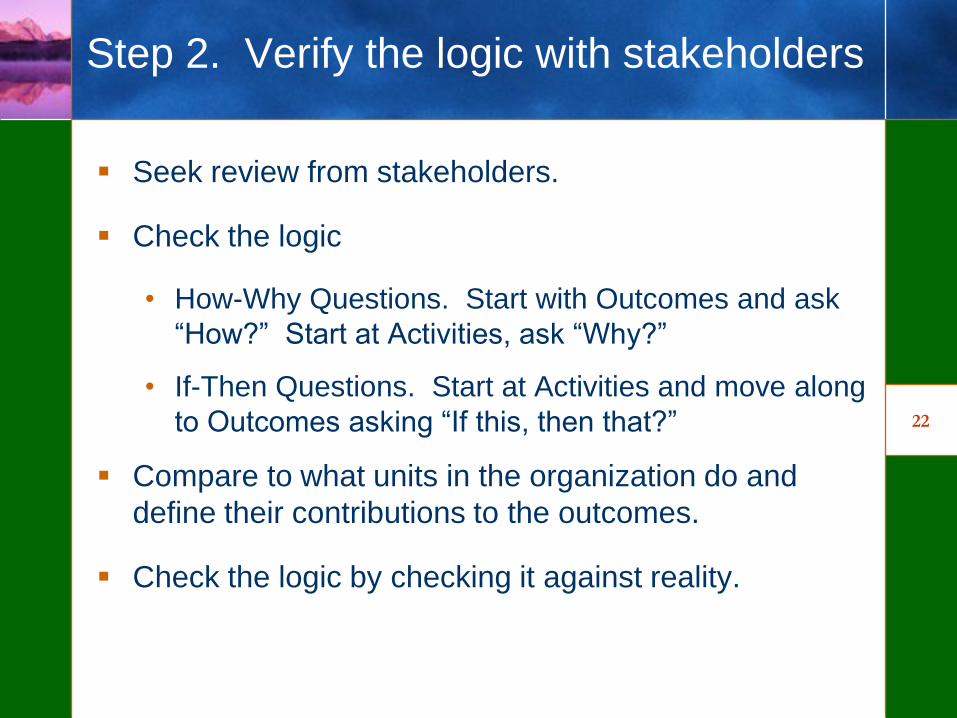
Step 2. Verify the logic with stakeholders
Seek review from stakeholders.
Check the logic
• How-Why Questions. Start with Outcomes and ask
―How?‖ Start at Activities, ask ―Why?‖
• If-Then Questions. Start at Activities and move along
to Outcomes asking ―If this, then that?‖
Compare to what units in the organization do and
define their contributions to the outcomes.
Check the logic by checking it against reality.
23
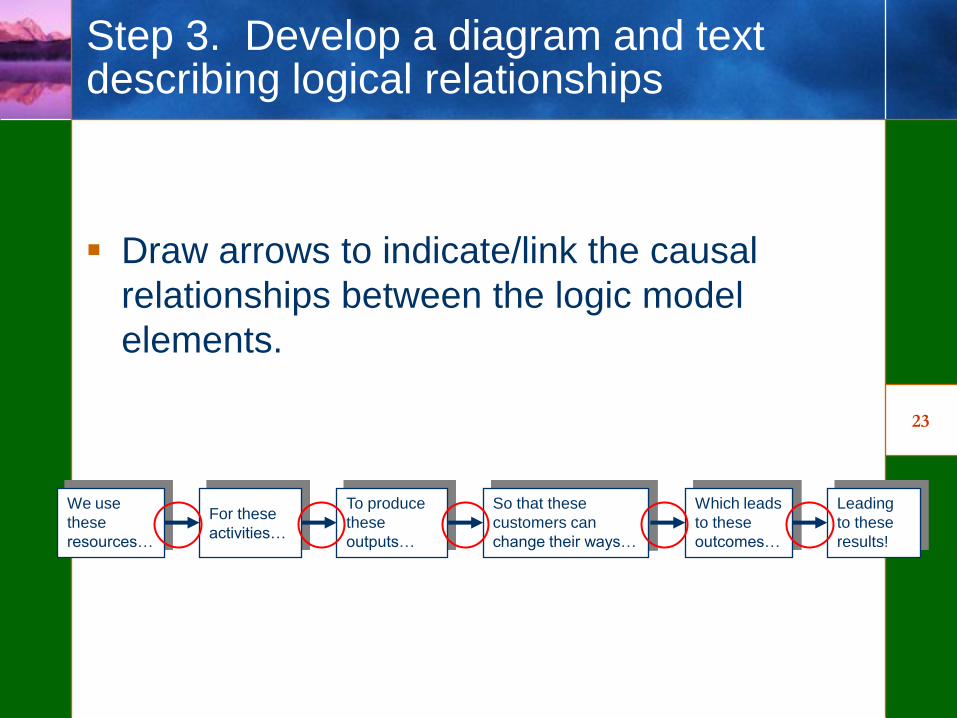
Step 3. Develop a diagram and text describing logical relationships
Draw arrows to indicate/link the causal
relationships between the logic model
elements.
We use
these
resources…
For these
activities…
To produce
these
outputs…
So that these
customers can
change their ways…
Which leads
to these
outcomes…
Leading
to these
results!

24
Example Logic Models…
There are many different forms of logic models. Can you see the logic?
Key questions to ask:
• Are the program‘s outcomes described?
• Are the program‘s customers described?
• Are the program‘s major resources, activities and outputs described and do they make sense?
• Are there things/issues that might influence the program‘s ability to achieve its goal?
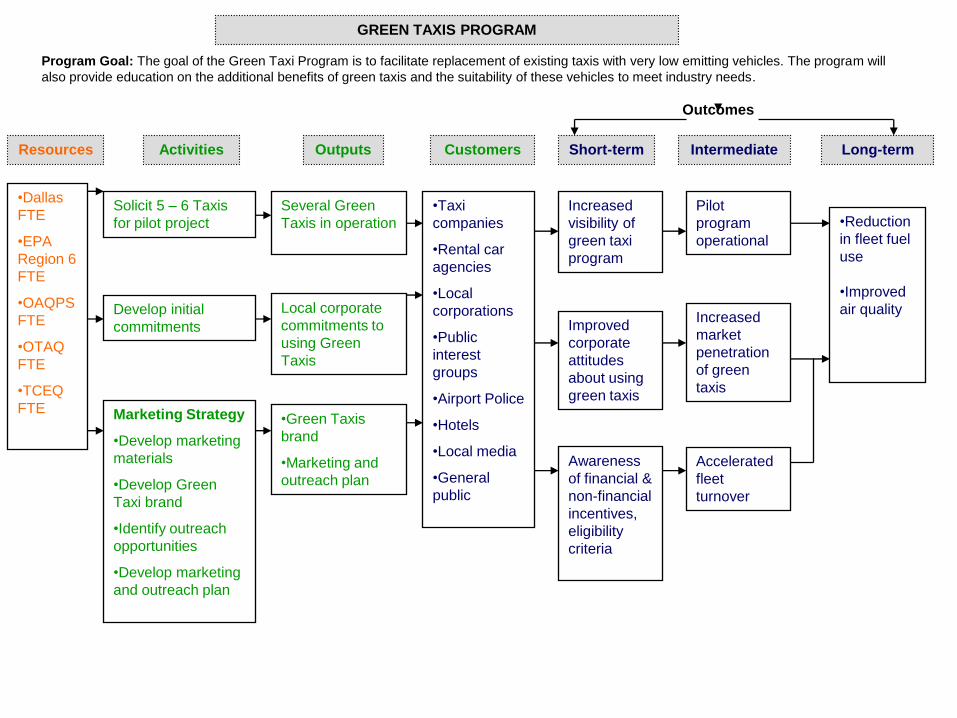
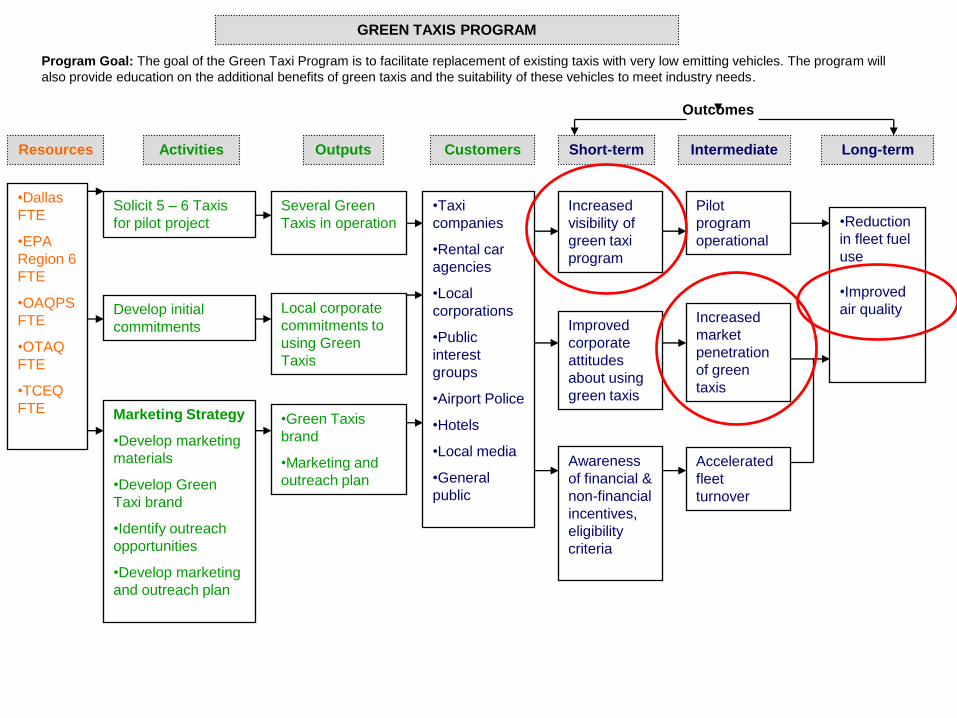
GREEN TAXIS PROGRAM
Program Goal: The goal of the Green Taxi Program is to facilitate replacement of existing taxis with very low emitting vehicles. The program will
also provide education on the additional benefits of green taxis and the suitability of these vehicles to meet industry needs.
Resources
Outcomes
Short-term Intermediate Long-termOutputsActivities Customers
Increased
visibility of
green taxi
program
•Dallas
FTE
•EPA
Region 6
FTE
•OAQPS
FTE
•OTAQ
FTE
•TCEQ
FTE
•Taxi
companies
•Rental car
agencies
•Local
corporations
•Public
interest
groups
•Airport Police
•Hotels
•Local media
•General
public
Improved
corporate
attitudes
about using
green taxis
Accelerated
fleet
turnover
•Reduction
in fleet fuel
use
•Improved
air quality
Solicit 5 – 6 Taxis
for pilot project
Local corporate
commitments to
using Green
Taxis
Several Green
Taxis in operation
•Green Taxis
brand
•Marketing and
outreach plan
Develop initial
commitments
Marketing Strategy
•Develop marketing
materials
•Develop Green
Taxi brand
•Identify outreach
opportunities
•Develop marketing
and outreach plan
Awareness
of financial &
non-financial
incentives,
eligibility
criteria
Pilot
program
operational
Increased
market
penetration
of green
taxis
Behavioral
Outcomes
• Regulated entities
implement
Reduction Plan
recommendations
• Coordination
increases between
trade associations,
local colleges,
regulated entities,
and local
governments
• Regulated entities
more safely
manage hazardous
waste and toxic
chemicals during
storage and
transportation
• Regulated entities
improve
compliance and
―beyond
compliance‖ rates
Activities
• Assist with
preparation and
implementation
of Reduction
Plans and
meeting
regulatory
requirements
through site
visits and
follow-up visits,
training
seminars and
workshops,
fielded phone
calls,
educational
materials, etc.
Resources (FY
03)
• 6.6 FTE
• $ 0.52 million
Outputs
• Site visits and
follow-up
visits
• Recommen-
dations
• Training
seminars and
workshops
• Published
information
and outreach
materials
• Fielded
phone calls
• Public
meetings
Knowledge
Outcomes
• Regulated
entities increase
understanding of
regulations and
what it will take
to achieve
regulatory
compliance
• Regulated
entities increase
understanding of
―beyond
compliance‖
options
Environmental
Outcomes
• Regulated
entities use
fewer toxic
chemicals and
generate less
hazardous
waste
• Regulated
entities safely
dispose of toxic
chemicals and
hazardous
waste
• Regulated
entities reduce
the severity of
toxic and
hazardous
spills
Customer
• Large Quantity
Generators of
hazardous
waste
• Small Quantity
Generators of
hazardous
waste
• Conditionally-
Exempts
Generators of
hazardous
waste
• Reporters to
the Toxic
Release
Inventory
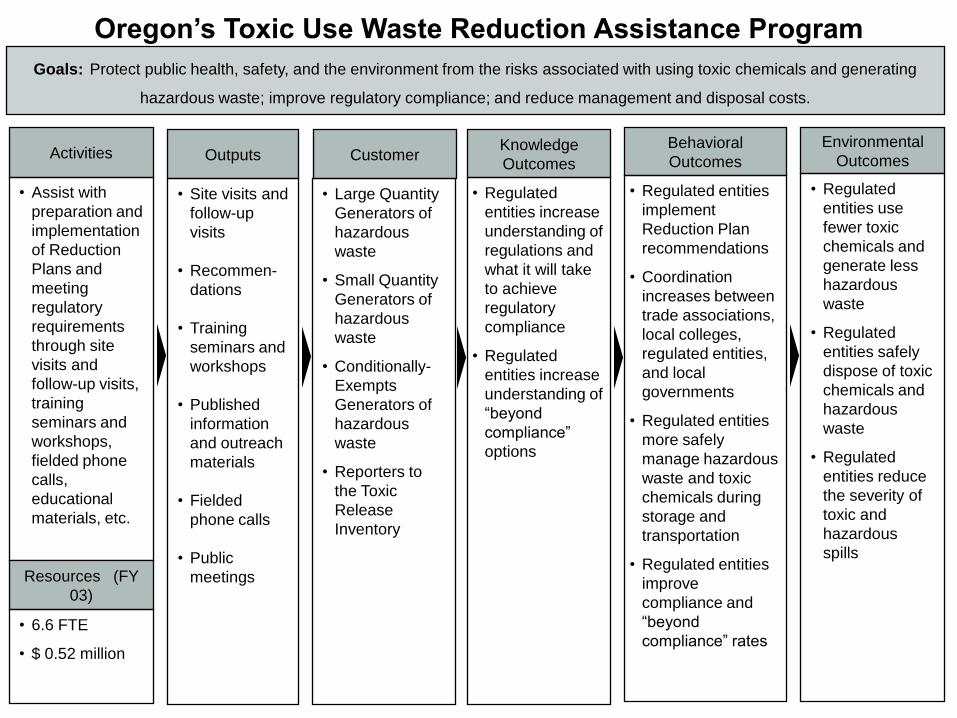
Goals: Protect public health, safety, and the environment from the risks associated with using toxic chemicals and generating
hazardous waste; improve regulatory compliance; and reduce management and disposal costs.
Oregon’s Toxic Use Waste Reduction Assistance Program
• Establish/Deliver Personal
Sustainability Action Plan
• Establish/Deliver
Sustainability Standards for
External Programs
• Provide Input to EMS
Sustainability EMP
Region VII Staff
and On-Site
Grantees Increase
Use of E85 Fuel in
Equipped
Government
Vehicles
Resources
Outcomes
Short-term Intermediate Long-termOutputsActivities Customers
Knowledge of
Sustainability
Practices and
Principles Increases
Sustainability
&
Stewardship
Team and
other Staff
Senior Staff
(Approval)
EMS
Sustainment
Team
Region VII
Staff
Senior Staff
(Approval)
Region VII Staff and
On-site Grantee,
Contractor, and
Volunteer
Understanding of
How Sustainability
Applies to Region
VII Activities
Increases
Ad hoc Teams
Established
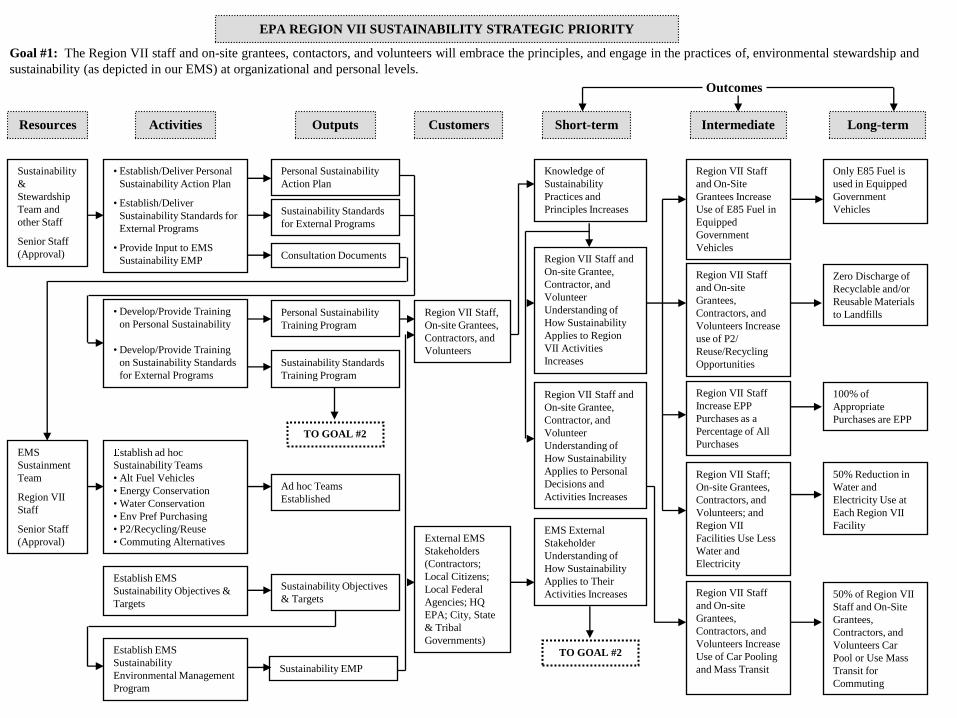
EPA REGION VII SUSTAINABILITY STRATEGIC PRIORITY
Region VII Staff
and On-site
Grantees,
Contractors, and
Volunteers Increase
use of P2/
Reuse/Recycling
Opportunities
Only E85 Fuel is
used in Equipped
Government
Vehicles
Zero Discharge of
Recyclable and/or
Reusable Materials
to Landfills
stablish ad hoc
Sustainability Teams
• Alt Fuel Vehicles
• Energy Conservation
• Water Conservation
• Env Pref Purchasing
• P2/Recycling/Reuse
• Commuting Alternatives
Sustainability Standards
for External Programs
Personal Sustainability
Action Plan
Region VII Staff,
On-site Grantees,
Contractors, and
Volunteers
Region VII Staff
Increase EPP
Purchases as a
Percentage of All
Purchases
• Develop/Provide Training
on Personal Sustainability
• Develop/Provide Training
on Sustainability Standards
for External Programs
Establish EMS
Sustainability Objectives &
Targets
Sustainability EMP
Sustainability Objectives
& Targets
Consultation Documents
Region VII Staff;
On-site Grantees,
Contractors, and
Volunteers; and
Region VII
Facilities Use Less
Water and
Electricity
Goal #1: The Region VII staff and on-site grantees, contactors, and volunteers will embrace the principles, and engage in the practices of, environmental stewardship and
sustainability (as depicted in our EMS) at organizational and personal levels.
Sustainability Standards
Training Program
Personal Sustainability
Training Program
External EMS
Stakeholders
(Contractors;
Local Citizens;
Local Federal
Agencies; HQ
EPA; City, State
& Tribal
Governments)Establish EMS
Sustainability
Environmental Management
Program
Region VII Staff and
On-site Grantee,
Contractor, and
Volunteer
Understanding of
How Sustainability
Applies to Personal
Decisions and
Activities Increases
EMS External
Stakeholder
Understanding of
How Sustainability
Applies to Their
Activities Increases Region VII Staff
and On-site
Grantees,
Contractors, and
Volunteers Increase
Use of Car Pooling
and Mass Transit
100% of
Appropriate
Purchases are EPP
50% Reduction in
Water and
Electricity Use at
Each Region VII
Facility
50% of Region VII
Staff and On-Site
Grantees,
Contractors, and
Volunteers Car
Pool or Use Mass
Transit for
Commuting
TO GOAL #2
TO GOAL #2
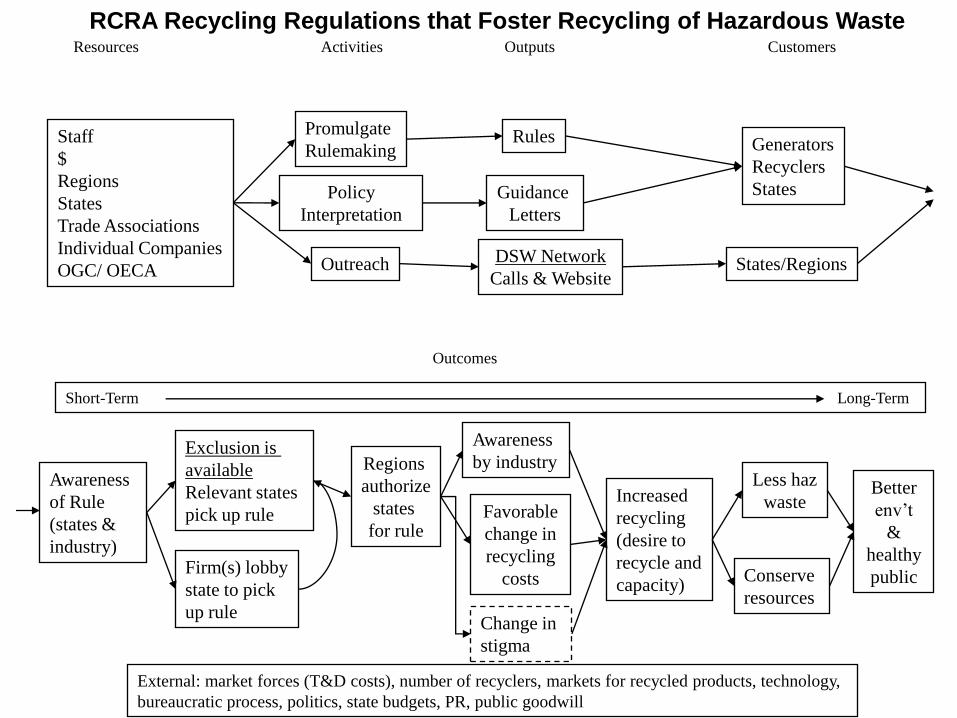
Resources
Staff
$
Regions
States
Trade Associations
Individual Companies
OGC/ OECA
Activities
Promulgate
Rulemaking
Policy
Interpretation
Outreach
Outputs
Rules
Guidance
Letters
DSW Network
Calls & Website
Customers
Generators
Recyclers
States
States/Regions
Outcomes
Short-Term Long-Term
Awareness
of Rule
(states &
industry)
Exclusion is
available
Relevant states
pick up rule
Firm(s) lobby
state to pick
up rule
Regions
authorize
states
for rule
Awareness
by industry
Favorable
change in
recycling
costs
Change in
stigma
Increased
recycling
(desire to
recycle and
capacity)
Less haz
waste
Conserve
resources
Better
env’t
&
healthy
public
External: market forces (T&D costs), number of recyclers, markets for recycled products, technology,
bureaucratic process, politics, state budgets, PR, public goodwill
RCRA Recycling Regulations that Foster Recycling of Hazardous Waste
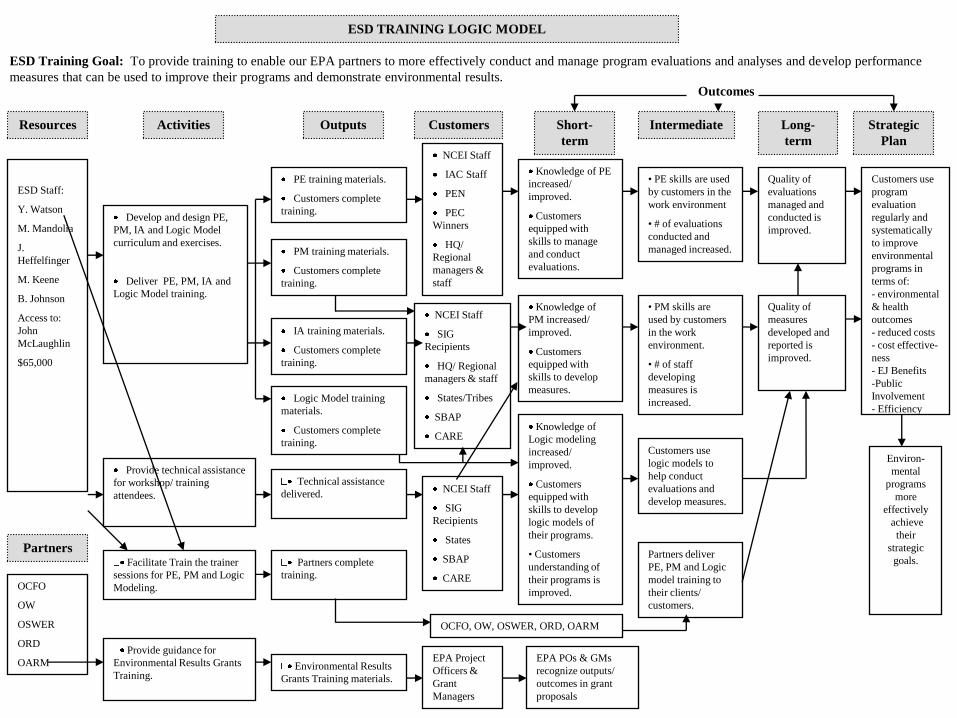
Develop and design PE,
PM, IA and Logic Model
curriculum and exercises.
Deliver PE, PM, IA and
Logic Model training.
• PE skills are used
by customers in the
work environment
• # of evaluations
conducted and
managed increased.
Resources
Outcomes
Short-
term
Intermediate Long-
term
OutputsActivities Customers
Knowledge of PE
increased/
improved.
Customers
equipped with
skills to manage
and conduct
evaluations.
ESD Staff:
Y. Watson
M. Mandolia
J.
Heffelfinger
M. Keene
B. Johnson
Access to:
John
McLaughlin
$65,000
NCEI Staff
IAC Staff
PEN
PEC
Winners
HQ/
Regional
managers &
staff
Partners
OCFO
OW
OSWER
ORD
OARM
Knowledge of
PM increased/
improved.
Customers
equipped with
skills to develop
measures.
Technical assistance
delivered.
Strategic
Plan
ESD TRAINING LOGIC MODEL
Knowledge of
Logic modeling
increased/
improved.
Customers
equipped with
skills to develop
logic models of
their programs.
• Customers
understanding of
their programs is
improved.
• PM skills are
used by customers
in the work
environment.
• # of staff
developing
measures is
increased.
Customers use
program
evaluation
regularly and
systematically
to improve
environmental
programs in
terms of:
- environmental
& health
outcomes
- reduced costs
- cost effective-
ness
- EJ Benefits
-Public
Involvement
- Efficiency
Environ-
mental
programs
more
effectively
achieve
their
strategic
goals.
Quality of
evaluations
managed and
conducted is
improved.
Quality of
measures
developed and
reported is
improved.
Provide technical assistance
for workshop/ training
attendees.
PM training materials.
Customers complete
training.
PE training materials.
Customers complete
training.
NCEI Staff
SIG
Recipients
HQ/ Regional
managers & staff
States/Tribes
SBAP
CARE
Customers use
logic models to
help conduct
evaluations and
develop measures.
Logic Model training
materials.
Customers complete
training.
NCEI Staff
SIG
Recipients
States
SBAP
CARE
Provide guidance for
Environmental Results Grants
Training.
Facilitate Train the trainer
sessions for PE, PM and Logic
Modeling.
Environmental Results
Grants Training materials.
Partners complete
training.
IA training materials.
Customers complete
training.
OCFO, OW, OSWER, ORD, OARM
EPA Project
Officers &
Grant
Managers
Partners deliver
PE, PM and Logic
model training to
their clients/
customers.
EPA POs & GMs
recognize outputs/
outcomes in grant
proposals
ESD Training Goal: To provide training to enable our EPA partners to more effectively conduct and manage program evaluations and analyses and develop performance
measures that can be used to improve their programs and demonstrate environmental results.
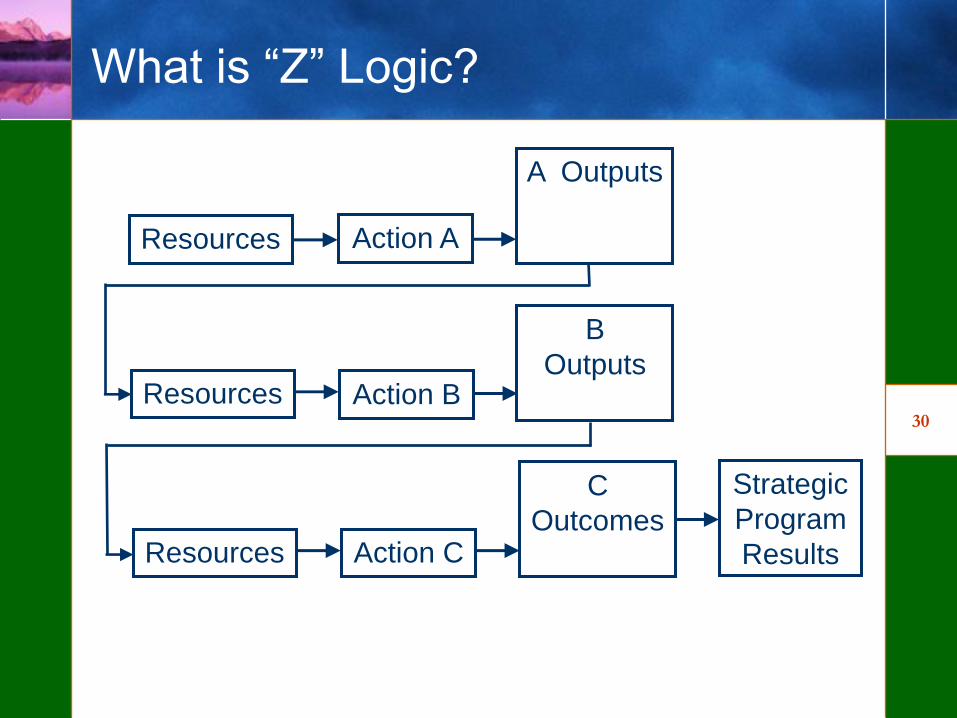
30
What is ―Z‖ Logic?
A Outputs
Resources Action A
B
OutputsResources Action B
Strategic
Program
Results
C
OutcomesResources Action C
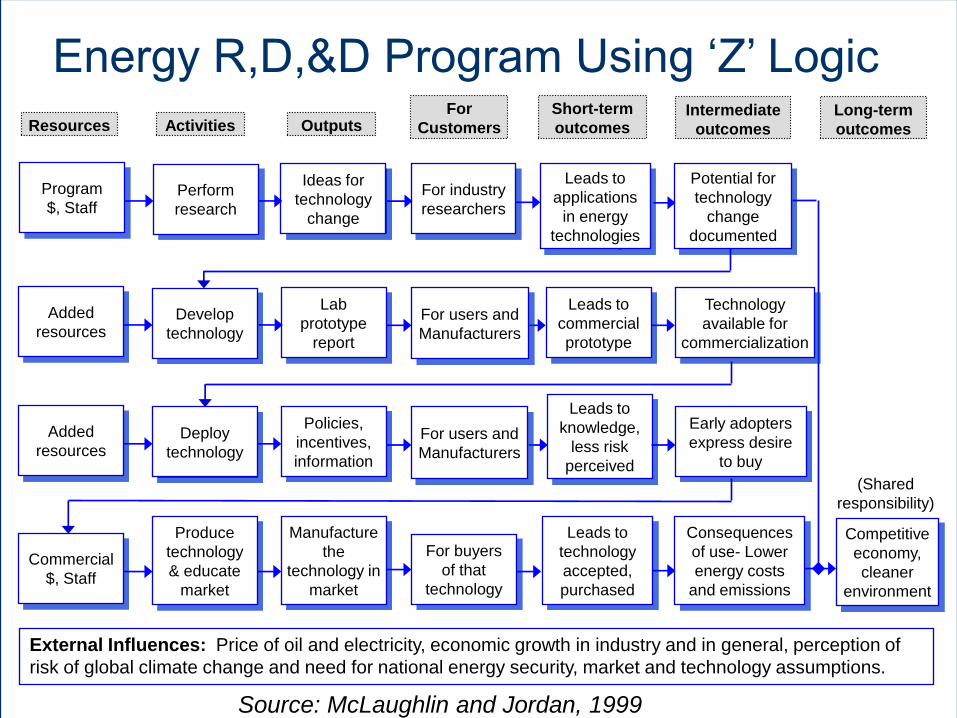
31
Resources Activities OutputsFor
Customers
Short-term
outcomesIntermediate
outcomes
Long-term
outcomes
Energy R,D,&D Program Using ‗Z‘ Logic
Perform
research
External Influences: Price of oil and electricity, economic growth in industry and in general, perception of
risk of global climate change and need for national energy security, market and technology assumptions.
Source: McLaughlin and Jordan, 1999
Program
$, Staff
Ideas for
technology
change
Potential for
technology
change
documented
Leads to
applications
in energy
technologies
For industry
researchers
Develop
technology
Added
resources
Lab
prototype
report
Technology
available for
commercialization
Leads to
commercial
prototype
Deploy
technology
Added
resources
Policies,
incentives,
information
Early adopters
express desire
to buy
Leads to
knowledge,
less risk
perceived
Produce
technology
& educate
market
Commercial
$, Staff
Manufacture
the
technology in
market
Consequences
of use- Lower
energy costs
and emissions
Leads to
technology
accepted,
purchased
For buyers
of that
technology
For users and
Manufacturers
For users and
Manufacturers
Competitive
economy,
cleaner
environment
(Shared
responsibility)
32
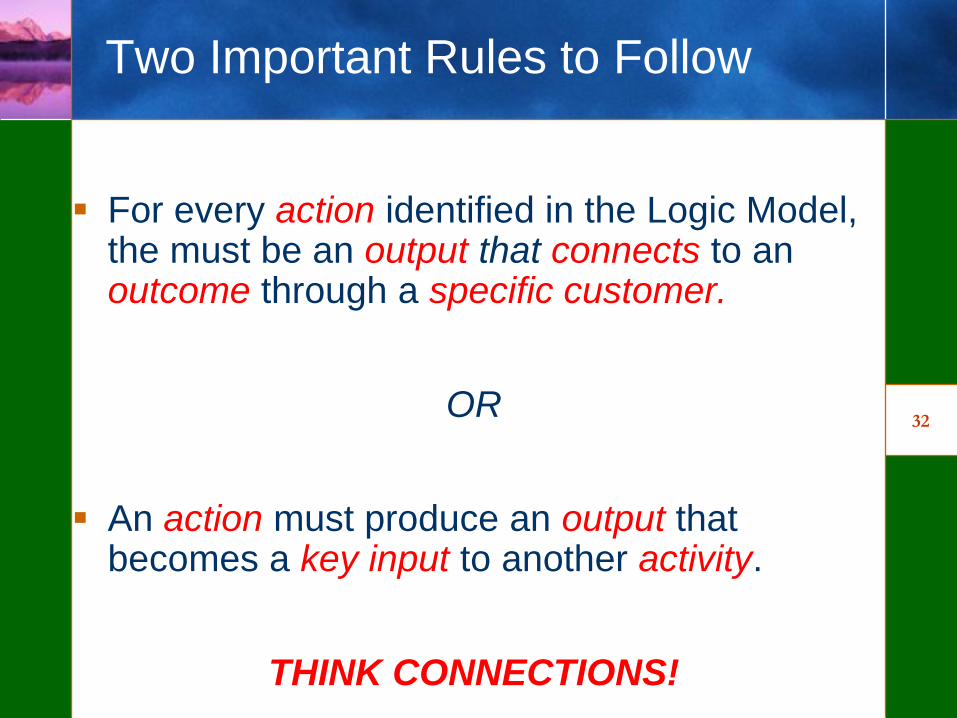
Two Important Rules to Follow
For every action identified in the Logic Model, the must be an output that connects to an outcome through a specific customer.
OR
An action must produce an output that becomes a key input to another activity.
THINK CONNECTIONS!
33
Exercise 2: Logic Modeling
Developing your own logic model
34
Module 2:
Logic Models and Work Plan
Development
35
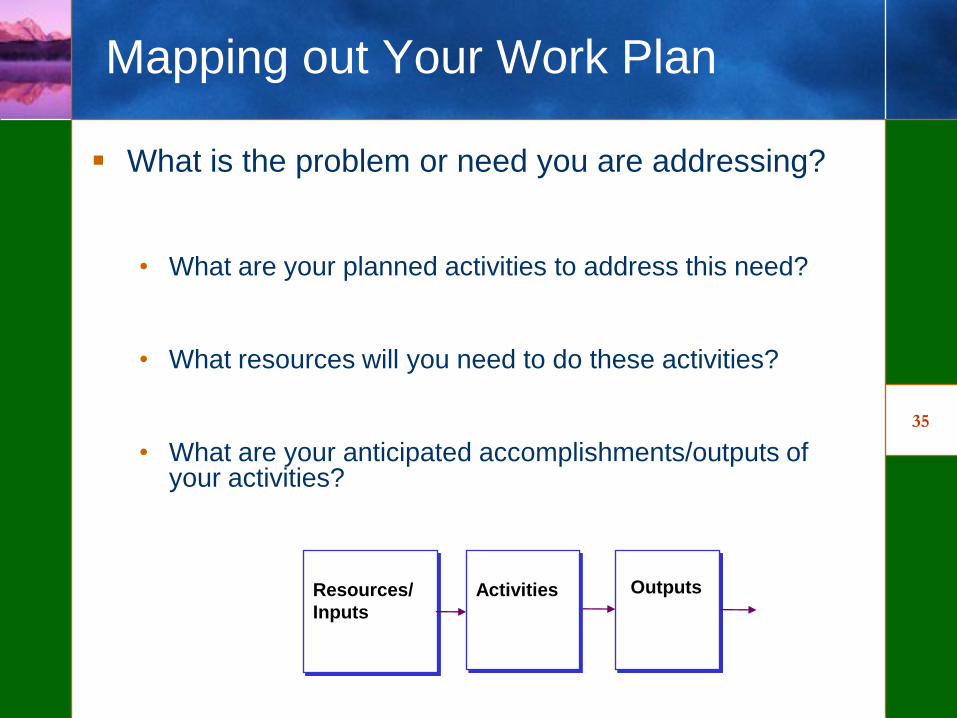
Mapping out Your Work Plan
What is the problem or need you are addressing?
• What are your planned activities to address this need?
• What resources will you need to do these activities?
• What are your anticipated accomplishments/outputs of your activities?
OutputsActivitiesResources/
Inputs
36
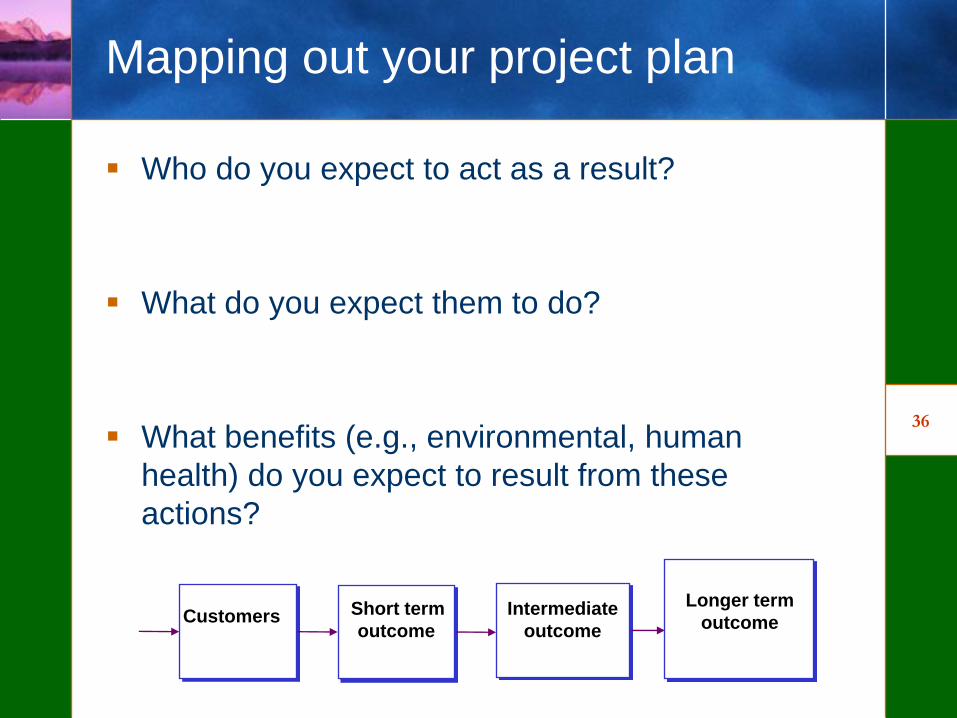
Mapping out your project plan
Who do you expect to act as a result?
What do you expect them to do?
What benefits (e.g., environmental, human
health) do you expect to result from these
actions?
Longer term
outcomeShort term
outcomeCustomers Intermediate
outcome
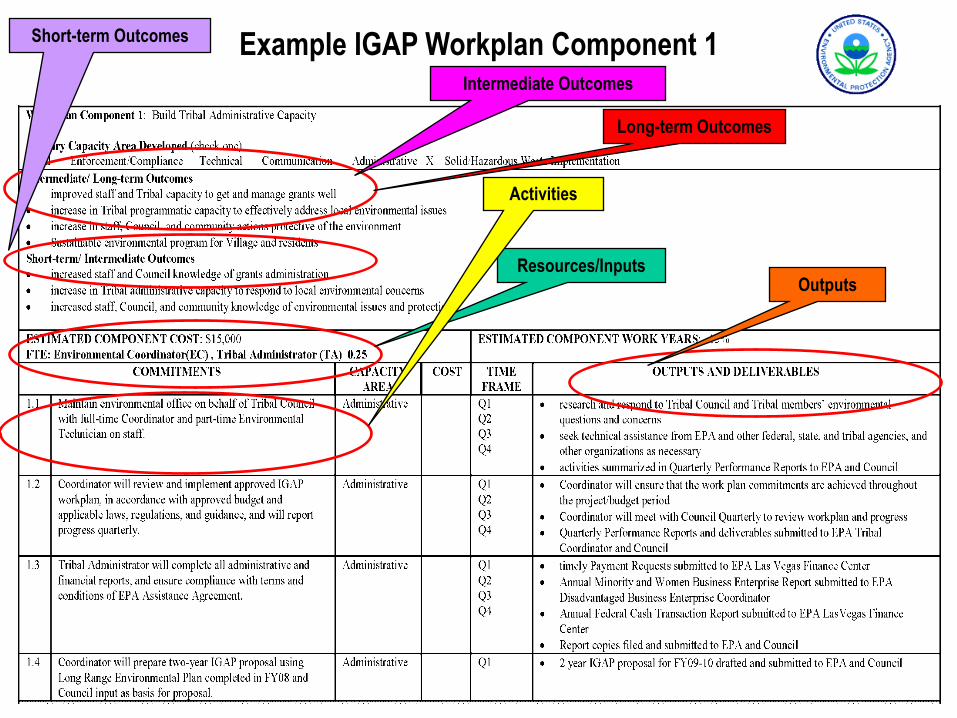
Example IGAP Workplan Component 1Intermediate Outcomes
Resources/InputsOutputs
Activities
Short-term Outcomes
Long-term Outcomes
38
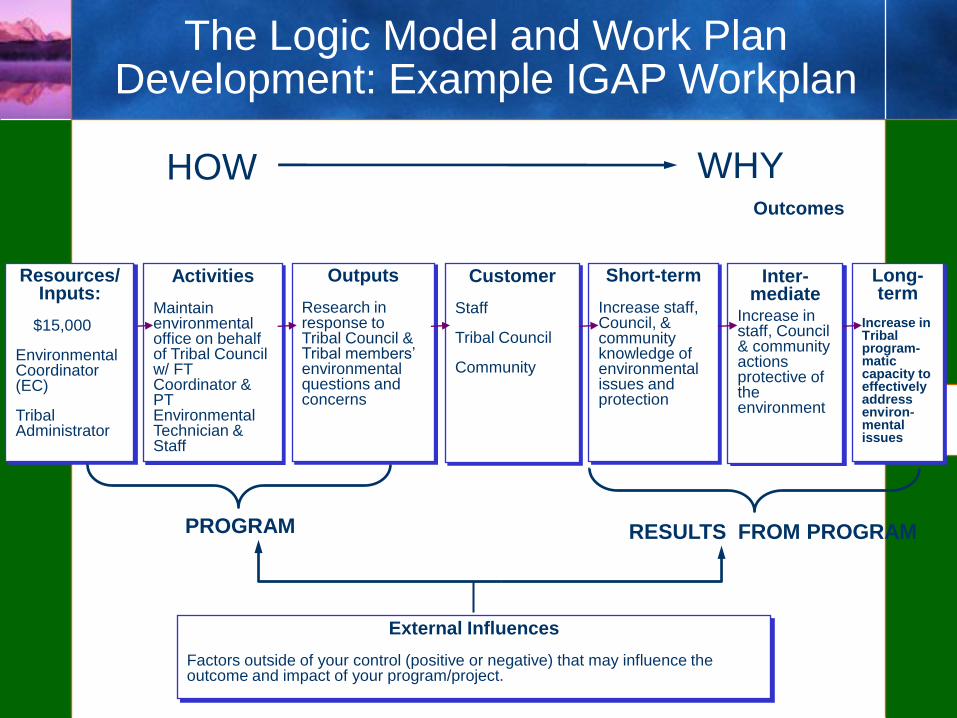
Inter-mediate
Increase in staff, Council & community actions protective of the environment
Customer
Staff
Tribal Council
Community
Activities
Maintain environmental office on behalf of Tribal Council w/ FT Coordinator & PT Environmental Technician & Staff
Outputs
Research in response to Tribal Council & Tribal members‘ environmental questions and concerns
Resources/ Inputs:
$15,000
Environmental Coordinator (EC)
Tribal Administrator
Short-term
Increase staff, Council, & community knowledge of environmental issues and protection
Long-term
Increase in Tribal program-matic capacity to effectively address environ-mental issues
External Influences
Factors outside of your control (positive or negative) that may influence the outcome and impact of your program/project.
Outcomes
WHYHOW
PROGRAM RESULTS FROM PROGRAM
The Logic Model and Work Plan Development: Example IGAP Workplan
39
Module 2:
Identifying and Developing
Performance Measures
40
PERFORMANCE MANAGEMENT
Performance management includes activities to ensure that goals are consistently
being met in an effective and efficient manner. Performance management tools
include logic models, performance measurement and program evaluation.
Logic Model
Tool/framework that
helps identify the
program/project
resources,
activities, outputs
customers, and
outcomes.
Performance
Measurement
Helps you
understand what
level of
performance is
achieved by the
program/project.
Program
Evaluation
Helps you
understand and
explain why you‘re
seeing the
program/project
results.
Performance Management Tools
41
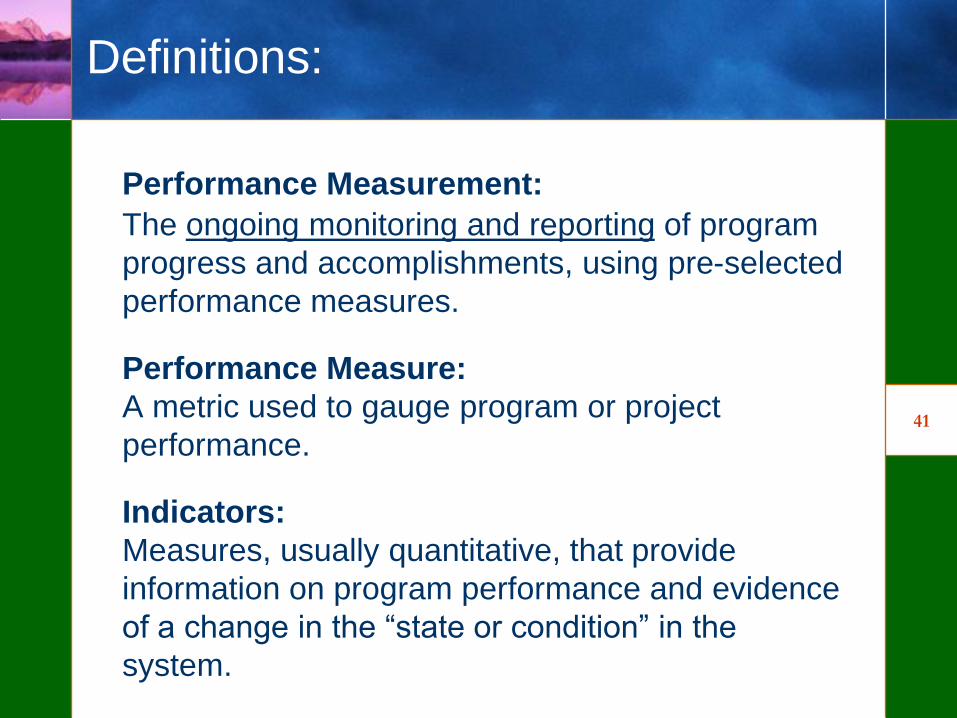
Definitions:
Performance Measurement:
The ongoing monitoring and reporting of program
progress and accomplishments, using pre-selected
performance measures.
Performance Measure:
A metric used to gauge program or project
performance.
Indicators:
Measures, usually quantitative, that provide
information on program performance and evidence
of a change in the ―state or condition‖ in the
system.
42
Performance Measurement Questions
What are they?
• Questions designed to assess
progress/ accomplishments of various
aspects of a program/project.
• Performance measurement questions
ask/tell you what your program is doing.
43
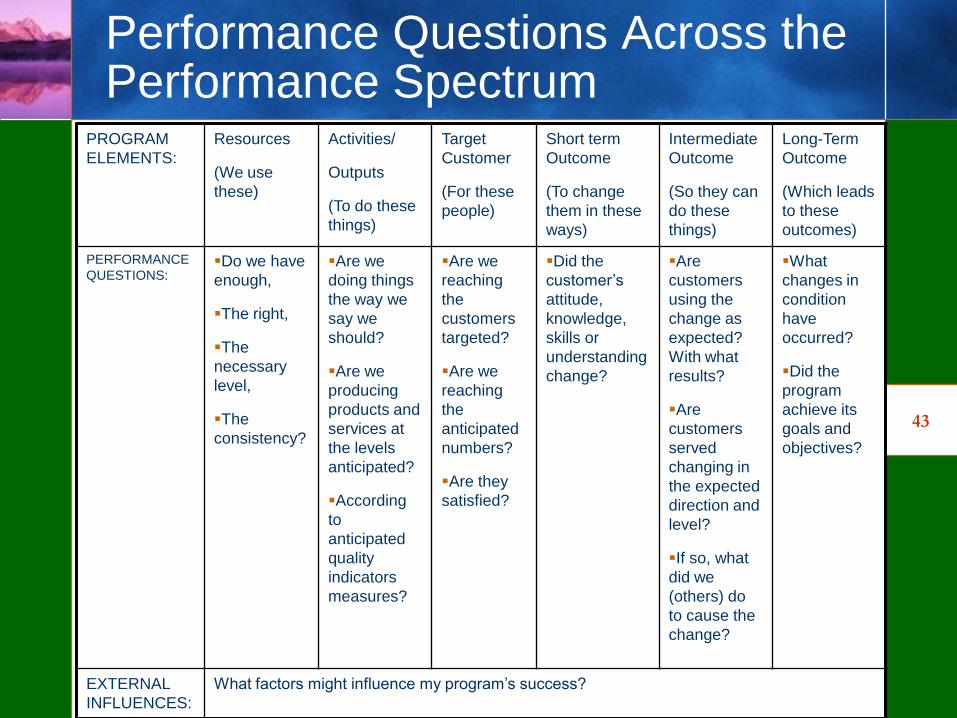
Performance Questions Across the Performance Spectrum
PROGRAM
ELEMENTS:
Resources
(We use
these)
Activities/
Outputs
(To do these
things)
Target
Customer
(For these
people)
Short term
Outcome
(To change
them in these
ways)
Intermediate
Outcome
(So they can
do these
things)
Long-Term
Outcome
(Which leads
to these
outcomes)
PERFORMANCE
QUESTIONS:Do we have
enough,
The right,
The
necessary
level,
The
consistency?
Are we
doing things
the way we
say we
should?
Are we
producing
products and
services at
the levels
anticipated?
According
to
anticipated
quality
indicators
measures?
Are we
reaching
the
customers
targeted?
Are we
reaching
the
anticipated
numbers?
Are they
satisfied?
Did the
customer‘s
attitude,
knowledge,
skills or
understanding
change?
Are
customers
using the
change as
expected?
With what
results?
Are
customers
served
changing in
the expected
direction and
level?
If so, what
did we
(others) do
to cause the
change?
What
changes in
condition
have
occurred?
Did the
program
achieve its
goals and
objectives?
EXTERNAL
INFLUENCES:
What factors might influence my program‘s success?
44
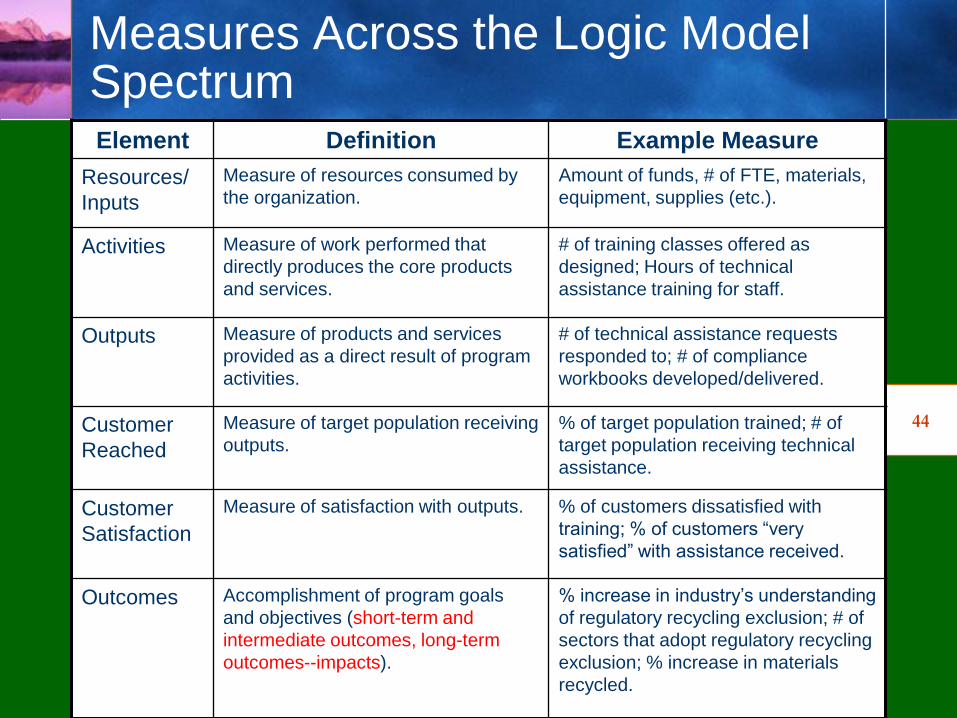
Measures Across the Logic Model SpectrumElement Definition Example Measure
Resources/
Inputs
Measure of resources consumed by
the organization.
Amount of funds, # of FTE, materials,
equipment, supplies (etc.).
Activities Measure of work performed that
directly produces the core products
and services.
# of training classes offered as
designed; Hours of technical
assistance training for staff.
Outputs Measure of products and services
provided as a direct result of program
activities.
# of technical assistance requests
responded to; # of compliance
workbooks developed/delivered.
Customer
Reached
Measure of target population receiving
outputs.
% of target population trained; # of
target population receiving technical
assistance.
Customer
Satisfaction
Measure of satisfaction with outputs. % of customers dissatisfied with
training; % of customers ―very
satisfied‖ with assistance received.
Outcomes Accomplishment of program goals
and objectives (short-term and
intermediate outcomes, long-term
outcomes--impacts).
% increase in industry‘s understanding
of regulatory recycling exclusion; # of
sectors that adopt regulatory recycling
exclusion; % increase in materials
recycled.
45
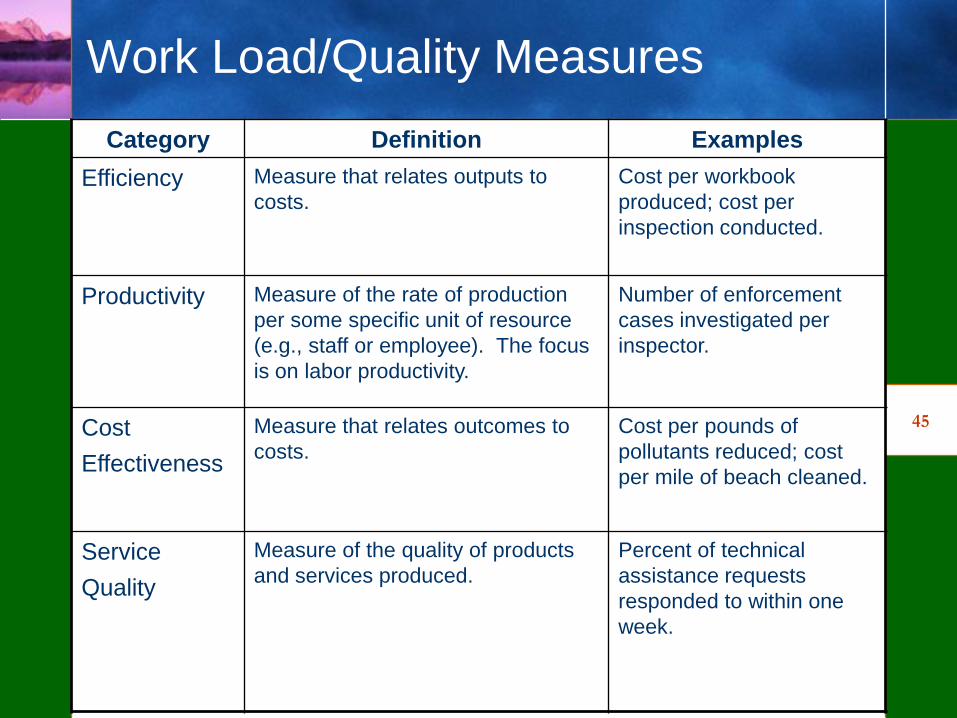
Work Load/Quality Measures
Category Definition Examples
Efficiency Measure that relates outputs to
costs.
Cost per workbook
produced; cost per
inspection conducted.
Productivity Measure of the rate of production
per some specific unit of resource
(e.g., staff or employee). The focus
is on labor productivity.
Number of enforcement
cases investigated per
inspector.
Cost
Effectiveness
Measure that relates outcomes to
costs.
Cost per pounds of
pollutants reduced; cost
per mile of beach cleaned.
Service
Quality
Measure of the quality of products
and services produced.
Percent of technical
assistance requests
responded to within one
week.
46
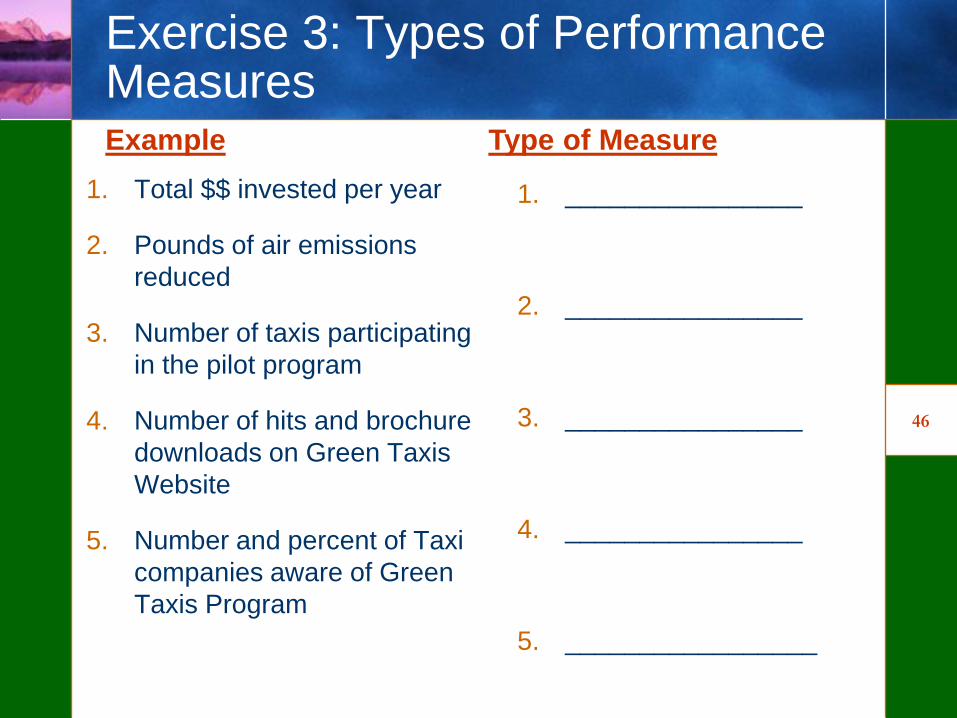
Exercise 3: Types of Performance Measures
1. Total $$ invested per year
2. Pounds of air emissions
reduced
3. Number of taxis participating
in the pilot program
4. Number of hits and brochure
downloads on Green Taxis
Website
5. Number and percent of Taxi
companies aware of Green
Taxis Program
Example Type of Measure
1. ________________
2. ________________
3. ________________
4. ________________
5. _________________
47
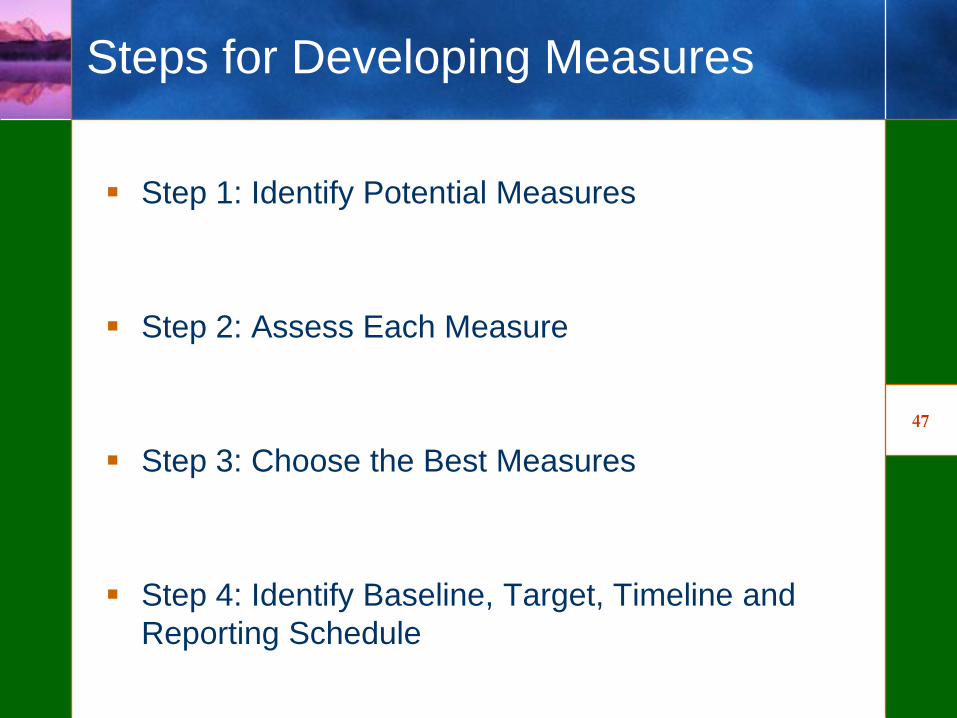
Steps for Developing Measures
Step 1: Identify Potential Measures
Step 2: Assess Each Measure
Step 3: Choose the Best Measures
Step 4: Identify Baseline, Target, Timeline and
Reporting Schedule
48
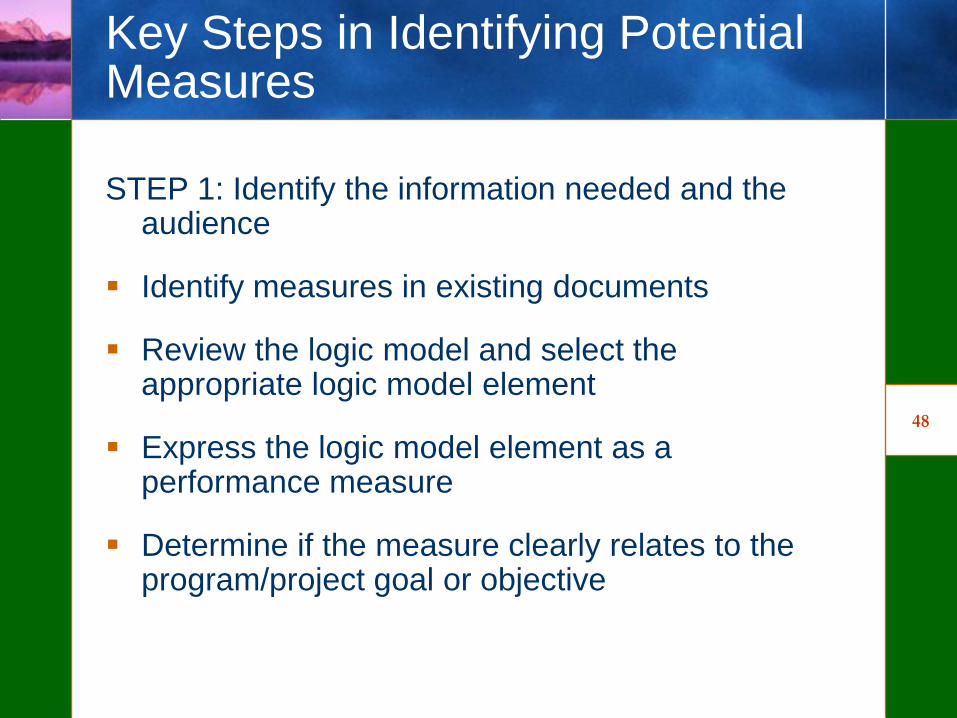
Key Steps in Identifying Potential Measures
STEP 1: Identify the information needed and the audience
Identify measures in existing documents
Review the logic model and select the appropriate logic model element
Express the logic model element as a performance measure
Determine if the measure clearly relates to the program/project goal or objective
49
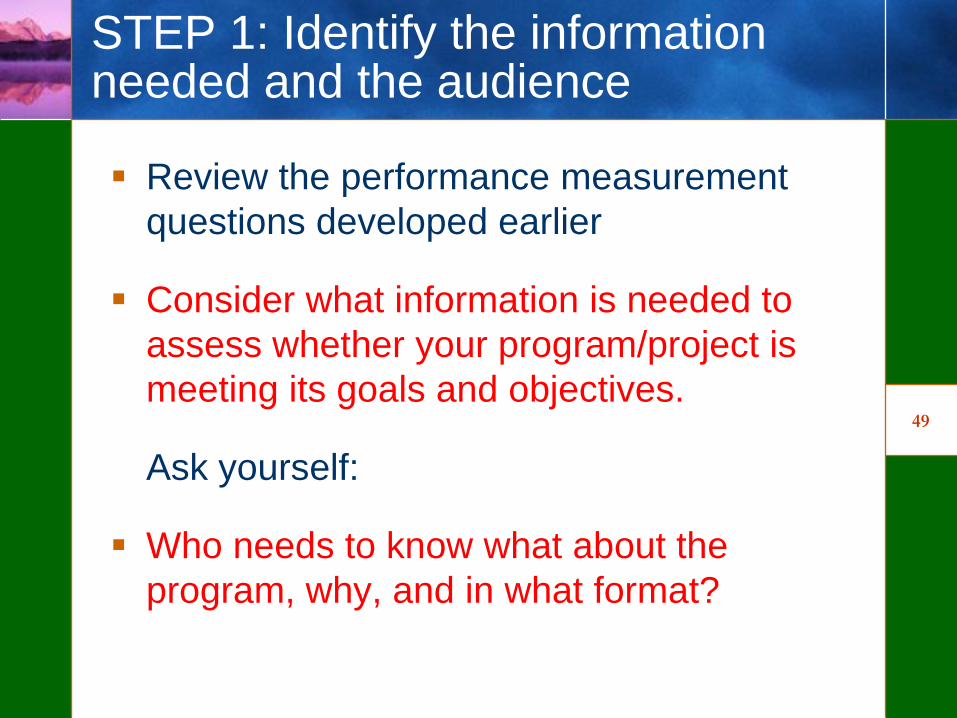
STEP 1: Identify the information needed and the audience
Review the performance measurement
questions developed earlier
Consider what information is needed to
assess whether your program/project is
meeting its goals and objectives.
Ask yourself:
Who needs to know what about the
program, why, and in what format?
50
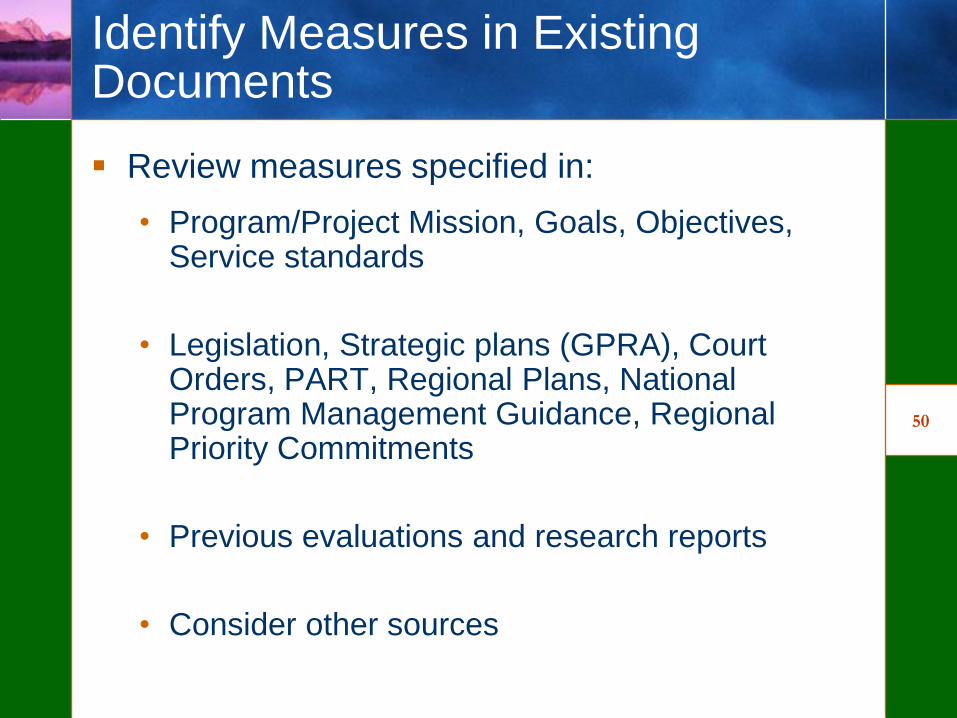
Identify Measures in Existing Documents
Review measures specified in:
• Program/Project Mission, Goals, Objectives, Service standards
• Legislation, Strategic plans (GPRA), Court Orders, PART, Regional Plans, National Program Management Guidance, Regional Priority Commitments
• Previous evaluations and research reports
• Consider other sources
51
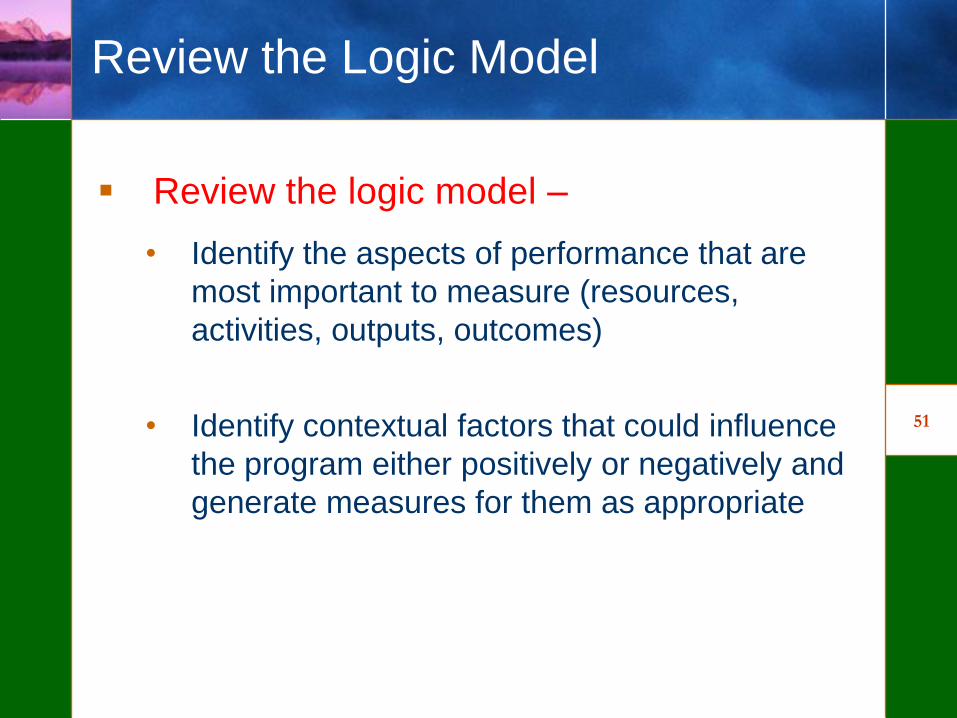
Review the Logic Model
Review the logic model –
• Identify the aspects of performance that are
most important to measure (resources,
activities, outputs, outcomes)
• Identify contextual factors that could influence
the program either positively or negatively and
generate measures for them as appropriate
GREEN TAXIS PROGRAM
Program Goal: The goal of the Green Taxi Program is to facilitate replacement of existing taxis with very low emitting vehicles. The program will
also provide education on the additional benefits of green taxis and the suitability of these vehicles to meet industry needs.
Resources
Outcomes
Short-term Intermediate Long-termOutputsActivities Customers
Increased
visibility of
green taxi
program
•Dallas
FTE
•EPA
Region 6
FTE
•OAQPS
FTE
•OTAQ
FTE
•TCEQ
FTE
•Taxi
companies
•Rental car
agencies
•Local
corporations
•Public
interest
groups
•Airport Police
•Hotels
•Local media
•General
public
Improved
corporate
attitudes
about using
green taxis
Accelerated
fleet
turnover
•Reduction
in fleet fuel
use
•Improved
air quality
Solicit 5 – 6 Taxis
for pilot project
Local corporate
commitments to
using Green
Taxis
Several Green
Taxis in operation
•Green Taxis
brand
•Marketing and
outreach plan
Develop initial
commitments
Marketing Strategy
•Develop marketing
materials
•Develop Green
Taxi brand
•Identify outreach
opportunities
•Develop marketing
and outreach plan
Awareness
of financial &
non-financial
incentives,
eligibility
criteria
Pilot
program
operational
Increased
market
penetration
of green
taxis
53
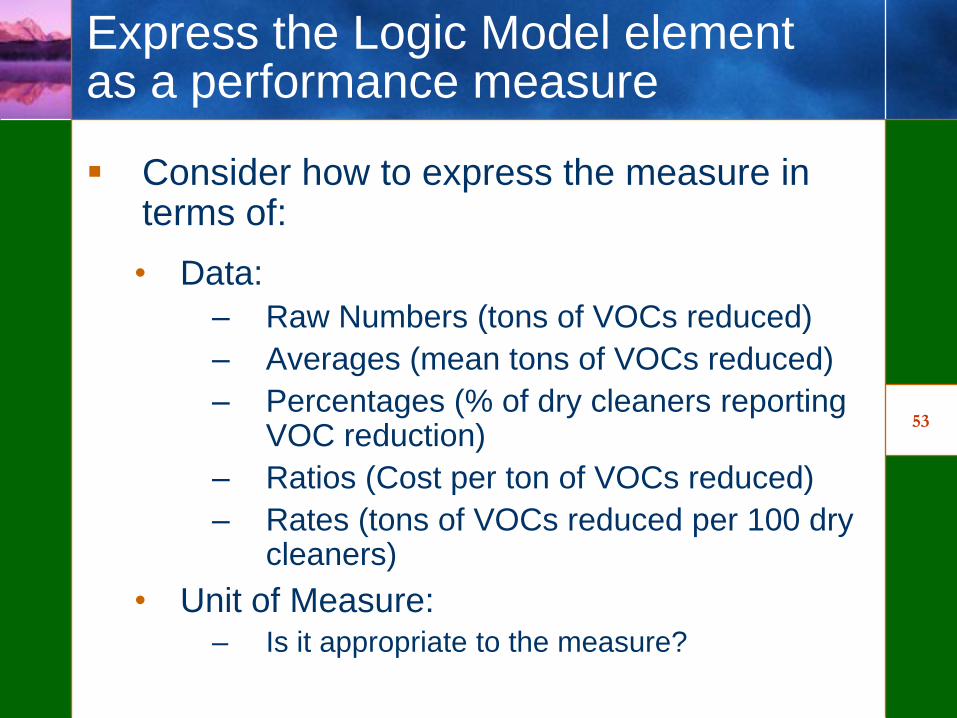
Express the Logic Model element as a performance measure
Consider how to express the measure in terms of:
• Data:
– Raw Numbers (tons of VOCs reduced)
– Averages (mean tons of VOCs reduced)
– Percentages (% of dry cleaners reporting VOC reduction)
– Ratios (Cost per ton of VOCs reduced)
– Rates (tons of VOCs reduced per 100 dry cleaners)
• Unit of Measure:– Is it appropriate to the measure?
54
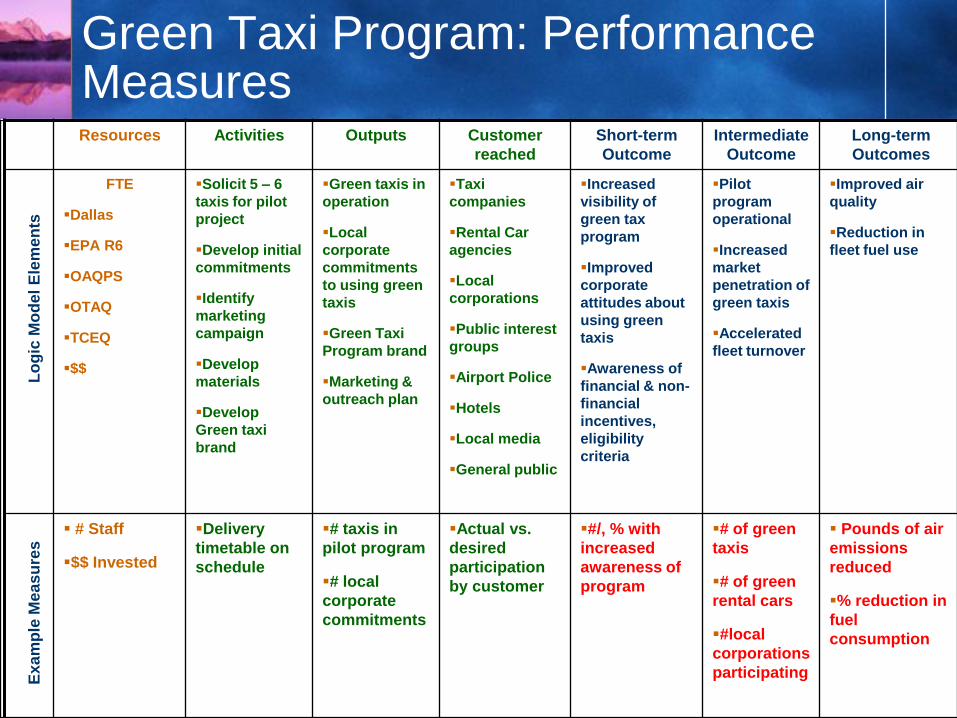
Green Taxi Program: Performance MeasuresResources Activities Outputs Customer
reached
Short-term
Outcome
Intermediate
Outcome
Long-term
Outcomes
FTE
Dallas
EPA R6
OAQPS
OTAQ
TCEQ
$$
Solicit 5 – 6
taxis for pilot
project
Develop initial
commitments
Identify
marketing
campaign
Develop
materials
Develop
Green taxi
brand
Green taxis in
operation
Local
corporate
commitments
to using green
taxis
Green Taxi
Program brand
Marketing &
outreach plan
Taxi
companies
Rental Car
agencies
Local
corporations
Public interest
groups
Airport Police
Hotels
Local media
General public
Increased
visibility of
green tax
program
Improved
corporate
attitudes about
using green
taxis
Awareness of
financial & non-
financial
incentives,
eligibility
criteria
Pilot
program
operational
Increased
market
penetration of
green taxis
Accelerated
fleet turnover
Improved air
quality
Reduction in
fleet fuel use
# Staff
$$ Invested
Delivery
timetable on
schedule
# taxis in
pilot program
# local
corporate
commitments
Actual vs.
desired
participation
by customer
#/, % with
increased
awareness of
program
# of green
taxis
# of green
rental cars
#local
corporations
participating
Pounds of air
emissions
reduced
% reduction in
fuel
consumption
Ex
am
ple
Me
as
ure
sL
og
ic M
od
el
Ele
me
nts
55
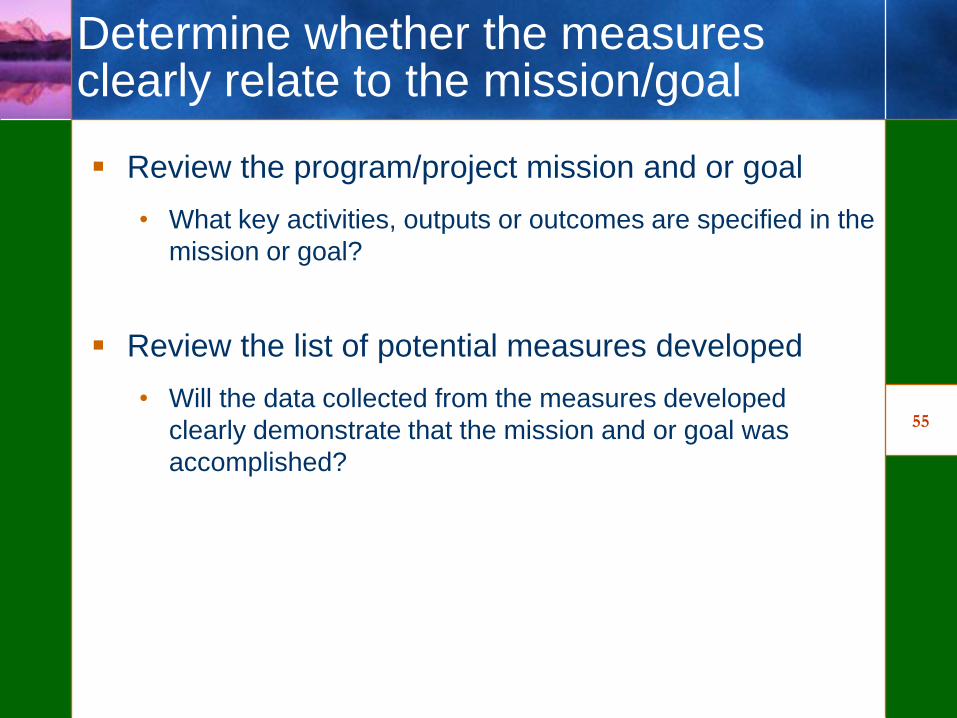
Determine whether the measures clearly relate to the mission/goal
Review the program/project mission and or goal
• What key activities, outputs or outcomes are specified in the
mission or goal?
Review the list of potential measures developed
• Will the data collected from the measures developed
clearly demonstrate that the mission and or goal was
accomplished?
56
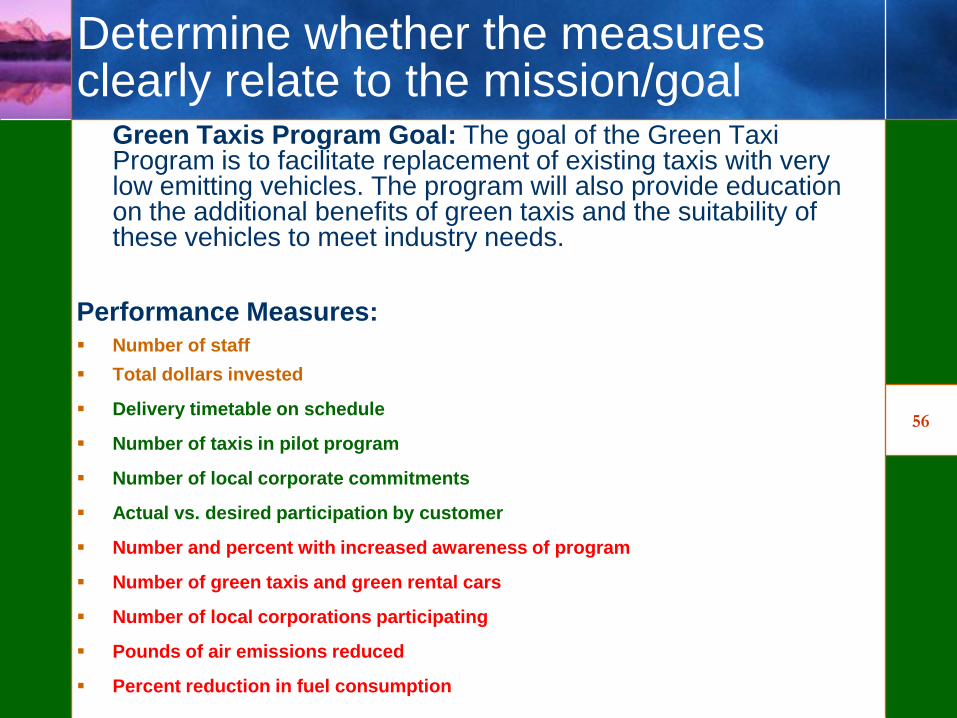
Determine whether the measures clearly relate to the mission/goal
Green Taxis Program Goal: The goal of the Green Taxi Program is to facilitate replacement of existing taxis with very low emitting vehicles. The program will also provide education on the additional benefits of green taxis and the suitability of these vehicles to meet industry needs.
Performance Measures: Number of staff
Total dollars invested
Delivery timetable on schedule
Number of taxis in pilot program
Number of local corporate commitments
Actual vs. desired participation by customer
Number and percent with increased awareness of program
Number of green taxis and green rental cars
Number of local corporations participating
Pounds of air emissions reduced
Percent reduction in fuel consumption
57
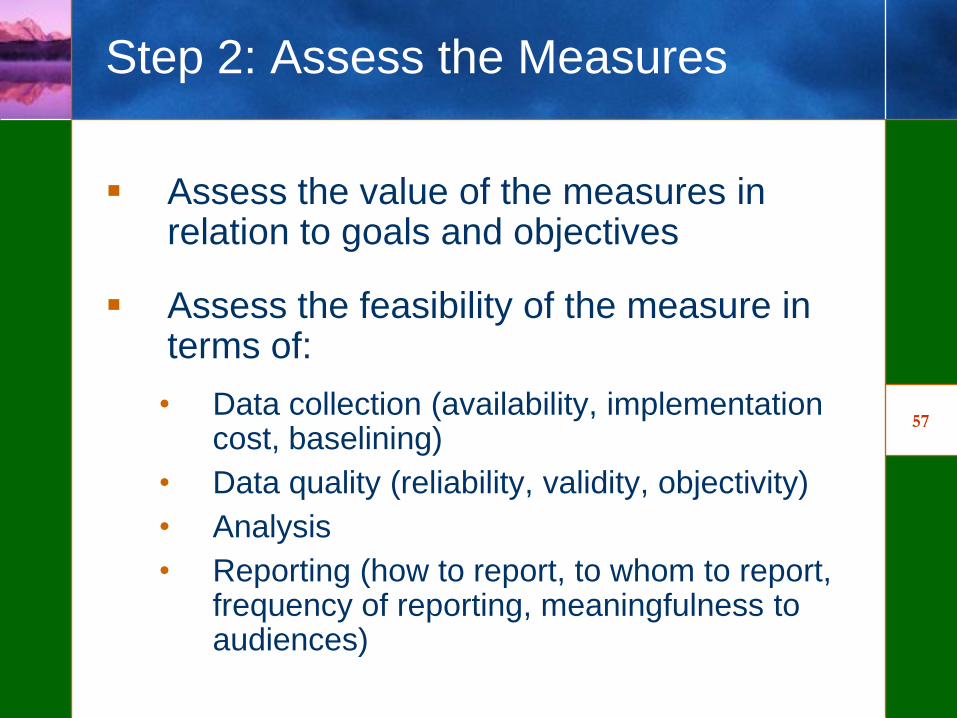
Step 2: Assess the Measures
Assess the value of the measures in relation to goals and objectives
Assess the feasibility of the measure in terms of:
• Data collection (availability, implementation cost, baselining)
• Data quality (reliability, validity, objectivity)
• Analysis
• Reporting (how to report, to whom to report, frequency of reporting, meaningfulness to audiences)
58
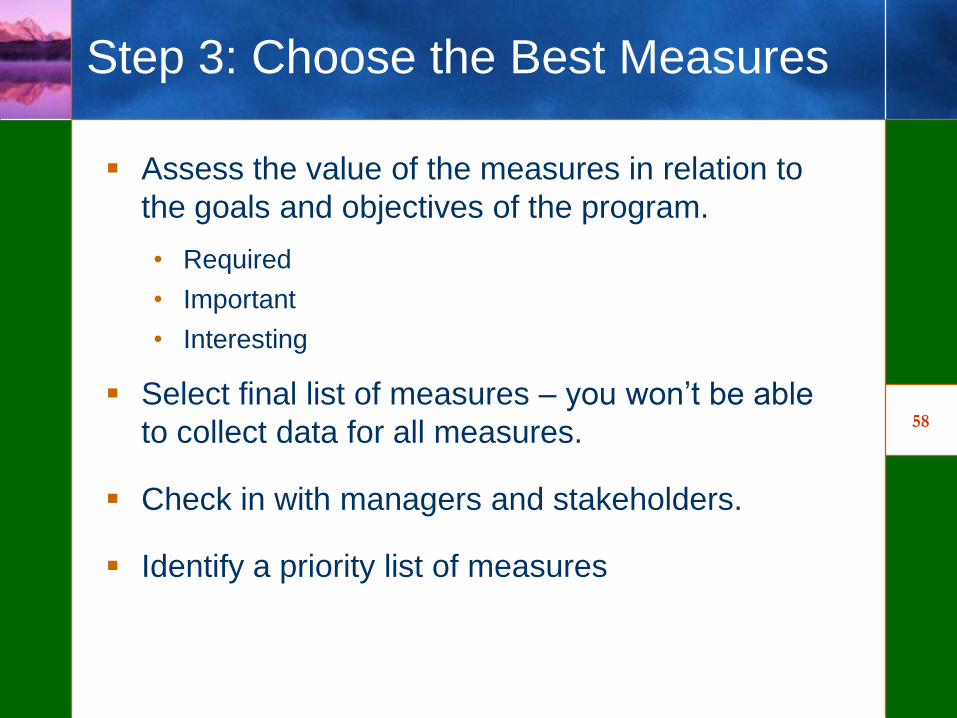
Step 3: Choose the Best Measures
Assess the value of the measures in relation to
the goals and objectives of the program.
• Required
• Important
• Interesting
Select final list of measures – you won‘t be able
to collect data for all measures.
Check in with managers and stakeholders.
Identify a priority list of measures
59
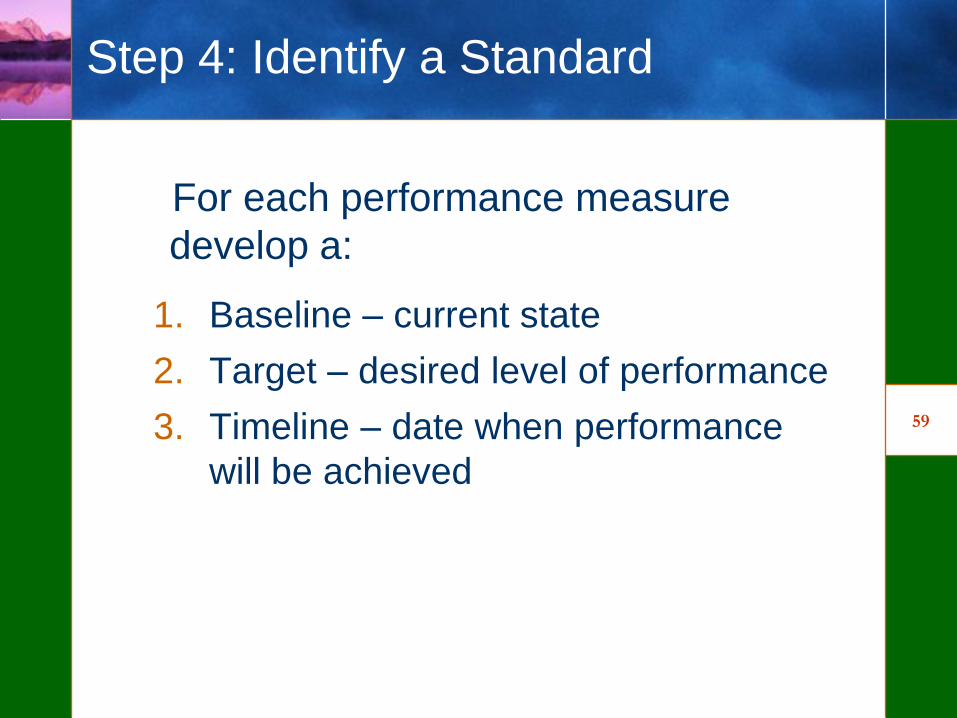
Step 4: Identify a Standard
For each performance measure
develop a:
1. Baseline – current state
2. Target – desired level of performance
3. Timeline – date when performance
will be achieved
60
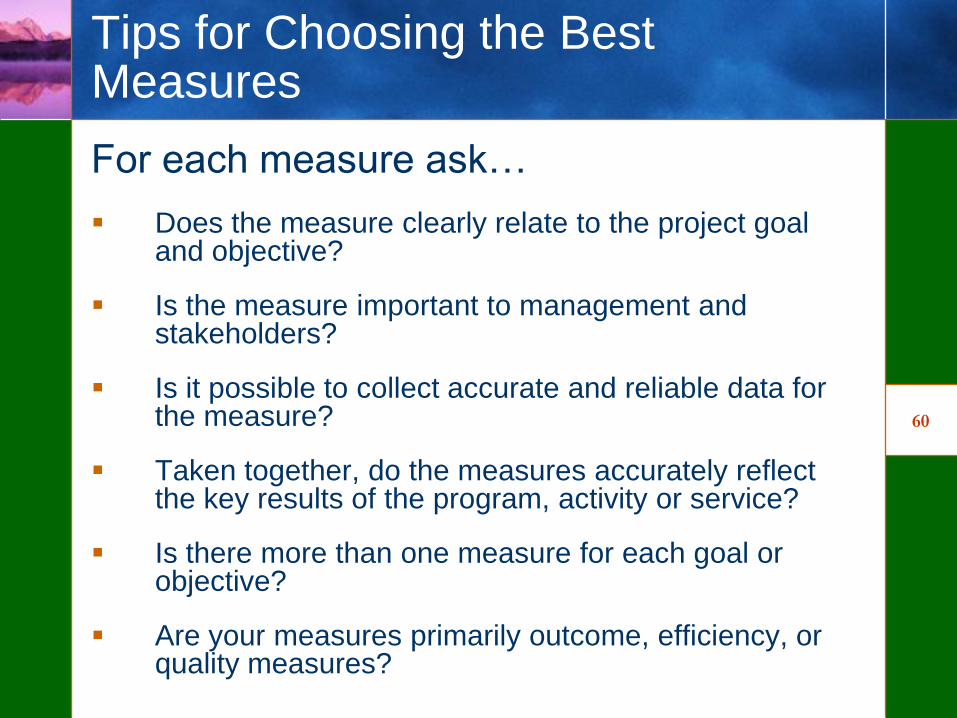
Tips for Choosing the Best Measures
For each measure ask…
Does the measure clearly relate to the project goal and objective?
Is the measure important to management and stakeholders?
Is it possible to collect accurate and reliable data for the measure?
Taken together, do the measures accurately reflect the key results of the program, activity or service?
Is there more than one measure for each goal or objective?
Are your measures primarily outcome, efficiency, or quality measures?
61
Exercise 4: Application of
Performance Measure
Development
Developing Your Own Measures
62
Questions and Answers?