LoggerNet User's Manual · LoggerNet may be run successfully on Windows 95, 98, or ME if the user...
306
LOGGERNET USER’S MANUAL Version 2.1 REVISION: 8/02 COPYRIGHT (c) 1999-2002 CAMPBELL SCIENTIFIC, INC.
Transcript of LoggerNet User's Manual · LoggerNet may be run successfully on Windows 95, 98, or ME if the user...

LOGGERNET USER’S MANUAL
Version 2.1
REVISION: 8/02
COPYRIGHT (c) 1999-2002 CAMPBELL SCIENTIFIC, INC.

This is a blank page.

License for UseThis software is protected by both United States copyright law and internationalcopyright treaty provisions. The installation and use of this software constitutesan agreement to abide by the provisions of this license agreement.
You may make a copy of this software on a second computer for the solepurpose of backing-up CAMPBELL SCIENTIFIC, INC. software andprotecting your investment from loss. This software may not be sold, includedor redistributed in any other software, or altered in any way without priorwritten permission from Campbell Scientific. All copyright notices andlabeling must be left intact.

This is a blank page.

Limited WarrantyCAMPBELL SCIENTIFIC, INC. warrants that the installation media on whichthe accompanying computer software is recorded and the documentationprovided with it are free from physical defects in materials and workmanshipunder normal use. CAMPBELL SCIENTIFIC, INC. warrants that thecomputer software itself will perform substantially in accordance with thespecifications set forth in the instruction manual published by CAMPBELLSCIENTIFIC, INC. The recommended minimum hardware for LoggerNet is a300 MHz Pentium II processor with 64 megabytes of RAM and a screen area ofat least 800x600. LoggerNet uses the features of Windows NT, 2000, or XPthat maximize the reliability of unattended scheduled data collection andmultitasking application programs. LoggerNet may be run successfully onWindows 95, 98, or ME if the user limits the number of screens open at anyone time.
CAMPBELL SCIENTIFIC, INC. will either replace or correct any softwarethat does not perform substantially according to the specifications set forth inthe instruction manual with a corrected copy of the software or corrective code.In the case of significant error in the installation media or documentation,CAMPBELL SCIENTIFIC, INC. will correct errors without charge byproviding new media, addenda or substitute pages.
If CAMPBELL SCIENTIFIC, INC. is unable to replace defective media ordocumentation, or if CAMPBELL SCIENTIFIC, INC. is unable to providecorrected software or corrected documentation within a reasonable time,CAMPBELL SCIENTIFIC, INC. will either replace the software with afunctionally similar program or refund the purchase price paid for the software.
The above warranties are made for ninety (90) days from the date of originalshipment.
CAMPBELL SCIENTIFIC, INC. does not warrant that the software will meetlicensee’s requirements or that the software or documentation are error free orthat the operation of the software will be uninterrupted. The warranty does notcover any diskette or documentation that has been damaged or abused. Thesoftware warranty does not cover any software that has been altered or changedin any way by anyone other than CAMPBELL SCIENTIFIC, INC.CAMPBELL SCIENTIFIC, INC. is not responsible for problems caused bycomputer hardware, computer operating systems or the use of CAMPBELLSCIENTIFIC, INC.’s software with non-CAMPBELL SCIENTIFIC, INC.software.
ALL WARRANTIES OF MERCHANTABILITY AND FITNESS FOR APARTICULAR PURPOSE ARE DISCLAIMED AND EXCLUDED.CAMPBELL SCIENTIFIC, INC. SHALL NOT IN ANY CASE BE LIABLEFOR SPECIAL, INCIDENTAL, CONSEQUENTIAL, INDIRECT, OROTHER SIMILAR DAMAGES EVEN IF CAMPBELL SCIENTIFIC HASBEEN ADVISED OF THE POSSIBILITY OF SUCH DAMAGES.
CAMPBELL SCIENTIFIC, INC. IS NOT RESPONSIBLE FOR ANY COSTSINCURRED AS A RESULT OF LOST PROFITS OR REVENUE, LOSS OFUSE OF THE SOFTWARE, LOSS OF DATA, COST OF RE-CREATING

LOST DATA, THE COST OF ANY SUBSTITUTE PROGRAM, CLAIMSBY ANY PARTY OTHER THAN LICENSEE, OR FOR OTHER SIMILARCOSTS.
LICENSEE’S SOLE AND EXCLUSIVE REMEDY IS SET FORTH IN THISLIMITED WARRANTY. CAMPBELL SCIENTIFIC, INC.’S AGGREGATELIABILITY ARISING FROM OR RELATING TO THIS AGREEMENT ORTHE SOFTWARE OR DOCUMENTATION (REGARDLESS OF THEFORM OF ACTION; E.G., CONTRACT, TORT, COMPUTERMALPRACTICE, FRAUD AND/OR OTHERWISE) IS LIMITED TO THEPURCHASE PRICE PAID BY THE LICENSEE.
815 W. 1800 N.Logan, UT 84321-1784USAPhone (435) 753-2342FAX (435) 750-9540www.campbellsci.com
Campbell Scientific Canada Corp.11564 -149th StreetEdmonton, Alberta T5M 1W7CANADAPhone (780) 454-2505FAX (780) 454-2655
Campbell Scientific Ltd.Campbell Park80 Hathern RoadShepshed, LoughboroughLE12 9GX, U.K.Phone +44 (0) 1509 601141FAX +44 (0) 1509 601091

i
LoggerNet Table of Contents
1. Introduction..............................................................1-1
2. System Requirements .............................................2-12.1 Hardware and Software......................................................................... 2-12.2 Configuration of TCP/IP Services ........................................................ 2-1
3. Installation................................................................3-13.1 CD-ROM Installation............................................................................ 3-13.2 Allowing Remote Connections ............................................................. 3-13.3 Upgrade Notes ...................................................................................... 3-2
4. The LoggerNet Toolbar............................................4-14.1 The Toolbar .......................................................................................... 4-1
4.1.1 Test Menu ................................................................................... 4-24.1.2 Options Menu.............................................................................. 4-3
4.2 LoggerNet Applications........................................................................ 4-34.2.1 Setup (Section 5)......................................................................... 4-34.2.2 Connect Screen (Section 6) ......................................................... 4-44.2.3 Status Monitor (Section 7) .......................................................... 4-44.2.4 Edlog (Section 8) ........................................................................ 4-44.2.5 CRBasic Editor (Section 9)......................................................... 4-44.2.6 Split (Section 10) ........................................................................ 4-44.2.7 View (Section 11) ....................................................................... 4-54.2.8 Real Time Monitor and Control (Section 12............................... 4-54.2.9 Storage Module Software (Section 13) ....................................... 4-5
4.3 Getting Help for LoggerNet Applications............................................. 4-54.4 LoggerNet Operations and Backup Procedures .................................... 4-5
4.4.1 Backing up Data.......................................................................... 4-64.4.2 Loss of Computer Power............................................................. 4-74.4.3 Program Crashes ......................................................................... 4-74.4.4 Restoring from Backup ............................................................... 4-84.4.5 Directory and File Descriptions .................................................. 4-8
5. Setup Screen............................................................5-15.1 Setting Up a Datalogger Network ......................................................... 5-1
5.1.1 Adding Devices to the Network .................................................. 5-25.1.2 Applying Changes, Undo and Redo ............................................ 5-35.1.3 Renaming Network Devices........................................................ 5-4
5.2 Devices Configuration Settings............................................................. 5-45.2.1 Serial Port ................................................................................... 5-45.2.2 IPPort (Internet Protocol Serial Port ........................................... 5-55.2.3 TAPIPort (Telephony API) ......................................................... 5-65.2.4 PakBusPort.................................................................................. 5-75.2.5 Datalogger................................................................................... 5-75.2.6 RFBase...................................................................................... 5-13

LoggerNet Table of Contents
ii
5.2.7 RFRemote.................................................................................. 5-145.2.8 MD9 Base.................................................................................. 5-145.2.9 MD9 Remote ............................................................................. 5-155.2.10 PhoneBase ............................................................................... 5-155.2.11 PhoneRemote........................................................................... 5-16
5.3 Setting the Clock ................................................................................. 5-165.4 Setting Up Scheduled Data Collection ................................................ 5-17
5.4.1 Data Collection Scheduling Considerations .............................. 5-175.4.2 Setting Up Scheduled Data Collection ...................................... 5-19
5.5 Task Master......................................................................................... 5-205.5.1 Adding Tasks............................................................................. 5-215.5.2 Logger Event Tasks................................................................... 5-225.5.3 Scheduled Event Tasks.............................................................. 5-235.5.4 Define What the Task Does....................................................... 5-23
5.6 Convert from PC208W Network......................................................... 5-24
6. Connect ................................................................... 6-16.1 Connecting to the Datalogger................................................................ 6-16.2 Data Collection ..................................................................................... 6-2
6.2.1 Collect Now/ Stop Collection...................................................... 6-26.2.2 Custom Collection for Array-Based Dataloggers ........................ 6-26.2.3 Custom Collection for Table-Based Dataloggers ........................ 6-46.2.4 Ports and Flags ............................................................................ 6-86.2.5 View Status Table (Table Dataloggers Only).............................. 6-8
6.3 Datalogger Clock .................................................................................. 6-96.4 Program Management ......................................................................... 6-10
6.4.1 Programs Created Using Edlog ................................................. 6-106.4.2 Programs Created Using CRBasic Editor.................................. 6-10
6.5 Data Displays ...................................................................................... 6-116.5.1 Graphical Display Screens......................................................... 6-126.5.2 Numeric Display Screen............................................................ 6-18
6.6 File Control for CR5000 and CR9000 ................................................ 6-216.7 View Terminal Emulator..................................................................... 6-23
7. Status Monitor......................................................... 7-17.1 Main Screen .......................................................................................... 7-17.2 Status Monitor Functions ...................................................................... 7-2
7.2.1 Select Columns............................................................................ 7-27.2.2 Toggle Collection On/Off............................................................ 7-57.2.3 Reset Retries................................................................................ 7-67.2.4 Collect Data/Stop Collect ............................................................ 7-67.2.5 Server Logs ................................................................................. 7-67.2.6 View I/O...................................................................................... 7-67.2.7 Task Status .................................................................................. 7-67.2.8 Show Stations Only ..................................................................... 7-77.2.9 Pause Schedule ............................................................................ 7-77.2.10 Log Settings............................................................................... 7-7
7.3 Monitoring Operational Logs................................................................ 7-87.3.1 Transaction Log (TRAN$.LOG) ................................................. 7-97.3.2 Communication Log (COMMS$.LOG)....................................... 7-97.3.3 Object State Log (STATE$.LOG)............................................... 7-9
7.4 Monitoring Low Level I/O .................................................................. 7-10

LoggerNet Table of Contents
iii
8. Datalogger Program Creation with Edlog ..............8-18.1 Overview............................................................................................... 8-1
8.1.1 Creating a New Edlog Program................................................... 8-28.1.2 Editing an Existing Program ..................................................... 8-128.1.3 Library Files.............................................................................. 8-148.1.4 Documenting a DLD File .......................................................... 8-148.1.5 Display Options......................................................................... 8-14
8.2 Input Locations ................................................................................... 8-168.2.1 Entering Input Locations........................................................... 8-168.2.2 Repetitions ................................................................................ 8-178.2.3 Input Location Editor ................................................................ 8-188.2.4 Input Location Anomalies ......................................................... 8-19
8.3 Final Storage Labels ........................................................................... 8-20
9. Datalogger Program Creation withCRBasic Editor......................................................9-1
9.1 Overview............................................................................................... 9-19.1.1 Inserting Instructions................................................................... 9-29.1.2 Parameter Dialog Box................................................................. 9-39.1.3 Right Click Functionality ............................................................ 9-49.1.4 Toolbar........................................................................................ 9-59.1.5 Compile....................................................................................... 9-69.1.6 Templates.................................................................................... 9-79.1.7 CRBasic Editor Options.............................................................. 9-89.1.8 Available Help Information....................................................... 9-12
9.2 CRBasic Programming ....................................................................... 9-129.2.1 Programming Sequence............................................................. 9-129.2.2 Program Declarations................................................................ 9-149.2.3 Mathematical Expressions......................................................... 9-149.2.4 Measurement and Output Processing Instructions..................... 9-159.2.5 Inserting Comments Into Program ............................................ 9-15
9.3 Example Program................................................................................ 9-169.3.1 Data Tables ............................................................................... 9-169.3.2 The Scan – Measurement Timing and Processing..................... 9-18
9.4 Numerical Entries ............................................................................... 9-199.5 Logical Expression Evaluation ........................................................... 9-19
9.5.1 What is True?............................................................................ 9-199.5.2 Expression Evaluation............................................................... 9-209.5.3 Numeric Results of Expression Evaluation ............................... 9-20
9.6 Flags.................................................................................................... 9-219.7 Parameter Types ................................................................................. 9-21
9.7.1 Expressions in Parameters......................................................... 9-219.7.2 Arrays of Multipliers and Offsets for Sensor Calibration.......... 9-22
9.8 Program Access to Data Tables .......................................................... 9-22
10. Split.......................................................................10-110.1 Functional Overview......................................................................... 10-110.2 Getting Started .................................................................................. 10-210.3 Split Parameter File Entries .............................................................. 10-8
10.3.1 Input Files ............................................................................... 10-810.3.2 Start Condition ...................................................................... 10-12

LoggerNet Table of Contents
iv
10.3.3 Stop Condition....................................................................... 10-1710.3.4 Copy ...................................................................................... 10-2010.3.5 Time Synchronization............................................................ 10-2110.3.6 Select ..................................................................................... 10-2110.3.7 Output Files ........................................................................... 10-38
10.4 Help Option..................................................................................... 10-4210.5 Editing Commands.......................................................................... 10-4310.6 Running Split From a Command Line............................................. 10-43
10.6.1 Processing Alternate Files ..................................................... 10-4310.6.2 Processing Multiple Parameter Files with One
Command Line................................................................... 10-4310.6.3 Using Splitr.exe in Batch Files .............................................. 10-4410.6.4 Command Line Switches ....................................................... 10-44
11. View ......................................................................11-111.1 Overview........................................................................................... 11-111.2 Opening a File ................................................................................... 11-1
11.2.1 Opening a Data File................................................................. 11-111.2.2 Opening Other Types of Files ................................................. 11-211.2.3 Final Storage Label (FSL) Files .............................................. 11-2
11.3 Data Panel ......................................................................................... 11-311.3.1 Array Selection........................................................................ 11-311.3.2 Text View Options .................................................................. 11-411.3.3 Changing the Font ................................................................... 11-4
11.4 Graph Panel....................................................................................... 11-411.5 Printing Options ................................................................................ 11-7
11.5.1 Printing Text............................................................................ 11-711.5.2 Printing Graphs........................................................................ 11-7
11.6 Advanced Topics............................................................................... 11-711.6.1 Assigning Data Files to View.................................................. 11-711.6.2 Array Definitions (Array-based dataloggers only) .................. 11-8
12. Real-Time Monitor and Control...........................12-112.1 Overview........................................................................................... 12-112.2 Development Mode........................................................................... 12-1
12.2.1 The RTMC Workspace ........................................................... 12-212.2.2 Display Components................................................................ 12-212.2.3 RTMC Operations ................................................................... 12-512.2.4 Expressions.............................................................................. 12-812.2.5 Remote Connection ............................................................... 12-11
12.3 Run-Time ........................................................................................ 12-12
13. Storage Module Software (SMS) .........................13-113.1 Overview........................................................................................... 13-113.2 Getting Started .................................................................................. 13-2
13.2.1 The Setup Screen..................................................................... 13-313.2.2 Establishing Communications ................................................. 13-4
13.3 Status Information ............................................................................. 13-813.3.1 Status Box/Update Status ........................................................ 13-813.3.2 Advanced Status Information .................................................. 13-8
13.4 Programs ......................................................................................... 13-11

LoggerNet Table of Contents
v
13.4.1 Program Location.................................................................. 13-1213.4.2 Clear...................................................................................... 13-1213.4.3 Store ...................................................................................... 13-1313.4.4 Read ...................................................................................... 13-13
13.5 Data................................................................................................. 13-1313.5.1 File Format............................................................................ 13-1413.5.2 File Naming Options ............................................................. 13-1513.5.3 Show Card/Module Directory ............................................... 13-1613.5.4 Get All................................................................................... 13-1713.5.5 Get New ................................................................................ 13-1713.5.6 Get One ................................................................................. 13-17
13.6 Erase ............................................................................................... 13-1713.6.1 Erase Data ............................................................................. 13-1713.6.2 Erase Data and Programs ...................................................... 13-1813.6.3 Erase and Test Card/Module................................................. 13-18
13.7 The Menu Bar ................................................................................. 13-1813.7.1 File ........................................................................................ 13-1813.7.2 Options.................................................................................. 13-1913.7.3 Data....................................................................................... 13-1913.7.4 Tools ..................................................................................... 13-2013.7.5 Help....................................................................................... 13-20
13.8 Abort ............................................................................................... 13-20
14. Troubleshooting Guide........................................14-114.1 LoggerNet Server Problems.............................................................. 14-114.1.1 Starting LoggerNet and Connecting to the Server ......................... 14-114.1.2 Socket Errors ................................................................................. 14-214.1.3 Data Collection Issues.................................................................... 14-414.2 Application Screen Problems............................................................ 14-414.3 General Communication Link Problems ........................................... 14-514.4 Terminal Emulator to Test Communications .................................... 14-514.5 RF Communication Link Issues ........................................................ 14-914.5.1 Checking RF Components and Connections .................................. 14-914.5.2 RF Signal Strength Testing .......................................................... 14-1014.5.3 Troubleshooting with Attenuation Pads ....................................... 14-1214.6 Using Data Table Monitor .............................................................. 14-14
15. Implementing Advanced CommunicationsLinks ..................................................................15-1
15.1 Phone to RF ...................................................................................... 15-115.1.1 Setup ....................................................................................... 15-115.1.2 Operational Considerations ..................................................... 15-215.1.3 Attaching a Datalogger to the RF Base ................................... 15-2
15.2 Phone to MD9................................................................................... 15-315.2.1 Setup ....................................................................................... 15-315.2.2 Operational Considerations ..................................................... 15-4
15.3 TCP/IP to RF .................................................................................... 15-515.3.1 Setup ....................................................................................... 15-515.3.2 Operational Considerations ..................................................... 15-515.3.3 Special Considerations ............................................................ 15-6

LoggerNet Table of Contents
vi
Appendices
A. Glossary of Terms.................................................. A-1
B. Table-Based Dataloggers ...................................... B-1B.1 Memory Allocation for Final Storage.................................................. B-1
B.1.1 CR10X-TD Family Table-Based Dataloggers ........................... B-1B.1.2 CR5000/CR9000 Memory for Programs and Data Storage....... B-2
B.2 Converting an Array-Based Program to a CR10X-TD Table-BasedProgram using Edlog ....................................................................... B-3
B.2.1 Steps for Program Conversion ................................................... B-3B.2.2 Program Instruction Changes..................................................... B-4
B.3 Table Data Overview........................................................................... B-5B.4 Default Tables ..................................................................................... B-6
C. Software Organization ...........................................C-1C.1 LoggerNet/Client Architecture ............................................................ C-1C.2 LoggerNet Server Data Cache ............................................................. C-1
C.2.1 Organization .............................................................................. C-1C.2.2 Operation ................................................................................... C-2C.2.3 Retrieving Data from the Cache................................................. C-2C.2.4 Updating Table Definitions........................................................ C-2
C.3 Directory Organization ........................................................................ C-3C.3.1 C:\CampbellSci\LoggerNet Directory (Working Directory ....... C-3C.3.2 C:\Program Files\CampbellSci\LoggerNet Directory
(Program File Directory)....................................................... C-4C.3.3 Backing Up Critical Information ............................................... C-4
D. Log Files .................................................................D-1D.1 Event Logging ..................................................................................... D-1
D.1.1 Log Categories........................................................................... D-1D.1.2 Enabling Log Files..................................................................... D-1D.1.3 Log File Message Formats......................................................... D-2
E. Importing Files into Excel ...................................... E-1E.1 Array-Based Data File Import ..............................................................E-1E.2 Table-Based Data File Import...............................................................E-4
F. CoraScript ............................................................... F-1F.1 CoraScript Fundamentals ......................................................................F-1F.2 Useful CoraScript Operations ...............................................................F-2
F.2.1 Connecting to the LoggerNet Server ...........................................F-2F.2.2 Checking and Setting Device Settings.........................................F-2F.2.3 Creating and using a Network Backup Script..............................F-3F.2.4 Hole Management .......................................................................F-3F.2.5 Scripting CoraScript Commands.................................................F-3
LoggerNet Table of Contents
vii
Tables9.3-1 Formats for Output Data.................................................................. 9-189.4-1 Formats for Entering Numbers in CRBasic ..................................... 9-199.5-1 Synonyms for True and False .......................................................... 9-209-7-1 Rules for Names .............................................................................. 9-2110.3-1 Comma Separated, Field Formatted, Printable ASCII,
and Table Oriented ASCII Input File Format Types............... 10-910.3-2 Example of Event Drive Test Data Set ........................................ 10-1810.3-3 Trigger on Stop Condition (F Option) Output of Time Series..... 10-1910.3-4 Input File Entries to Process the First Data Point for each Test .. 10-2010.3-5 Effects of Out of Range Values for Given Output Options.......... 10-2210.3-6 Split Operators, Math Functions, and Time Series Functions...... 10-2310.3-7 Split SPECIAL FUNCTIONS ..................................................... 10-2410.3-8 Definition of Blank or Bad Data for each Data File Format........ 10-41B-1 Example of Status Table Entries (CR10T)...........................................B-7B-2 CR5000 Status Table Entries ...............................................................B-8
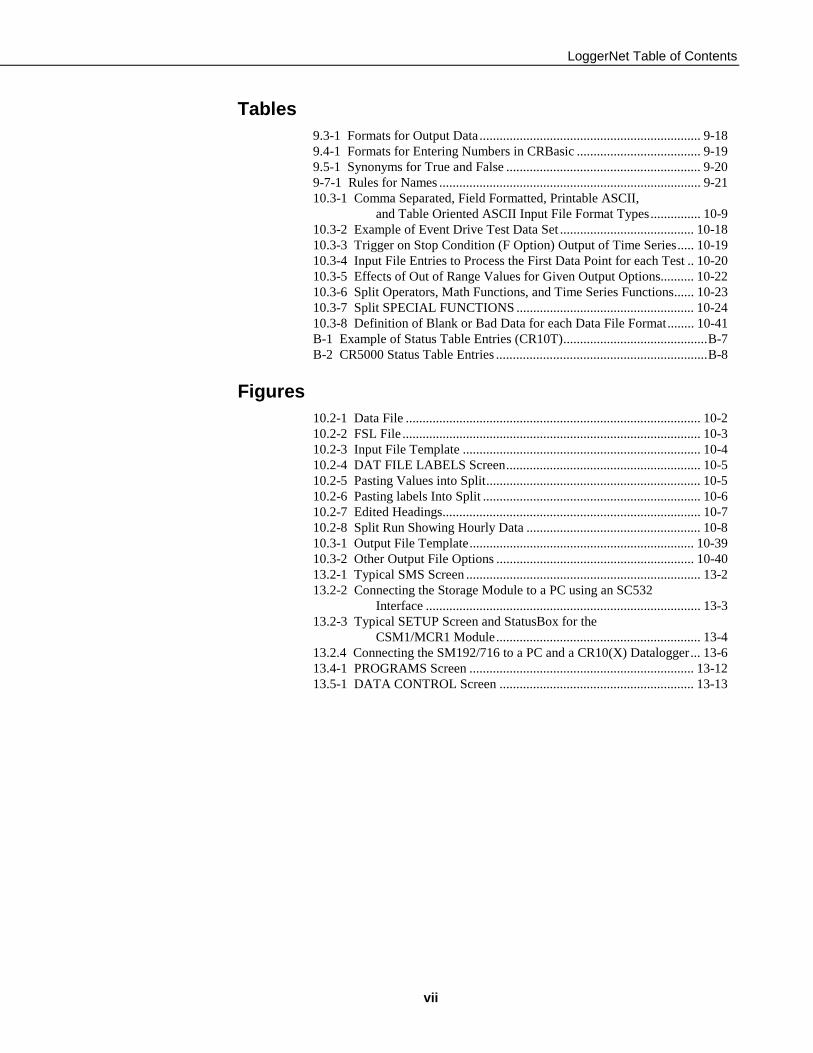
Figures10.2-1 Data File ........................................................................................ 10-210.2-2 FSL File ......................................................................................... 10-310.2-3 Input File Template ....................................................................... 10-410.2-4 DAT FILE LABELS Screen.......................................................... 10-510.2-5 Pasting Values into Split................................................................ 10-510.2-6 Pasting labels Into Split ................................................................. 10-610.2-7 Edited Headings............................................................................. 10-710.2-8 Split Run Showing Hourly Data .................................................... 10-810.3-1 Output File Template................................................................... 10-3910.3-2 Other Output File Options ........................................................... 10-4013.2-1 Typical SMS Screen ...................................................................... 13-213.2-2 Connecting the Storage Module to a PC using an SC532
Interface .................................................................................. 13-313.2-3 Typical SETUP Screen and StatusBox for the
CSM1/MCR1 Module............................................................. 13-413.2.4 Connecting the SM192/716 to a PC and a CR10(X) Datalogger... 13-613.4-1 PROGRAMS Screen ................................................................... 13-1213.5-1 DATA CONTROL Screen .......................................................... 13-13

LoggerNet Table of Contents
viii
This is a blank page.

1-1
Section 1. IntroductionLoggerNet is a software application that enables users to set up, configure, andretrieve data from a network of Campbell Scientific dataloggers and share thisdata over an Ethernet communications network. This software application isdesigned to run under Microsoft Windows 95, 98, Windows NT version 4.0,and Windows 2000.
LoggerNet version 2.0 is the first software product that supportscommunication and data collection for all of the Campbell Scientificdataloggers. Array-based dataloggers are supported including the CR500,CR510, CR10, CR10X, 21X, CR23X, and CR7 along with the table-baseddataloggers including the CR5000, CR9000, CR510-TD, CR10T, CR10X-TD,and the CR23X-TD.
The LoggerNet software is written using an advanced “client-server”architecture. The server is a software program that runs in the backgroundhandling all of the datalogger communications. The server also takes care ofstoring the data and providing information to manage the datalogger network.This is similar to the public library that connects to the information providers(authors and publishers) and brings the data (books) to a central repository(library) where the clients (patrons) can retrieve the data.
Launching the Toolbar automatically starts the server. The buttons on theToolbar launch applications that may connect to the server and allow you to setup the network or view the collected data. This software design allows foreasier future customizations and new features since the core communicationssoftware does not have to change. It also allows simultaneous access by manycomputers to the same data without burdening the datalogger network withredundant communications.
The LoggerNet applications include a set of tools for you to work with thedatalogger network and retrieve the data.
• Network configuration tools allow you define and configure thedataloggers in the network, how they are connected to the computer, andwhat data should be collected. You can also connect in real time to workwith individual dataloggers.
• Editors allow the creation and modification of datalogger programs.
• Other applications allow you to view and process the data collected fromthe dataloggers.
• A set of miscellaneous utilities let you work with other Campbell Scientifichardware such as storage modules.
One significant benefit of the software design is that some client applications(RTMC and Cora Script) will not have to run on the same computer as theserver. These applications can be run on any computer that is connected to themain computer by an Ethernet network connection. Some examples of thesenetworks are Local Area Network (LAN), Wide Area Network (WAN), or theInternet.

Section 1. Introduction
1-2
LoggerNet is an ideal solution for users desiring a reliable data collectionsystem that is also flexible enough to meet the needs of a variety of users.
A word about Windows conventions.
For the past 15 years Microsoft has been working to establish a standard for theoperation of graphical user interfaces. There are numerous conventions andexpectations about the way a software program looks and behaves runningunder Microsoft Windows. With LoggerNet, Campbell Scientific has adoptedas many of these conventions as reasonable.
This manual describes a collection of screens, dialogs and functions to workwith a network of dataloggers. As with most Windows based software there isalmost always more than one way to access the function you want. Weencourage you to look around and experiment with different options to findwhich methods work best for you.
To keep the manual as concise and readable as possible, we will not always listall of the methods for getting to every function. Typically each function willhave two methods and some will have as many as four.
The most common methods for doing things are:
Menus – At the top of most windows menu items are accessed either by a leftmouse click, or using a hot key combination (e.g. , Alt+F opens the File menu).When the menu is opened the desired item can be selected by clicking on it, orusing arrow keys to go down to it and pressing the Enter key, or typing theunderlined letter.
If there is an arrow next to the menu item, there is a submenu with morechoices. Clicking or selecting the item will bring up the submenu. Byconvention menu items that bring up dialog boxes or windows will be followedby an ellipsis (…). Other items execute functions directly or can be switchedon or off. Some menu items show a check mark if a function is enabled and nocheck mark if disabled.
Buttons – Buttons are an obvious way to access a function. They are normallyused for the functions that need to be called frequently or are very important.Clicking on the button executes the function or brings up another window.
Button functions can also be accessed from the keyboard using the tab key. Oneach screen one button or text area is selected or “has the focus”. The name ofthe selected item is surrounded by a dotted line. A selected text edit box can bechanged by typing. A selected check box can be toggled by pressing the spacebar. A selected button can be clicked by pressing the Enter key. The tab key isused to move the focus to each of the buttons and controls on the screen.
Right Click Menus – Many areas have pop-up menus that bring up frequentlyused tasks or provide shortcuts. Just right click over an area and then left clickon the menu item you want.
Hot Keys or Keyboard Shortcuts – Many of the menus and buttons can beaccessed using Hot Keys. An underlined letter identifies the hot key for abutton or function. To get to a menu or execute a function on a button hold

Section 1. Introduction
1-3
down the Alt key and type the underlined letter in the menu name or the buttontext.
Pop-Up Hints – Hints are available for many of the on-screen controls. Let themouse pointer hover over the control, text box or other screen feature; the hintwill appear automatically and remain visible for a few seconds. These hintswill often explain the purpose of a control or a suggested action. For text boxeswhere the text is hidden, the full text will appear in the hint.

Section 1. Introduction
1-4
This is a blank page.

2-1
Section 2. System Requirements
2.1 Hardware and SoftwareLoggerNet is a collection of 32-bit programs designed to run on Intel-basedcomputers running Microsoft Windows operating systems. The recommendedcomputer configuration for running LoggerNet is Windows NT or Windows2000 because they offer the most stable operating environment. LoggerNet willalso run on Windows 95 and Windows 98. All installations require at least aPentium II or equivalent processor, a minimum of 32 MB of RAM, a minimumof 45 MB free space on the hard disk, and TCP/IP support installed.
2.2 Configuration of TCP/IP ServicesTCP/IP services must be running on the computer for LoggerNet to run.Following are the procedures for enabling TCP/IP communication on aWindows 95, 98, or NT system. For Windows 2000 the same things need to beset up, but they are accessed in different ways. See the documentation and helpfor Windows 2000 to add a dial-up connection and associate it with TCP/IP.
Before beginning this procedure make sure that you have yourWindows installation CD-ROM (or floppy disks as appropriate)handy.
As you install these options you may be prompted to insert various disks or theCDROM to complete the installation.
1. Click on the Start button and select Settings | Control Panel.
2. When the Control Panel window comes up double click on theAdd/Remove Programs icon.
3. Select the Windows Setup tab.
4. Select Communications and click on the Details button.
5. On the Communications options screen click the box by “Dial-UpNetworking” (Win 98/95) or “Phone Dialer” (NT). If already checked,click cancel and skip to step 9.
6. Click OK on the Communications Options screen and on the WindowsSetup screen.
7. Provide the Windows installation software as prompted and then follow thedirections.
8. When you are prompted to reboot the computer choose Yes.
9. After the computer boots, go to the Windows Control Panel and doubleclick on the Network icon.
NOTE

Section 2. System Requirements
2-2
10. In the list box on the Configuration tab (Win95/98) or Protocols tab (NT)of the Network window which comes up, see if there is an entry TCP/IP ->Dial-Up Adapter or TCP/IP protocol. If this entry exists, cancel and skipthe next steps.
11. Click on the Add button. In the Select Network Component Type windowwhich comes up select Protocol or TCP/IP protocol and click on the Addor OK button.
12. When the Select Network Protocol window comes up select Microsoftunder Manufacturers:, and TCP/IP under Network Protocols:. Click OK.

3-1
Section 3. Installation
3.1 CD-ROM InstallationThe following instructions assume that drive D: is a CD-ROM drive on thecomputer from which the software is being installed. If the drive letter isdifferent, substitute the appropriate drive letter.
1. Put the installation CD in the CD-ROM drive. The install applicationshould come up automatically. Skip to step 3. If the install does not start,then from the Windows system menu, select Start | Run.
2. Type D:\Disk1\Setup.exe in the Open field or use the Browse button toaccess the CD-ROM drive and select the setup executable in the Disk1folder.
3. This activates the LoggerNet Installation Utility. Follow the prompts onthe screen to complete the installation.
Items are added to your computer’s Start menu under Programs | LoggerNetthat start the Toolbar and some other selected utilities. If the default directoriesare used, LoggerNet executable files and help files are placed in the C:\ProgramFiles\CampbellSci\LoggerNet directory. The directoryC:\CampbellSci\LoggerNet is a working directory and contains the user’sprograms and data files, along with files maintained by LoggerNet such as thebinary data cache and configuration files.
3.2 Allowing Remote ConnectionsDuring the installation, you have the option of allowing or denying remoteconnections to the LoggerNet server. While there are some instances whereallowing remote connections may be desirable, this option should be used withcaution.
LoggerNet is a 32-bit client/server application, and therefore, the server can runon one computer while a client application can be run on a separate computerattached to the same network. Currently, the only LoggerNet client applicationthat can take advantage of this feature is RTMC. If Allow Remote Connectionsis chosen during installation, you can run LoggerNet on one computer, and useRTMC to display data remotely on a different computer.
Though this may be a desirable feature, enabling Allow Remote Connectionsalso makes your LoggerNet network configuration vulnerable to changes byother parties on the network. LoggerNet comes with a command line utilitycalled CoraScript (Appendix F). This utility can be used to create a back-upscript of your network and troubleshoot problems. However, it is possible thatanother user could use CoraScript to make unwanted changes to the dataloggernetwork, including changing the data collection schedule or deleting devicesentirely. We, therefore, strongly recommend that this feature be disabled,unless it is essential that the data be made available to a remote computerrunning RTMC.

Section 3. Installation
3-2
This option can be enabled/disabled only during installation of the software. Ifa change in the setting is desired after installation is complete, LoggerNet mustbe reinstalled.
3.3 Upgrade NotesIf you are upgrading from an installation of PC208W version 3.0 or greater,you may want to convert your current network description from PC208Wformat to the LoggerNet format. The Convert utility has been provided to bringthe old PC208W network description into the new LoggerNet format. Youshould make sure that data collection is up to date in PC208W beforeconverting the network description. It is also a good idea to make a backup ofthe PC208W files. The explanation for the use of Convert is in Section 5.6 onnetwork setup.

4-1
Section 4. The LoggerNet ToolbarThis section provides an overview of the LoggerNet Toolbar and the associatedapplications. Each of the applications is explained in detail in subsequent sections.
4.1 The ToolbarThe LoggerNet Toolbar has several functions. The most important is startingthe server that handles all communications with the dataloggers in the network.As long as the Toolbar is running, either visible or minimized, the server isworking and able to communicate with the dataloggers. Shutting down theToolbar also shuts down the server and suspends all communications with thedataloggers in the network.
When LoggerNet first starts, automated data collection is delayedfor several seconds. This allows the user time to pause collectionon the Status Monitor if desired.
To start LoggerNet double click the icon that was placed on your desktop. Youcan also go to the start menu of the computer and under Programs | LoggerNetselect LoggerNet. This will bring up the Toolbar, as shown below, and start theserver.
Clicking on any of the Toolbar buttons will bring up the screen for thatfunction. An alternate way to bring up screens to use the File | Open menu atthe top of the Toolbar. The menu provides access to all of the availablescreens, including those that may not be displayed as buttons on the Toolbar.
The appearance of the Toolbar can be changed from a horizontal layout asshown, to a vertical layout. This is done by dragging the right side of theToolbar as far as it will go to the left, and then releasing the mouse button. Toreturn to the horizontal layout, drag the right side of the Toolbar to the right.Dragging the bottom of the toolbar up in horizontal view will change to atoolbar with just the buttons and icons with no text.
The user can choose which buttons to display or hide by going to the Options |Modify Buttons menu item. All of the functions available under the File | Openmenu can be shown or hidden on the Toolbar. Any functions not shown on theToolbar can still be accessed through the File menu.
To keep the Toolbar from being hidden behind other Windows applications,under the Options menu you can select Stay On Top. If this option has a check
NOTE

Section 4. The LoggerNet Toolbar
4-2
mark beside it, it is enabled, and the Toolbar will stay in the foreground eventhough other Windows applications are active.
To exit LoggerNet and shut down the server, either click on the X in the upperright hand corner of the Toolbar, or under the File menu select Exit.
4.1.1 Test Menu
4.1.1.1 Communication Test
The Toolbar can also be used to test communication with each datalogger in thecommunications network to confirm the integrity of the computer-dataloggernetwork communications link.
The Communication Test is used to check the communications path to one ormore dataloggers. Communication is verified by attempting to check thedatalogger clock.
Selecting Test | Communication Test from the main menu will bring up a screensimilar to following dialog box:
All devices in the network are displayed in the window. Each datalogger has agray circle beside it. Once the communications test is run, the color of thecircle will reflect the state of the communications link to the datalogger.
Select a datalogger to be tested by clicking on the circle next to the datalogger.When a datalogger is selected the circle beside it will turn black. Continueclicking on the dataloggers you want to test. Clicking a second time on adatalogger will deselect it. To deselect all the dataloggers click on the Clearbutton.

Section 4. The LoggerNet Toolbar
4-3
To begin testing, click the Test button. As a device is tested, the status icon toits left will change colors. Green signifies a good communications link, and redis critical. When a device is being tested the icon will be yellow. If the statusis unknown the datalogger icon will remain gray.
4.1.1.2 Terminal Emulation
Terminal Emulation is a way to test communications links. The device isselected by choosing from the devices in the Select Device list. This utilityallows you to type characters to send out over the communications link and willdisplay any response from devices on that link. This can also be used forterminal emulation with dataloggers. For more information on using thiscapability see the troubleshooting section (14).
4.1.2 Options MenuConfigure Buttons – This option allows you to choose which buttons will bedisplayed on the Toolbar. If there are applications or screens that you don’tuse, the Toolbar can be simplified by unchecking the buttons you don’t want tosee.
Stay on Top – Clicking on this menu option turns the Stay on Top attribute onor off. If this option is selected, the Toolbar will stay in front of any otherwindows displayed on the computer. This can be a benefit so the Toolbardoesn’t get hidden behind other applications.
4.2 LoggerNet Applications
4.2.1 Setup (Section 5)The Setup screen is used to add dataloggers to the network, define thecommunications paths between the computer and the dataloggers, choose whatdata should be collected, and set up an automatic collection schedule. Datacollection and schedule information are set up separately for each datalogger.

Section 4. The LoggerNet Toolbar
4-4
The collected data is stored on the computer's hard drive in data files. Setupcan also create and configure tasks that can be triggered by data collection oron a schedule. LoggerNet can also automatically check the datalogger's clock,comparing it with the computer's clock, and set it if it exceeds a specifiedvariation.
The Task Master included in the Setup Screen allows you to trigger datacollection, as well as execute batch file scripts and programs based on a varietyof data collection events. Tasks may also be scheduled based on time intervalsor the completion of another task.
4.2.2 Connect Screen (Section 6)The Connect Screen is used primarily for initializing or checking operation of adatalogger and manually collecting data. This screen provides near real-timecommunication with a datalogger. Utilities are available for sending programsto or retrieving programs from a datalogger, checking or setting a dataloggerclock, and getting status information from the datalogger. There are windowsfor displaying data either graphically or in numeric format, as well as settinginput locations, ports and flags. You can also manually retrieve data in variousformats, and communicate with a datalogger in terminal emulation mode.
4.2.3 Status Monitor (Section 7)The Status Monitor is used to monitor the health of datalogger networkcommunications. The integrity of the communications link can be verifiedquickly from the color depicted by a status icon for each device. Columns canbe set up to display information on communications quality and data collection.For troubleshooting purposes, windows are available to view operational logmessages for the server as well as the low-level communication between thedatalogger and the server. Task status can also be monitored.
4.2.4 Edlog (Section 8)Edlog is a tool to create and edit datalogger programs for all CampbellScientific dataloggers except the CR5000 and CR9000. Instructions areincluded for sensor measurement, intermediate processing, program andperipheral control, and data storage. The built-in precompiler provides errorchecking and warns of potential problems in the program.
4.2.5 CRBasic Editor (Section 9)The CRBasic Editor is a tool to create and edit programs for the CR5000 andCR9000 dataloggers. Instructions are included for sensor measurement,program and peripheral control, and data storage.
4.2.6 Split (Section 10)Split is used to separate mixed array data files into individual files based on thearray ID. Split can also be used to create files in custom formats for use inreports or as input to other data applications. Split has many uses and lendsitself to experimentation.

Section 4. The LoggerNet Toolbar
4-5
4.2.7 View (Section 11)View is used to look at data files. The data is displayed in either comma-separated or tabular format by record or array. A graph can be displayed toshow one or two columns of data.
4.2.8 Real-Time Monitor and Control (Section 12)Real-Time Monitor and Control (RTMC) creates and displays real-time graphicdisplay screens using the data collected from the dataloggers by LoggerNet.Once the display screen is configured it can be run on any computer that has anetwork connection to the LoggerNet computer. Users can customize graphicdisplays including graphs, tables, dials, alarms, digital values and other graphicelements. These displays automatically update when LoggerNet collects newdata.
4.2.9 Storage Module Software (Section 13)The Storage Module Software (SMS) handles configuration, data retrieval anddatalogger program management with PC cards or Campbell Scientific storagemodules. This program supports the SM192/716 and SM4M/16M storagemodules along with the CSM1 or MCR card reader, or (for Windows 95/98) aPCMCIA card slot installed on the computer.
4.3 Getting Help for LoggerNet ApplicationsDetailed information on each screen is included in the later sections.Additionally, each screen has an on-line help system. On-line help can beaccessed by pressing the F1 key or by selecting Help from the application'smenu.
A troubleshooting guide is provided in Section 14 of this manual. If you areunable to resolve your problem after reviewing the above noted resources,contact your Campbell Scientific Representative or Campbell Scientificdirectly.
4.4 LoggerNet Operations and Backup ProceduresThis section describes some of the concepts and procedures recommended forroutine operation and security of the LoggerNet software. If software andcomputer systems were perfect this section would not be necessary. However,since this software is required to run with predictable results in the real worldon real computers, the following guidelines and procedures will be helpful inminimizing possible problems that may occur.
4.4.1 Backing up DataAs with any computer system that contains important information, the datastored in the LoggerNet data files should be backed up to a secure archive ortransferred to another system on a regular basis. This is a prudent measure in

Section 4. The LoggerNet Toolbar
4-6
case the hard disk crashes or the computer suffers some other hardware failurethat prevents access to the stored data on the disk.
To back up the files, the client applications should be shut down and theLoggerNet Toolbar closed. This is necessary to prevent the server from tryingto access the files while they are being copied for the backup. Once the fileshave been backed up, the server and client applications may be restarted.
The most direct approach is to back up the entire working directory as shownbelow. The default directory name is:
c:\CampbellSci\LoggerNet
This will back up all of the working files for the server and the clientapplications along with any datalogger program files. For a detaileddescription of the directories and the files see Section 4.5.6.
Note that the above directories assume that the installation used the defaultdirectory structure suggested by the install utility. If a different workingdirectory was used, then the files will be contained in the same set ofsubdirectories, under the main working directory.
The maximum interval for backups depends primarily on the amount of datamaintained in the datalogger memory. The datalogger’s final storage is
Inifiles
Initialization files createdby various clients.
LoggerNet
The collected data files and datalogger programs.Most user files will be in this directory.
Logs
The logs of server operationsand communication.
RTMC
The graphic and soundresource files for RTMC.
SYS\bin
LoggerNet Server working directory – these files arecontrolled by the server and should not be disturbed bythe user except when backing up the system. Tamperingwith these directories or files can cause unpredictableconsequences and result in the loss of data.

Section 4. The LoggerNet Toolbar
4-7
configured as ring memory that will overwrite itself once the storage area ortable is full. If the data is backed up more often than the oldest records in thedatalogger are overwritten, a complete data record can still be maintained byrestoring the data from the backup and then re-collecting the newest recordsfrom the datalogger.
(There is a function available in Cora Script to save a script file containing allthe commands to rebuild the network map and restore the configuration settingsfor all of the devices. This can be used to restore the network after a computerfailure causes the network map or configuration files to be corrupted. It willnot, however, restore the data cache or the system state. For more informationon Cora Script see Appendix F.)
4.4.2 Loss of Computer PowerThe LoggerNet communications server writes to several files in the \SYSdirectory during normal operations. The most critical files are the data cachetable files and the device configuration files. The data cache files contain all ofthe data that has been collected from the dataloggers by the LoggerNet server.These files are kept open (or active) as long as data is being stored to the file.
The configuration files contain information about each device in the dataloggernetwork, including collection schedules, device settings, and other parameters.These files are written to frequently to make sure that they reflect the currentstate and configuration of each device. The configuration files are only openedas needed.
If computer system power is lost while the LoggerNet server is writing data tothe active files, the files can become corrupted, making the files inaccessible tothe server. This is particularly a problem for Windows 95 and 98 machinesusing the FAT32 disk file formatting. Windows NT and Windows 2000 offerthe choice of NTFS that provides a greater protection for this type of event.Thus, Windows NT and Windows 2000 offer more robust operation.
While loss of power won’t always cause a file problem, having files backed upas described above will allow you to recover if a problem occurs. If a file doesget corrupted, all of the server’s working files need to be restored from backupto maintain the synchronization in the server state.
4.4.3 Program CrashesIf the communication server crashes, there is a possibility that files can becorrupted. This is much less likely than problems due to power loss since thecomputer operating system remains in control and can close the files left openby the failed program. Again this is handled better with Windows NT andWindows 2000 than on Windows 95 and 98. If, after a program crash, theserver does not run properly, you may need to restore the data from backup.
If you have problems restarting the LoggerNet server after a program crash or itcrashes as soon as it starts, on Windows NT and 2000 systems make sure thatthe LoggerNet server has not left a process running. You can check this bygoing to the Windows Task Manager and selecting the Process tab. In the listof processes look for the Toolbar or one of the client applications. If one of

Section 4. The LoggerNet Toolbar
4-8
these processes exists but the Toolbar is not running, select this process andclick on “End Process”; you will be asked to confirm the end process.
4.4.4 Restoring from BackupTo restore server operation from a backup copy of the data and configurationfiles, you must close any client applications and the communication server.You can then copy and replace the files in the server working directory with thefiles from the backup. Any data collected or changes made to the network sincethe last backup will be lost.
Once all the files have been copied, you can restart the LoggerNet server andlet the server start data collection for all of the stations. If all of the stations areusing scheduled data collection, the server will automatically call at the nextscheduled collection interval, and collect as much of the missing data as thedataloggers have available. For any dataloggers not scheduled for datacollection you can use the Connect Screen application to get data collection upto date.
4.4.5 Directory and File DescriptionsThe following descriptions for the file names and directories assume the defaultworking directory was selected during the installation. If another workingdirectory was selected substitute the directory name and path forc:\CampbellSci\LoggerNet wherever it appears in the description below.
c:\CampbellSci\LoggerNet The main working directory. Thedatalogger programs created by the userand the collected data files are in thisdirectory.
\Logs The server operational and low level log files.
\RTMC\Images A collection of graphics objects to use in creating areal-time display.
\RTMC\sounds Wave files for use in audible alarms.
\SYS\IniFiles Initialization files for client applications.
\SYS\bin Application server working directory.
\Logger1 Directory with the last logger program file sent.
\Logger2 Directory with the last logger program file sent.
\Data Directory containing station data cache files.
\2 Directory containing data cache for station 2.
\3 Directory containing data cache for station 3.

5-1
Section 5. Setup ScreenThe Setup Screen provides a way to create and maintain a network of dataloggers. Thedatalogger network map shows all of the devices and communications links to reach thedatalogger stations. The settings for all of the devices are displayed and can be modifiedon the configuration tabs.
The Setup Screen also provides the configuration for tasks that can be associated withdata collection.
5.1 Setting Up a Datalogger NetworkThe Setup Screen is used to configure your datalogger network, define thecommunications link that exists between the computer and the datalogger, andset up the data collection schedule.
The following are viable datalogger communications methods for theLoggerNet software:
• Direct Connect – Simple serial communications typically on demand andclose to the computer, or where devices such as an SC32A, short haulmodems or RF400 spread spectrum radios are used in a configuration thatrequires no dialing or addressing to appear “transparent”.
• Phone Modem – Connection from a phone modem at the computer to adatalogger attached to a remote phone modem. Cell phone communicationis also supported.
• Radio Frequency (RF) – Connection over RF using antennas for line ofsight communications.
• Multi-drop Networked Direct Connect – Direct connection over dedicatedcables.
• TCP/IP Ethernet or Internet – Connection over a computer local areanetwork or over the Internet using TCP/IP modems at the datalogger.

Section 5. Setup
5-2
Clicking the Setup button on the LoggerNet toolbar will bring up the SetupScreen. The screen is divided into two parts: the device map (left side of thescreen) and the set up tabs (right side of the screen).
5.1.1 Adding Devices to the NetworkBegin adding devices to the device map in the order that they appear in yourcommunications link. Let's assume that your server computer is connected tothe datalogger via a telephone modem. You would first add a ComPort, thenthe telephone modem, the remote phone modem, and the datalogger.
To add a ComPort to the network map either right click in the blank area of thenetwork map, click on the Add Root button, or choose Edit | Add Root. Oncethe ComPort is in place you can click on the Add button or choose Edit | Addfrom the menu to bring up the Add Device window.

Section 5. Setup
5-3
When you select an item from the left side of the Add Device window, validconnections will be displayed in the right-hand column. Highlight the devicewhere you want to attach the new device and click the Add Now button.Continue to add devices in this manner until your network map is complete.
An alternative to the Add Device window is to press the right mouse buttonwhile your cursor is on a device within the main device map window. Ashortcut menu like the one shown will appear that will provide a list of validdevices for connection to the device you have right clicked. For instance, ifyou right click within the white space of the device map, the list will presentoptions for root devices such as ComPorts or IPPorts. When you right-click ona ComPort, only valid connections for ComPorts will be presented.
To delete a device from the network map select the device and either click onthe Delete button or select Delete from the Edit menu. This will delete thedevice and any devices that were connected below it. A keyboard shortcutCtrl+D will also delete the selected device.
Once all devices are added to the device map, complete the tabs associated witheach device. Refer to Section 5.2 for information on setting up devices.
5.1.2 Applying Changes, Undo and RedoThe device map is not saved or entered in LoggerNet until you click on theApply button at the bottom of the screen. You can build a complete networkand set up the configurations for all of the devices without applying. However,

Section 5. Setup
5-4
it is a good idea to build the network map in stages and periodically applychanges. If there is a problem with the computer, any changes that have beenapplied have been saved and will not have to be entered again.
Changing the network map or any of the device settings enables the Undobutton. Clicking on the Undo button will roll back each change in reverse orderto the original saved network and settings. If you undo a change and reallywanted to keep it, you can click the Redo button and restore the change.
Once the changes to the network map and device settings have been applied,they can no longer be rolled back using the Undo button.
Clicking on the Cancel button before changes are applied will undo all of thechanges to the network map and settings, and restore the saved configuration.
5.1.3 Renaming Network DevicesThe names of all of the devices can be changed as desired. Rename a device byselecting the device and either clicking again with the left mouse button on theselected device, clicking the Rename Device button, or going to the menu itemEdit | Rename. The name of the selected device will change to a text edit boxand the new device name can be entered. Valid names consist of letters,numbers and the underscore (_). The device name must be unique in thenetwork and the first character must be a letter.
Device names can reflect a location, layout, or physical location of networkdevices. Think carefully when naming the devices since these names are usedthroughout LoggerNet to refer to the devices.
5.2 Device Configuration SettingsWhen you highlight any device on the network shown on the left side of theSetup Screen, configuration tabs appear on the right side with the relevantsettings. These settings are different for different devices and are described indetail below.
As with changes to the network map, the changes made to the device settingsare not used until they have been applied.
5.2.1 Serial PortThe serial port has only a Hardware tab to configure.
Communications Enabled - Before communications can take place, alldevices in the communications chain must be enabled. The default setting forthis check box is Enabled.
Call-back Enabled - Enabling call-back tells LoggerNet to watch for a call-back from the datalogger on this port. If there is a phone modem attached itwill be set to accept incoming calls.

Section 5. Setup
5-5
ComPort Connection - This field designates the communications port throughwhich you will be connecting to the datalogger. Select the arrow to the right ofthe field with a mouse to display a list containing Com 1 through Com 12. (Ifyou need a ComPort above 12 or the ports on your computer are set up withother names, you will need to use Cora Script to edit this setting. See AppendixF.)
Extra Response Time - LoggerNet is preconfigured to allow time forresponses based on type of device and baud rates. In this field, specify only theadditional time that LoggerNet should delay before breaking thecommunications link if there is no response from the serial port. Additionaltime may be needed in instances where the communications link is noisy ornetwork traffic is heavy. If extra response time is needed, it is typically set to 1or 2 seconds.
LoggerNet waits a certain amount of time for a response fromeach device in a communications path. The extra response timesdefined for the communications link are cumulative. Therefore,the amount of time spent waiting for a device to respond is thesum of all Extra Response Times defined, plus the defaultresponse time for each device in the link. Add only the minimumtime necessary since very long response times can delay otherscheduled events while waiting for a device that is notresponding.
5.2.2 IPPort (Internet Protocol Serial Port)Like the standard serial port, configuration for the IPPort has only theHardware tab. Following is an explanation of each of the fields on this form.
Communications Enabled - Before communication can take place, all devicesin the chain must be enabled. When this box is selected, the Internet protocolserial port is enabled for communication.
Call-back Enabled - Enabling call-back tells LoggerNet to watch for a call-back from the datalogger on this port. If there is a phone modem attached itwill be set to monitor for incoming calls.
Internet IP Address - In this field, enter the TCP/IP address and port throughwhich LoggerNet will communicate with the datalogger network. The addressis entered in the form ###.###.###.###. (Alternately, a valid machine namecan be entered.) The port is in the form of :####. A typical entry might be123.456.789.1:1024.
When entering the IP address, do not use leading zeros for theaddress numbers. For example use 123.456.2.34 instead of123.456.002.034. The software doesn’t handle leading zeros.
Extra Response Time - In this field, specify the additional time that LoggerNetshould delay before breaking the communications link if there is no responsefrom the IPPort. Additional time may be needed in instances where thecommunications link is noisy or network traffic is heavy.
NOTE
NOTE

Section 5. Setup
5-6
LoggerNet waits a certain amount of time for a response fromeach device in a communications path. The extra response timesdefined for the communications link are cumulative. Therefore,the amount of time spent waiting for a device to respond is thesum of all Extra Response Times defined, plus the defaultresponse time for each device in the link. Add the minimum timenecessary since very long response times can delay otherscheduled events while waiting for a device that is notresponding.
5.2.3 TAPIPort (Telephony API)The TAPI port uses the phone modems that have been installed and configuredin Windows. This eliminates the need for LoggerNet to specify the modemtype or work with initialization strings. Like the standard serial port,configuration for the TAPI port has only the Hardware tab. Following is anexplanation of each of the fields on this form.
Communications Enabled - Before communication can take place, all devicesin the chain must be enabled. When this box is selected, the Internet protocolserial port is enabled for communication.
Call-back Enabled - Enabling call-back tells LoggerNet to watch for a call-back from the datalogger on this port. If there is a phone modem attached itwill be set to monitor for incoming calls.
TAPI Line – Select the modem you want to use for communication. Themodems listed are defined by Windows as part of Modem Setup. All of theparameters for the modem, including the baud rate have to be set using theWindows Modem Setup dialog. If you are using the same modem for dialupaccess you will have to change the settings for the different applications.
To communicate with dataloggers using the TAPI modem youhave to set the baud rate to match the communication capabilityof the devices in the link. If you are using COM200 modems, thebaud rate must be set to 9600 on the TAPI modem. For use overcell phone modems 1200 or 4800 baud may be required.
Extra Response Time - In this field, specify the additional time that LoggerNetshould delay before breaking the communications link if there is no responsefrom the IPPort. Additional time may be needed in instances where thecommunications link is noisy or network traffic is heavy.
LoggerNet waits a certain amount of time for a response fromeach device in a communications path. The extra response timesdefined for the communications link are cumulative. Therefore,the amount of time spent waiting for a device to respond is thesum of all Extra Response Times defined, plus the defaultresponse time for each device in the link. Add the minimum timenecessary since very long response times can delay otherscheduled events while waiting for a device that is not
NOTE
NOTE
NOTE

Section 5. Setup
5-7
responding.
5.2.4 PakBusPortThe PakBusPort is a device that supports a new communication protocol underdevelopment at Campbell Scientific. This protocol has not been completed andshould be considered experimental. Talk to an application engineer atCampbell Scientific for more information.
5.2.5 DataloggerDataloggers have several different tabs. Similar to the serial port, a hardwaretab is completed to specify communications settings. There are also tabs todefine the data to be collected, how often data should be collected, and whetherto automatically update the datalogger’s clock.
5.2.5.1 Hardware Tab
Communications Enabled - Before communication can take place, all devicesin the chain must be enabled. When this box is selected, the datalogger isenabled for communication.
Maximum Time On-line - A time limit can be set for the length of timeLoggerNet will stay connected to the datalogger on any scheduled call. Oncethis time limit has been exceeded, communications with the device will beterminated. Setting the time to zero will disable this time limit. This settingshould be set to zero for most communications links other than phone modems.
Maximum Time On-line only applies to scheduledcommunications. Using the Connect screen to connect to thedatalogger will stay connected until terminated by the user.
Maximum Packet Size - Data is transferred in "chunks" called packets. Formost devices the default value is 2048 byes. The value entered in this field canbe changed in 32 byte increments. If a communications link is marginal,reducing the packet size may improve reliability.
Extra Response Time - In this field, specify the additional time that LoggerNetshould delay before breaking the communications link if there is no responsefrom the datalogger. Additional time may be needed in instances where thecommunications link is noisy or network traffic is heavy.
LoggerNet waits a certain amount of time for a response fromeach device in a communications path. The extra response timesdefined for the communications link are cumulative. Therefore,the amount of time spent waiting for a device to respond is thesum of all Extra Response Times defined, plus the defaultresponse time for each device in the link. Add the minimum timenecessary since very long response times can delay otherscheduled events while waiting for a device that is not
NOTE
NOTE

Section 5. Setup
5-8
responding.
Maximum Baud Rate - Select the arrow to the right of this field to choose amaximum baud rate for communication with this datalogger. Note that theactual rate of communication may be limited by the capability of other devicesin the communications chain.
Security Code - A datalogger can have a security code to restrict access to thedatalogger. This helps prevent inadvertent changes to the datalogger’s programor memory. A valid security code is any four digit, non-zero number. Thesecurity code is set by the datalogger program, through a keyboard display, orthe terminal emulation utility. If a datalogger program that sets or changessecurity is loaded into the datalogger, the Security Code in LoggerNet must bechanged to match so that the server can access the datalogger. (Security is notavailable in the CR5000/CR9000 dataloggers.)
Refer to your datalogger operator’s manual for completeinformation on its security functions.
Call-back ID - The call-back ID is sent by the datalogger to identify itselfwhen contacting the host computer. LoggerNet uses this value to know whichdatalogger initiated the call-back. Call-back is a mode supported by somedataloggers where an instruction in the datalogger program can initiate a call tothe computer. When LoggerNet receives the call it turns around and contactsthe datalogger.
5.2.5.2 Final Storage Area 1 and 2 (Array-based dataloggers only)
Array-based dataloggers include the CR7, 21X, CR500, CR510, CR10,CR10X, 21X, CR23X, and CR7. When the datalogger program stores data inan array-based datalogger, the data arrays are stored in a final storage area.Some dataloggers, such as the CR10X, have two final storage areas whileothers, such as the 21X, have only one. This tab is used to define the outputfile name and location, the data file format and other output options for the datastored in the final storage area.
Enabled for Collection - The specified final storage area will be included inthe collected data if this box is checked.
Output File Name - This is the name and directory path for the output filewhere the final storage data will be saved after being collected from thedatalogger.
Use Default File Name - checking this box will set the collected data file nameto the default value, which consists of the name of the station and number of thefinal storage area.
File Output Option - This option allows you to choose whether new datacollected from the station is appended to the data file, overwrites the old data inthe data file, or is not stored to a data file. The default option is to append tothe data file so the old data is not lost. If the data file is used only for a real-time display or such that only the last data collected is needed, overwrite willreplace the old data with the new collected data. If the data is only going to be
NOTE

Section 5. Setup
5-9
used within LoggerNet for display on the Connect Screen graph or numericdisplay, or for RTMC, you can choose no output file and a limited amount ofdata will be kept in LoggerNet’s internal data cache.
Output Format - Select the format for the output file.
− ASCII, Comma separated writes data to the file in ASCII text format onerecord per line with commas between the data values. This file can beopened in LoggerNet View, a text editor, imported to Split, or brought intoa spreadsheet application.
− ASCII, Printable writes data to the file in ASCII text format separatedinto columns separated by tabs. The column number precedes each datavalue in the record. Only 80 characters will be placed on each line,columns that don’t fit the 80 characters are placed on the next line. Thisfile format can be opened in LoggerNet View, a text editor, or imported toSplit. See the example data file below.
01+0109. 02+2002. 03+0038. 04+1639. 05+15.00 06+13.20 07+24.79 08+073.909+269.0 10-1.00001+0109. 02+2002. 03+0038. 04+1639. 05+25.00 06+13.20 07+24.79 08+073.909+279.0 10-.98801+0109. 02+2002. 03+0038. 04+1639. 05+35.00 06+13.20 07+24.79 08+074.009+289.0 10-.94601+0109. 02+2002. 03+0038. 04+1639. 05+45.00 06+13.20 07+24.79 08+074.009+299.0 10-.87501+0109. 02+2002. 03+0038. 04+1639. 05+55.00 06+13.20 07+24.79 08+074.009+309.0 10-.77701+0112. 02+2002. 03+0038. 04+1640. 05+0.000 06+13.20 07+24.79 08+074.009+074.1 10+1638. 11+18.00 12+13.1901+0109. 02+2002. 03+0038. 04+1640. 05+5.000 06+13.20 07+24.78 08+074.009+319.0 10-.656
− Binary writes the data to a file in a binary format. The advantage of thebinary format is that it is more compact so the size of the file is muchsmaller than for the ASCII based files. The disadvantage is that it’sunreadable except using View or by processing with Split.
Collect Mode - The collect mode allows you to choose how much data tocollect when getting data from the datalogger.
• Data Logged Since Last Call - When LoggerNet calls the datalogger tocollect data, it will try to get all of the data stored by the datalogger sincethe previous call. If this is the first call to a datalogger there might be a lotof historical data stored. When Collect All on First Call is checked,LoggerNet will keep the datalogger on line until it has caught up with thecollected data. If Collect All on First Call is not checked, the first call tothe datalogger will get the number of arrays specified. This allows you toavoid keeping communications tied up while all the historical data iscollected.
• Most Recently Logged Arrays - This option is used when you are mostinterested in only the most recently stored data. When this option is

Section 5. Setup
5-10
selected you can specify how many arrays back from the most recent arrayshould be included when data is collected from the datalogger.
5.2.5.3 Data Files Tab (Table-based dataloggers only)
Table-based dataloggers include the CR10T, CR510TD, CR10X-TD,CR23X-TD, CR5000, and CR9000. Data output to final storage is stored asrecords in tables. The data collection tab is used to define what data tables willbe collected from the datalogger, along with the output file name and format.
Tables to be Collected - All of the available tables in the datalogger are listedin the column on the left. If no tables are listed you need to click on the Gettable Definitions Button. The tables selected for collection are shown with agreen check mark and the excluded tables are shown with a red ‘X’. Data fromthe selected tables will be collected from the datalogger during scheduled datacollection. By default all of the final storage tables along with the Errorlog andTimeset tables are selected for collection. For a description of the built-intables see Appendix B.3.
The individual tables can be highlighted by clicking on the table name. Thesettings on the right side of the window apply to the highlighted table. Thename of the highlighted table appears at the top of the settings. Double clickingon a table name will toggle collection of that table on or off.
Output File Name - This setting defines the file name and path for the outputdata file that contains the data collected from the datalogger. Clicking on thebrowse button ( … ) at the right of the box will allow you to choose anotherdirectory or file name for the collected data. The data from each table is storedin a separate output file.
Use Default File Name - Checking this box will set the collected data filename to the default value, which consists of the name of the station and thename of the table.
Included for Scheduled Collection - If this box is checked the specified tableis included in data collection. This can be changed either by clicking the checkbox or double clicking the name of the table in the list.
File Output Option - This option allows you to choose whether new datacollected from the station is appended to the data file, overwrites the old data inthe data file, or is not stored to a data file. The default option is to append tothe data file so the old data is not lost.
If the data file is used only for a real-time display or such that only the last datacollected is needed, overwrite will replace the old data with the new collecteddata.
If the data is only going to be used within LoggerNet for display on the ConnectScreen graph or numeric display, or for RTMC, you can choose no output fileand the data will only be kept in LoggerNet’s internal data cache (see AppendixC.2 for more about the data cache).
Output Format - Select the format for the output file.

Section 5. Setup
5-11
ASCII, table (no header) - The data is output with timestamp anddata values separated by commas with no header.
ASCII, TOACI1 - The data is output in Table Oriented ASCIIformat type 1 which has a two line header and data formatted thesame as the ASCII table format.
ASCII, TOA5 - The data is output in Table Oriented ASCIIformat type 5 which has a multi-line header and data valuesseparated by commas.
Binary, TOB1 - The data is stored in Table Oriented Binaryformat type 1.
Get Table Definitions - This button will cause LoggerNet to get the tabledefinitions from the datalogger. This should only be needed the first timeconnecting to a station or when the datalogger program has changed. Newtable definitions will cause the previous output data file to be saved with adifferent name and a new data file will be created to save the data. For adescription of data tables see Appendix B.3.
5.2.5.4 Schedule Tab
The Schedule tab defines when LoggerNet will automatically check thedatalogger for new data.
Scheduled Collection Enabled - This check box activates the data collectionschedule defined on this tab. No data will be automatically collected if theschedule is disabled.
Apply to Other Stations - This button allows the schedule setup for thisdatalogger to be copied to other stations in the network. Clicking the buttonbrings up a window that lists all of the dataloggers in the network. You canselect one or more dataloggers and then press OK to use the entered schedule.To select more than one datalogger, hold down the Ctrl key while clicking onthe dataloggers to select.
Base Date - The base date field is used to define the first date for scheduleddata retrieval. If the date entered in this field has already passed, a datacollection attempt will be made when the schedule is enabled and applied.
Base Time - This field is used to define the first time for scheduled dataretrieval. As with the Base Date field, if the time has already passed, a datacollection attempt will be made when communication when the schedule isenabled and applied. This setting is also used with the Collection Interval todetermine the time data collection will be done.
Unlike PC208W, entering a zero for any of the intervals below will causeLoggerNet to try and collect as fast as possible.
Collection Interval - This is the interval at which the datalogger will bechecked for new data. If this interval is set at 1 hour, new data will be collectedfrom the datalogger every hour.
NOTE

Section 5. Setup
5-12
Example: If the Base Date and Time are 1/1/99, 12:15 p.m., with aninterval of one hour, data collection attempts will be made at 15 minutespast the hour, each hour.
Primary Retry Interval - If a data collection attempt is made but fails, you canspecify an interval on which another attempt will be made. This primary retryinterval starts at the time of failure, not on the original calling time and interval.“Failures” may be caused by busy phone lines, noisy RF environments, lowbatteries, damaged hardware, etc.
Number of Primary Retries - The number entered into this field is the numberof times the server will attempt to contact the datalogger on the Primary RetryInterval. If all the collection attempts fail, then the server will commencecalling on the Secondary Retry Interval if it is enabled.
Secondary Retry Interval - If the secondary retry interval box is checked, thespecified interval is a calling interval that will be followed if all Primary Retriesfail. Data collection attempts will continue on the Secondary Interval until adata collection attempt is successful, at which time, all retry statistics are reset.The Secondary Retry Interval is based on the initial date and time settings, notthe time of the last failure. If the box is not checked the collection schedulewill return to the normal collection schedule and continue through just normaland primary collection schedules until communications are restored.
Typical use is to set the Primary Retries fairly close together, and theSecondary Retry at a longer interval. For instance, if you are calling on anhourly basis, the Primary Retries might be set to three tries, spaced five minutesapart. The Secondary Interval then might be set at 2 hours.
Collect Ports and Flags - If this box is checked, the current state of the portsand flags is collected and stored in LoggerNet’s internal data cache. Thisallows functions such as the numeric display and view ports and flags to getupdated data with scheduled data collection.
5.2.5.5 Clock Check/Set Tab
Automated Clock Check Enabled - Enable this to compare the datalogger’sclock to the server PC’s clock based on the schedule defined by the otherparameters on this tab. If the datalogger's time differs from the server's time bymore than a specified amount, the datalogger's clock will be set to the server’stime.
A separate call to the datalogger will not be made exclusively to process aclock check. A clock check will be made when the server contacts thedatalogger for some other function.
Setting up a clock check may not be desirable. It is possible to end up withmissing data or duplicate data if the datalogger's clock is set forward orbackward enough to skip or duplicate a data storage event. Specialconsideration should be given if the PC clock automatically adjusts forDaylight Savings Time.
Refer to Section 5.3 for additional information on setting and checking theclock.

Section 5. Setup
5-13
Time Zone Offset - A value can be entered into this field to set an offset forthe datalogger's clock from the server's clock. Positive values set the loggerclock as if it were in a more eastern time zone. This may be useful if the serverand the datalogger are in different time zones.
Initial Date - The initial date field is used to define the date on which the firstclock check will occur. If the date entered in this field has already passed, thedatalogger's clock will be checked at the next scheduled data collection.
Initial Time - This field is used to define the time at which the first clock checkwill occur. As with the Initial Date field, if the time has already passed, theclock will be checked at the next scheduled data collection.
Interval - The interval at which a clock check should be performed is specifiedin the Interval field. If this interval is set at 24 hours, the datalogger's clockwill be checked daily, based on the initial date and time.
Allowed Clock Deviation - The Allowed Clock Deviation field is used tospecify the number of seconds the datalogger's clock can differ from theserver's before the server resets the datalogger's clock.
The Allowed Clock Deviation setting will prevent a manual clockset from being carried out if the difference between thedatalogger's and server's clocks is less than the specifieddeviation.
5.2.6 RFBaseThe RF base modem acts as a gateway device that provides RF communicationwith the remote RF modems connected to dataloggers at the field site.
Hardware Tab
Communications Enabled - Before communications can take place, alldevices in the chain must have the Communications Enabled box checked.When this box is selected, communication to the RF base is enabled.
5.2.7 RFRemoteThe RF modem has only a Hardware tab. Many of its settings are similar to theHardware tabs for the other devices.
Communications Enabled - Before communications can take place, alldevices in the chain must have the Communications Enabled box checked.When this box is selected, communication to the RF modem is enabled.
Address - The hardware for each RF modem is configured for a certain addresswith internal switches. This address acts as an identification for the device inan RF network. Each RF modem in the network must have a unique address;this number is entered in the Address field. Each RF modem used as a repeateronly site still needs its own unique Address.
NOTE

Section 5. Setup
5-14
RF Options
Use F Command - The “F” command forces the baud rate to 9600. In themodem enabled (ME) state, the serial I/O port of the EOL (end-of-link) modemwill communicate with the datalogger at 9600 baud with the “F” command. Inthe synchronous device communication (SDC) state, the baud rate from thecomputer to the SOL (start-of-link) modem will be 9600.
Use U Command - The “U” command will force RF communication betweenradios to 2400 baud rather than 3000 baud. DC95s purchased before February1989 can only be used at 2400 baud. For further information see Appendix Fin the Radiotelemetry Network Instruction Manual.
Use W Command - The “W” command will force the RF modem to wait untilthere is no carrier detect before transmitting. This option is used when thecomputer is connected to more than one RF base.
5.2.8 MD9 BaseThe MD9 base modem has only a Hardware tab.
LoggerNet assumes an MD9 base modem address of 255.Therefore, the MD9 base modem must have the hardware switchID set to 255 for communication to work.
Communications Enabled - Before communications can take place, alldevices in the chain must have the Communications Enabled box checked.When this box is selected, communication to the MD9 base is enabled.
5.2.9 MD9 RemoteThe MD9 remote is the MD9 modem device that is connected to the dataloggerat the field site. It has a Hardware tab only.
Communications Enabled - Before communications can take place, alldevices in the chain must have the Communications Enabled box checked.When this box is selected, communications to the MD9 modem are enabled.
Address - The hardware for each MD9 modem is configured for a certainaddress using internal hardware switches. This address acts as an identificationfor the device in an MD9 network. Each MD9 modem in the network musthave a unique address; this number is entered in the Address field.
5.2.10 PhoneBaseThe PhoneBase is a telephone modem connected to one of the server'sComPorts to provide access to other devices in the datalogger network. Thetelephone modem has only the Hardware tab. This device must be properlyinstalled and configured in the operating system to use one of the computer’sComPorts before it can be used by LoggerNet.
NOTE

Section 5. Setup
5-15
Communications Enabled - Before communications can take place, alldevices in the chain must have the Communications Enabled box checked.When this box is selected, communications to the phone modem are enabled.
Modem Type - Use the drop down list box to select the type of modem that isattached to the server computer's communications port. In most instances, the<default modem> should work.
Edit Modem Database - The modem connected to the server computer maynot be listed in the database, or the user may desire to change the modemconfigurations. When the Edit Modem Database button is selected, the resetand initialization strings for the selected modem are displayed. You can changethese settings or add a custom modem to the list. If you change the settings forone of the standard modems you will have to save it to a new name to use it.The only modems that can be deleted from the list are modems that have beenadded by the user.
Extra Response Time - In this field, specify the additional time that theLoggerNet server should delay before breaking the communications link ifthere is no response from the phone modem. Additional time may be needed ininstances where the communications link is noisy or network traffic is heavy.
LoggerNet waits a certain amount of time for a response fromeach device in a communications path. The extra response timesdefined for the communications link are cumulative. Therefore,the amount of time spent waiting for a device to respond is thesum of all Extra Response Times defined, plus the defaultresponse time for each device in the link. Add the minimum timenecessary since very long response times can delay otherscheduled events while waiting for a device that is notresponding.
5.2.11 PhoneRemoteThe Hardware tab of the remote phone modem is used to set up the dialingstring for the remote device attached to it. The hardware tab has the followingcontrols:
Communications Enabled - Before communication can take place, all devicesin the chain must have the Communications Enabled box checked. When thisbox is selected, communication to the remote phone modem is enabled.
Phone Number/Delay Field - This field is used to enter the telephone numbersor dialing strings for the remote modem. To add a number to the list simplyclick on the <add phone number> field and type in the number. Spaces, dashesand parentheses are usually ignored by the modem. To remove or change anumber, highlight the number and delete or click on the number and usebackspace.
Multiple entries are allowed to accommodate entry of access codes, credit cardnumbers, or other numbers that may be needed for communication to theremote modem and its attached device. As an entry is created a new line isadded for additional entries as needed. The first number will be dialedfollowing the specified delay. The next number will then be dialed after thedelay specified. The amount of time to delay is in milliseconds so a 5-seconddelay would be entered as 5000 milliseconds.
NOTE

Section 5. Setup
5-16
5.3 Setting the ClockA datalogger's Clock tab can be used to define a schedule at which an automaticclock check will be performed (refer to Section 5.2.3.5). Based on theinformation entered for this tab, the datalogger's clock will be set if it variesfrom the LoggerNet server's clock more than the amount of time specified inthe Allowed Clock Deviation field.
Because it is important to maintain accurate time stamping of your data, thereare a few things to take into consideration when setting up a clock checkschedule.
For the CR10X-TD family of dataloggers, when an instructionP84 Output Record is executed in the datalogger program tocreate an interval based table and a record is stored, the timestamp is not stored along with the record. Instead, when data isretrieved from the datalogger, the datalogger uses the time stampof the last record stored and the table interval to calculate thetime stamp for any previous records. This calculated time stampis then stored by the server as part of the data record along withthe other data values when data is collected. Because of this timestamping method, if the datalogger clock is changed such that itpasses an output interval a discontinuity could occur in therecords that could cause the time stamps to be incorrect. Event-based data storage does not rely on a calculated time stamp. Datastored to a table based on an event includes a time stamp in thetable.
Your datalogger clock should deviate no more than ±1 minute per month.Typically, this drift is less than what will be experienced with a personalcomputer. Therefore, unless you have a scheduled task on your computerwhich synchronizes your computer's clock with an atomic clock or otheraccurate time keeping device, the datalogger's clock may be more accurate thanthe server's clock.
Changing the computer system clock while the display screensare running will terminate the connection for most of the screens.This can also affect LoggerNet operations or even crash theprogram.
Another point to consider is how the clock checks may affect the time stamp foryour data. Let's say, for instance, that you have a data collection schedule ofone minute with a clock set if the two clocks deviate more than two minutes.Over time, the clocks may drift sufficiently that the datalogger's clock is set. Ifthe datalogger's clock is 12:02:00, and the LoggerNet computer clock is12:04:15 the datalogger's clock will be set to 12:04:15. Therefore, there will beno data for the time stamps 12:03 and 12:04. Conversely, if the datalogger'sclock is a few minutes faster than the LoggerNet computer’s clock, the resultwould be duplicate time stamps that contained different data.
NOTE
NOTE
NOTE

Section 5. Setup
5-17
In table-based dataloggers the record number can be used along with the time stamp to assurethat records are in order, and no data has been missed.
5.4 Setting Up Scheduled Data Collection
5.4.1 Data Collection Scheduling ConsiderationsFor any data to be available for viewing in any of the clients, the data has to becollected from the dataloggers. As the data is collected from the dataloggers itis placed in data files according to the settings specified for that station. Thedata is also kept in data storage areas by LoggerNet for use by the displayscreens such as the Numeric Display and Graph screens.
Input locations and Public variables don’t have to be scheduledfor collection to be displayed on the Numeric Display or theGraph.
For data to be collected it has to be selected for collection on the Data File orFinal Storage tab in the Setup screen for each datalogger (Section 5.2.3). If thetables or final storage are not selected for collection, no data will be stored ordisplayed on the display screens.
5.4.1.1 Intervals
One of the most significant considerations for setting up data collection is all ofthe intervals associated with reading, storing, collecting and retrieving data.The intervals and their significance for data handling are described below.
5.4.1.1.1 Datalogger Program Intervals
There are two types of intervals written into the datalogger program whichaffect the availability and collection of data:
• Program Execution Interval – The execution, or scan, intervaldetermines how often the datalogger carries out the instructions in thedatalogger program. It is specified in seconds and determines thefundamental rate at which data is available. In typical programs the sensorreadings are taken at this rate and the values are stored in correspondingInput Locations or variables. This execution interval is the fastest that datameasurements can be updated and data stored. (Depending on how theprogram is written, sensor readings may occur at specified intervals andnot on every program execution.)
• Table Storage Interval or Output Data Interval – Most data tables orfinal storage arrays are set up to store data records at regular intervals. Thedata record consists of a record number and time stamp, followed by theoutput processing (i.e., sample, average, min, max, etc.) of the inputlocation or variable values. This interval must be a multiple of theprogram execution interval or storage intervals will be skipped. Forexample, if the program execution interval is 5 seconds and the tableinterval is set to 3 seconds, there will only be an entry in the table every 15
NOTE

Section 5. Setup
5-18
seconds. The interval specified determines the fastest rate the server cancollect new data from a data table.
5.4.1.1.2 Data Collection Setting Intervals
The collection interval at which the LoggerNet server requests new data fromthe datalogger is set up on the Schedule tab for that datalogger in the SetupScreen (Section 5.2.3). If the collection interval set up is faster than the rate atwhich data is being stored to a data table by the datalogger program, data willnot be collected every call, but only at intervals when new data is available.
If data collection is enabled for input location data (Inlocs) on CR10X-TDfamily dataloggers or Public tables on CR5000 or CR9000 type dataloggers,the current values will be collected every time a scheduled collection occurs,whether or not the values have been updated.
5.4.1.1.3 Communications Path Considerations
When setting up data collection intervals for the dataloggers you shouldconsider the communications path to the datalogger, and how it will affect howoften you can retrieve data.
Phone modems require anywhere from 10 – 30 seconds or more to establishcommunication, negotiate baud rate, and start transferring data. Therefore, it isnot a good idea to schedule collection by phone modem more often than onceevery two minutes. The time to make a call and start communications shouldbe considered when you are collecting from multiple stations by phone.Sufficient time should be allowed for the server to dial the station, retrieve thedata, and then contact the next station. There should be enough time betweencalls to the first station that the calls to the other stations using the same modemcan be completed. Otherwise the collection schedule will be delayed waitingfor the previous stations to finish.
RF networks with repeaters also add additional time delays since each modemmust be contacted and then pass the message on to the next RF modem and soon. Each of these operations takes time so the time schedule for RF networkswith repeaters should allow enough time for the link to be established with thedatalogger and collect the data.
Consideration should also be given to any manual operations such as clock sets,program downloads, or manual data requests to the datalogger. These requiresignificantly more time and can affect RF network responsiveness.
Any network setup using a phone to RF should be reviewed for collectionscheduling issues due to the combinations of time delays associated with RFdata collection.
5.4.2 Setting Up Scheduled Data CollectionThe data to be collected and the output file locations and format are specifiedon the datalogger's Data File or Final Storage tab (Section 5.2.3.2 or 5.2.3.2).The Schedule tab (refer to Section 5.2.5.4) is used to define the interval onwhich the LoggerNet server will check the datalogger for new data. If new data

Section 5. Setup
5-19
exists, it will be stored in the data files and the LoggerNet internal storage,which is accessible to the Numeric Display and Graph.
To set up a data collection schedule for a datalogger, first ensure that yourdevice map has been configured with all of the devices listed as they actuallyexist. Next, determine which tables or final storage areas should be collectedfrom the datalogger each time a data collection attempt is made. If no tablesare selected on the Data Files tab or the final storage area is not enabled forcollection, no data will be collected from the datalogger.
You should check the directory path and the data file options to make sure thefiles are where you want them and in the right format.
For table-based dataloggers, if no table names appear on the DataFiles Tab, click on the Get Table Definitions button.
The data collection schedule should be set up next. Set the initial date and timeto when you would like the first data collection attempt to occur and set theinterval at which subsequent data collection attempts should occur. Make surethat communications are enabled for all devices in the communications path,and that scheduled collection is enabled. If the initial date and time is set to atime that has already passed, data collection will normally begin immediately.
The Status Monitor screen (Section 7) can be used to ensure that data collectionis occurring on the defined schedule. If data is not being collected, check thefollowing:
• The Scheduled Collection Enabled box on the Schedule tab for thedatalogger must be selected. This turns the schedule "on". You cantemporarily disable data collection by clearing this check box and applyingthe change.
• The tables or final storage areas from which you desire data should beenabled for collection in the Data Files or Final Storage Area tab of theSetup Screen.
• All devices in the communications path to the datalogger must have theCommunications Enabled check box on the Hardware tab enabled.
• Unsuccessful attempts to communicate with the datalogger may exhaust thenumber of Primary Retries specified so that the Secondary Retry interval isin effect. Check the date and time listed for the next data collection in theStatus Monitor.
• Look at the collection state data for the datalogger in the Status Monitor.This is displayed as one of four states.
− Normal collection− Primary retry− Secondary retry− Collection disabled
NOTE

Section 5. Setup
5-20
5.5 Task MasterThe Task Master sets up and manages the optional user-defined tasksassociated with data collection. Tasks can be set up to trigger data collection orexecute batch file scripts or programs based on a variety of data collectionevents. Tasks may also be scheduled based on time intervals.
Clicking on the Tasks button or selecting Tasks from the Options menu bringsup the Task Master window. This window shows all of the dataloggers in thenetwork and any tasks that have been defined. If a task is attached to adatalogger as Task_1 in the example below, the task execution will be based ona datalogger collection event. Task_2 is not linked with a datalogger and willrun as a scheduled event.
5.5.1 Adding TasksTo add a task that will run based on a data collection event for a datalogger,select the datalogger by clicking on it. Then click on the Add After button orselect Add After from the Edit menu. A new task will appear attached to theselected datalogger. You can then set up the conditions for the task with theoptions on the right side of the window.
You can create complex combinations of tasks by linking tasks to other tasks ormultiple tasks to a datalogger. A task linked to another task has no start optionsbut will execute the specified action following the completion of the linked

Section 5. Setup
5-21
task. Multiple tasks linked to a datalogger will execute based on the conditionsspecified for the start of the task. This allows one task to be run aftersuccessful data collection and another if data collection fails.
To add a scheduled task, click on the Add button or select Add from the Editmenu. A new task will be added to the list of tasks below the list ofdataloggers. You can then set up the conditions for the task with the options onthe right side of the window.
To delete a task click to highlight it and click on Delete or select Delete fromthe Edit menu. The selected task will be deleted. If there are any tasks linkedto the task, they will move up and take the place of the deleted task.
Tasks can be renamed by selecting the task and then clicking again on the taskname. The name will turn into a text edit box and you can create your own taskname.
There is also a right click menu that will allow the same Add, Add After, andDelete functions as described above.
5.5.2 Logger Event TasksThere are eight data collection events that can be selected to trigger a tasklinked to a datalogger. Clicking on the drop down list button to the right of theevent brings up a list of these events as shown in the screen shot below. Theseevents allow you flexibility in deciding when a linked task should be run.
• After Any Scheduled Call – The task will run each time scheduled datacollection is attempted. This will run whether or not the attempt succeededor data was collected.
• After Successful Call – The task will run each time the datalogger issuccessfully contacted. This could be for data collection or any othercommunication with the datalogger.
• After Failed Scheduled Call – The task will run only when a scheduleddata collection fails to communicate with the datalogger. This is useful forbuilding in an alert or notification utility to warn the user of the failure.
• After Any Call – The task is run any time LoggerNet attempts to contactthe datalogger. This will run even if the datalogger does not respond or nodata is collected.

Section 5. Setup
5-22
• After Some, Not All, Data Collected – The task will run after datacollection from the datalogger has started but for some reason did notfinish. This can be used for detecting problems where data starts to comein and communication fails before all the data is collected.
• After Any Data Collected - The task will run after data is collected fromthe datalogger, whether the data collection finished successfully or not.
• On Call-back – The task will run when a datalogger initiated call isreceived by LoggerNet.
• After Call-back – The task will run after LoggerNet has processed thedatalogger call-back.
5.5.3 Scheduled Event TasksAn alternative to event driven tasks, scheduled tasks are repeated at a specifiedinterval. The Base Date and Time are used to set the initial date, time and anyoffset for the task execution. The interval specifies the time between taskexecutions. In the example shown the task will start on March 12,2002 and runonce an hour at 15 minutes past the hour.
5.5.4 Define What the Task DoesThe action to be started when the task is triggered is specified in the lower righthand panel of the task screen as shown below. The two options are eitherinitiate a call to a datalogger or execute a file. You can choose either or bothoptions by clicking the check box next to the option name.

Section 5. Setup
5-23
Call Station will attempt to collect data from the selected datalogger when thetask is triggered. Data will be collected according to the configuration set forscheduled data collection. Click on the triangle next to the drop down list for alist of all the dataloggers in the network.
Execute File will run the listed program or script file. Click on the button tothe right of the File Name to browse the computer for applications or scripts.Any file types that are registered with Windows such as audio, text or graphicfiles will bring up the associated application. This will allow you to put in awave file that will automatically announce the trigger condition.
Any command line parameters that are needed for the program can be listed onthe second line as Command Line Options.
If the application needs to have a working directory specified for other resourcefiles, the directory path is specified in the Working Directory box. Clickingon the Browse button ( … )to the right will bring up a directory list to choosefrom existing directories.
5.6 Convert from PC208W NetworkThe convert utility converts a datalogger network that was created underPC208W version 3.0 or higher to a network that will work with LoggerNet.This allows you to keep the network map and configurations as they were withthe PC208W software and avoid starting over.
It is a good idea to make sure that data collection with PC208W is up to dateand all the data from the dataloggers has been collected and saved into files.To run convert, shut down PC208W and bring up LoggerNet. You should alsomake a backup copy of the PC208W files.
Make sure that the network map in LoggerNet Setup Screen is empty. If youtry to convert a network map onto an existing network an error message willremind you that the current network map is not blank. (Make sure to applyafter you delete all the devices or they will all come back.)
Select the Convert from PC208W Network from the Options menu on the Setupscreen. A pop-up message will remind you that data collection should be up todate. Then the dialog box shown above will come up allowing you to choosethe PC208W network description file (pc208w.dnd) you want to convert. Youcan either type in the path or click on the button to the right with the ellipsis(…) that will allow you to browse for the file.

Section 5. Setup
5-24
PC208W network descriptions are files ending with .dnd and by default havethe name and path as shown in the dialog box above. Once you have found thenetwork description file to convert, click on OK and LoggerNet will run thescripts to create the network with settings in LoggerNet format. (The converterrequires that wmodem.ini be in the same directory as the pc208w.dnd.)
The new network should have all of the same devices and communication pathsas under PC208W. The data collected by PC208W will remain in the PC208Wdirectory and is not brought over to LoggerNet. LoggerNet will start datacollection and create new files and data storage based on the scheduledcollection settings for the dataloggers.

6-1
Section 6. ConnectThe Connect screen provides a real-time connection to a datalogger in the dataloggernetwork. Tools are provided for transferring programs to the datalogger, manually settingthe datalogger's clock, viewing and collecting data, and communicating with thedatalogger in terminal mode.
6.1 Connecting to the DataloggerThe Connect screen works with and displays data from only one datalogger at atime. You must select and connect to the datalogger before the other functionsof the Connect screen become available. The name of the selected dataloggerand the datalogger type appear in the title bar at the top of the window. Forease of use in large networks of many dataloggers you can list the dataloggersin alphabetical order by clicking on the check box Sort Alphabetically. All thestation names will be listed alphabetically to make it easier to find a specificstation.
When you click on the Connect button the animated graphic will indicate theconnection state. It will show that LoggerNet is trying to establish theconnection; the two connectors join together when the connection is made.You can also connect to the datalogger by double clicking on the dataloggername or selecting Connect from the File menu.

Section 6. Connect
6-2
Once the datalogger connection is established the Elapsed Time counter starts.This counter will continue as long as the datalogger connection is maintained.The user should be aware of the how long the Connect screen is connected tothe datalogger. The connection takes priority over other communication soother devices that share any part of the communication path will not becontacted, even for scheduled data collection. Max Time Online is disabledwhen the connection is established so this communications link will be activeuntil the user disconnects or closes the Connect screen.
Once a connection is made to a datalogger with the Connectscreen, this connection takes precedence and will preventcommunication with other devices sharing the same serial port orbase modem.
To disconnect from the datalogger, click on the button that now readsDisconnect. To select another datalogger you have to disconnect from the firstone. Double clicking on another datalogger will disconnect from the firstdatalogger and select the new one without prompting. (You will need to clickthe Connect button to connect to the new datalogger.)
If LoggerNet fails to make a connection to the datalogger, it will time out anddisplay an error message that it could not connect. It will immediately attemptthe connection again and will continue trying until the user clicks Cancel.
6.2 Data CollectionThe Data Collection section of the Connect screen allows you to control someaspects of collecting data from the datalogger. You can force a scheduledcollection to occur or initiate a custom data collection. This is also where youhave access to view and set ports and flags.
6.2.1 Collect Now/ Stop CollectionThe Collect Now function is the equivalent of doing a scheduled data collectionfor the datalogger without waiting for the scheduled time. Clicking on theCollect Now button will initiate a call to the datalogger and any available datawill be collected and stored as specified on the Setup screen. This function isoften used to manually update data collection to see the latest data in thenumeric monitor or the graph; or before data files are copied for processing.
Once you have started data collection with Collect Now, you can stop it byclicking on the Stop button or the Cancel button on the animated screen. Thismight be necessary if you started a data collection that is bringing in more datathan you really wanted, especially over a slow communications link.
6.2.2 Custom Collection for Array-based DataloggersClicking on the Custom Collection button while connected to an array-baseddatalogger brings up the dialog box shown below. The options you can specifyinclude the file format and whether to overwrite or append to the existing file,how much data to collect and which final storage areas you want to collect.
NOTE

Section 6. Connect
6-3
While retrieving data from the datalogger using CustomCollection, scheduled data collection will be suspended. Thedefault data file names for custom collection are separate fromthe files for scheduled collection data and by default are placed ina Data directory under the LoggerNet directory.
File Format
− ASCII, Comma separated writes data to the file in ASCII text format onerecord per line with commas between the data values. This file can beopened in LoggerNet View, a text editor, processed using Split, or broughtinto a spreadsheet application.
− ASCII, Printable writes data to the file in ASCII text format in tabseparated columns. The column number precedes each data value in therecord. Only 80 characters will be placed on each line, columns that don’tfit the 80 characters are placed on the next line. This file format can beopened in LoggerNet View, a text editor, or processed using Split. See theexample data file below.
01+0109. 02+2002. 03+0038. 04+1639. 05+15.00 06+13.20 07+24.79 08+073.909+269.0 10-1.00001+0109. 02+2002. 03+0038. 04+1639. 05+25.00 06+13.20 07+24.79 08+073.909+279.0 10-.98801+0109. 02+2002. 03+0038. 04+1639. 05+35.00 06+13.20 07+24.79 08+074.009+289.0 10-.94601+0109. 02+2002. 03+0038. 04+1639. 05+45.00 06+13.20 07+24.79 08+074.009+299.0 10-.875
− Binary writes the data to a file in a binary format. The advantage of thebinary format is that it is more compact so the size of the file is muchsmaller than for the ASCII based files. The disadvantage is that it’sunreadable except using View or by processing with Split.
File Mode
NOTE

Section 6. Connect
6-4
The File Mode determines if the data to be collected will be added at the end ofthe data file, if it exists, or will overwrite an existing data file. This option onlyapplies if a file with the same name exists in the directory specified.
Collect
− Collect All will get all of the data available in the selected final storageareas. For a datalogger that has a lot of data stored, this could result in alarge file and take a long time.
− Last Number of Arrays specifies how many of the last stored recordswill be retrieved from the datalogger.
− Advanced allows the user to specify the memory pointer address for eachof the final storage areas. Data collection will begin at the specifiedmemory pointer and go through the last record collected. Use of thisoption depends on knowing the memory pointer values for data collection.Pointers can be manually reset but are updated and stored with each datacollection.
Select Final Storage Areas
The Final Storage Area section on the dialog selects which final storage areasto collect data from. The file name and directory show where the collected datawill be saved. Clicking on the browse button ( … ) next to the file name willbring up the file select dialog.
6.2.3 Custom Collection for Table-based DataloggersClicking on the Custom Collection button while connected to a table-baseddatalogger brings up the dialog box shown below. The options you can specifyinclude the file format; whether to overwrite, append or create a new file; howmuch data to collect; and the tables you want to collect. With table-baseddataloggers you also have the option of choosing specific records or a timeinterval to collect.
Each table is saved in a separate file so there will be one file created for eachtable that is selected.
While retrieving data from the datalogger using CustomCollection, scheduled data collection will be suspended. Thedefault data file names for custom collection are separate fromthe files for scheduled collection data and by default are placed ina Data directory under the LoggerNet directory.
NOTE

Section 6. Connect
6-5
Collect Options
− Data From Selected Date and Time uses the starting and ending time anddates to get the data from the datalogger stored between those times. If thedatalogger does not have data for the specified time range a blank file willbe created.
− Newest Number of Records will retrieve the number of records specifiedin the Starting Record Information area going back from the last recordcollected.
− Specific Records will retrieve the specified number of records beginningwith the Starting Record # as specified in the Starting Record Informationarea.
− Data Since Last Collection will retrieve the data stored since the last timea custom collection was run. LoggerNet keeps track of the recordscollected from each table every time a custom collection is executed. Thisoption will work even if the last custom collection used a different option.
− All the Data will get from the datalogger all the data available from all ofthe selected tables. If the datalogger is full this could take a long time,

Section 6. Connect
6-6
especially with large memory dataloggers or over slow communicationlinks.
Starting/Ending Date and Time
The Starting and Ending Date and Time is used to specify the timestamp rangefor the selected date and time option. The date can be chosen from the dropdown calendar and the time can be entered or edited using the arrows to theright of the control.
Starting Record Information
− Starting Record # is used to specify a range of records to collect. Thedata collection will begin at this record number and get the number ofrecords specified in the Number of Records.
− Number of Records is used to specify a range of records or the number ofrecords to go back from the last record stored in the datalogger.
File Mode
File Mode is used to choose whether the collected data should be appended tothe file if it exists, overwrite the existing file, or create a new file. If CreateNew File is selected and the named file exists, a new file will be created withthe specified file name and a sequence number added to it.
File Format selects the file format for the output data file.
− TOACI1 Table Oriented ASCII type 1 format. This format has a two-lineheader giving the station and table name along with the labels for each ofthe data values. The data is written one record per line in ASCII text withthe timestamp at the beginning of each line. This file can be opened inLoggerNet View, a text editor, processed using Split, or brought into aspreadsheet application. The example below shows the data from aOneMinute table in a CR510TD datalogger.
"TOACI1","CR510TD","OneMinute""TMSTAMP","RECNBR","BattVolt_Time_MIN","RainTip_TOT""2002-02-13 16:29:00",10519,13.94,"2002-02-13 16:28:07",0"2002-02-13 16:30:00",10520,13.94,"2002-02-13 16:29:07",0"2002-02-13 16:31:00",10521,13.94,"2002-02-13 16:30:09",0"2002-02-13 16:32:00",10522,13.94,"2002-02-13 16:31:06",0"2002-02-13 16:33:00",10523,13.94,"2002-02-13 16:32:06",0"2002-02-13 16:34:00",10524,13.94,"2002-02-13 16:33:09",0"2002-02-13 16:35:00",10525,13.94,"2002-02-13 16:34:06",0"2002-02-13 16:36:00",10526,13.94,"2002-02-13 16:35:07",0"2002-02-13 16:37:00",10527,13.94,"2002-02-13 16:36:08",0
− TOA5 Table Oriented ASCII type 5 format. This format has a multi-lineheader including the TOACI1 information along with unit specifiers and anindication of the output process used for each of the data values. The datais written one record per line in comma separated ASCII text with thetimestamp at the beginning of each line. This file can be opened in

Section 6. Connect
6-7
LoggerNet View, a text editor, processed using Split, or brought into aspreadsheet application.
"TOA5","CR5000,"","","","","","OneMin""TIMESTAMP","RECORD","bat_Avg","temp_Avg","counter_Avg","curve_Avg""TS","RN","","","","""","","Avg","Avg","Avg","Avg""2002-02-13 16:29:00",11300,13.05,24.5,178.9,0.013"2002-02-13 16:30:00",11301,13.05,24.5,182,-0.018"2002-02-13 16:31:00",11302,13.05,24.5,178.3,0.013"2002-02-13 16:32:00",11303,13.05,24.5,180,-0.001"2002-02-13 16:33:00",11304,13.05,24.5,181.5,-0.012"2002-02-13 16:34:00",11305,13.05,24.5,178.1,0.018
− TOB1 Table Oriented Binary type 1 format. This is a compressed binaryformat that can be converted by View or processed using Split.
Data Collection
− Select Tables - Tables are selected by clicking the check box next to thetable name. The Select All check box provides a shortcut to select all theavailable tables in the datalogger.
− Change File Name will bring up a file selection dialog to choose thedirectory and file name for the highlighted table. To change the name ofthe file, highlight the table by clicking on the table name. Then click onChange File Name for the file dialog. Each data table will be saved in itsown file. By default the file name is the name of the station and the nameof the table. Right click on the file name will allow you to apply thedirectory for the selected file to all of the files.
You can have all the file stored to the same directory by changingthe directory for one of the files and then right click on the fileand choose Apply Directory to All. The directories for all of thefiles will then point to the same place.
− Reset Tables (CR5000 and CR9000 dataloggers only) lets you clear outthe data and reinitialize the data tables in the datalogger and the data cache.Clicking on Reset Tables will bring up a list of the tables defined in thedatalogger. Select the tables you want to reset (or click in the Select Allcheck box to get all of the tables) and click on OK. This will delete all thedata stored in the datalogger for the selected tables and will also resetLoggerNet’s data cache collect areas.
The Reset Tables function will delete the data stored inthe datalogger and the data cache (App. C) for theselected tables. Make sure you don’t need the storeddata or the data has been saved to a file.
NOTE
WARNING

Section 6. Connect
6-8
6.2.4 Ports and FlagsThe Ports and Flags window shows the current state of the ports and flags forthe datalogger. If the flag is enabled or the port is high, the button next to thename appears green; if the flag or port is low, the button appears black.
Click on the button next to the flag or port to turn it on or off. (Remember thatports can only be set if they are configured as outputs in the dataloggerprogram.) You can customize the names by clicking on the name and typingthe desired text.
6.2.5 View Status Table (Table Dataloggers Only)To view the status table for a table-based datalogger select View | Status Tablefrom the menu on the Connect screen. A window similar to the one below willbe displayed. Click on Select Fields to choose the status information you areinterested in seeing.
Once the fields are selected, LoggerNet will contact the datalogger to get thelatest status data for the selected fields.
Click on Refresh Values to have LoggerNet query the datalogger again to getupdated values. Each datalogger has a slightly different set of values in thestatus table. Information about the meaning of the values in the status table canbe found in Section B.3.

Section 6. Connect
6-9
6.3 Datalogger ClockOnce the connection to the datalogger is established, the datalogger clock ischecked continuously and displayed along with the computer clock as updatesare received. The clock update can be paused by clicking the check box next toPause Clock Update. In some situations it is desirable to pause the clockupdate to minimize data traffic over the communications link.
You can manually set the clock by clicking on the Set Station Clock button.LoggerNet attempts to set the datalogger clock as closely as possible to thecomputer clock. A slight difference in the clocks might exist after the clock isset because of the communications time delay. Over some communicationlinks it is impossible to match the computer clock exactly. LoggerNet usesadvanced compensation to get the best possible synchronization between thecomputer and the datalogger clocks.
An automatic scheduled clock check can be set up in the Setup screen (Section5.2.3.5).
If a manual clock set does not change the datalogger clock, checkthe allowed deviation specified in the Setup screen for thedatalogger's automatic clock check (Section 5.2.3.5). If thedifference in clocks is less than the specified deviation, a manualclock set will not have any effect.
Setting the clock may affect your data. Refer to Section 5.3 for furtherdiscussion.
NOTE

Section 6. Connect
6-10
6.4 Program ManagementThe Program section on the Connect screen is used to send or retrievedatalogger programs from dataloggers in the network.
6.4.1 Programs Created Using EdlogAfter a program is created and compiled using Edlog (Section 8.2) ProgramSend on the Connect screen is used to transfer it to the datalogger. To transfera program, first connect to a datalogger, then click on the Send button. Astandard file select dialog box will come up so you can choose the file to send.The Files of Type selector at the bottom of the dialog filters the displayed filesshowing only Edlog files (*.dld).
After selecting a datalogger program file a warning will appear to remind youthat data may be lost when the new program is sent. (For array dataloggers datais not lost if the memory configuration does not change, table-based dataloggersclear all data memory.) If there is any data in the datalogger that has not beencollected, click Cancel to stop the program send, and collect the needed data.
If OK is selected at the warning, the progress bar will come up with theprogram transfer progress. Once the program has been sent, the text changes toCompiling Program. When the datalogger finishes compiling the program theprogress box will close.
If a program downloaded to the datalogger sets or changes theactive security code, make sure to change the security setting forthe datalogger in Setup screen (Section 5.2.3.1). Otherwise,access to the datalogger may be limited or completely denied.
The program running in the datalogger can be retrieved and saved to a file byconnecting to the datalogger and clicking on the Retrieve button. You will beprompted for a name and directory to store the retrieved file. A retrieved *.dldfile can be imported into Edlog for editing by using Edlog's Document DLDfeature (Section 8.2.4). This is useful if the original file has been corrupted,lost, or erased. Programs cannot be reliably retrieved over some slowcommunications links.
6.4.2 Programs Created Using CRBasic EditorWorking with CR5000 and CR9000 dataloggers provides additional optionswhen programming the dataloggers and managing the datalogger programs.These dataloggers have a built in file system much like a computer hard disk.Multiple files can be stored in the datalogger memory, including data files anddatalogger programs. The user can choose a program to run, stop execution ofthe active program, or select a program to be run on power-up of thedatalogger.
The Connect screen Program Send for the CR5000 and CR9000 dataloggersworks similarly to the other dataloggers.
NOTE

Section 6. Connect
6-11
After a program is created using the CRBasic Editor (Section 9.2) ProgramSend on the Connect screen can be used to transfer it to the datalogger. Totransfer a program, first connect to a datalogger, then click on the Send button.A standard file select dialog box will come up so you can choose the file tosend. The Files of Type selector at the bottom of the dialog filters thedisplayed files showing only CRBasic files (*.cr5 or *.cr9).
After selecting a datalogger program file a warning will appear to remind youthat data will be lost when the new program is sent. If there is any data in thedatalogger that has not been collected, click Cancel to stop the program send,and collect the needed data.
If OK is selected at the warning, the progress bar will come up with theprogram transfer progress. Once the program has been sent, the text changes toCompiling Program. When the message from the datalogger indicates asuccessful compile the progress box will close.
The active program running in the datalogger can be retrieved and saved to afile by clicking on the Retrieve button. You will be prompted for a name anddirectory to store the retrieved file. Program files retrieved from a CR5000 orCR9000 can be opened directly in the CRBasic Editor. This is useful if theoriginal file has been corrupted, lost, or erased.
An alternate way to send a program to these dataloggers is to use the FileControl dialog that comes up by selecting from the menu View | File Control(see Section 6.6 for details).
6.5 Data DisplaysThe Connect screen Data Displays provide display screens to monitor numericvalues or view graphs of the collected data. Both types of displays get theirdata from the LoggerNet data cache so the data must be collected from thedatalogger before it can be displayed. Active scheduled collection will supplyupdated data for these displays automatically as it is received from thedatalogger.
Input locations, ports and flags for array-based and CR10X-TDtype dataloggers, and public variables for the CR5000/CR9000are automatically retrieved from the datalogger when selected fordisplay. These do not have to be added to scheduled datacollection to be viewed.
Updates to the displays can be suspended by clicking the check box PauseDisplays. This will stop all the updates to the displays even though new datamay be coming in to LoggerNet.
If clock updates and display updates are paused while connectedto a datalogger, the connection may time out and terminate theconnection.
There are three Numeric Display screens and three Graphical Display screens.Each screen is launched as a separate window that can be moved or resized as
NOTE
NOTE

Section 6. Connect
6-12
needed. The display screens are not minimized if the Connect screen isminimized but they can be minimized independently.
6.5.1 Graphical Display ScreensData values collected from the datalogger can be plotted on a line graph in theGraphical Display. Up to three Graphical Display screens can be active. Thesettings and selected data values are retained as part of the graph settings evenwhen the graph or Connect screens are closed. The settings for each dataloggerare saved independently so a different datalogger will have different settings.
Clicking on one of the three numbered buttons next to the Graphical displayarea will bring up a Graphical Display screen. An example of one of thesescreens is shown below. If a Graphical Display screen is already active buthidden behind other windows, clicking on its number will bring it to the front.
Final storage data must be collected by LoggerNet before it canbe graphed.
The timestamp for the right side of the graph is displayed above theconfiguration buttons on the right side of the window. This indicates thetimestamp for the most recent data.
6.5.1.1 Add
When first opened the Graphical Display is initially blank; the fields to beplotted must be selected. Press the Add button to bring up the Available Fields
NOTE
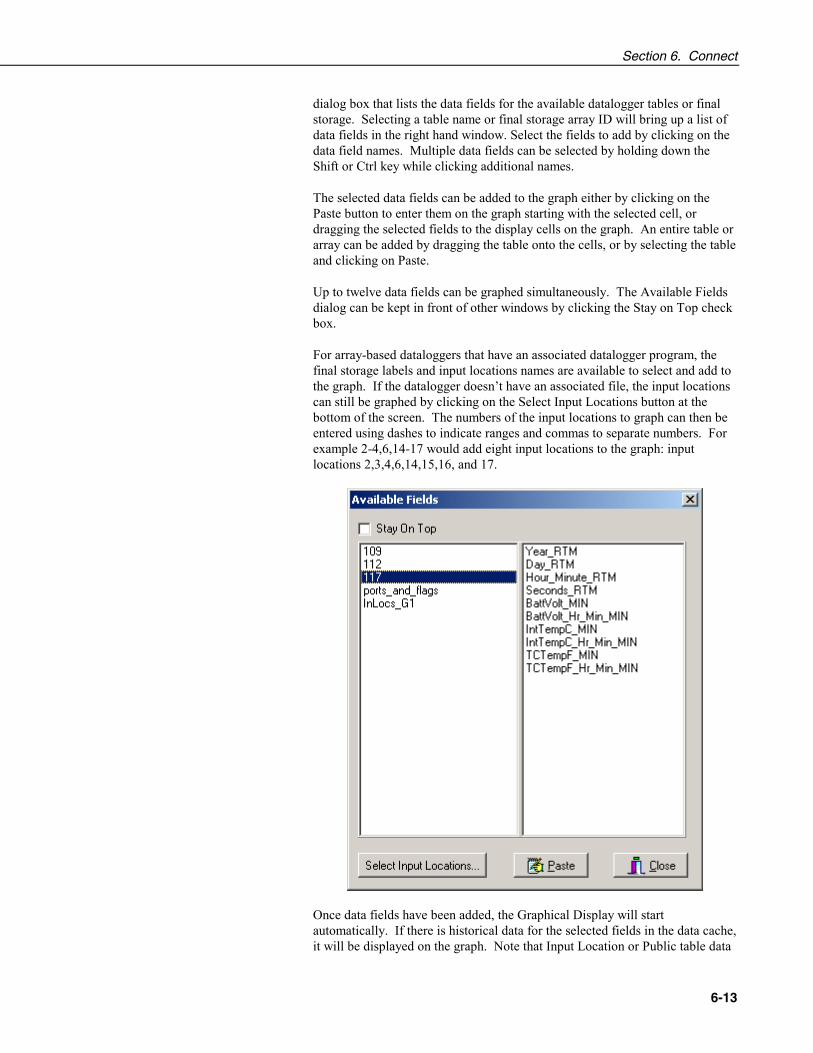
Section 6. Connect
6-13
dialog box that lists the data fields for the available datalogger tables or finalstorage. Selecting a table name or final storage array ID will bring up a list ofdata fields in the right hand window. Select the fields to add by clicking on thedata field names. Multiple data fields can be selected by holding down theShift or Ctrl key while clicking additional names.
The selected data fields can be added to the graph either by clicking on thePaste button to enter them on the graph starting with the selected cell, ordragging the selected fields to the display cells on the graph. An entire table orarray can be added by dragging the table onto the cells, or by selecting the tableand clicking on Paste.
Up to twelve data fields can be graphed simultaneously. The Available Fieldsdialog can be kept in front of other windows by clicking the Stay on Top checkbox.
For array-based dataloggers that have an associated datalogger program, thefinal storage labels and input locations names are available to select and add tothe graph. If the datalogger doesn’t have an associated file, the input locationscan still be graphed by clicking on the Select Input Locations button at thebottom of the screen. The numbers of the input locations to graph can then beentered using dashes to indicate ranges and commas to separate numbers. Forexample 2-4,6,14-17 would add eight input locations to the graph: inputlocations 2,3,4,6,14,15,16, and 17.
Once data fields have been added, the Graphical Display will startautomatically. If there is historical data for the selected fields in the data cache,it will be displayed on the graph. Note that Input Location or Public table data

Section 6. Connect
6-14
don’t have history stored in the data cache; therefore, no historical data will bedisplayed.
6.5.1.2 Delete
To delete data fields from the Graphical Display, select the data fields on theGraphical Display and press the Delete button. Existing data fields can bereplaced by adding new data fields to the same cells.
6.5.1.3 Graph Options
To customize the Graphical Display, press the Options button. The GraphDisplay Options dialog box has four tabs: Scaling, Time Display, VisualDisplay, and Export.
6.5.1.3.1 Graph Scaling Options
The Graph Scaling Options are used to set up the scale for the right and leftaxes. The axes can be scaled automatically, fixed to a specific range or set toPower of Ten Scaling.
The left and right y-axes can be set independently. Data values can be set tograph relative to the right or left axis. (Section 6.5.1.3.5) The scales are onlyshown on the graph if there are data fields linked with them.
Scaling Options
− Automatic Scaling will adjust the axis according to the values currentlybeing displayed on the graph. The maximum and minimum will be set todisplay the largest and smallest values of all the fields being graphed. Ifthere are values that are much larger or much smaller than the others, theycan dominate the scaling and make variations in the other fields harder tosee.

Section 6. Connect
6-15
− Power of Ten Scaling applies a Power of Ten multiplier to each of thedata fields so the graph will have a scale of either 0 to 10, or -10 to 10 sothat all values can be displayed on the same graph. This option will scalethe data values by factors of ten so they will fit between 0 to 10, or -10 to10, depending upon the option chosen. When this option is in effect,pressing the Rescale Button on the Graph tab will rescale any value thathas fallen outside of the scale.
− Custom Scaling - The Upper Y Value and Lower Y Value fields are usedto specify a fixed range for the Y axis. When this option is in effect, theRescale button on the Graph will be disabled. Any data values that do notfall within the specified range will not appear on the graph.
6.5.1.3.2 Graph Time Display Options
Select Graph Width determines the amount of time displayed across the widthof the graph. The default setting of 1 minute will display 1 minute of data. Iflarger graph widths are specified the graph will backfill to plot whatever data isavailable in the data cache.
Select Update Interval defines how often the Input Locations or Public Tabledata are updated on the graph. A shorter interval here will increase the amountof communication taking place with the datalogger. Final storage data will onlyupdate when collected by scheduled data collection.
There are two Time Axis Display options for the X axis. You can choose toShow Time and Date, or Display Just Time.
6.5.1.3.3 Graph Visual Display Options
The Visual Display Options allow the user set the appearance of the graph.The colors for the grids and background as well as how the trace should appearcan be set here. A title can also be added to the graph.

Section 6. Connect
6-16
Display Options
− Background Color selects the color of the graph background. This iswhite by default. Be careful to select a background color that does notmake any of the data traces disappear.
− Left / Right Grid Color selects the color of the grid lines that go with theleft or right scale axis.
Trace Options selects whether the trace will be displayed with the line plot, theactual data points or both. The line color, width and style for the trace are setin Cell Options (Section 6.5.1.3.5).
Title allows you to place a descriptive title on the graph. Enter the text of thetitle in the text box, then click on the Show Title check box to make the titlevisible. Click on the Font button to choose the font style, size and color for thetitle.
6.5.1.3.4 Graph Export Options
Graph Export will save an image of the displayed graph to the clipboard, agraphics file, or will print the graph to a printer. The file export can be savedeither to a bitmap (*.bmp) or a windows metafile (*.wmf) format. Most graphicfile applications can import one or both of these formats.
The Margins setting provides for a border area around the graph. These arespecified in % of the total linear measurement. The size of the saved graphimage depends on the size of the graph on the screen. If the graph is maximizedthen the saved file will save the large image.

Section 6. Connect
6-17
6.5.1.3.5 Data Field Display Options
The display options for the data fields can only be accessed using the right clickmenu. Right click one of the data fields on the graph and the following menuwill appear:
Cell Options brings up the dialog box shown below. This allows theconfiguration of various trace options.
Select Axis sets whether the data trace is linked to the left or right axis. Thedisplayed graph will depend on the axis settings for the selected scale.
Style selects the style for the line.
Symbol Style selects the appearance of the individual data points.

Section 6. Connect
6-18
Pixel Width sets the width of the trace line. Wider traces are easier to see butmay obscure other traces or small variations of the data.
New Color sets the color of the trace and the data points. The user can choosefrom the Windows color palette for the color. The color for this trace is shownin the color window.
6.5.1.4 Rescale Graph
Rescale Graph is only used for Power of Ten Scaling. Sometimes the scalefactor for a field is fixed before the field has reached a maximum. This maycause the data to be displayed partially or completely off the Graphical Display.Clicking on the Rescale Graph button causes the graph to re-evaluate the scalefactors for all the fields and adjust them as necessary to keep them within thelimits.
6.5.1.5 Start / Stop Graphing
While the graph is running, any new data received from the datalogger will beautomatically plotted on the graph and the graph scrolled forward. Thegraphing can be stopped to capture some event to a graphics file by clicking onthe Stop button. Clicking the Start button will start the graph again, includingfilling in historical data values for final storage data.
6.5.1.6 Clear Graph
Clear Graph clears all the trace plots from the Graphical Display area. Thegraphing of data continues at the right side of the graph as data is collected. Tograph the historical data again, click the stop and then the start button.
6.5.2 Numeric Display ScreenData values collected from the datalogger can be displayed in numerical formaton the Numeric Display. Up to three Numerical Display screens can be active.The settings and selected data values are retained as part of the display settingseven when the display or Connect screens are closed. The settings for eachdatalogger are saved independently so a different datalogger will have differentsettings.
Clicking on one of the three numbered boxes next to the Numerical display areawill bring up a Numerical Display screen. An example of one of these screensis shown below. If a Numerical Display screen is already active but hiddenbehind other windows, clicking on its number will bring it to the front.
Final storage data must be collected by LoggerNet before it canbe displayed.
NOTE

Section 6. Connect
6-19
6.5.2.1 Add
When first opened the Numeric Display is initially blank; the fields to bedisplayed must be selected. Press the Add button to bring up the AvailableFields dialog box that lists the data fields for the available datalogger tables orfinal storage arrays. Selecting a table name or final storage array ID will bringup a list of data fields in the right hand window. Select the fields to add byclicking on the data field names. Multiple data fields can be selected byholding down the Shift or Ctrl key while clicking additional names. An entiretable or array can be selected by clicking on the table name.
The selected data fields can be added to the display either by clicking on thePaste button to enter them on the display starting at the selected cell, ordragging the selected fields to the display cells.
Up to sixty data fields can be displayed simultaneously. The Available Fieldsdialog can be kept in front of other windows by clicking the Stay on Top checkbox.
For array-based dataloggers that have an associated datalogger program, thefinal storage labels and input locations names are available to select and add tothe display. If the datalogger doesn’t have an associated file, the inputlocations can still be displayed by clicking on the Select Input Locations buttonat the bottom of the screen. The numbers of the input locations to display canthen be entered using dashes to indicate ranges and commas to separatenumbers. For example 2-4,6,14-17 would add eight input locations to thedisplay: input locations 2,3,4,6,14,15,16, and 17.
Once the fields have been added to the Numeric Display, they will updateautomatically as new data is collected from the datalogger. Input Locations andfields from a Public table that are not included as part of normal scheduled data

Section 6. Connect
6-20
collection will be collected from the datalogger based on the Update Interval.The frequency of the update is set under cell options in the Update Interval.Setting the Update Interval for one cell applies to all cells on the display.
6.5.2.2 Delete
To delete data fields from the Numeric Display, select the data fields on thedisplay and press the Delete button. Adding new data fields on top of existingfields in the display will overwrite the existing fields.
6.5.2.3 Display Options
To customize the Numeric Display, select one or more cells and click on theOptions button. The Cell Options dialog box allows you to set up how the datashould appear and set visual alarms.
Display sets up the appearance of the numbers being displayed
− Number of Decimal Places to Display sets the number of digits to displayto the right of the decimal point. This can be used to show greaterprecision or present a cleaner appearance, depending on the data need.
− Set Data Justification sets whether the data will be displayed at the rightor left side of the display box.
− Update Interval controls how often LoggerNet will get updated InputLocations or Public table values from the datalogger if those fields are not

Section 6. Connect
6-21
part of scheduled data collection. Setting this interval for any cell appliesto all fields on the Numeric Display.
There are limits to the number of Input Locations that can be brought over fromsome of the dataloggers. Older array-based dataloggers can bring in 62 inputlocation values at a time. The newer array-based dataloggers can bring in up to500 input locations. The CR10X-TD family of dataloggers is limited to amaximum of 500 input locations by packet size and record format. CR5000and CR9000 dataloggers don’t have practical limits for the number of PublicVariables that can be requested or displayed.
Both array-based and CR5000/9000 dataloggers will retrieve only the requestedinput locations or public variables. CR10X-TD type dataloggers must retrievethe whole input locations record in one packet. If more than 500 inputlocations are used, the record cannot be collected.
Alarms can be set to turn the display field a different color depending on thevalue of a data point. Click on the Enable Alarms check box to turn on thealarm feature. The alarm levels can be set for a cell by entering a value in theHigh Alarm Value field and the Low Alarm Value field. When the data valuedisplayed in the cell exceeds the limits set, the cell color will change based onthe colors selected for each of the alarm values.
6.6 File Control for CR5000 and CR9000To access File Control for the CR5000 and CR9000 dataloggers select View |File Control from the menu. This will bring up the File Control window asshown below.
The File Control window displays a list of files stored on a CR5000 or aCR9000’s CPU or PC card. The window on the left lists all of the data storage

Section 6. Connect
6-22
areas available for the selected datalogger. Selecting a storage area shows a listof the files stored in that area.
The run attributes for a file indicate whether it is set to Run Always, Run Now,or Run On Start-up. The currently executing program is indicated by the RunNow or Run Always attribute.
The Run Now attribute is the active program. Run on Start-up is the programthat will run when the datalogger powers up. Run Always is a combination ofboth attributes set.
There are several options to work with the files and directories on the CR5000and CR9000 dataloggers.
Send is used to transfer files from the computer to the datalogger. Clicking onthe Send button brings up a standard file selection dialog box. A new file canbe chosen to send to the highlighted area.
On the example screen above, the CPU is the selected device. There are avariety of files that can be sent to the datalogger. These include dataloggeroperating system, datalogger program, and data files.
Because of the number of special operations that run in thebackground that don’t happen in a normal file transfer, adatalogger operating system has to be sent to the datalogger usingthe Send Program button on the Program area of the Connectscreen. PC9000 can also be used to transfer a dataloggeroperating system.
Format is used to format the selected device. Just like the formatting a disk ona computer, all of the files on the device are deleted and the device isinitialized.
NOTE

Section 6. Connect
6-23
Retrieve will get the selected file from the datalogger and store it on thecomputer. A Save As dialog box comes up allowing you to specify thedirectory and file name for the saved file.
Modify brings up a dialog box to change the attributes of the selected file. Thedevice name and file name appear at the top of the dialog screen. Run Nowwill make the selected file the active datalogger program. Run on Start-up willrun the selected program the next time power is cycled to the datalogger. Bothattributes checked is Run Always.
Refresh will update the list of files for the selected device. This is used whenthe files on the datalogger have changed because of files being created by thedatalogger or file attributes being changed by the datalogger under programcontrol.
Stop Program halts execution of the currently running datalogger program.
6.7 View Terminal EmulatorThe datalogger can be put into a remote terminal mode so that the user can sendlow level communication instructions to the datalogger. Often this is used fortroubleshooting applications, such as viewing memory settings in the dataloggeror changing the program execution interval temporarily. When terminalemulation is active, all other communication with the datalogger is suspended,including scheduled data collection. Information on communicating with thedatalogger in terminal mode is provided in the datalogger user's manual.
To activate the terminal emulation screen select View | Terminal Emulator fromthe menu.
The Terminal Emulation function should be used with care.It is possible to affect the settings of the datalogger, suchas changing the datalogger program and tables. Changesof this type will cause data collection to be suspended andpossibly result in lost data.
This is a blank page.
CAUTION

Section 6. Connect
6-24

7-1
Section 7. Status MonitorThe Status Monitor screen provides a way to monitor communications statistics for thedatalogger network. Statistics are displayed for data collection attempts and communicationfailures. There are also functions available to monitor the log messages for the computerand the tasks that have been set up.
7.1 Main ScreenThe main screen displays the network map showing the devices in the networkand the statistics associated with each device. The network map is in theleftmost column. The name of each device is displayed next to a status iconthat indicates the current communication state for that device.
The status icon, , is displayed to the left of the device name. The color andletter displayed are a way to quickly verify the LoggerNet communicationserver's connection with the device. A device has one of four states: Normal(green N), Marginal (blue M), Critical (red C), or Unknown (gray U). Thestatus icon changes to reflect the device's current status.
The display defaults with the most commonly monitored statistics for eachdevice and can be customized by the user. For a description of the statisticsand their meaning see Section 7.2.1.
Above the display area is a row of buttons providing quick access to many ofthe functions available in the Status Monitor. Below the display area is anindication of the disk space available on the computer and check boxes forShow Stations Only and Pause Schedule. The current computer time isdisplayed in the lower right hand corner.
The Status Monitor functions can also be accessed through the menus at the topof the screen.

Section 7. Status Monitor
7-2
7.2 Status Monitor FunctionsThe Status Monitor includes a number of functions that provide control overthe LoggerNet data collection process, configure the display appearance, orbring up other screens such communication log monitors or task status. Mostof these functions can be accessed in more than one way. Each of the accessmethods is described for the functions.
7.2.1 Select ColumnsThe Status Monitor can be customized to display only those columnscontaining statistics of interest. To add columns to the Status Monitor window,click Edit | Select Columns. The Select Statistics window appears. Rightclicking in the middle of the Status Monitor window will also bring up theSelect Statistics window.
Entries in the Available Statistics field will not be displayed on the main screen.Entries in the Selected Statistics field will be displayed on the screen. Thearrow buttons are used to move entries between the two columns. Alternately,an entry can be moved from one column to the other by double clicking it.
A variety of status information and statistics are available. These statisticsvalues are updated continuously as LoggerNet communicates with the devicesin the network. The actual text as displayed on the screen is shown below inparentheses.
• Average Error Rate (Avg Error %) - A running average of the numberof communication failures and retries. Each failure increments the average5%. The error rate decreases slowly with more successfulcommunications. This is done to allow marginal link errors to be displayedlong enough for an administrator to observe.

Section 7. Status Monitor
7-3
• Collection Enabled (Coll Enabled) - Indicates whether or not scheduleddata collection is enabled for the device. (Data collection is set up andenabled in the Setup Screen.)
• Collection State (Coll State) - Indicates the current state of scheduleddata collection.
− Normal - The normal data collection schedule is active.
− Primary Retry - A data collection failure has led to the primaryretry collection schedule.
− Secondary Retry - The number of primary retries set in the SetupScreen have run out and the secondary retry schedule is nowactive.
− Schedule Off - Scheduled data collection is not enabled for thisdevice.
− Communications Disabled - Communications for this device orone of the devices in the communication link from the computerhas been disabled.
− Invalid Table Definitions - A change in the table definitions forthis device has been detected. This has caused scheduledcollection to be suspended until LoggerNet has updated tabledefinitions to match the datalogger.
− Network Paused - Scheduled data collection has been suspendedfor the whole network.
• Communication Enabled (Comm Enabled) - Indicates whether or notcommunication is enabled for the device. (Communication is set up andenabled in the Setup Screen.)
• Communication Status (Comm Status)- The current communication stateof the device: Normal, Marginal, Critical, or Unknown. This valuematches the state of the indicator next to the device name. Marginal isindicated when warning messages for the device are logged incommunications. Critical is indicated when communication failures arelogged in communications.
• Final Storage Area 1, 2 Collected (FS1 Collected, FS2Collected) -(Array-based dataloggers only) This value will show the number of datavalues that have been collected from final storage area 1 or 2. Incombination with the FS to Collect statistic this can show progress towardthe completion of data collection.
• Final Storage Area 1, 2 to Collect (FS1 to Collect, FS2 to Collect) -(Array-based dataloggers only) When LoggerNet first contacts thedatalogger for data collection, the datalogger indicates how much datathere is to collect from each of the storage areas. This statistic shows thenumber of values for the current data collection activity. When the numberof values collected matches the number to collect, all of the data for thiscall has been collected.

Section 7. Status Monitor
7-4
• Last Clock Check (Last Clk Chk) - The computer date and time of thelast time the clock was checked for this device.
• Last Clock Difference (Last Clk Diff) - The amount of time thedatalogger clock deviated from the LoggerNet computer’s clock when thelast clock check was performed. If the datalogger clock is slower than thecomputer clock, this will be a positive value.
• Last Clock Set (Last Clk Set) - The computer date and time that thedatalogger's clock was last set to match the LoggerNet computer’s clock.
• Last Collect Attempt - The computer date and time when data collectionwas last attempted for this device.
• Last Data Collection - The date and time that data was last collected fromthe device by LoggerNet.
• Line State - This is an indication of the current communications activityfor the device. In normal communication these will be changing often andwill provide a feel for how the network is working. The possible states arelisted below.
− Not-applicable - LoggerNet cannot communicate with this devicedirectly. Table-based RF Modems is one example.
− Off-Line - There is no active communication with this device.
− On-Line - LoggerNet is actively communicating with this device.
− Transparent - The device is being used as a bridge tocommunicate with another device.
− Hanging Up - LoggerNet has finished communication with thisdevice or the other devices on the link and is closing downcommunication.
− Comm-Disabled - Communications for this device have beendisabled for this device, a parent device, or the network.
• Logger Version (Logger Ver) – (Array-based dataloggers only) Thisnumber indicates the version level of the datalogger. This number is usedby LoggerNet to adjust communication for older dataloggers.
• Memory Code (Mem Code) – (Array-based dataloggers only) Thisnumber is an indication of the amount of memory available in thedatalogger. The amount of memory represented depends on thedatalogger. See the datalogger operator’s manual for more information.
• Next Data Collection (Next Data Coll) - The date and time of the nextscheduled data collection for the device.

Section 7. Status Monitor
7-5
• Polling Active – True indicates that LoggerNet is currently receiving datafor this device.
• Program Overrun (Prog Overrun) – (Array-based dataloggers only)This is the number of table overruns recorded for the running dataloggerprogram. This is the same number available from *B mode with keyboarddisplays or through the terminal mode.
• Total Attempts - The total number of communication attempts with thedevice since LoggerNet was started or retries were reset.
• Total Failures - The total number of communication attempts with thedevice that have failed since LoggerNet was started or retries were reset.
• Total Retries - The total number of communication attempts with a deviceafter the original attempt failed since LoggerNet was started or retries werereset.
• Values In Last Collect (Vals Last Collect) - The number of values thatwere collected during the last data collection attempt. Used in combinationwith the Values to Collect the user can get an idea of how much data is leftto collect.
• Values to Collect (Vals to Collect) – The total number of values to becollected. When LoggerNet first contacts the datalogger it finds out howmany data values are waiting to be collected.
• Watchdog Error (Watchdog Err) – (Array-based dataloggers only) Thisis the number of Watchdog Errors being reported by the datalogger. Thisis the same number that is available from *B mode with keyboard displaysor terminal emulation. See the datalogger operator’s manual for moreinformation.
7.2.2 Toggle Collection On/OffThis function toggles scheduled collection on or off for the selected datalogger.The change to scheduled collection is reflected on the Setup screen for thisdatalogger. The function is only enabled when a datalogger is selected in thenetwork map. Collection can be toggled either by clicking on the button orselecting Options | Toggle Collection On/Off.
7.2.3 Reset RetriesResets the cumulative attempts and retries along with the average error rate forthe selected device. Reset Retries is done either from the button or selectingOptions | Reset Retries.

Section 7. Status Monitor
7-6
7.2.4 Collect Data/Stop CollectCollect Data starts data collection for the selected datalogger. This is theequivalent of the Collect Now button on the Connect screen. Data collectionwill use the file settings from the Data Files or Final Storage Area 1 or 2 tabson the Setup screen. While data collection is in progress Stop Collect will stopthe collection. This might be needed if the datalogger has a lot of uncollecteddata and it would take too long to get it all. These functions are available byclicking on the buttons or on the Options menu.
7.2.5 Server LogsServer Logs brings up the LoggerNet log message viewer. You can enable theview for each of the logs by clicking the View check box for the log you wantto see. The windows can be resized and the scrolling display can be paused byclicking the Pause check box.
There are three logs kept by LoggerNet that track the operation of the server,communications with the dataloggers and data collection. A brief descriptionof these logs and their messages is found in section 7.3. A more detaileddescription of the messages and their meanings is found in Appendix D.
7.2.6 View I/OView I/O brings up a Low Level Input/Output monitor for examining serialcommunications between LoggerNet and a root level device. Bothhexadecimal and ASCII representations of the serial communications with atimestamp are seen in the log message window. The R and T at the beginningof each line represent a message received or transmitted by LoggerNet. Thescrolling display can be paused by clicking the Pause check box.
The Low Level I/O is brought up by selecting a root level device and clickingon the View I/O button, or selecting Options | View I/O. A description of theLow Level I/O log is outlined in section 7.4.
7.2.7 Task StatusTask Status brings up a window, similar to the one shown below, to monitor thestatus and operation of tasks that have been defined in the Task Manager.

Section 7. Status Monitor
7-7
The window shows the type of task, the last time it was run, the interval if it isscheduled or the event that triggers it if it depends on data collection. The RunTask button will run the selected task and can be used to test the operation of atask. There is also a check box that will suspend the execution of all tasks.
7.2.8 Show Stations OnlyShow Stations Only will hide all of the devices in the network map except thedataloggers and storage modules. This can make the display easier to view,especially when there are many dataloggers in the network or thecommunication paths are complex. This option is enabled or disabled byclicking on the check box at the bottom of the Status Monitor screen orselecting Options | Show Stations Only.
7.2.9 Pause SchedulePause Schedule suspends scheduled data collection for all of the dataloggers inthe network. This can be useful when trying to isolate specific problems. Thisoption is enabled or disabled by clicking on the check box at the bottom of theStatus Monitor screen or selecting Options | Pause Schedule.
7.2.10 Log SettingsLog Settings allows you to control whether the logs are saved to files alongwith the size and number of log files that are created. One set of log files iscreated for each of the three LoggerNet logs. If Save to Disk is enabled for theLow Level I/O logs, one set of logs will be created for each of the root leveldevices in the network. Once the maximum number of logs have been createdthe next log file created will overwrite the oldest file.
Selecting Edit | Log Settings brings up the following dialog box.

Section 7. Status Monitor
7-8
The following settings are used enable saving the logs to disk as well as tocontrol the number and size of the log files.
To Disk – Turning on this check box enables saving the associated logs to fileson the server computer hard disk.
File Count – This setting determines the number of log files to be saved to diskfor this type of log. The server will store up to the number specified beforeoverwriting the oldest log.
File Size – This setting determines how big the log file is allowed to growbefore being saved to a archived file. The $ sign identifies the active file.Once a file reaches the specified File Size, it is saved to disk with a sequentialnumber beginning with 0 (e.g. tran0.log, tran1.log, tran2.log…).
7.3 Monitoring Operational LogsThree operational logs are available that provide information on thecommunications between the LoggerNet server and the datalogger network:Transaction Log, Communication Log, and Object State Log. The informationin these logs is used for troubleshooting communications links.
Each log is initially configured in the Status Monitor screen (refer to Section7.2.10).
In the Status Monitor screen, clicking on the Server Logs button will bring upthe LoggerNet logs display. Selecting View Server Messages on the Optionsmenu will also bring up the log display. Individual log displays can be turnedon or off by selecting the View check box, or temporarily paused by selectingthe Pause check box.
Examples of the log files, and the details of the messages can befound in Appendix D.
NOTE

Section 7. Status Monitor
7-9
7.3.1 Transaction Log (TRAN$.LOG)This log includes information on the transactions that occur between LoggerNetand the devices in the datalogger network. Examples of these types of eventsare clock checks/sets, program downloads, and data collection. When saved todisk, the file name for the log will be tran$.log, where $ denotes the active log,and tran1.log, tran2.log, etc. denote historical logs.
7.3.2 Communication Log (COMMS$.LOG)This log records information on the quality of communications in thedatalogger network. Three types of messages are recorded: status messages,warning messages, and fault messages. When saved to disk, the file name forthe log will be comms$.log, where $ denotes the active log, and comms1.log,comms2.log, etc. denote historical logs.
7.3.3 Object State Log (STATE$.LOG)This log is used for troubleshooting an object in the datalogger network. Theinformation in this log conveys the state of an object at a given time. Whensaved to disk, the file name for the log will be state$.log, where $ denotes theactive log, and state1.log, state2.log, etc. denote historical logs.

Section 7. Status Monitor
7-10
7.4 Monitoring Low Level I/OA low-level log is available for each root level device used for LoggerNetcommunications. The low-level log shows all of the low-level transactionsbeing passed between the server and the devices in the datalogger network overa communications port. As with the operational logs, this log's initial settingsare specified using the Edit | Log Setting on the Status Monitor screen.
The low-level log is displayed by highlighting the root level device in thedevice map, and clicking the View I/O button or from the menu selectingOptions | View I/O.
The names for the files that are saved start with io$ and include the name of thedevice. For example io$SerialPort_1 log. A separate log file is kept for eachroot device. The active log is identified with the $. Once the maximum sizehas been reached, the file is saved and the $ is replaced by a sequential number.
Each line in the log includes a time stamp. An R indicates information that hasbeen received from a device in the network; a T indicates information that isbeing transmitted to a device.
Multiple low level log windows can be displayed at the same time so you canview low level messages for more than one root device.

8-1
Section 8. Datalogger ProgramCreation with EdlogThis section provides information on memory allocation and programming for CampbellScientific’s CR7, CR10, 21X, CR500, CR510, CR10X, CR23X, CR510-TD, CR10X-TD,CR23X-TD and CR10T dataloggers. See Section 9 for information about the CR5000 andCR9000 CRBasic program editor.
8.1 OverviewEdlog is a tool for creating, editing, and documenting programs for CampbellScientific's array-based dataloggers: CR500, CR510, CR10, CR10X, 21X,CR23X, and CR7, and table-based dataloggers: CR510-TD, CR10T, CR10X-TD, and the CR23X-TD. It provides a pull-down menu from which to selectinstructions, with pick-lists and detailed help for completing the instructions'options (or parameters). Edlog checks for errors and potential problems in theprogram when pre-compiling the program. Some highlights of Edlog’s featuresare listed below.
Precompiler - Edlog precompiles the program to check for errors and to createthe file that is downloaded to the datalogger. The precompiler will catch mostof the errors. The errors that the precompiler misses will be caught by thedatalogger when the program is compiled. The download file (*.DLD) isstripped of comments to make it more compact. During the precompile step, aProgram Trace Information file (*.PTI), which provides an estimate of programexecution time, is also created (Section 8.1.1.1). For array-based dataloggersthe precompiler also creates a Final Storage Label file (*.FSL) to supply labelsfor final storage values to be used by other software applications.
Context-sensitive Help - Pressing the right mouse button with the cursor on aparameter will provide a pick-list of options or pop-up help for that parameter.More help is available by pressing <F1> at any time or the Help button invarious dialog boxes. Help, pick lists, and edit functions are also availablefrom the menus or toolbar.
Cut and Paste - Several datalogger programs can be opened simultaneously,and instructions can be copied from one program into another. This simplifieswriting different programs for the same sensor set, or similar programs fordifferent sites. Edlog will also allow you to save sections of code as "LibraryFiles" which can then be imported into other programs.
Be careful when copying instructions from a program written forone datalogger to a program for a different type of datalogger.Instructions may differ between dataloggers.
Input Location Labels - Though the datalogger uses a number to address inputlocations, Edlog allows you to assign labels to these locations for ease of usewhen programming and later when reviewing the data on-line. Edlog hasseveral features which aid in the management of these labels. A new Input
NOTE

Section 8. Datalogger Program Creation with Edlog
8-2
Location label is automatically assigned the next available Input Locationnumber (address). That Input Location can be picked from a list when neededlater in the program for further calculations or output. The Input LocationEditor (Section 12.3.3) allows the Input Locations to be edited (moved,inserted, or deleted); the Input Location numbers are then automaticallyupdated wherever the labels appear in the program. When a section of code ispasted into a program, Edlog will automatically use existing locations formatching labels and assign new locations to new labels. All location numbers inthe pasted code are updated accordingly.
Final Storage Label Editor – New to this version of Edlog is the ability to viewand edit the labels for the data values in final storage records. The labels arestored in the Final Storage Label file for array dataloggers or as part of thedatalogger program for table-based dataloggers.
Expression Compiler - Mathematical calculations can be written algebraicallyusing Input Location labels as variables. When the program is compiled, Edlogwill convert the expressions to datalogger instructions.
For example, the following expression could be used to create a new inputlocation for temperature in degrees Fahrenheit from an existing input locationfor temperatures in degrees Celsius.
TempF=TempC*1.8+32
8.1.1 Creating a New Edlog ProgramTo create a new datalogger program, choose File | New from the Edlog menuand select the datalogger type from the dialog box. A template similar to theone shown below appears.
Select the datalogger you are using from the list and click OK. A blankprogram template will come up as shown below for a CR10X.

Section 8. Datalogger Program Creation with Edlog
8-3
The first line of text identifies the type of datalogger program to be written.This is followed by a comment line and the Program Table Headers andExecution Interval fields. The Program Table Headers and Execution Intervalfields are protected text that cannot be deleted or commented out. When thecursor is moved to the Execution Interval line, the field for the executioninterval is highlighted. A numeric value must be entered or the instructions inthe table will never be executed.
Instructions inserted under the Program Table 1 header will be run based on theexecution interval for that table. Likewise, instructions inserted under theProgram Table 2 header will be run based on the execution interval for ProgramTable 2. Program Table 3 is reserved for subroutines that are called by either ofthe other tables. Most users find they can write the entire program in ProgramTable 1, avoiding complications associated with synchronizing two tables.Program Table 2 is normally used only when portions of the program require adifferent execution interval (placed in Program Table 2).
Program tables in this section refer strictly to sections of thedatalogger program. Do not confuse these program sections withthe data tables created in table-based dataloggers using P84 tostore output data.
When the program is complete, select File | Save from the Edlog menu. Astandard file dialog box will appear in which to type a file name. Edlogsupports long file names for the datalogger programs. Use descriptive names tohelp document the program’s function. After saving the file, you will beprompted to compile the program. When a program is compiled the code willbe checked for errors. After compiling, the datalogger program can be sent tothe datalogger using the Connect screen (Section 6.4).
8.1.1.1 Program Structure
While Edlog is not a structured programming language there are some standardprogramming practices that will help you and others understand what thedatalogger program is intended to do.
NOTE

Section 8. Datalogger Program Creation with Edlog
8-4
Comments – Edlog provides the ability to add comments on any blank line andto the right of all instructions. Liberal use of descriptive comments makes theprogram clearer and will help you remember what you were doing when youcome back to it a year or two later. Especially useful are descriptions of whatsensors are connected and how they are wired to the datalogger.
Program Flow – It is easier to follow a program that is written in distinctsections, each of which handles a specific type of instruction. Therecommended sequence is:
− Measure Sensors – In this first section put all the instructions that get datafrom the sensors attached to the datalogger. The sensor readings are storedin input locations, ready for the next section.
− Process Measurements – In this section do all the calculations and dataprocessing to prepare the data for output.
− Control – Do any control of external hardware or devices.
− Output Data – Check to see if it is time, or a condition exists, to triggeroutput data to be saved in final storage.
Descriptive Labels – Use input location and final storage labels that aremeaningful for the data they contain.
8.1.1.2 Edlog File Types
When a program is saved and compiled, the following files are created:
• *.CSI - The CSI file is what the user actually edits. When an Edlogprogram is saved, Edlog automatically adds a CSI extension to theprogram's name. Existing CSI files can be edited by selecting File | Open.Long file names are supported. Although CSI files are ASCII files theyrequire a particular format, so editing the files with some other text editorcan corrupt the Edlog programs so that they no longer compile.
• *.DLD - When Edlog compiles a program (*.CSI), a DLD file is created.This is the file that is downloaded to the datalogger, (and also the type offile that is retrieved from the datalogger). If an existing program file isedited and compiled, the old DLD file will be overwritten by the new file.A CSI file can be created from a DLD by choosing File | Document DLDFile.
• *.PTI - PTI files show the execution times for each instruction, block (e.g.,subroutine), and program table, as well as the estimated number of finalstorage locations used per day. The execution times are estimates. PTIfiles do not account for If commands, Else commands, or repetitions ofloops. For some instructions, the execution times are listed as 0. Thisoccurs when the execution time is unknown (e.g., P23 – BurstMeasurement).
• *.FSL – Final Storage Label files contain the final storage labels for thedata values in the output data records. The FSL file is used by LoggerNetto allow the Connect screen and RTDM to select final storage data for real-

Section 8. Datalogger Program Creation with Edlog
8-5
time displays. This file is also used by Split to show labels for data valuesin reports, and by View for column headings. FSL files are not created fortable-based dataloggers. Table-based datalogger program files contain thefinal storage labels.
There are a couple of other files that are used in Edlog, but are generated byother means than compiling the file:
• *.LBR - Library files (*.LBR) are parts of a program that can be retrievedand used in other Edlog programs. If a programmer often uses aninstruction set in his/her datalogger programs, this partial file can be savedto disk and inserted into a new program. For information about creating alibrary file, see the help on Creating a Library File.
Library files that are created for one type of datalogger shouldnot be used in a different type of datalogger (e.g., do not use anLBR file created for a CR10X-TD in a CR10X or CR510-TDprogram). Instructions differ among dataloggers, and bringing inan invalid instruction to a datalogger could result in errors.
• *.TXT - Printer output files created by Edlog are saved with a TXTextension. These files can be sent to a printer or viewed with a text editor.A TXT file is created by selecting File | Print to File.
8.1.1.3 Inserting Instructions into the Program
Instructions are entered into the program table in the order that they should beexecuted in the program. There are four ways to insert an instruction:
• Select File | Insert Instruction from the Edlog menu.
• Press Shift+Insert on the keyboard.
• Right click on a blank line and select Insert Instruction from the menu.
• Type the instruction number onto a blank line and press enter.
The first three options will invoke the Insert Instruction dialog box.
NOTE

Section 8. Datalogger Program Creation with Edlog
8-6
To insert an instruction into the program, select and then choose OK, or doubleclick the entry in the list. If you need more information on an instruction, selectthe instruction and click on the Help button.
Note that to the right of each instruction name is a code for the instruction type:I/O for input/output, Process for instructions that calculate new values, Outputfor instructions that write to final storage, or Control for instructions that affectprogram flow.
8.1.1.4 Entering Parameters for the Instructions
When an instruction is inserted, the cursor moves to the first parameter. Typethe parameter's value and press <enter> to move to the next parameter. Thereare two ways to get help on a parameter:
• Select the parameter with your mouse and press the right button. Thisbrings up a dialog box from which to select a value or a pop up descriptionof what should be entered.
• With your cursor anywhere within the instruction, press <F1>. This opensthe help system to a detailed description of the instruction and parameters.
Edlog provides hints for each parameter at the very bottom of the Edlog screen.These hints often display the valid entries for a field.
Many instructions are datalogger specific; refer to the specificdatalogger manual for details on a particular instruction.
Data Entry Warnings
Edlog has a Data Entry Warning function that is accessed from the Options |Editor menu item. By default, the Data Entry Warning is enabled. When theData Entry Warning is active, a warning is displayed immediately after an
NOTE
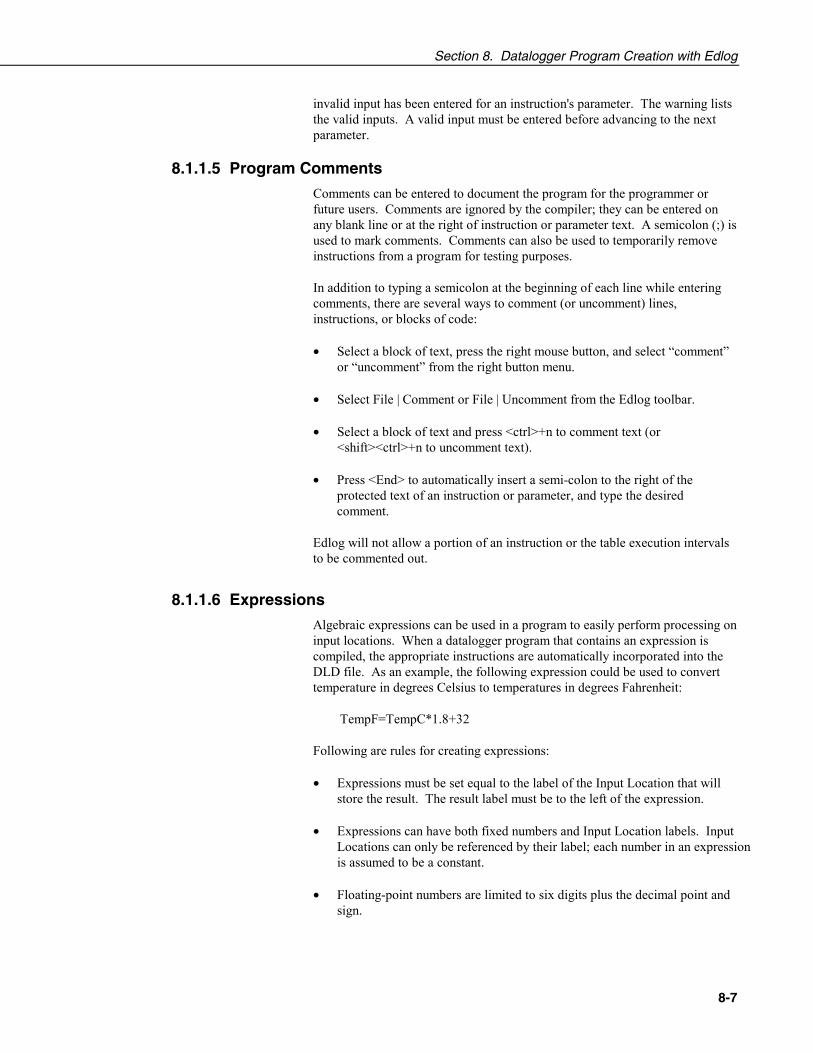
Section 8. Datalogger Program Creation with Edlog
8-7
invalid input has been entered for an instruction's parameter. The warning liststhe valid inputs. A valid input must be entered before advancing to the nextparameter.
8.1.1.5 Program Comments
Comments can be entered to document the program for the programmer orfuture users. Comments are ignored by the compiler; they can be entered onany blank line or at the right of instruction or parameter text. A semicolon (;) isused to mark comments. Comments can also be used to temporarily removeinstructions from a program for testing purposes.
In addition to typing a semicolon at the beginning of each line while enteringcomments, there are several ways to comment (or uncomment) lines,instructions, or blocks of code:
• Select a block of text, press the right mouse button, and select “comment”or “uncomment” from the right button menu.
• Select File | Comment or File | Uncomment from the Edlog toolbar.
• Select a block of text and press <ctrl>+n to comment text (or<shift><ctrl>+n to uncomment text).
• Press <End> to automatically insert a semi-colon to the right of theprotected text of an instruction or parameter, and type the desiredcomment.
Edlog will not allow a portion of an instruction or the table execution intervalsto be commented out.
8.1.1.6 Expressions
Algebraic expressions can be used in a program to easily perform processing oninput locations. When a datalogger program that contains an expression iscompiled, the appropriate instructions are automatically incorporated into theDLD file. As an example, the following expression could be used to converttemperature in degrees Celsius to temperatures in degrees Fahrenheit:
TempF=TempC*1.8+32
Following are rules for creating expressions:
• Expressions must be set equal to the label of the Input Location that willstore the result. The result label must be to the left of the expression.
• Expressions can have both fixed numbers and Input Location labels. InputLocations can only be referenced by their label; each number in an expressionis assumed to be a constant.
• Floating-point numbers are limited to six digits plus the decimal point andsign.

Section 8. Datalogger Program Creation with Edlog
8-8
• The operator(s) and/or function(s) used in the expression are limited tothose in the Operator and Function list (Table 8.2-1 below).
• Numbers and labels that appear immediately after a function must beenclosed in parentheses.
• Several operators and/or functions can be used in one expression.Operations and functions that are enclosed in parentheses are calculatedfirst; the inner most parentheses are evaluated first.
• To continue an expression to the next line, end the first line with anunderscore ( _ ).
TABLE 8.1-1. Operators and FunctionsOperators* Multiply/ Divide+ add- subtract^ Raise to the power of; enclose negative values in parentheses@ modulo divideE scientific notation; 6e-1=0.6FunctionsCOS cosine; angle in degreesSIN sine; angle in degreesTAN Tangent; angle in degreesCOTAN cotangent; angle in degreesARCTAN arctangent; angle in degreesARCSIN arcsine; angle in degreesARCCOS arccosine; angle in degreesARCCOT arccotangent; angle in degreesSQRT square rootLN natural logarithmEXP exponent of e; EXP(2) = e2
RCP reciprocal; RCP(4) = 1/4 = 0.25ABS absolute valueFRAC takes the fraction portion; FRAC(2.78)=.78INT takes the integer portion; INT(2.78)=2
Below are examples of valid expressions:
Zee = Vee+Exes = tee^(-2)Root = SQRT(ABS(data))avg = (data1+data2+data3+data4+data5)/5length = SQRT((adj^2)+(opp^2))TempF = (TempC*1.8)+32

Section 8. Datalogger Program Creation with Edlog
8-9
The following section of an Edlog program uses an expression to converttemperature from Celsius to Fahrenheit:
Execution Interval = 10 sec
;this instruction reads the temperature probe;the output is in degrees C
1: Temperature (107) (P11)01: 1 REPS02: 2 Channel03: 1 Excitation Channel04: 2 Loc [TempC]05: 1 Mult06: 0 Offset
;the following expression converts TempC to;a temperature in degrees Fahrenheit
TempF = (TempC*1.8)+32
When this program is compiled, the DLD file contains the followinginstructions. The last 5 instructions calculate the expression.
1: Temperature, 107 (P11)01: 102: 203: 104: 205: 1.006: 0.0
2: Z=X (P31)01: 202: 5
3: Z=F (P30)01: 1.802: 003: 3
4: Z=X*Y (P36)01: 302: 503: 5
5: Z=F (P30)01: 3202: 003: 3
6: Z=X+Y (P33)01: 302: 503: 6

Section 8. Datalogger Program Creation with Edlog
8-10
Errors That Can Occur With Expressions
The following error codes and messages may occur when using expressions.
Code Error Message
100 Missing left parenthesis101 Missing right parenthesis102 Variable name expected103 Number expected104 Floating point numbers limited to 5 digits107 Function expected110 New line expected111 Equal sign expected
Variable Name Expected
This message occurs when the expression is not set equal to an Input Locationlabel. The label must be to the left of the expression and not enclosed inparentheses. An expression that contains no equal sign causes compiler error202, “unrecognized text”.
For Example:
“Variable name expected” is displayed when a program contains any of theseexpressions:
5=el*(Vee+en)(lambda) = COS(theta)
10-(zee/2)=beeThese are correct ways of entering the above expressions:
five=el*(Vee+en)lambda = COS(theta)
bee=10-(zee/2)Number Expected
Indicates one of the following situations:
(1) An expression with a /, *, or ^ operator is missing a number or label beforeand/or after the operator.
(2) An expression with a + or - operator does not have a number or label afterthe operator.
(3) An expression with an @ operator does not have a number after the @;only a fixed number is allowed immediately after the @ operator.
(4) An expression with an @ operator does not have either a number or labelbefore the @.
(5) There is nothing between a pair of parentheses (e.g., the expressioncontains this "()").

Section 8. Datalogger Program Creation with Edlog
8-11
(6) A number is immediately followed by a label or function without anoperator (e.g., an expression containing “8label” gets this error message).
Floating Point Numbers Limited to 5 Digits
All fixed numbers are limited to five digits not including negative signs anddecimal points.
Function Expected
Letters that are immediately followed by parentheses are assumed to be afunction. If the letters are not on the function list (see section 2.3.3.2), thiserror message occurs.
New Line Expected
Indicates one of the following situations:
(1) An expression contains more than one equal sign.
(2) There is no operator between two sets of parentheses.
For Example:
This error message is displayed when a program contains any of theseexpressions:
zee=(label1)(label2)ex=(5)(ARCTAN(data))
eee=(em)(see^2)These are correct ways of entering the above expressions:
zee=(label1)*(label2)ex=(5)*(ARCTAN(data))
eee=(em)*(see^2)(3) There is no operator between a set of parentheses and a number.
For Example:
This error message is displayed when a program contains any of theseexpressions:
tee=5(2)mu=(nu)103
bee=10.52(ef/2)sigma=-17(RCP(alpha))
These are correct ways of entering the above expressions:
tee=5*(2)mu=(nu)*103
bee=10.52*(ef/2)sigma=-17*(RCP(alpha))
(4) A label or function is immediately after a set of parentheses without anoperator.

Section 8. Datalogger Program Creation with Edlog
8-12
For Example:
This error message is displayed when a program contains any of theseexpressions:
result=(ex^2)datagamma=(10-omega)SIN(psi)
dee=(17)numberThese are correct ways of entering the above expressions:
result=(ex^2)*datagamma=(10-omega)*SIN(psi)
dee=(17)*numberEqual Sign Expected
An equal sign MUST immediately follow the label of the Input Location thatstores the results (e.g., label = expression). An expression that contains noequal sign causes compiler error 202, “unrecognized text”.
For Example:
“Equal sign expected” is displayed when a program contains any of theseexpressions:
zee/2=beedata+number=volt1+volt2
These are correct ways of entering the above expressions:
bee=zee/2data=volt1+volt2-number
8.1.2 Editing an Existing Program
To edit an existing file, load it into Edlog by choosing File | Open from theEdlog menu. Changes can be made as desired and then the file can be savedand compiled under the same (File | Save) or a new name (File | Save As).Table 8.2-2 provides a list of keystrokes that can be used in editing programsand moving around in Edlog.

Section 8. Datalogger Program Creation with Edlog
8-13
TABLE 8.1-2. Editor KeystrokesPgUp Page UpPgDn Page DownUp Arrow Move Up One LineDown Arrow Move Down One LineRight Arrow Move One Character RightLeft Arrow Move One Character Left<Ctrl> Home Move Cursor to Beginning of File<Ctrl> End Move Cursor to End of File<Ctrl> PgUp Move Cursor to Top of Screen<Ctrl> PgDn Move Cursor to Bottom of Screen<Enter> Move to Next Field or Create New Line<Shift> Ins Select an Instruction from a Dialog Box<Ctrl> Right Arrow Move Instruction 1 Tab Right (Cursor on Parameter)<Ctrl> Left Arrow Move Instruction 1 Tab left (Cursor on Parameter) or
Move from Input Location label to Input Locationnumber.
<Ctrl> n Comment out a Line or Instruction<Shift> <ctrl> n Uncomment a Line or Instruction<End> Move to end of line, Add a comment if on an Instruction<Ctrl>C Copy selected text<Ctrl> X Cut selected text<Ctrl>V Paste clipboardDel Delete character to right or selected text<Shift> Del Delete the Instruction or Line Under the Cursor<Esc> Close Dialog Box
8.1.2.1 Editing Comments, Instructions, and Expressions
To edit Comments, Expressions, and Instruction parameters, move the cursor tothe appropriate text and retype it. To delete an instruction when the cursor issomewhere within the instruction, select Edit | Delete Instruction or press<Shift> Del. An instruction or block of instructions can also be selected anddeleted with the delete key. The entire instruction must be selected or an errormessage will be returned.
8.1.2.2 Cut, Copy, Paste, and Clipboard Options
Edit | Cut, Edit | Copy, and Edit | Paste allow sections of the program to bemoved or copied to another area of the program or between programs. Edit |Show Clipboard shows the contents of the clipboard.
You cannot move, copy, delete or comment out protected text(Tables, Execution Intervals) or partial instructions. To move,copy or delete an Instruction, the entire instruction, including allof the parameters, must be selected.
Cutting and pasting between datalogger programs should only be betweenprograms for the same datalogger type. Instructions and parameters may differbetween dataloggers. The compiler will catch many of these errors; however,this may be at the expense of much time and confusion.
NOTE

Section 8. Datalogger Program Creation with Edlog
8-14
8.1.3 Library FilesLibrary files can be created to store portions of programs, which can then beinserted into a different program. Library files are useful if you want to writedifferent programs for the same sensor set, or it you have several stations thathave similar, but not identical, sensor sets.
To create a library file, select the text to be stored and then select Edit | SaveTo Library File. When the window appears, type in the library file name. Toinsert a library file in a program, move the cursor to the desired insertion pointand select Edit | Insert Library File.
Library files created for one type of datalogger type should notbe used in programs for a different datalogger type; i.e., a file fora CR10X-TD should not be used in a program for a CR10X or aCR510-TD. Instructions differ among dataloggers, and bringingin an invalid instruction to a datalogger could result in errors.
8.1.4 Documenting a DLD FileAs noted in Section 8.1.1.2, the CSI file is the file created by Edlog that is usedto generate the DLD code and other files. If for some reason your CSI file ismissing, you can import the DLD file into Edlog to create another editable CSIfile. From the Edlog menu select File | Document DLD. Select the DLD file tobe imported and remember to save the file to create a new CSI file.
Programs created with the DOS versions of Edlog earlier than 6.0 were storedwith the instruction description and comments in a *.DOC file instead of a*.CSI file. These programs can be imported into current versions of Edlog byusing this Document DLD feature, though any comments will be lost.
8.1.5 Display Options
8.1.5.1 Graphical Toolbar
A graphical toolbar provides buttons for some of the more frequently usedmenu items in Edlog. The toolbar is made visible by choosing Options | ShowToolbar from the Edlog menu. Conversely, it is removed from the screen bychoosing Options | Hide Toolbar.
NOTE
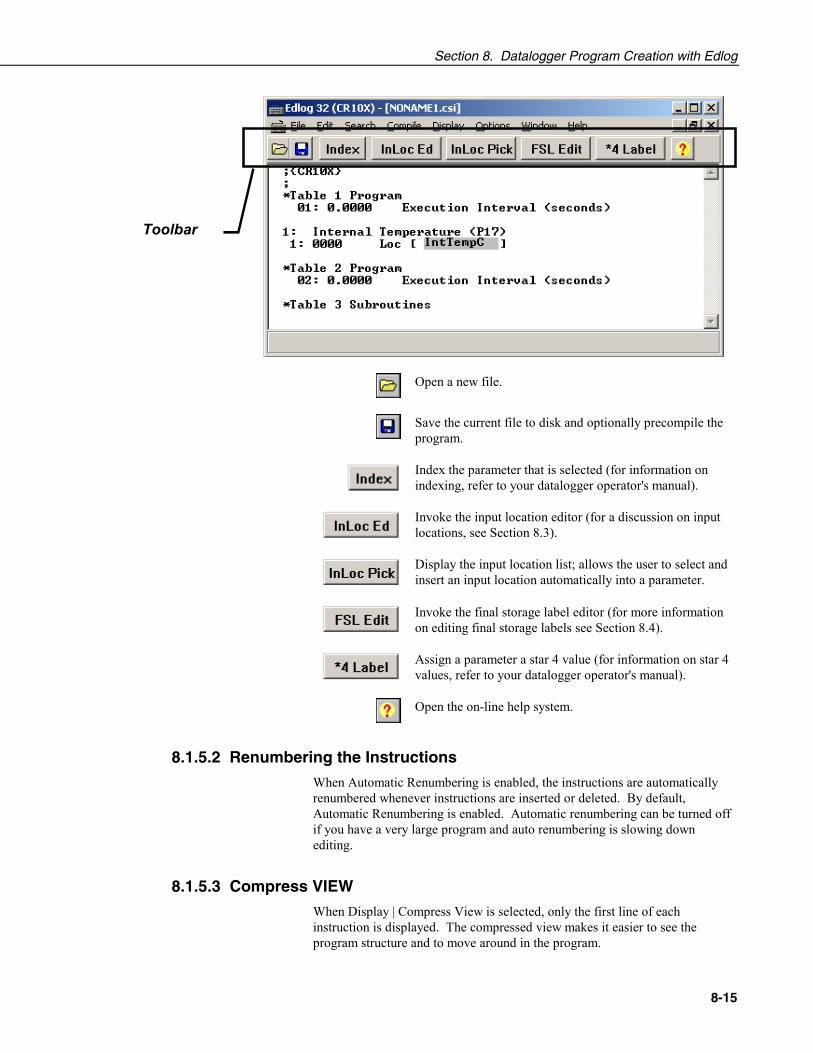
Section 8. Datalogger Program Creation with Edlog
8-15
Toolbar
Open a new file.
Save the current file to disk and optionally precompile theprogram.
Index the parameter that is selected (for information onindexing, refer to your datalogger operator's manual).
Invoke the input location editor (for a discussion on inputlocations, see Section 8.3).
Display the input location list; allows the user to select andinsert an input location automatically into a parameter.
Invoke the final storage label editor (for more informationon editing final storage labels see Section 8.4).
Assign a parameter a star 4 value (for information on star 4values, refer to your datalogger operator's manual).
Open the on-line help system.
8.1.5.2 Renumbering the Instructions
When Automatic Renumbering is enabled, the instructions are automaticallyrenumbered whenever instructions are inserted or deleted. By default,Automatic Renumbering is enabled. Automatic renumbering can be turned offif you have a very large program and auto renumbering is slowing downediting.
8.1.5.3 Compress VIEW
When Display | Compress View is selected, only the first line of eachinstruction is displayed. The compressed view makes it easier to see theprogram structure and to move around in the program.

Section 8. Datalogger Program Creation with Edlog
8-16
Instructions cannot be edited in the compress view mode. Use Display |Uncompress to switch back to the full view or use the <F7> function key totoggle between the compressed and full views.
8.1.5.4 Indention
Indention is typically used with If Then/Else sequences and loops to provide avisual key to program flow. Indention is a visual aid; it has no meaning to thedatalogger. If the programmer chooses to use indention, it can be doneautomatically or manually.
The settings for indention are found under Options | Editor. Turn on AutomaticIndention by checking the box next to it. The distance for each indention (inspaces) is set on the same dialog box. To manually indent an instruction, placethe cursor on one of the instruction’s parameters and press either <Ctrl>+rightarrow or <Ctrl>+left arrow; the instruction is indented the direction the arrow ispointing.
The Display | Rebuild Indention menu item resets all existing indentions andrebuilds automatic indentions. Automatic indentions may need to be rebuiltwhen editing instructions causes the indentions to misalign.
8.2 Input LocationsAn input location is the space in datalogger memory where the most recentvalue is stored for each sensor. Each time a sensor is scanned, the inputlocation is overwritten with a new value. Input locations are referenced in thedatalogger by number.
In an Edlog program, each Input Location has an Input Location number and alabel that appear whenever the Input Location is referenced in the program.Edlog automatically assigns Input Location numbers as labels are entered.
8.2.1 Entering Input LocationsWhen a parameter requires an Input Location, the cursor automaticallyadvances to where the label is keyed in. When a new label is entered, the nextavailable Input Location number is automatically assigned to that label. Toselect an existing label from a list, press the right mouse button or <F6>.
You may prefer to enter all input locations into the Edlog program beforewriting the program. This makes all the labels available from the input locationpick list, and can help reduce programming errors because of typos. Seesection 8.2.3.
Labels can have up to 9 characters for array-based dataloggers and 14characters for table-based dataloggers. The first character must be a letter. Theallowed characters are letters, numbers, and the underscore character ( _ ). Thefollowing labels are reserved for expressions and should not be entered by theuser: CSI_R, CSI_2, CSI_3,... CSI_95.
To enter the Input Location number instead of the label, use the mouse or press<ctrl> left arrow.

Section 8. Datalogger Program Creation with Edlog
8-17
8.2.2 RepetitionsMany input/output and output processing instructions have a repetitionsparameter. Repetitions (REPS) allow one programming instruction to measureseveral identical sensors or to process data from several Input Locations. WhenREPS are greater than 1, the Input Locations are assigned consecutive numbers(e.g., with REPS of 2 and LOC of 5, the Input Locations are 5 and 6). Each replabel is the initial label with a “_” and the next consecutive number (i.e., with 3REPS and a label of “data” the labels for each REP are: data_1, data_2, anddata_3).
Only the first location of an output processing instruction is linked to the label.Reps of input/output instructions and output processing instructions are notlinked, so use care if altering their sequence in the Input Locations Editor.
As an example, in the following section of an Edlog program, the TempC andBatteryV Input Locations are sampled with one sample (P70) instruction, withthe REPS parameter of 2.
10: Temperature (107) (P11)01: 1 REPS02: 2 Channel03: 1 Excitation Channel04: 1 Loc [TempC]05: 1 Mult06: 0 Offset
11: Battery, Volt (P10)01: 2 Loc [BatteryV]
12: If time is (P92)01: 0 minutes into interval02: 60 minute interval03: 10 Set high Flag 0(output)
13: Sample (P70)01: 2 Reps02: 1 Loc [TempC]
When the program is executed, the datalogger will perform the same instructiontwice. The first time, it will sample the value stored in the TempC location.The second time, it will sample the value stored in the battery location.
If an Input Location is inserted between the TempC and BatteryVlocation, the inserted location will be sampled instead ofBatteryV.
8.2.3 Input Location EditorInput Location labels can be entered and edited by using the Input LocationEditor. To access the Input Location Editor, select Edit | Input Labels.
NOTE

Section 8. Datalogger Program Creation with Edlog
8-18
Editing functions are available from the Input Location Editor’s Edit menu anda hot key:
Insert (<F2>) - Inserts blank Input Locations. This is used to provide space fornew input labels between existing labels. This automatically changes the InputLocation numbers for all of the labels that are after the inserted location.
Delete (<F3>) - Deletes the Input Location label, flags, number of reads andwrites, and block information for a designated location number. Wherever thedatalogger program references a deleted location label, the Input Location'snumber automatically becomes 0.
Move (<F4>) - Moves the Input Location to a different number. This maychange several Input Location numbers.
Toggle Manual (<F5>) - Allows the programmer to manually toggle a locationas “in use”. This is used for burst mode, indexed loops, or other situationswhere it's not clear to Edlog that the locations are being written to. InputLocations not marked as read, write, or manual are deleted by the optimizecommand.

Section 8. Datalogger Program Creation with Edlog
8-19
Optimize (<F6>) - Deletes Input Locations that aren't read, written to, ormarked as Manual. Optimize tries to reduce the total number of locations usedby moving Input Location labels to fill in unused locations. This might changeseveral Input Location numbers. Any changes in location number made by theoptimize command are reflected in the Edlog program.
Insert Block (<F7>) - Inserts and labels a block of Input Locations and marksthem as “Manual”. The locations are labeled in the same manner as reps.
Esc - The escape key closes the Input Location Editor and updates the labelassignments in the program.
8.2.4 Input Location AnomaliesIn most instances, Edlog will automatically assign Input Locations for locationswhich are generated by the datalogger program. An example of this is Edlog’shandling of Input Locations for the REPS parameter. Though only one InputLocation is specified, if REPS is greater than 1, additional Input Locations arecreated by Edlog.
There are certain instructions that generate multiple Input Locations for whichEdlog does not automatically allocate Input Locations. The user shouldmanually allocate these locations in the Input Location Editor. These are:
• Instruction 15, Serial I/O with Control Port
• Instruction 23, Burst Measurement
• Instruction 49, Spatial Maximum
• Instruction 50, Spatial Minimum
• Instruction 54, Block Move
• Instruction 75, Histogram
• Instruction 80, Store Area
• Instruction 81, Rainflow Histogram
• Instruction 100, TDR Measurement
• Instruction 101, SDM-INT8
• Instruction 105, SDI-12 Recorder
• Instruction 106, SDI-12 Sensor
• Instruction 113, SDM-SIO4
• Instruction 118, SDM CAN
• Instruction 119, TDR100
• Instruction 120, Data Transfer to TGT
• Instruction 127, HDR Goes Status and Diagnostics
• Instruction 128, SHEF Data Transfer to TGT
• Instruction 189,

Section 8. Datalogger Program Creation with Edlog
8-20
• Instructions P190-199 PakBus control
• Indexed input locations in a loop
See Edlog Help for each instruction to get a detailed description of inputlocation usage. You can also refer to the datalogger user’s manual for moreinformation on these instructions.
When these instructions are used in a program, the Toggle Manual feature canbe used to manually mark Input Locations for use by the program.
8.3 Final Storage LabelsWhen output processing instructions are added to the datalogger program,Edlog creates final storage labels for the each of the values that will be stored.The default labels are normally the input location label with a suffix indicatingthe type of output process instruction that created it. In the example belowBattVolt_AVG is the average battery voltage that is stored as part of array 112.
For array-based dataloggers the final storage labels are stored in an *.FSL filewhen the program is compiled. For table-based dataloggers the final storagelabels are included as part of the datalogger program in the *.DLD file.LoggerNet gets the final storage labels as part of the table definitions from thedatalogger. Split, Graph and Numeric Display as well as RTDM, and View usethe final storage labels.
The user can create a custom label to reflect the meaning of the value that isbeing stored. Click on the FSL Edit button on the toolbar or press F9 to bringup the Final Storage Label Editor as shown below.
In this example from an array-based datalogger, the final storage output data forArray ID 112 is shown. Each of the columns indicate the essentialcharacteristics of the data value being stored.
− Array ID or Table Name identifies the set of output data instructions thedata is associated with. For array-based dataloggers the array ID is at the

Section 8. Datalogger Program Creation with Edlog
8-21
beginning of each output record. In table-based dataloggers, the tablename shows the name of the table where the data values will be stored.
− Output Instruction lists the output instruction that was used to output thedata value.
− Line Number is the line number in the Edlog program for the outputinstruction.
− Final Storage Label is the label that is associated with this final storagevalue. Red labels are associated with automatically created data entriessuch as time stamps and record numbers. The red labels cannot bechanged with the Final Storage Label Editor. The green labels areassociated with user programmed sensor data. To change the label, click inthe box and type in the new label.
− Resolution shows whether the data will be stored in low or high resolution.(High resolution stores data as a 4-byte floating point number, Lowresolution uses a 2-byte number)
− Inloc Name is the label of the input location that the final storage data isbased on.
− Inloc Address is the numeric label for the input location used for the finalstorage data value.
If changes are made to measurement or output instructions aftercustom final storage labels have been created, you should reviewthe custom final storage labels to make sure the correct labels arestill assigned to the desired output values. Some program changesinvolving an increase or decrease in input locations or outputvalues could cause a label to no longer correspond with the valuebeing output.
The final storage labels created by Edlog can be restored by selecting the menuitem Edit | Restore Default Labels.
NOTE

Section 8. Datalogger Program Creation with Edlog
8-22
This is a blank page.

9-1
Section 9. Datalogger ProgramCreation with CRBasic EditorThis section provides information on the CRBasic Editor used to program the CampbellScientific CR5000 and CR9000 dataloggers. CRBasic is a full featured programminglanguage providing the power and flexibility to set up complex datalogger programs tosupport demanding measurement tasks.
(Datalogger programs can also be created using the PC9000 program generator softwarethat is included with the CR5000 and CR9000. The program generator is not included aspart of LoggerNet and will not be covered in this manual.)
See Section 8 for information about the program editor for other Campbell Scientificdataloggers, Edlog.
9.1 OverviewThe CRBasic Editor is a programming tool for the CR5000 and CR9000dataloggers. It is intended for use by experienced datalogger programmers whoneed more flexibility and control over the datalogger operation. Thisprogramming language is similar in syntax, program flow, and logic to theStructured BASIC programming language.
As shown below, the CRBasic Editor's main window is divided into three parts:the program entry window, the Instruction Panel, and the message area. TheInstruction Panel on the right side is a list that comprises the instructions for aparticular datalogger in the CRBasic language. Instructions can be selectedfrom this list or entered directly into the program entry window on the left. Themessage area at the bottom shows results of the compile and any errorsdetected.
The CRBasic Editor has been designed with several features to help makecreating and editing programs easier.

Section 9. Datalogger Program Creation with CRBasic Editor
9-2
9.1.1 Inserting InstructionsAn instruction can be easily inserted into the program by highlighting it in theInstruction Panel list and pressing the Insert button or by double clicking theinstruction name. If an instruction has one or more parameters, a parameterdialog box will be displayed. Complete the information in the parameter fieldsand press Insert to paste the instruction into the program.
You can filter the list of instructions available in the Instruction Panel byclicking the drop down arrow to the right of the text box above the list. Thiswill allow you to display only instructions of a specific type such asMeasurement/Control or Declarations. This provides a smaller list to selectfrom and makes it easier to find the instruction you want. Switch back to All tosee all of the instructions available. You can create custom instruction filterlists as described in Section 9.1.7.
Where the instruction is inserted depends upon the settings in the InstructionPanel Options box (accessed via Options | Instruction Panel Preferences). If AtCursor is selected, the instruction will be inserted directly at the cursor location.Care should be taken when using this option, so that new instructions are notinserted in the middle of existing ones. If Whole Line is selected, theinstruction will be placed on the line where the cursor is located and theexisting line will be moved down to the next line.

Section 9. Datalogger Program Creation with CRBasic Editor
9-3
Be careful using the At Cursor option since it is possible to insertthe new instruction in the middle of an existing instruction.
If the On Inserting, Edit Parameters check box is cleared, the Parameter dialogbox will not be displayed when an instruction is inserted.
9.1.2 Parameter Dialog BoxThe Parameter dialog box will appear when an instruction is added that has oneor more parameters or when the cursor is placed on an existing instruction andthe right mouse button is pressed. This dialog box contains a field for each ofthe parameters in the instruction. Edit these fields as necessary and then pressthe Insert button to paste the instruction into the program.
Below is an example of the Parameter dialog box for the differential voltageinstruction (VoltDiff).
Short Cuts for Editing the Parameters
Right clicking or pressing F2 on a parameter that uses a Variable as an inputtype will invoke a list of variables that have been defined in the program. Asample list is shown below.
The variable list is sorted by variable type and then alphabetically by name. Inthe list below, the first green A denotes that the variable AIRCOOL is set up asan Alias.
Constants are listed with a blue C, Dimensioned variables are listed with a redD, and Public variables are listed with a black P.
NOTE

Section 9. Datalogger Program Creation with CRBasic Editor
9-4
At any time you can press F10 to bring up the list of variables, regardless of theinput type for the selected parameter. Also, defined variables can be selectedfrom the Variables drop-down list box at the upper right of the Parameterdialog box.
Right clicking or pressing F2 on a parameter that has a finite number of validentries will bring up a list of those available options.
Right clicking or pressing F2 on a parameter that does not fall within the twocategories above will bring up help for that parameter.
Pressing F1 with any parameter selected will bring up help for that parameteralong with a list of possible options where appropriate.
Changing Default Parameters Values for an Instruction
Each instruction offers default values for each parameter. For instance, in theParameter box above, the default for the Range is mV5000. If you wanted toedit this so that each time you inserted the VoltDiff instruction the Range valuedefaulted to mV1000, you would highlight the instruction in the InstructionPanel, select Instruction | Edit Instruction Defaults from the menu, and makethe change in the resulting dialog box.
9.1.3 Right Click FunctionalityThe result of a right click action varies, depending upon your cursor location.
Right click on an instruction name to show the Parameter dialog box to edit theinstruction parameters.
Right click on a parameter that uses a Variable as an input type to bring up alist of variables that have been defined in the program as described in theprevious section.
Right click on a parameter that has a finite number of valid entries to bring up alist of those available options. You can change the option by clicking on thedesired option.
Right click on another type of parameter to bring up help for that parameter.
Right click on a block of text that is highlighted to bring up a short cut menuwith the following options:

Section 9. Datalogger Program Creation with CRBasic Editor
9-5
− Comment/Uncomment Block: Only one of these options will beavailable, depending upon the status of the highlighted text. If the text hasbeen marked as a Comment, you can choose to uncomment it. If the text isnot commented, you can chose to make it into a comment. Commentedtext has a single quote ( ' ) at the beginning of the line. Comments areignored by the datalogger's compiler.
− Decrease/Increase Indent: You can increase or decrease the indention ofthe selected text. The spacing is increased or decreased by one.
− Cut/Copy/Paste/Delete: Standard editing functions can be accessedthrough this menu.
9.1.4 ToolbarThe toolbar of the CRBasic Editor provides easy access to frequently usedoperations.
New – Creates a new program window to start writing a newprogram. If you have defined a default template, the new programwill start with the defined template instructions.
Open – Brings up a File Open dialog to select a program file to open.File extension filters are provided to list only files of a certain typesuch as .cr5 files for CR5000 programs. Data files (*.dat) can also beopened.
Save – Saves any changes to the currently opened program. If this anew program and has not been saved yet, a Save As dialog willprompt you for the file name and location to save the file.
Save and Download – Saves any changes to the currently openedprogram and opens PC9000 to send the file to the datalogger. If theCRBasic editor can’t find PC9000 you will be prompted to browsefor it.
Print – Prints the program listing of the currently open program to theprinter.
Print Preview – Opens a Print Preview screen that will show what theprogram will look like when printed. You can check and set themargins and printer options.
Undo – Each time the Undo button is clicked it will step back throughthe last changes made to the program.
Redo – Cancels the undo and steps forward restoring the changes.
Cut – Removes the selected part of the program and puts it on the

Section 9. Datalogger Program Creation with CRBasic Editor
9-6
clipboard to be pasted elsewhere.
Copy – Places a copy of the selected part of the program on theclipboard to be pasted elsewhere.
Paste – Inserts a copy of the contents of the clipboard into theprogram at the cursor location.
Find – Brings up a Find dialog to specify a text string to search for inthe program listing. Click on the Find Next button or press F3 to goto successive occurrences of the text.
Replace – Brings up a Find and Replace dialog that allows you tospecify a text string to search for and a text string to replace it with.You can replace all occurrences of the text or check them one at atime to make sure they should be replaced.
Find Next – Finds the next occurrence of the text string specified inthe Find dialog.
Compile – Starts the compiler to check the current program for errorsand consistency. Compile results and errors will be displayed in themessage area at the bottom of the screen.
Previous Error – Moves the cursor to the part of the program wherethe previous error was identified.
Next Error – Moves the cursor to the part of the program where thenext error was identified.
Instruction Panel – Controls whether the Instruction Panel isdisplayed. Hiding the Instruction Panel can allow more room in thewindow to view the program listing.
9.1.5 CompileCompile is a function provided by the CRBasic Editor to help the programmercatch problems with the datalogger program. Compile is available from thetoolbar and the Compile menu.
When the Compile function is invoked, the CRBasic Editor checks the programfor syntax errors and other inconsistencies. The results of the check will bedisplayed in a message window at the bottom of the main window. If an errorcan be traced to a specific line in the program, the line number will be listedbefore the error. You can double click an error preceded by a line number andthat line will be highlighted in the program editing window. To move thehighlight to the next error in the program, press the Next Error button or chooseNext Error from the Compile menu. To move the highlight to the previouserror in the program, press the Previous Error button or choose Previous Errorfrom the Compile menu.
The error window can be closed by selecting the Close Message Window menuitem.

Section 9. Datalogger Program Creation with CRBasic Editor
9-7
This function only verifies the integrity of the program. Actualcompilation of the program takes place in the datalogger.
9.1.6 TemplatesThe use of templates can be a powerful way to quickly create a set of similardatalogger programs. All or part of a program can be saved so that it can beused when creating new programs. These files are called templates. TheTemplate menu provides access to create and use templates.
Save File as Template - Saves the comments and instructions in the active fileas a template. To save part of a program as a template, copy the selected partto a new program file and then Save File as Template.
Save as Default Template - Saves the comments and instructions in the activefile as a template that will be used each time File | New is selected for that typeof datalogger.
Save as Initial Template - Saves the comments and instructions in the activefile as a template that will be used each time the CRBasic Editor is started. IfDisplay Last Window Used option is selected, the initial template will not beused.
Delete - When selected, a list of all dataloggers is displayed. Select adatalogger to invoke a dialog box containing a list of saved templates. Atemplate can then be highlighted and deleted from disk.
(Datalogger Types) - When a datalogger type is selected, a list of all templatesis displayed.
Template files are associated with a specific datalogger type.Templates for a CR5000 cannot be used for CR9000programming and vice versa. Each datalogger has its own set ofinstructions that may be different than the other.
NOTE
NOTE
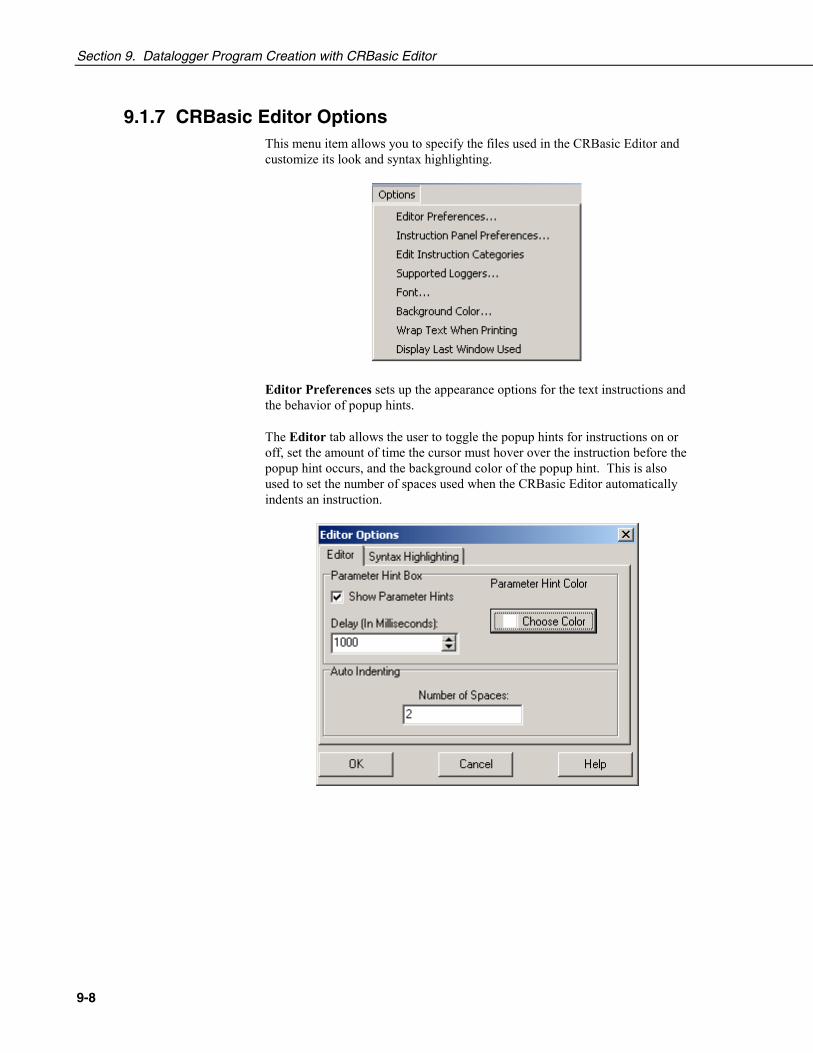
Section 9. Datalogger Program Creation with CRBasic Editor
9-8
9.1.7 CRBasic Editor OptionsThis menu item allows you to specify the files used in the CRBasic Editor andcustomize its look and syntax highlighting.
Editor Preferences sets up the appearance options for the text instructions andthe behavior of popup hints.
The Editor tab allows the user to toggle the popup hints for instructions on oroff, set the amount of time the cursor must hover over the instruction before thepopup hint occurs, and the background color of the popup hint. This is alsoused to set the number of spaces used when the CRBasic Editor automaticallyindents an instruction.

Section 9. Datalogger Program Creation with CRBasic Editor
9-9
The Syntax Highlighting tab sets up the appearance of different text elementsin the program using different font styles and colors. Comments, InstructionNames, and other text elements can each have a different appearance. You cancustomize the appearance of the text by giving normal text, keywords,comments, operators, and numbers each a different font style and color to makethe program easier to read and edit. Text colors and styles can be disabled byclearing the Syntax Highlighting check box.
Instruction Panel Preferences allows the user to define how the insertfunction will behave in the program.
− At Cursor/Whole Line: When At Cursor is selected, inserted instructionswill appear at the cursor location. When Whole Line is selected, a newline will be created for the instruction. (Note that the At Cursor optionmay cause you to unintentionally insert an instruction in the middle ofanother instruction.)
− On Inserting: When Edit Parameters is selected, the Edit Parametersdialog box will appear when an instruction is added to the program. Whenit is not selected, the instruction will be inserted directly, using the defaultparameters.

Section 9. Datalogger Program Creation with CRBasic Editor
9-10
Edit Instruction Categories allows the user to create custom categories.(Note: The default categories cannot be edited or deleted.)
In the Edit Categories dialog shown above, a new category MostUsed has beenadded. Clicking on the Edit Category button will bring up the SelectInstructions dialog that is shown below. This will allow the user to display afiltered instruction list containing only those instructions most often used. Theinstructions to be displayed are selected in the Select Instruction screen shownbelow. Select the check box next to the instructions you want in the usercategory from each list of instruction types. Press OK to save the list.

Section 9. Datalogger Program Creation with CRBasic Editor
9-11
Supported Loggers allows you to set up additional dataloggers to beprogrammed using the CRBasic Editor. In the dialog window shown below theeditor is set up for CR5000 and CR9000 dataloggers. When new dataloggersare added the language, help and compiler files can be linked to the CRBasiceditor in this window.
Font brings up a font selection dialog to select the font typeface and size forthe text in the CRBasic Editor. Font style and color are set under EditorPreferences.
Background Color brings up the color selection dialog to set the color of theCRBasic program window.

Section 9. Datalogger Program Creation with CRBasic Editor
9-12
Wrap Text When Printing - When this option is selected, long lines thatextend past the right margin will be wrapped to the next line. This optionaffects printing, as well as the Print Preview mode. A check mark will appearnext to the option in the menu when it is selected.
Display Last Window Used - When this option is enabled, the program thatwas active in the CRBasic Editor when it was last closed will be visible whenthe Editor is reopened. If this option is disabled, no program will be loadedwhen the Editor is opened. A check mark will appear next to the option in themenu when it is selected.
9.1.8 Available Help InformationPressing the Help button at the bottom right of the Parameter dialog box willbring up detailed help topic for the instruction being edited. Pressing F1 whenyour cursor is within a parameter field will bring up help only on thatparameter. Some fields also have text in the Comments column, whichprovides a short description of the option that has been selected for theparameter.
9.2 CRBasic ProgrammingCRBasic is a programming language that has some similarities to a structuredBASIC. There are special instructions for making measurements and forcreating tables of output data. The results of all measurements are assignedvariables (given names). Mathematical operations are written out much as theywould be algebraically. This section describes a program, its syntax, structure,and sequence.
9.2.1 Programming SequenceThe structure of a datalogger program requires that variables and subroutinesbe defined before they can be used. The best way to do this is to put all thevariable declarations and output table definitions at the beginning, followed bythe subroutines, and then the program. Below is the typical layout of aprogram. Note that the online help has example code for each instruction todemonstrate the use of the instruction in a program.

Section 9. Datalogger Program Creation with CRBasic Editor
9-13
Declarations Make a list of what to measure and calculate.
Declare constants Within this list, include the fixed constants used,
Declare Public variables Indicate the values that the user is able to viewwhile the program is running,
Dimension variables the number of each measurement that will bemade,
Define Aliases and specific names for any of the measurements.
Define data tables Describe, in detail, tables of data that will besaved from the experiment.
Process/store trigger Set when the data should be stored. Are theystored when some condition is met? Are datastored on a fixed interval? Are they stored ona fixed interval only while some condition ismet?
Table size Set the size of the table in RAM.
Other on-line storagedevices
Should the data also be sent to the externalstorage?
Processing of Data What data are to be output (current value,average, maximum, minimum, etc.).
Define Subroutines If there is a process or series of calculationsthat needs to be repeated several times in theprogram, it can be packaged in a subroutineand called when needed rather than repeatingall the code each time.
Program The program section defines the action ofdatalogging.
Set scan interval The scan sets the interval for a series ofmeasurements.
Measurements Enter the measurements to make.
Processing Enter any additional processing with themeasurements.
Call Data Table(s) The Data Table must be called to process outputdata.
Initiate controls Check measurements and Initiate controls ifnecessary.
NextScan Loop back (and wait if necessary) for the nextscan.
End Program

Section 9. Datalogger Program Creation with CRBasic Editor
9-14
9.2.2 Program DeclarationsVariables must be declared before they can be used in the program. Variablesdeclared as Public can be monitored by LoggerNet using the Numeric Monitorscreen or the Graphical Display. Variables declared using Dim cannot bedisplayed. Variables assigned to a fixed value are used as constants.
For example, in a CRBasic program there may be more than one temperature(or other) measurements. Rather than have many different names, a variablearray with one name and many elements may be used. A thermocoupletemperature might be called TCTemp. With an array of 20 elements the namesof the individual temperatures are TCTemp(1), TCTemp(2), TCTemp(3), ...TCTemp(20). The array notation allows compact code to perform operationson all the variables. For example, to convert ten temperatures in a variablearray from C to F:
For I=1 to 10TCTemp(I)=TCTemp(I)*1.8+32
Next I
Aliases can also be created that will allow an element of an array or anotherdata result to be referred to by a different name.
9.2.3 Mathematical ExpressionsMathematical expressions can be entered algebraically into program code toperform processing on measurements, to be used for logical evaluation, or to beused in place of some parameters.
As an example of Measurement Processing, to convert a thermocouplemeasurement from degrees Celsius to degrees Fahrenheit, you could use thefollowing expression:
TCTempF=TCTemp(1)*1.8+32
Logical Evaluation expressions could be used to determine the flow of aprogram:
If TCTemp(1) > 100 Then
Call Subroutine1
Else
'enter code for main program
End If
Many parameters will allow the entry of expressions. In the following example,the DataTable will be triggered, and therefore data stored, if TCTemp(1)>100.
DataTable(TempTable, TCTemp(1)>100, 5000)

Section 9. Datalogger Program Creation with CRBasic Editor
9-15
9.2.4 Measurement and Output Processing InstructionsMeasurement instructions are procedures that set up the measurement hardwareto make a measurement and place the results in a variable or a variable array.Output processing instructions are procedures that store the results ofmeasurements or calculated values. Output processing includes averaging,saving maximum or minimum, standard deviation, FFT, etc.
The instructions for making measurements and outputting data are not found ina standard basic language. The instructions Campbell Scientific has created forthese operations are in the form of procedures. The procedure has a keywordname and a series of parameters that contain the information needed tocomplete the procedure. For example, the instruction for measuring thetemperature of the CR5000 input panel is:
PanelTemp (Dest, Integ)
PanelTemp is the keyword name of the instruction. The two parametersassociated with PanelTemp are: Destination, the name of the variable in whichto put the temperature; and Integration, the length of time to integrate themeasurement. To place the panel temperature in the variable RefTemp (using a250 microsecond measurement integration time) the code is:
PanelTemp(RefTemp, 250)
The use of these instructions should become clearer as we go through anintroductory example in Section 9.3.
9.2.5 Inserting Comments Into ProgramIt is often useful to provide comments in your datalogger program so that whenyou review the program at a later date, you will know what each section of codedoes. Comments can be inserted into the program by preceding the text with asingle quote. When the program is compiled, the datalogger compiler willignore any text that is preceded by a single quote. A comment can be placed atthe beginning of a line or it can be placed after program code. If SyntaxHighlighting is enabled (Options | Editor Preferences | Syntax Highlighting),commented text will appear formatted differently than other lines of code.
'CR5000
'The following program is used to measure'4 thermocouples
'VARIABLE DECLARATIONDim TCTemp(4) 'Dimension TC measurement variableAlias TCTemp(1)=EngineCoolantT 'Rename variablesAlias TCTemp(2)=BrakeFluidTAlias TCTemp(3)=ManifoldTAlias TCTemp(4)=CabinT

Section 9. Datalogger Program Creation with CRBasic Editor
9-16
In the sample code above, the commented text will be ignored by the dataloggercompiler.
9.3 Example ProgramThe following program will serve as a programming example in this section toillustrate the concepts and program structure.
Const RevDiff=1Const Del=0Const Integ=250Const Mult=1Const Offset=0
Public RefTempPublic TC(6)Units RefTemp=degCUnits TC=DegC
DataTable (Temp,1,2000) DataInterval (0,100,mSec,10) Average (1,RefTemp,FP2,0) Average (6,TC(),FP2,0)EndTable
BeginProg Scan (10,mSec,3,0) PanelTemp (RefTemp, 250) TCDiff (TC(),6,mV20C ,1,TypeT,RefTemp,RevDiff,Del,Integ,Mult,Offset) CallTable Temp NextScanEndProg
9.3.1 Data TablesData storage follows a fixed structure in the datalogger in order to optimize thetime and space required. Data are stored in tables such as:
TOA5 StnName TempTIMESTAMP RECORD RefTemp_Avg TC_Avg(1) TC_Avg(2) TC_Avg(3) TC_Avg(4) TC_Avg(5) TC_Avg(6)TS RN degC DegC degC degC degC degC degC
Avg Avg Avg Avg Avg Avg Avg1995-02-16 15:15:04.61 278822 31.08 24.23 25.12 26.8 24.14 24.47 23.761995-02-16 15:15:04.62 278823 31.07 24.23 25.13 26.82 24.15 24.45 23.81995-02-16 15:15:04.63 278824 31.07 24.2 25.09 26.8 24.11 24.45 23.751995-02-16 15:15:04.64 278825 31.07 24.21 25.1 26.77 24.13 24.39 23.76
The user's program determines the values that are output and their sequence.The datalogger automatically assigns names to each field in the data table. Inthe above table, TIMESTAMP, RECORD, RefTemp_Avg, and TC_Avg(1) arefieldnames. The fieldnames are a combination of the variable name (or alias ifone exists) and a three letter mnemonic for the processing instruction that
Declare public variables ,dimension array, anddeclare units.
Declare constants
Define Data Table
Declarations
Scan loopMeasure
Call Data Table
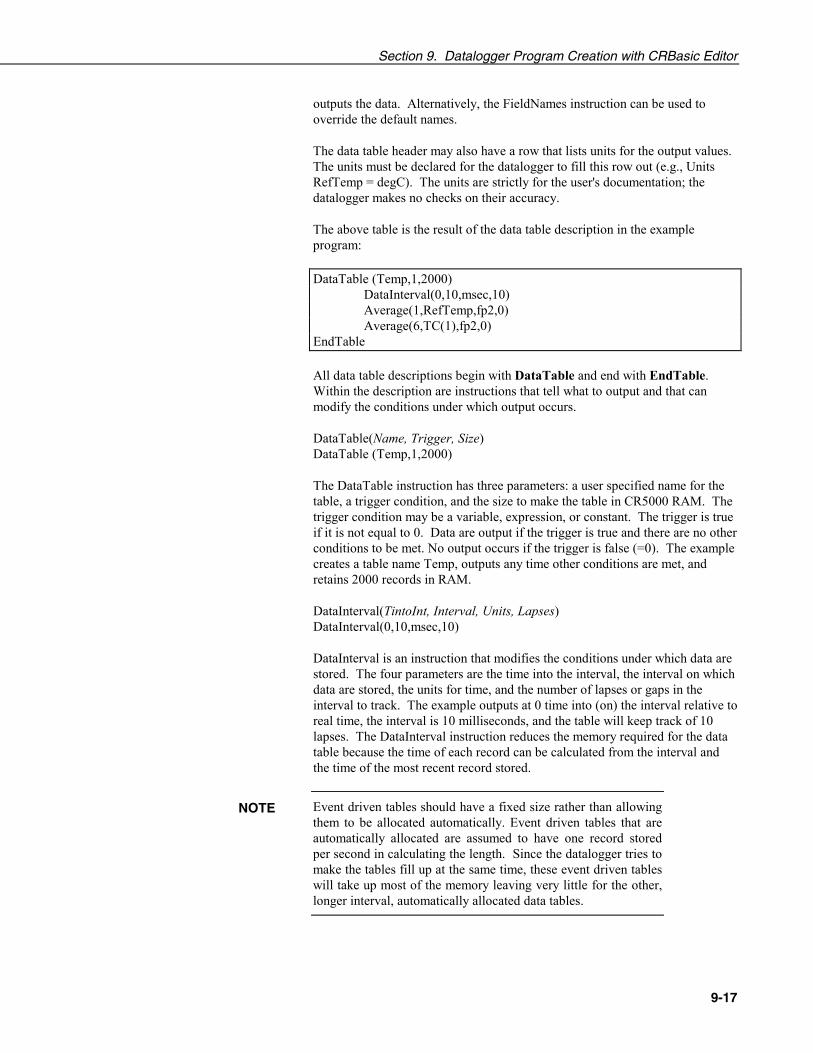
Section 9. Datalogger Program Creation with CRBasic Editor
9-17
outputs the data. Alternatively, the FieldNames instruction can be used tooverride the default names.
The data table header may also have a row that lists units for the output values.The units must be declared for the datalogger to fill this row out (e.g., UnitsRefTemp = degC). The units are strictly for the user's documentation; thedatalogger makes no checks on their accuracy.
The above table is the result of the data table description in the exampleprogram:
DataTable (Temp,1,2000)DataInterval(0,10,msec,10)Average(1,RefTemp,fp2,0)Average(6,TC(1),fp2,0)
EndTable
All data table descriptions begin with DataTable and end with EndTable.Within the description are instructions that tell what to output and that canmodify the conditions under which output occurs.
DataTable(Name, Trigger, Size)DataTable (Temp,1,2000)
The DataTable instruction has three parameters: a user specified name for thetable, a trigger condition, and the size to make the table in CR5000 RAM. Thetrigger condition may be a variable, expression, or constant. The trigger is trueif it is not equal to 0. Data are output if the trigger is true and there are no otherconditions to be met. No output occurs if the trigger is false (=0). The examplecreates a table name Temp, outputs any time other conditions are met, andretains 2000 records in RAM.
DataInterval(TintoInt, Interval, Units, Lapses)DataInterval(0,10,msec,10)
DataInterval is an instruction that modifies the conditions under which data arestored. The four parameters are the time into the interval, the interval on whichdata are stored, the units for time, and the number of lapses or gaps in theinterval to track. The example outputs at 0 time into (on) the interval relative toreal time, the interval is 10 milliseconds, and the table will keep track of 10lapses. The DataInterval instruction reduces the memory required for the datatable because the time of each record can be calculated from the interval andthe time of the most recent record stored.
Event driven tables should have a fixed size rather than allowingthem to be allocated automatically. Event driven tables that areautomatically allocated are assumed to have one record storedper second in calculating the length. Since the datalogger tries tomake the tables fill up at the same time, these event driven tableswill take up most of the memory leaving very little for the other,longer interval, automatically allocated data tables.
NOTE

Section 9. Datalogger Program Creation with CRBasic Editor
9-18
The output processing instructions included in a data table declarationdetermine the values output in the table. The table must be called by theprogram in order for the output processing to take place. That is, each time anew measurement is made, the data table is called. When the table is called,the output processing instructions within the table process the current inputs. Ifthe trigger conditions for the data table are true, the processed values are outputto the data table. In the example below, several averages are output.
Average(Reps, Source, DataType, DisableVar)Average(1,RefTemp,fp2,0)Average(6,TC(1),fp2,0)
Average is an output processing instruction that will output the average of avariable over the output interval. The parameters are repetitions (the number ofelements in an array to calculate averages for), the Source variable or array toaverage, the data format to store the result in (Table 9.3-1), and a disablevariable that allows excluding readings from the average if conditions are notmet. A reading will not be included in the average if the disable variable is notequal to 0; the example has 0 entered for the disable variable so all readings areincluded in the average.
TABLE 9.3-1. Formats for Output Data
Code Data Format Size Range Resolution
FP2 Campbell Scientific floating point 2 bytes ±7999 13 bits (about 4 digits)
IEEE4 IEEE four byte floating point 4 bytes 1.8 E -38 to 1.7 E 38 24 bits (about 7 digits)
LONG 4 byte Signed Integer 4 bytes -2,147,483,648 to+2,147,483,647
1 bit (1)
9.3.2 The Scan -- Measurement Timing and ProcessingOnce the measurements and calculations have been listed and the output tablesdefined, the program itself may be relatively short. The executable programbegins with BeginProg and ends with EndProg. The measurements, processing,and calls to output tables bracketed by the Scan and NextScan instructionsdetermine the sequence and timing of the datalogging.
BeginProgScan(1,MSEC,3,0)
PanelTemp(RefTemp, 250)TCDiff(TC(),6,mV50,4,1,TypeT,RefTemp,RevDiff,Del,Integ,Mult,Offset)CallTable Temp
NextScanEndProg

Section 9. Datalogger Program Creation with CRBasic Editor
9-19
The Scan instruction determines how frequently the measurements within thescan are made:
Scan(Interval, Units, BufferOption, Count)Scan(1,MSEC,3,0)
The Scan instruction has four parameters. The Interval is the interval betweenscans. Units are the time units for the interval. The maximum scan interval isone minute. The BufferSize is the size (in the number of scans) of a buffer inRAM that holds the raw results of measurements. Using a buffer allows theprocessing in the scan to at times lag behind the measurements withoutaffecting the measurement timing (see the scan instruction in the help for moredetails). Count is the number of scans to make before proceeding to theinstruction following NextScan. A count of 0 means to continue loopingforever (or until ExitScan). In the example the scan is 1 millisecond, threescans are buffered, and the measurements and output continue indefinitely.
9.4 Numerical EntriesIn addition to entering regular base 10 numbers there are 3 additional ways torepresent numbers in a program: scientific notation, binary, and hexadecimal(Table 9.4-1).
TABLE 9.4-1. Formats for Entering Numbers in CRBasic
Format Example Value
Standard 6.832 6.832
Scientific notation 5.67E-8 5.67X10⁻⁸
Binary: &B1101 13
Hexadecimal &HFF 255
The binary format makes it easy to visualize operations where the ones andzeros translate into specific commands. For example, a block of ports can beset with a number, the binary form of which represents the status of the ports(1= high, 0=low). To set ports 1, 3, 4, and 6 high and 2, 5, 7, and 8 low; thenumber is &B00101101. The least significant bit is on the right and representsport 1. This is much easier to visualize than entering 72, the decimalequivalent.
9.5 Logical Expression Evaluation
9.5.1 What is True?Several different words get used to describe a condition or the result of a test.The expression, X>5, is either true or false. However, when describing thestate of a port or flag, on or off or high or low is more intuitive. In CRBasicthere are a number of conditional tests or instruction parameters, the result ofwhich may be described with one of the words in Table 9.5-1. The dataloggerevaluates the test or parameter as a number; 0 is false, not equal to 0 is true.

Section 9. Datalogger Program Creation with CRBasic Editor
9-20
TABLE 9.5-1. Synonyms for True and False
Predefined Constant True (-1) False (0)
Synonym High Low
Synonym On Off
Synonym Yes No
Synonym Trigger Do Not Trigger
Number ≠0 0
Digital port 5 Volts 0 Volts
9.5.2 Expression EvaluationConditional tests require the datalogger to evaluate an expression and take onepath if the expression is true and another if the expression is false. For example:If X>=5 then Y=0will set the variable Y to 0 if X is greater than or equal to 5.
The datalogger will also evaluate multiple expressions linked with and or or.For example:If X>=5 and Z=2 then Y=0will set Y=0 only if both X>=5 and Z=2 are true.If X>=5 or Z=2 then Y=0will set Y=0 if either X>=5 or Z=2 is true (see And and Or in the help). Acondition can include multiple and and or links.
9.5.3 Numeric Results of Expression EvaluationThe datalogger’s expression evaluator evaluates an expression and returns anumber. A conditional statement uses the number to decide which way tobranch. The conditional statement is false if the number is 0 and true if thenumber is not 0. For example:If 6 then Y=0,is always true, Y will be set to 0 any time the conditional statement is executed.If 0 then Y=0is always false, Y will never be set to 0 by this conditional statement.
The expression evaluator evaluates the expression, X>=5, and returns -1, if theexpression is true, and 0, if the expression is false.W=(X>Y)will set W equal to -1 if X>Y or will set W equal to 0 if X<=Y.
The datalogger uses -1 rather than some other non-zero number because theand and or operators are the same for logical statements and binary bitwisecomparisons. The number -1 is expressed in binary with all bits equal to 1, thenumber 0 has all bits equal to 0. When -1 is anded with any other number theresult is the other number, ensuring that if the other number is non-zero (true),the result will be non-zero .

Section 9. Datalogger Program Creation with CRBasic Editor
9-21
9.6 FlagsAny variable can be used as a flag as far as logical tests in CRBasic areconcerned. If the value of the variable is non-zero the flag is high. If the valueof the variable is 0 the flag is low. LoggerNet looks for the variable array withthe name Flag when the option to display flag status is used in one of thereal-time screens.
9.7 Parameter TypesInstruction parameters allow different types of inputs. These types are listedbelow and specifically identified in the description of the parameter in thefollowing sections or in CRBasic help.
ConstantVariableVariable or ArrayConstant, Variable, or ExpressionConstant, Variable, Array, or ExpressionNameName or list of NamesVariable, or ExpressionVariable, Array, or Expression
Table 9.7-1 lists the maximum length and allowed characters for the names forVariables, Arrays, Constants, etc.
TABLE 9.7-1. Rules for Names
Name for Maximum Length (number ofcharacters)
Allowed characters
Variable or Array 16 Letters A-Z, upper or lower
Constant 16 case, underscore “_”, and
Alias 16 numbers 0-9. The name must
Data Table Name 8 start with a letter. CRBasic is
Field name 16 not case sensitive.
9.7.1 Expressions in ParametersMany parameters allow the entry of expressions. If an expression is acomparison, it will return -1 if the comparison is true and 0 if it is false (Section9.5.3). An example of the use of this is in the DataTable instruction where thetrigger condition can be entered as an expression. Suppose the variable TC(1)is a thermocouple temperature:
DataTable(Name, TrigVar, Size)DataTable(Temp, TC(1)>100, 5000)
Entering the trigger as the expression, TC(1)>100, will cause the trigger to betrue and data to be stored whenever the temperature TC(1) is greater than 100.
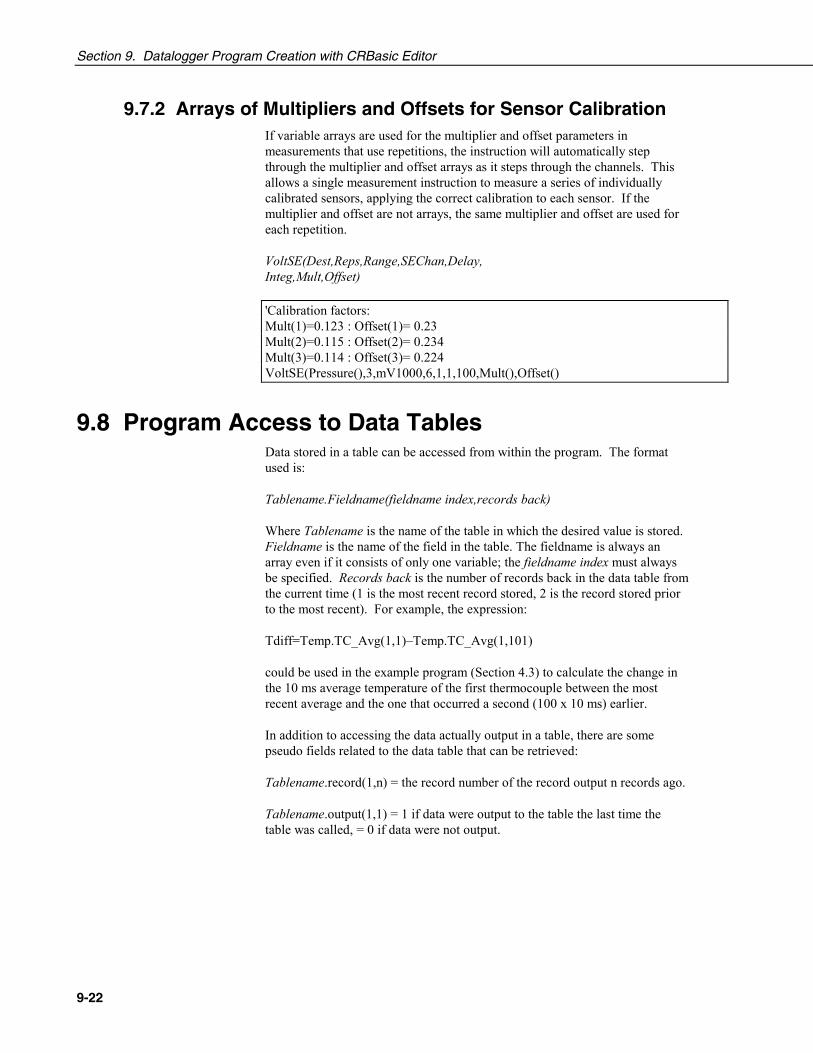
Section 9. Datalogger Program Creation with CRBasic Editor
9-22
9.7.2 Arrays of Multipliers and Offsets for Sensor CalibrationIf variable arrays are used for the multiplier and offset parameters inmeasurements that use repetitions, the instruction will automatically stepthrough the multiplier and offset arrays as it steps through the channels. Thisallows a single measurement instruction to measure a series of individuallycalibrated sensors, applying the correct calibration to each sensor. If themultiplier and offset are not arrays, the same multiplier and offset are used foreach repetition.
VoltSE(Dest,Reps,Range,SEChan,Delay,Integ,Mult,Offset)
'Calibration factors:Mult(1)=0.123 : Offset(1)= 0.23Mult(2)=0.115 : Offset(2)= 0.234Mult(3)=0.114 : Offset(3)= 0.224VoltSE(Pressure(),3,mV1000,6,1,1,100,Mult(),Offset()
9.8 Program Access to Data TablesData stored in a table can be accessed from within the program. The formatused is:
Tablename.Fieldname(fieldname index,records back)
Where Tablename is the name of the table in which the desired value is stored.Fieldname is the name of the field in the table. The fieldname is always anarray even if it consists of only one variable; the fieldname index must alwaysbe specified. Records back is the number of records back in the data table fromthe current time (1 is the most recent record stored, 2 is the record stored priorto the most recent). For example, the expression:
Tdiff=Temp.TC_Avg(1,1)–Temp.TC_Avg(1,101)
could be used in the example program (Section 4.3) to calculate the change inthe 10 ms average temperature of the first thermocouple between the mostrecent average and the one that occurred a second (100 x 10 ms) earlier.
In addition to accessing the data actually output in a table, there are somepseudo fields related to the data table that can be retrieved:
Tablename.record(1,n) = the record number of the record output n records ago.
Tablename.output(1,1) = 1 if data were output to the table the last time thetable was called, = 0 if data were not output.

Section 9. Datalogger Program Creation with CRBasic Editor
9-23
Tablename.timestamp(m,n) = element m of the timestamp output n records agowhere:
timestamp(1,n) = microseconds since 1990timestamp(2,n) = microseconds into the current yeartimestamp(3,n) = microseconds into the current monthtimestamp(4,n) = microseconds into the current daytimestamp(5,n) = microseconds into the current hourtimestamp(6,n) = microseconds into the current minutetimestamp(7,n) = microseconds into the current second
Tablename.eventend(1,1) is only valid for a data table using the DataEventinstruction, Tablename.eventend(1,1) = 1 if the last record of an event occurredthe last time the table was called, = 0 if the data table did not store a record or ifit is in the middle of an event.
The values of Tablename.output(1,1) and Tablename.eventend(1,1) are only updated when the tables are called.
NOTE

Section 9. Datalogger Program Creation with CRBasic Editor
9-24
This is a blank page.

10-1
Section 10. SplitSplit is a tool that works with output data files collected from Campbell Scientificdataloggers. It can be used to separate data collected on a particular interval from a datafile containing data output at several different intervals. Split can read data files fromtable based and array based dataloggers.
Split can be used to create reports based on collected data by filtering data based on timeor conditions. It can separate statistics, perform calculations, reformat files, do dataquality checking (limit testing), and generate tables with report and column headings. Itcan also handle the time synchronization and merging of up to eight data files.
10.1 Functional OverviewSplit is a tool to aid the use and analysis of data collected from CampbellScientific dataloggers. Its name comes from its function of splitting specificdata from a larger data file. Originally, Split could only process array basedfiles, and it was used to “split” the arrays of a file into multiple files.
In addition to splitting out array data, Split can filter output data based on timeor conditions, calculate statistics and new values, reformat files, or check dataquality (limit testing). Split can generate tables with report and columnheadings, as well as time synchronize and merge up to eight data files.
Input Files (maximum of eight) are read by Split, specific operations areperformed on the data, and the results are output to a single Output File or aprinter. Split creates a parameter file (filename.PAR) that saves all of yoursettings such as which data files are read, what operations are performed on thedata set, and where the final results will be saved. The parameter file may besaved and used again.
Input Files (Section 10.3.1) must be formatted in Printable ASCII, CommaSeparated ASCII, Field Formatted ASCII, Final Storage (Binary) Format,Table Oriented ASCII (TOACI1 or TOA5), Table Oriented Binary (TOB), orRaw A/D data (such as the results of a burst measurement).
Split can be used to convert a file of one format to a different format. Forexample, a Table Oriented ASCII file can be converted to the CommaSeparated ASCII format used in array based datalogger data files. This isuseful to convert table based data files to work with applications that werewritten to work with array based files.
Output files generated by Split can be Field Formatted (default), CommaSeparated ASCII, or Printable ASCII.
Split lends itself to experimentation. The processed data are displayed on thescreen, giving immediate feedback as to the effect of changes or new entries tothe parameter file. Split does not modify the Input File.

Section 10. Split
10-2
10.2 Getting StartedThe most common use of Split is to separate array data collected on a particularinterval from a data file containing data output at several different intervals.
In the following example, hourly data are split from a data set that contains 15minute, hourly and daily data. The data was collected from BirchCreek, aCR10X datalogger. The station was named BirchCreek whentelecommunications were set up so the data are stored in the fileBirchCreek_1.dat. The CR10X was loaded with a program created by Edlognamed Birch.dld.
The 15 minute data, array 99, the hourly data, array 60, and the daily data, array24, are intermixed in the data file (Figure 10.2-1).
FIGURE 10.2-1. Data File

Section 10. Split
10-3
When Edlog compiled Birch.dld, it also created the Final Storage Label file,Birch.fsl that lists the final storage locations for each data element (Figure 10.2-2).
FIGURE 10.2-2. FSL file

Section 10. Split
10-4
FIGURE 10.2-3. Input File Template
When you start Split a blank template similar to the one above is shown. Thistemplate is used to enter the parameters that will define what data from theinput file to include in the output file. The parameters entered on this templatecan be saved as a parameter file (*.PAR) and reused for other data.
On the INPUT FILE tab we only need to specify the input file name, copycondition, and the data to select. Split allows specific start and stop conditionsto be specified but if they are left blank, the entire file will be read.
The name of the Input Data File can be typed in or the Browse button can beused to select from available files. In this example BirchCreek_1.dat will beselected as the input data file.
Selecting the data to copy is simplified by the use of the Birch.fsl file. Fromthe toolbar menu, click on Labels | Use Data Labels. From the Data File Labelspop-up, Select File is used to find Birch.fsl. When one of the Output Arrays ishighlighted, the Field Names of the data in that array are displayed (Figure10.2-4).

Section 10. Split
10-5
FIGURE 10.2-4. DATA FILE LABELS Screen
FIGURE 10.2-5. Pasting Values into Split

Section 10. Split
10-6
In this example we want the hourly data (note the Output Interval at the bottomof the Data File Label window) so we click on array 60. To paste the desiredvalues from this array into the Select box, we select the field names whileholding down the <ctrl> key. All of the values could be selected by clicking onthe first one and holding the mouse button down, and dragging to the end. Oncethe values you want have been selected click on Paste (Figure 10.2.5).
Note that the cursor in the INPUT FILE(S) screen must be in valid paste area(Copy or Select). If the cursor is in the File name box or in Start/Stopcondition, you will get the error message “Cannot Paste There”.
The Paste operation put the numbers of each of the fields into the Select box.Notice also that it pasted the Array ID into the copy condition: 1[60] tells Splitthat in order to copy a line of data, the first value in that line must be 60. Splituses the Array ID to discriminate between the hourly and daily data.
Now we must specify the Output File. (Without one specified, Split will runand display results but no output file will be created.) Click on the OUTPUTFILE tab. We type in “hourly” for the name of the output file. By default,Split will use the file extension “PRN”, creating the output file: hourly.prn.The file “hourly.prn” will overwrite any existing file with the same name,unless the Append check box is selected.
The Labels option from the toolbar can also assist in labeling the output values.Once again, choose LABELS | USE FINAL STORAGE LABELS and selectarray 60 and all the field names. This time move the cursor to Line 1 of the firstcolumn of labels on the OUTPUT FILE tab and press Paste (Figure10.2-6). The labels from the final storage file will be pasted into each of thecolumns.
FIGURE 10.2-6. Pasting Labels Into Split

Section 10. Split
10-7
FIGURE 10.2-7. Edited Headings
Maximum column heading width is one less than the number entered in theDefault Column Width field. Entering a number in the Width row for thecolumn will set the column width for an individual column. Any FSL labelsthat are too long for Split column headings will be shown in red. They shouldbe edited before running Split. To edit one of the labels, press the <Enter> keyor use a mouse to copy, cut, and paste. A Report Heading can also be entered(Figure 10.3-7) using the same editing technique.
For table based data files the timestamp is normally the first column and is aquoted text string ("2002-02-26 10:30:00"). Split uses these time stamps but todisplay them in the output you will need to change the column width for thefirst column to at least 24. If the column width is too small to accommodate thevalue output, the string will be highlighted in red and preceded by an asterisk,with the words “Bad Data” in the lower right corner when the file is processed.
Now we are ready to run Split. Select RUN | GO and the hourly data will besplit out and stored in hourly.prn. The results are displayed on the screen asshown in Figure 10.2-8.
Close the Run window. If you wish to save this parameter file for futurereports, choose FILE | SAVE. The file will be saved with a .PAR extension.

Section 10. Split
10-8
FIGURE 10.2-8. Split Run Showing Hourly Data
10.3 Split Parameter File Entries
10.3.1 Input FilesThe name of the Input File is entered in the space to the right of the Browsebutton. The default directory is defined by the working directory forLoggerNet. If the input file is not in the default directory, use the Browsebutton to find the input file.
Input Files must be formatted in Comma Separated ASCII, Final Storage(Binary) Format, Field Formatted ASCII (Split default output format), PrintableASCII, Table Oriented ASCII (TOA) or Raw A/D data (refer to special BurstMode instruction in your Campbell Scientific datalogger manual).
Files stored in Table Oriented Binary (TOB) format are converted to TableOriented ASCII files when Split uses them. The converter comes upautomatically when you run Split to create the output file. You cannot use theData Label browser to select the columns of data from a binary file. If youwant use the Data Label browser you can convert the binary file using theTOB2 File converter in under Programs | LoggerNet | Utilities prior toprocessing it with Split.

Section 10. Split
10-9
Table 10.3-1 provides an example of Printable ASCII, Comma Separated, FieldFormatted, and Table Oriented ASCII input file types. The data in the variousformats are identical. Each line of data represents an "Output Array", startingwith an Output Array ID (in this case 115). Each data point in the OutputArray is referred to as an "element". The element number is given in thePrintable ASCII format, and implied in the other formats. Data presented inTable 10.3-1 is used for example purposes in the following sections.
TABLE 10.3-1. Comma Separated, Field Formatted, Printable ASCII,and Table Oriented ASCIIInput File Format Types
COMMA SEPARATED
115,189,1200,89.6,55.3,25.36,270115,189,1300,91.3,61.5,27.25,255.4115,189,1400,92.7,67.7,15.15,220.1115,189,1500,94.1,69,20.35,260.6
FIELD FORMATTED
115 189 1200 89.6 55.3 25.36 270115 189 1300 91.3 61.5 27.25 255.4115 189 1400 92.7 67.7 15.15 220.1115 189 1500 94.1 69 20.35 260.6
PRINTABLE ASCII
01+0115 02+0189 03+1200 04+089.6 05+055.3 06+25.36 07+270.001+0115 02+0189 03+1300 04+091.3 05+061.5 06+27.25 07+255.401+0115 02+0189 03+1400 04+092.7 05+067.7 06+15.15 07+220.101+0115 02+0189 03+1500 04+094.1 05+069.0 06+20.35 07+260.6
Element 1 = Output Array ID# (115)Element 2 = Julian day (189)Element 3 = hour, minuteElement 4 = average temperature in deg. FElement 5 = average soil temperature in deg. FElement 6 = average wind speed in mphElement 7 = wind direction in degrees
TABLE ORIENTED ASCII
"TOACI1","CR10T","15Minute""TMSTAMP","RECNBR","TCTempF_MAX","BattVolt_MIN""2002-02-26 10:30:00",0,73.97,13.99"2002-02-26 10:45:00",1,74.03,13.98"2002-02-26 11:00:00",2,74.53,13.98"2002-02-26 11:15:00",3,74.82,13.98"2002-02-26 11:30:00",4,75.23,13.98
Element 1 = Timestamp
Element 2 = Record Number

Section 10. Split
10-10
Element 3 = temperature in degrees F
Element 4 = minimum battery voltage
A maximum of eight input files may be processed by Split at one time.Additional input files are added using the EDIT | ADD DATA FILE menuoption. Split defaults to a file extension of .DAT if no extension is specified.If the Input File does not exist, an error message is displayed when RUN | GOis selected from the menu options.
For instance, to process two files named TEST.DAT and TEST_1.DAT theuser would select TEST.DAT and TEST_1.DAT as Input Files. Two blankinput file templates will be generated. To change from one template to theother, click on the appropriate tab on the bottom of the screen. Both templatesmust be completed before Split will process the data. To merge differentoutput arrays from the same input file into one array, open the data file once foreach different array.
10.3.1.1 File Offset Using Last Count
Each time Split runs a parameter file, it keeps track of the number of bytes itread from the input file and saves this information in the parameter file. Splitcan then start where it last left off. This is done by clicking on the Offsetsbutton and selecting the Last Count option (see Example 1). This feature maybe used to process only the new data from a file in which new data are beingappended periodically to the data file using the scheduled data collectionoption of LoggerNet.
Example 1

Section 10. Split
10-11
When using the Last Count option, if the Start and StopConditions (Sections 10.3.2, 10.3.3) are specified, theymust exist in the newly appended data or Split will neverbegin execution.
By selecting the Specific option and entering a number, Split will "seek" thatposition in the file. This option saves time by starting part way through a largedata file. The number specifies the number of characters into the file to seekbefore processing data. A positive or negative number can be entered. If thenumber is positive, Split will start reading from the beginning of a file; if thenumber is negative, Split will start reading from the end of a file. All characters,including spaces, carriage returns, and line feeds, are counted. A stop offset canalso be specified.
Example 2
Example 3
CAUTION

Section 10. Split
10-12
In Example 2, Split will skip the first 256 characters before it begins processingthe data in Input File. In Example 3, Split will skip the first 256 charactersbefore beginning and stop execution on character 1024.
10.3.1.2 Input File Exceptions
In most instances, Split automatically recognizes the type of data file it isreading by using Auto Select in the File Info field. However, there are twoexceptions:
• Reading Raw A/D Data from Burst Measurements
To read this type of data and convert it to ASCII, select Burst in the FileInfo box. Once Burst is selected, the Number of Values in Each Burstwindow in the Offset Menu will become accessible. Enter the number ofelements in each Burst. This number does not include the array IDnumber or calibration data.
• Reading Data in Final Storage (Binary) Format
If the data is in binary format and Start and Stop Offsets are used, FinalStorage (Binary) Format must be selected in the File Info field. This tellsSplit that the file must be decoded as Final Storage before counting thebytes. If Offsets are not used, Auto Detect may be chosen and the file willbe processed correctly.
10.3.2 Start ConditionA starting point may be specified to begin processing data. If the StartCondition field is left blank, Split will start processing data at the beginning ofthe data file. The starting point can be any element within the array or acombination of elements within an array.
The syntax can be expressed as:
ei[vali]
where ei = the position number of the element within the array
vali = the value of that element.
For example, the data in Table 10.3-1 contains seven elements per OutputArray, representing hourly data. Assume that this data file contains one monthof hourly data. To start processing data at 1500 hours on the first day, the StartCondition is expressed as 3[1500], where 3 means the third element within thearray and 1500 is the value of that third element.
The element must match this start value exactly to trigger thestart condition.
NOTE

Section 10. Split
10-13
Table data files contain the time and date as a single quoted string at thebeginning of each data record. Split handles the dates as long as youinclude a colon separator as a placeholder for each of the fields in thetimestamp. 1[Year]:1[Day of Year]:1[Time of Day]:1[Seconds]
See the examples below:
:1[60]:: Day of Year 60
1[2002]:1[60]:1[1250]: Year 2002, Day of Year 60, Time of Day 12:50
::1[1445]:1[30] Time of Day 14:45, Seconds 30
Logical “and” and “or” statements can be used when specifying the StartCondition. A logical “and” statement means that all conditions must be true forthe statement to be true. Up to three conditions can be connected with “and”statements. If too many “and” statements are used, an error message will bedisplayed when you run Split.
The logical “or” statement means that if any of the conditions are true, then thestatement is true. Split allows up to six conditions to be connected with “or”statements. Additionally, each “or” statement can contain up to three “and”conditions. As with the “and” statements, if the maximum number of validstatements is exceeded, an error message will be displayed.
These rules for logical statements also apply to the Stop and Copy Conditions.
An example of a simple logical “and” statement follows:
2[189]and3[1200]
Element two (the Julian day) must equal 189, and element three (the time inhours/minutes) must equal 1200.
If the following “and” statement was used:
2[189]and3[1200]and4[92]and5[67]
an error would be returned because the maximum number of allowable “and”statements has been exceeded.
A range can be specified for vali by putting ".." between the lower and upperlimit. For example:
2[189]and7[200..275]
In this example two conditions must be satisfied to start processing data. First,the day of year must be 189, and second, the wind direction must be between200 to 275 degrees, inclusive.
NOTE

Section 10. Split
10-14
10.3.2.1 Time Synchronization
The time synchronize function is useful when data are missing from files orseveral files of data need to be merged together. The files are synchronizedaccording to time. This function synchronizes according to day, hrmn (hour-minute), and/or seconds. The syntax used to identify the time elements forarray data is:
ei[day]:ei[hrmn]:ei[seconds]
Referring to Table 10.3-1, to identify the day of year for an array based datafile, type:
2[189]::
for hrmn type:
:3[1200]:
and seconds are expressed as:
::4[5]
A single colon is assumed to be between day and hrmn (e.g., 2[189]: meansday, :3[1200] means hours, and 2[189]:3[1200] means day and hour-minute).When the time synchronize function is used, a time interval must be specified inthe Copy line of the first data file. For example, 4[60] in the Copy line willcreate a synchronized file containing the data from the input files that occurredevery 60 minutes. If no time interval is specified in the Copy line then the timespecified in the Start Condition becomes simply a starting time with no timesynchronization.
The starting time specified must actually be found in the input file before theStart Condition is satisfied (e.g., if the input file starts at 1100 hrs and 1000 hrsis entered for the starting time, with no day specified, Split will skip over arraysuntil it reaches 1000 hrs the next day).
Table-based datalogger
Because the time stamp for a table-based datalogger is all one string, andtherefore read by Split as one element, the syntax is somewhat different. Allelements in the time stamp are specified by a 1 (if the time stamp is the firstitem in each row of data).
The 1s in the string identify the position of the time stamp in the line of data.Each colon represents a portion of the time stamp. The format is1[year]:1[day]:1[hour/minute]:1[seconds]. The colons in the time stamp mustbe present or the function will not work correctly.
Time synchronization can only be done for data from a singleyear. It will not work over a year boundary.
NOTE

Section 10. Split
10-15
Time elements can be identified without specifying a starting time (e.g., 2:3).When no starting time is specified, Split assumes the starting time to be 0 andinserts carriage return line feeds (CRLF) at the start of the Output File. Thenumber of CRLFs equals the time between 0 and the time of the first arrayselected, divided by the interval specified in the Copy condition.
When time synchronizing, if multiple input files are given starting times, Splitstarts the Output at the earliest specified starting time. In a PRN file, Blanks orthe comment entered in the “Replace bad data with” field are inserted forvalues from other input files until their starting times are reached. In a RPT fileonly blanks are used.
10.3.2.2 Starting Relative to PC Time
Included in the time synchronize function is the ability to start relative to thecurrent PC TIME (computer time). This feature allows a .PAR file to be run onnew data files without changing the Start Conditions, provided the Input DataFile is collected at a fixed interval and Split is run at a fixed interval. Forexample, the same PAR file could be run every day to display the last 48 hoursof data without changing the start conditions. For example, using a table baseddata file:
Start Condition = 1:1[-1]:1[1200]:1:
In this instance, Split will begin processing data when the date for both files isone less than the current date (1:1[-1]:1[1200]:1:)and the time is 1200 (1:1[-1]:1[1200]:1:).
As an expanded example, assume that LoggerNet is used in scheduled datacollection mode that automatically appends data to an archive file. SplitR isexecuted using an after scheduled call task option in the Task Master. In thiscase the frequency of data collection and data reduction is the same. Timevalues in the data file (day, hrmn, sec.) are different each time the data arecollected, but by telling Split where to Start reading relative to the PC clock,the Start Conditions do not need to be changed. To accommodate variations inthe data collection and reduction frequencies, an interval in minutes or secondsmay be specified as shown in the examples below.
2[-0]:3[-60,5] tells Split to start at a timestamp in the data that is between 55and 65 minutes prior to the current PC time (the closest 5 minute interval of thecurrent day that is less than the PC time minus 60 minutes). If you areprocessing data stored at the top of the hour and the PC time is 1404, Splitcalculates 1304 and looks for hour 1300 to start reading.
2[-3]:3[-120,60] tells Split to find the closest 60 minute interval that is less thanthe PC time minus 3 days and 2 hours. If the PC time is the day of year 159,hour 0017, Split will start reading on data output at 2200 hours on day 155.
2[-3]:3[-120]:4[20,5] tells Split to find the closest 5 second interval that is lessthan the PC time minus 3 days, 2 hours and 20 seconds. If the PC time is 27seconds after noon on day 30, Split will begin reading on data output at 1000hours and 05 seconds on day 27.

Section 10. Split
10-16
Split will not start reading if the exact specified starting timecannot be found. The interval (5 minutes, 60 minutes, and5 seconds in the examples above) must be evenly divisibleinto 60 minutes.
• If the start time is a certain number of days prior to the PCtime, the file will be processed beginning at midnight of theday specified.
• To specify a start time in minutes from the current PC time,you must also specify a day parameter of [-0]. Otherwise,processing will begin at the first instance in the data file thatthe minutes parameter equals the current minutes.
10.3.2.3 Using Time Synchronization While Starting Relative to PC Time
Split tries to time-sync files to the top of the hour when starting relative to PCtime. If you are synchronizing files where the data output interval is not at thetop of the hour, you will need to specify an interval in the Copy Condition thatrepresents a window of time in which Split should look for the hour/minute. Forinstance, if your data is output 50 minutes into a 60 minute interval (andtherefore, your time stamps are 50, 150, 250, 350...2350) your Start Conditionand Copy Conditions for the first file might look like the following:
Start Condition2[-1]:3[50]:
Copy Condition1[106]and3[60,10]
Where:element 1 is the array IDelement 2 is the Julian dayelement 3 is the hour/minute
The Start Condition directs Split to begin processing data when the time is oneday prior to the current PC time and when the hour/minute value is equal to 50.The 1[106] in the Copy Condition specifies the array from which the datashould be copied. The 3[60,10] indicates that the interval for the time stamp is60 minutes and designates a 10 minute time window on each side of the top ofthe hour in which Split should look for the hour/minute data (10 minutes beforethe hour, 10 minutes after the hour).
The second file's Copy Condition should include only the array from which tocopy the data. No interval is necessary.
CAUTION
NOTE

Section 10. Split
10-17
10.3.3 Stop ConditionThe Stop Condition is expressed with the same syntax as the Start Condition. Ifthe Stop Condition parameter is left blank, Split will execute until the end ofthe file. Logical "and" and "or" statements can be used when specifying theStop Condition (Section 10.3.2).
The Stop Condition specifies when to stop processing data. This feature allowssegments of data to be removed from large data files. For instance, if a data filecontains one month of data and just one day is desired, the start and stop valuesallow the user to get just that day’s data. The array containing the StopCondition is not included in the output file. If the stop value is not found, Splitwill display a dialog box that gives the option to select a new file and continueprocessing the data. This feature is useful when data are contained in morethan one data file.
The C and F commands alter the meaning of the Stop Condition.
10.3.3.1 "C" Option: Formatting Event Tests Containing ConditionalOutput Arrays
The C option is used to combine data from two or more conditional arrays ontoone Split output line. A conditional array is one that is only output when adefined event occurs.
Assume that two or more conditional Output Arrays with unique Output ArrayIDs compose a test period, followed by an unconditional Output Array thatdefines the end of a test. The unconditional "end of test" Output Array is at theend of each test, but the conditional Output Arrays may or may not be present.The data file is comprised of several of these tests.
As an example, let's look at a vehicle test application. The start of the test iswhen the vehicle is turned on, and the end of the test is when the vehicle isturned off. The conditional output arrays could be:
• monitoring the engine temperature and outputting data to a unique arraywhen the temperature exceeds a limit
• outputting data to a unique array when the brakes are applied
• outputting data when engine RPM exceeds a limit
The unconditional array data (the stop condition) would be output to a uniquearray when the engine is turned off. By processing the data with Split using theC option, the data collected during each test could be merged on to one line,with blanks inserted if a set of data didn't exist (e.g., if the engine temperaturenever exceeded the defined limit).

Section 10. Split
10-18
To use the C option, the Parameter file should be set up as follows:
• An Input File must be set up for each array ID in the test. The first InputFile is configured on the Input File tab that appears when you open Split.Additional Input Files are added by choosing Edit | Add Data File from theSplit menu. The same data file will be used as the Input File for each array.
• Type in the array ID in the Copy field of the Input File tab for each array.The array ID is the first element of a data file, so the line should read1[123], where 123 is the actual array ID you want to process.
• In the Select field, type in the number for each element (data value) youwant to be output in the report.
• In the Stop Condition field, type in a "C," followed by the ID of your stopcondition array. If your "end of test" array was array ID 200, the StopCondition field would read: C,1[200]. This should be typed into the StopCondition fields of each array, including the "end of test" array.
Set up the Output File as you would for any Split process. If you are includingcolumn headings, the arrays and elements will appear in the order they arelisted on the Input File tabs. That is, the first column will be Input File number1, element number 1; the next column is Input File number 1, element number2… Input File number 2, element number 1 follows in the column immediatelyafter the last element of Input File number 1.
Consider Table 10.3-2 below:
TABLE 10.3-2. Example of Event Driven Test Data Set
100,12.1,10.,32.6101,92.7,67.7102,56.1,48.7,98.,220.1200100,12.5,9.89,30.1102,56.2,50.,100.5,210.6200100,13.1,10.1,33.1101,94.1,69200
Data from arraysoutput during thefirst test.
Second test.
Third test.
This table contains four different output arrays: 100, 101, 102, and 200. Duringthe first test, data was output from all three conditional arrays (100, 101, and102), with 200 signaling the end of the test. During the second test, data wasoutput from arrays 100 and 102. During the third test, data was output fromarrays 100 and 101.

Section 10. Split
10-19
To process these files using the C option, the parameter file would be set up asfollows (assuming the name of our data file is Data_1.DAT):
First Input File = Data_1.DAT:1Stop condition = C,1[200]Copy = 1[100]Select = 1,2,3,4
Second Input File = Data_1.DAT:2Stop condition = C,1[200]Copy = 1[101]Select = 1,2,3
Third Input File = Data_1.DAT:3Stop condition = C,1[200]Copy = 1[102]Select = 1,2,3,4,5
Fourth ("end of test") Input File = Data_1.DAT:4Stop condition = C,1[200]Copy = 1[200]Select = (leave blank)
The :(number) after the data file name is inserted automaticallyby Split.
TABLE 10.3-3. Processed Data File Using Option C
100 12.1 10 32.6 101 92.7 67.7 102 56.1 48.7 98 220.1100 12.5 9.89 30.1 102 56.2 50 100.5 210.6100 13.1 10.1 33.1 101 94.1 69
When Split is run, the resulting data file will look similar to Table 10.3-3. Eachline of data represents one test. Notice that blanks were inserted if the data set(conditional array) did not exist.
10.3.3.2 Trigger on Stop Condition (F Option) Output of Time Series
The Trigger on Stop Condition, or F option, changes the function of the StopCondition when one or more Time Series functions (Section 10.3.5.2) arecontained in the Select field. When a Stop Condition is met, the time series datais calculated and written to the output file. However, instead of stopping at thispoint, processing resumes and time series data is output the next time the StopCondition is met. This continues until the end of file or until the user stops Splitmanually.
The Trigger on Stop Condition is enabled by clicking Other… on the OutputTab and checking the box next to the Trigger on Stop Condition field. Whenthe Trigger on Stop Condition is enabled, the function affects all files beingprocessed that have a Stop Condition specified. If multiple files are being
NOTE

Section 10. Split
10-20
processed but it is desired that the function affect one or morebut not allofthe files, the F option is used in the Stop Condition field of the files that youwant processed using the function. The syntax for the F option is: F,ei[vali].
A typical application for the Trigger on Stop Condition is to reduce days ofhourly data into daily summaries. A logical element to use for the StopCondition is time (hrmn). Assuming the third element of the hourly OutputArray is hrmn, and midnight is output as 0, the Stop Condition is entered as3[0] (or F,3[0] if the F option is used). The Time Series processing isperformed over a day defined by midnight to midnight.
If only hourly Output Arrays were contained in the Input File, the Copy linecould be left blank. If other Output Arrays are present which need not beincluded in the Time Series processing, a logical Copy condition would be theOutput Array ID of the hourly output.
The Trigger on Stop Condition functions the same for multiple Input files as itdoes for a single Input File. If the option is enabled on several Input Files, andthe Stop Conditions do not occur at the same point in each file, when a file'sStop Condition is met, its time series data are output and blanks are output fordata selected from the other Input Files.
Say, for example, that you were interested in the average value of the first datapoint (element 2) for each test, in the data set listed in Table 10.3-2. The InputFile template would look like that shown in Table 10.3-4.
TABLE 10.3-4. Input File Entries to Process theFirst Data Point for each Test
First Input File = DATA_1.DAT:1Stop Condition = F,1[200]
Select = AVG(2)
10.3.4 CopyThe Copy Condition tells Split which arrays should be used for the output data.After the Start Condition is satisfied, and before the Stop Condition is met, theCopy condition must be satisfied before any data will be processed according toSelect line instructions (Section 10.3.1.4). If the Copy condition is left blank,all arrays are processed between the Start and Stop values. Syntax for the Copycondition is similar to the Start and Stop values mentioned above. Logical"and" and "or" statements (see Section 10.3.2) can be used when specifying theCopy condition.
For example, referring to Table 10.3-1, if only those hours during day 189when the temperature was above 90 and the soil temperature was below 62 isdesired, or, during day 189 when the average wind speed was below 21 whilethe wind direction was between 255 to 265 is desired, the Copy conditionwould be:
1[189]and4[90..150]and5[0..61.99]or1[189]and6[0..20.99]and7[255..265]
Only Output Arrays with hours 1300 and 1500, Table 10.3-1, conform to theabove Copy conditions.

Section 10. Split
10-21
10.3.5 Time SynchronizationTo use the time synchronize function, time element(s) must be specified in theStart Condition (Section 10.3.1.1). The user specifies a time interval in theCopy condition. For instance, if the original data had 15 minute outputs andyou only want hourly outputs, then an interval of 60 minutes must be specifiedfollowing the element number. This is entered as (assuming hrmn is elementnumber 3) “3[60]”. If time synchronization is specified in the Start Condition,Split looks for the interval in a time element in the Copy condition. Only onetime interval is specified. This interval is the unit of time to synchronize eachfile.
The interval can be given tolerance limits by following the interval with acomma and the tolerance. For example, if 3 is the hrmn element, and the timeinterval is 60 minutes +/-2 minutes, the syntax is 3[60,2].
Table based data files need to use the same time format as described in Section10.3.1. You can specify the interval for time synchronization on table files as::1[60]: which will give you an output interval of 60 minutes.
If the time synchronize function is enabled, and data are missing at one or moreof the time intervals specified, then a blank (or the comment entered in the“Replace bad data with” field) is output to the Output File. See Table 10.3-5.
10.3.6 SelectThe Select line specifies which elements of an Output Array are selected forprocessing and/or output to the specified Output File. The Select line becomesoperable only after the Start Condition and Copy condition are met, and beforethe Stop Condition is satisfied. If the Select line is left blank, all elements inoutput arrays meeting the Start Condition and Copy conditions are output to theOutput File. Up to 254 characters can be entered on one Select line. If this is alimitation, open the Input Data file twice (use the EDIT | ADD DATA FILEmenu) and use the Select line in the second Input File template to define theadditional operations.
10.3.6.1 Ranges
Element numbers may be entered individually (e.g., 2,3,4,5,6,7), or, in groups(e.g., 2..7) if sequential. Range limits (lower to upper boundary conditions)may be placed on elements or groups of elements specified in the Select orCopy lines. For example, 3[3.7..5],4..7[5..10] implies that element 3 is selectedonly if it is between 3.7 and 5, inclusive, and elements 4,5,6, and 7 must bebetween 5 and 10, inclusive.
If range limits are used in the Select condition, when Split is run, any datawhich are outside of the specified range will be highlighted according to theoptions chosen for the output file. Table 10.3-5 summarizes what each optionproduces on the screen and in the output file if out of range data areencountered. This type of range testing is a quick way to identify dataproblems.
TABLE 10.3-5. Effects of Out of Range Values for Given Output Options

Section 10. Split
10-22
Output Option Screen Display* PRN File RPT File orPrinter Output
Report = None; Noother options defined(default)
bad values displayed in red andpreceded by asterisk; the text "baddata" highlighted in a red box atbottom right of screen
blanks inserted forbad values
N/A
Report = File or Printer;no other options defined
bad values displayed in red andpreceded by asterisk; the text "baddata" highlighted in a red box atbottom right of screen
blanks inserted forbad values
bad valuespreceded byasterisk
Report = None;replacement text (abc) in"Replace bad data with"field (See Section10.3.6.1)
bad values displayed in red andpreceded by asterisk; the text "baddata" highlighted in a red box atbottom right of screen
abc inserted inplace of badvalues
N/A
Report = File or Printer;comment in "Replacebad data with" field
bad values displayed in red andpreceded by asterisk; the text "baddata" highlighted in a red box atbottom right of screen
comment insertedin place of badvalues
bad valuespreceded byasterisk
Report = None; "Displayonly bad data" optionenabled
only lines with bad data are displayed;bad values displayed in red andpreceded by asterisk; the text "baddata" highlighted in a red box atbottom right of screen
only lines withbad data output;blanks inserted forbad values
N/A
Report = File or Printer;"Display only bad data"option enabled
only lines with bad data are displayed;bad values displayed in red andpreceded by asterisk; the text "baddata" highlighted in a red box atbottom right of screen
only lines withbad data output;blanks inserted forbad values
only lines withbad data output;bad valuespreceded byasterisk
*The Screen Display box must be checked; if not, no data will be displayed on the Split Run screen.
In this instance, out of range data refers to data outside of thespecified output range. It is not to be confused with out of rangedata generated by the logger.
10.3.6.2 Variables
Variables can be assigned names in the Select line. For example, x = 4-5∗(6∗3.0) means that x is equal to element 6, times the number 3, times element5, subtracted from element 4. A numeric value is distinguished from an arrayelement by the inclusion of a decimal point. Variables must be declared beforethey can be used in the Select line. A variable name must start with an alphacharacter, can include numbers and must not exceed eight characters. Variablenames can start with the same character but they must not start with anothercomplete variable name (e.g., the variable XY is not valid if there is also thevariable X). A comma must follow each variable statement, as with all
NOTE

Section 10. Split
10-23
parameters in the Select line. Once the variables have been declared they canbe used later in the Select line (i.e., x=4-5∗(6∗3.0), y=6/3,2,3,6,7,7∗x,6+y).
Variables can be defined in the first four Input File’s Selectlines only, but may be used in subsequent Input File’s Selectlines.
Processing is accomplished through arithmetic operators, math functions,spatial functions, and time series functions. The following is a list of operators,math functions, and Time Series functions supported by Split.
TABLE 10.3-6. Split Operators, Math Functions, and Time Series Functions
OPERATORS OPERATOR PRECEDENCE ORDER(3 = high, 1 = low)
^ = raise to the power 3x Mod y = Modulo divide of x by y 2∗ / = multiplication, division 2+ - = addition, subtraction 1
EXAMPLES OF SYNTAX FOR MATHEMATICAL OPERATORS3∗5 multiply element 3 by element 53/5 divide element 3 by element 5(3..5)/(8..10) same as 3/8, 4/9, 5/103+5 add element 3 to element 53-5 subtract element 5 from element 3(3,9,5)-(8,7,10) same as 3-8, 9-7, 5-103∗2.0 multiply element 3 by a fixed number 22^3.0 raise element 2 to the third power
MATH FUNCTIONSAbs(x) = Absolute value of xArctan(x) = Arc tangent of x (in degrees)Cos(x) = Cosine of x (in degrees)Exp(x) = Natural Exponent function (ex)Frac(x) = Fractional portion of xInt(x) = Integer portion of xLn(x) = Natural logarithm of xSin(x) = Sine of x (in degrees)SpaAvg(x..y) = Spatial average of elements x through ySpaMax(x..y) = Spatial maximum of elements x through ySpaMin(x..y) = Spatial minimum of elements x through ySpaSd(x..y) = Spatial standard deviation of elements x through ySqrt(x) = Square root of x
TIME SERIES FUNCTIONSAvg(x;n) = AverageBlanks(x;n) = Number of blanks in elementCount(x;n) = Number of data points in elementMax(x;n) = MaximumMin(x;n) = MinimumRunTotal(x;n) = Running totalSd(x;n) = Standard deviationSmpl(x;n) = Sample raw valueSmplMax(x;y;n) = Sample (y) on a maximum (x)SmplMin(x;y;n) = Sample (y) on a minimum (x)
NOTE

Section 10. Split
10-24
Total(x;n) = TotalizeWAvg(x;n) = Unit vector mean wind direction (in degrees)
NOTE: x can be an element or a valid expression. n is optional and is the number of arrays to include in thefunction. Date and Edate can be used for the “n” in the Time Series functions to produce monthly output (seeTable 10.3-7 Special Functions, this Section).
Illegal operations (e.g., logarithm of a negative number) will cause Split tostore blanks for the Output. It is possible to get a run time error (error 0/1) ifthe floating point math exceeds the limits of the PC.
The greatest number that can be output is determined by the field width (Table10.3-3, “Column Widths” option). If the width is eleven or greater, the maximumnumber is 99,999,999; for widths from eight through ten the maximum is 99,999;for widths less than eight the maximum is 9999. If a column is not large enoughfor a value, it will be stored as a 9,999, 99,999 or 99,999,999 based on thecolumn width.
TABLE 10.3-7. Split SPECIAL FUNCTIONS
Crlf = Insert carriage return line feed in Output File.
Date(“format”S;H;D;Y) = Convert day of year and time to a timestampwith calendar date and time, where format usesWindows conventions to specify output format.S=seconds, H = HoursMinutes, D = Day, Y =year. The output timestamp is quoted text. Datecan be used to create monthly time seriessummaries. See Section 10.3.5.3.
Edate(“format”S;H;D;Y) = The same as the Date function except that theoutput text is not quoted. EDate can be used tocreate monthly time series summaries. SeeSection 10.3.5.3.
"Label" = Insert Comment in Output file. (Label isanything within the quote marks.)
Line = Number of lines written to Output file.
smpl(.pa;n) = Page break such that n is the number of lines perpage for the printer or the .RPT file.
PCdate or PCEdate = Used in a report header to print the current date.

Section 10. Split
10-25
When Date and Edate are used within other functions they mustbe used with the older format Date(doy;y) and Edate(doy;y)instead of using the extended date functions as shown in thetable. For example AVG(1;Date(2;2002.0)). The decimal isneeded to indicate a fixed number. Numbers without the decimalare interpreted as element IDs.
10.3.6.1 Mathematical Functions, Details, and Examples
The following array of ASCII data will be used for all Mathematical functionexamples.
0105 0176 1200 -07.89 55.10 12.45 270.5
Abs(x) returns the absolute, or positive value of element x.Examples:Abs(4) = 7.89Abs(4∗5) = 434.74
Arctan(x) returns the arc tangent of element x in degrees.Examples:Arctan(7) = 89.788Arctan(7/6) = 87.365
Cos(x) returns the cosine of element x in degrees.Examples:Cos(5) = .57215Cos(5-6) = .73551
Exp(x) returns the exponential base e to the power of element x.Example:Exp(4) = .00037
Frac(x) returns the fractional value of the element x.Examples:Frac(4) = -.89Frac(6+7) = .95
Int(x) returns the integer portion of the element x.Examples:Int(7) = 270Int(5∗6) = 685
Ln(x) returns the natural log of element x.Examples:Ln(6) = 2.5217Ln(7/6∗5/1) = 2.4337
Sin(x) returns the sine of element x in degrees.Examples:Sin(7) = -.99996Sin(7-2+5) = .50603
NOTE

Section 10. Split
10-26
Spatial functions, included under Mathematical functions, operate on a perOutput Array basis. The average, maximum, minimum, and standard deviationof a specified group of elements within an array are calculated.
SpaAvg(x..y) returns the spatial average of elements x through y.Examples:SpaAvg(1..7) = 258.74SpaAvg(1,4,7) = 122.54
SpaMax(x..y) returns the maximum value of elements xthrough y.Examples:SpaMax(1..7) = 1200SpaMax(1,2,5) = 176
SpaMin(x..y) returns the minimum value of elements x through y.Examples:SpaMin(1..7) = -7.89SpaMin(1,2,5) = 55.1
SpaSd(x..y) returns the standard deviation of elements x through y.Examples:SpaSd(1..7) = 394.57SpaSd(5,2,1) = 49.607
Sqrt(x) returns the square root of element x.Examples:Sqrt(3) = 34.641Sqrt(3^ 2.0) = 1200
10.3.6.2 Time Series Functions, Details, and Examples
Time Series functions are used to perform vertical processing on selectedelements, such as calculating the average of an element over a specified rangeof data. Time Series results are output in three instances:
1. when a Trigger on Stop Condition (F option) is met
2. at the end of a data file (or within a range specified by Start and StopConditions)
3. when an interval count is met
When the Trigger on Stop Condition (or F option) is used, any time series datadefined in the Select line is output each time the Stop Condition is met. Refer toSection 10.3.3.2 for more information on the Trigger on Stop Condition.
Results which are output at the end of a file or a range of data are referred to asFinal Summaries. A typical select line that would produce a Final Summary is:
1,2,3,4,Avg(4)

Section 10. Split
10-27
This line would output values for elements 1 through 4 each time an array wasoutput. Additionally, an average value for element 4 would be calculated for theentire file and output as the last line of data in the output file.
1,2,3,4,Avg(4;24)
This line would output values for elements 1 through 4 each time an array wasoutput, and an average value for element 4 would be calculated every 24th arrayand output as an additional column in the file. An additional summary wouldoccur for an Interval Count if the count was not evenly divisible into thenumber of output arrays present in the Input File. The summary, in this case, iscalculated from an incomplete interval count.
The date( ) function can be used for the interval in a time series function toproduce monthly output. Refer to the Monthly summary example in Section10.3.5.3.
The interval count in a Time Series Function is optional and does not require adecimal point. To determine the interval, Split counts the number of arrayswhich meet the specified conditions (Stop, Start, and Copy). If the timesynchronize function is enabled, the Time Series functions remain synchronizedto the starting time even if a complete array is missing from the input data.When elements are missing, the Time Series calculations are based on theactual number of elements found.
Semicolons are used in Time Series functions to separate the elements orexpressions from the count which determines the interval. SmplMax andSmplMin require two elements separated by a semicolon. The first is checkedfor a maximum or minimum, while the second is sampled on the maximum orminimum.
The following set of weather data from Mt. Logan in northern Utah gives a totalof seven elements each hour. This Field Formatted output, with title andcolumn headers, was generated by Split. These data are used in the followingexamples of Time Series functions.

Section 10. Split
10-28
Mt. Logan Weather Data
Day Time Air RH Mean Mean Stdtemp Wind Wind Dev
deg Speed Vec ofF mph Dir Dir
178 100 58.56 17.42 5.855 338.3 6.562178 200 57.48 17.65 8.27 344.8 7.51178 300 56.85 17.76 7.75 330.8 5.065178 400 56.55 18.89 7.6 319.7 10.93178 500 56.57 19.6 10.41 307.3 4.23178 600 55.33 23.32 8.99 317.7 6.258178 700 55.95 24.79 9.52 322.3 4.609178 800 58.12 23.98 6.588 315.6 9.43178 900 59.79 23.46 5.458 312 15.32178 1000 61.09 24.12 4.622 299.3 18.3178 1100 61.34 25.03 5.926 303 17.26178 1200 60.61 27.46 6.815 309.7 18.71178 1300 61.01 25.44 8.35 310.2 18.37178 1400 60.93 25.48 10.92 317.5 12.68178 1500 62.3 23.79 8.43 310.6 19.21178 1600 63.75 24.31 8.88 321.4 15.22178 1700 66.15 22.45 7.97 341 17.77178 1800 67.33 23.06 6.758 344.1 20.74178 1900 66.59 24.75 7.08 341.8 16.09178 2000 64.52 26.03 8.76 337.2 14.91178 2100 59.84 27.45 11.81 305.4 12.36178 2200 56.19 35.46 15.62 316.7 19.01178 2300 55.48 38.8 17.12 338.7 11.41179 0 55.22 37.13 11.86 351.6 8.22
Avg(x;n) returns the average of element x over a full data set or everynth value.Examples:Avg(3) = 59.898 (average daily temp)Avg(3;4) = 57.36 (average 4 hour temp)56.493 (average 4 hour temp)60.708 (average 4 hour temp)61.998 (average 4 hour temp)66.148 (average 4 hour temp)56.683 (average 4 hour temp)
Blanks(x;n) returns the number of blanks or bad data in element x over afull data set or every nth value. Refer to Table 10.3-9 fordefinition of blank or bad data. Example:Blanks(3) = 0 (no holes in data set).
Count(x;n) returns the number of data points (non blanks) in element xover a full data set or every nth value.Example:Count(1) = 24 (24 data points in data set).

Section 10. Split
10-29
Blanks and Count are functions designed for checking theintegrity of the data file. A common use for these two functionsis “100.*BLANKS(x;n)/BLANKS(x;n)+COUNT(x;n)” whichgives the percentage of holes (bad data) in the file.
Max(x;n) returns the maximum value of element x over a full data setor every nth value.Examples:Max(5) = 17.12 (max WS for day)Max(5;12) = 10.41 (max WS for 12 hours)
17.12 (max WS for 12 hours)
Min(x;n) returns the minimum value of element x over a full data setor every nth value.Examples:Min(7) = 4.23 (min std. dev. of WS for day)Min(3;8) = 55.33 (min temp for 8 hours)
59.79 (min temp for 8 hours)55.22 (min temp for 8 hours)
RunTotal(x;n) returns a running total of element x for every line in the dataset. If an nth value is specified, a running total will be outputevery nth value.Example: RunTotal(5) =
5.8514.1221.8729.4739.8848.87:::166.76182.38199.50211.36211.36
Running total of hourly average wind speed provides up-to-the-hour wind run for that day. Because an nth value was notspecified, the Final Summary output, which is daily wind, isthe same as the "total" output.
Sd(x;n) returns the standard deviation of element x over a full dataset or every nth value.Examples:Sd(3) = 3.6593 (std. dev. temp for day)Sd(3;8) = 1.011 (Sd temp for 8 hours)
1.1182 (Sd temp for 8 hours)4.965 (Sd temp for 8 hours)
NOTE

Section 10. Split
10-30
Smpl(x;n) returns a sample of element x every nth value.Examples:Smpl(4;8) = 23.98 (RH every 8 hours)
24.31 (RH every 8 hours)37.13 (RH every 8 hours)
SmplMax(x;y;n) looks for a maximum value in element x and sampleselement y when the maximum is found. If an nth value isspecified then it outputs the sample on a maximum every nth
value, otherwise it outputs the sample on a maximum at theend of file.Examples:SmplMax(5;(3)) = 55.48 (on max wind speed sampletemperature)SmplMax(5;(3,6);8) = 56.57 307.360.93 317.555.48 338.7(on max wind speed sample temperature and wind directionevery 8 hours)
SmplMin(x;y;n) looks for a minimum value in element x and samples elementy when the minimum is found. If an nth value is specifiedthen it outputs the sample on a minimum every nth value,otherwise it outputs the sample on a minimum at the end offile. Examples:SmplMin(3;5) = 11.86 (on min temp sample wind speed)SmplMin(3; (5,6);8) = 8.99 317.75.458 31211.86 351.6(on min temperature sample wind speed and wind directionevery 8 hours)
Total(x;n) returns the total of element x over a data set or every nth
value.Examples: Total(5) = 211.36 (daily wind run)
WAvg(x;n) Returns the unit vector mean wind direction in degrees ofelement x (wind direction in degrees) over a full data set orevery nth value.Example:WAvg(6) =
323.14 (mean wind direction for the day)WAvg(6;4) =
333.41 (mean wind direction for 4 hours)315.73 (mean wind direction for 4 hours)306 (mean wind direction for 4 hours)314.92 (mean wind direction for 4 hours)341.03 (mean wind direction for 4 hours)328.09 (mean wind direction for 4 hours)
10.3.6.3 Special Functions, Details, and Examples
The Mt. Logan data set is used for the Special Function examples. Thesefunctions are helpful in converting time fields to formatted timestamps and

Section 10. Split
10-31
formatting the output. Since one of the main differences between array baseddata files and table based data files is the time format, these functions can beused to convert between file types.
If you are processing the data file in multiple passes includingformatting of the date and time fields, you should put the dateprocessing in the final pass. Split cannot read all of thetimestamp formats that it can produce. For example, the quotedtimestamp in table based data files has a specific structure. Anychanges to the structure will make the timestamp unreadable forSplit.
Crlf returns a carriage return and line feed where the Crlf isplaced in the parameter file.Examples:Smpl("Max Temp";24),Max(3;24),Smpl(Crlf;24),Smpl("Max RH";24),Max(4;24)= Max Temp 67.33
Max RH 38.8The Crlf is placed after the maximum temperature 67.33 sothat the maximum RH is on the next line.
A carriage return/line feed is recognized by Split as an element,and may throw the column headers off in the output file.
"Label" returns a comment in the output file. This is a usefulformatting function when labels are desired on the same lineas the data. The label includes anything within the quotemarks, the quote marks are not output but must be in theparameter file. The label cannot exceed the width of theoutput column (default is eight characters). A maximum ofthirty (30) labels are allowed per Select line.
Make sure that the column widths are big enough for thelabel to fit. Otherwise the output will indicate Bad Data.
Examples:"Max Temp" =
Max Temp (outputs Max TempMax Temp 24 times)...Max Temp
Smpl("8 hour ";8),Smpl("Max Temp";8), Max(3;8) = 8 hourMax Temp 58.568 hour Max Temp 63.758 hour Max Temp 67.33
NOTE
NOTE

Section 10. Split
10-32
This example samples the labels called "8 hour" and "MaxTemp" and looks for a Maximum temp for every 8 hourinterval.
Line numbers each line written to the report file or printer. Thisdiffers from the Count function in that Count looks at howmany lines were read.Examples:Line, 4, 5 =
1 17.42 5.8552 17.65 8.273 17.76 7.754 18.89 7.65 19.6 10.416 23.32 8.997 24.79 9.52
. .
. .
. .19 24.75 7.0820 26.03 8.7621 27.45 11.8122 35.46 15.6223 38.8 17.1224 37.13 11.86
Smpl (Line;8), Smpl (4;8), Smpl (5;8)1 23.98 6.5882 24.31 8.883 37.13 11.86
smpl(.PA,n) Outputs the data to the printer or .RPT file with n lines perpage.Examples:2, 3, Smpl (.PA;12) =
100 58.56200 57.48
. .
. .
. .1100 61.341200 60.61
Page 2 ---------------------------1300 61.011400 60.93
. .
. .
. .2300 55.48
0 55.22Date("format"; S; H; D; Y) Converts a datalogger's time stamp to adifferent format and encloses it in double-quotes (edate will produce a datewithout quotes). "Format" is a string which identifies how the date should beoutput. The "format" string is similar to the date format used by Windows. Seethe online help in Split to get a complete list of the format parameters.

Section 10. Split
10-33
S is the element number that contains seconds; H is the element number thatcontains hours/minutes; D is the element number that contains day; and Y is theelement number that contains the year. A constant can be used in place of anyof the element numbers (the constant must be a valid value for the type of datefield and include a decimal point; e.g., 2000.0 for the year). If only threeelements are specified, these will be assumed to be hour/minute, day, and year.
When using the Date function for a table-based datalogger (e.g., a time stamp inthe format "2002-02-03 21:16:00"), if the time stamp is the first element in thearray, a 1 is used for all of the time stamp elements (S; H; D; Y
If "serial" is entered for the "format" string, a serial date will be output.
In older versions of Split, the date( ) and edate( ) functions were limited toconverting the Julian day to a MM-DD format, with a syntax of date(doy;y)where doy = the element number for the day of the year; y = the elementnumber for the year. This older format is still supported.
Split will mark the date as Bad Data if the time and date resultingfrom the conversion will not fit in the specified column width.The on-screen display and the report file will precede the datewith asterisks. In the .PRN output file, Split uses the Bad Datastring.
Date Format Examples
Assume that in an array-based data file, element 2 is Year, element 3 is Day ofYear, element 4 is Hour/Minute, and element 5 is Seconds.
String Entered Output
date("mm/dd/yy, h:nn";5;4;3;2) "02/25/02, 4:10"
edate("mm/dd/yy, hh:nn";5;4;3;2) 02/25/02, 04:10
edate("dddd, mmmm d, yyyy";5;4;3;2) Monday, February 25, 2002
edate("'Date:' mmm d, yyyy";5;4;3;2) Date: Feb 25 02
If a time element is missing from an array-based data file, use a valid constantinstead.
NOTE

Section 10. Split
10-34
If processing a table-based data file, use a 1 for all time elements (assuming thetime stamp is the first element in the data file). For the examples above:
date("mm/dd/yy, h:nn";1;1;1;1) "02/25/02, 4:10"
edate("mm/dd/yy, hh:nn";1;1;1;1) 02/25/02, 04:10
edate(“yyyy”, “dayofyear”, “hhnn”;1;1;1;1) 2002, 56, 0410
Notice that this last example essentially creates an array-type of timestamp.
When processing a data file from an array-based datalogger, ifthe time stamp uses midnight as 2400 with "today's" date, thedate function will convert that time stamp to 0000 hours with"tomorrow's" date.
edate("format"; S; H; D; Y) edate( ) functions identically to date( )above, except that the time stamp is not surrounded by quotes.
Monthly Summary Example
The Date function can be used to produce a monthly summary of daily timeseries data by using Date( ) for the interval in the time series function. This willtrigger time series output for the first day of each month. The syntax isavg(7;date(3;2)), where you want to take a monthly average of element 7, andthe day of year is contained in element 3 and the year in element 2. If you havedata recorded on a once per minute or once per hour basis, it must first beprocessed into a 24 hour summary for this function to produce the outputexpected.
When Date and Edate are used within other functions they mustbe used with the older format Date(doy;y) and Edate(doy;y)instead of using the extended date functions. For exampleAVG(1;Date(3;2)). When used with table based data files theformat would be AVG(1;Date(1;1)).
When producing a monthly summary and outputting the month along with thedata, you might want to set up the value for the month as "month -1", tocorrectly reflect the month that the data actually represents.
NOTE
NOTE

Section 10. Split
10-35
Split Functions Example
The following is a parameter file that operates on the Mt. Logan data withseveral of the Split features being utilized. This first screen shows the input fileand the select criteria that was programmed. This example does calculationsbased on temperature and wind speed to determine the wind chill.

Section 10. Split
10-36
The following screen shows the output file setup including the column headingsand the units.
This .PAR file produces a wind chill summary of the Mt. Logan Peak data set.The formula for calculating wind chill is given as follows:
Te = 33-(h/22.066)where
Te = Wind Chill equivalent temperature, degrees Ch = ((100V)0.5 + 10.45-V)(33-T)
whereh = Kcal m-2 hr-1 wind chill indexv = wind speed in meters/secondT = temperature in degrees C
Note that at wind speeds between 0 to 4 mph (0 to 1.8 m/s), the wind chillshould be ignored because this formula results in wind chill temperatures thatare greater than the ambient temperature. The National Weather Serviceincludes wind chill in reports only when temperatures drop below 35°F(1.7°C).1 The formula is for example purposes and is not endorsed byCampbell Scientific as a standard.
When this .PAR file is executed, the following output is displayed on thescreen.

Section 10. Split
10-37
Wind Chill Report from Mt. Logan
Temp Wind H Wind Winddeg C Speed Chill Chill
m/s deg C deg F
14.756 2.6172 438.06 13.148 55.66614.156 3.6967 489.58 10.813 51.46313.806 3.4643 491.34 10.733 51.31913.639 3.3972 493.4 10.64 51.15113.65 4.6533 529.57 9.0005 48.20112.961 4.0185 530.58 8.9547 48.11813.306 4.2554 528.27 9.0596 48.30714.511 2.9448 456.04 12.333 54.19915.439 2.4397 414.97 14.194 57.5516.161 2.066 383.21 15.633 60.1416.3 2.6489 402.08 14.778 58.60115.894 3.0463 425.2 13.731 56.71516.117 3.7325 439.59 13.078 55.54116.072 4.8812 468.26 11.779 53.20216.833 3.7682 421.85 13.882 56.98817.639 3.9694 405.59 14.619 58.31418.972 3.5626 361.39 16.622 61.9219.628 3.0208 331.76 17.965 64.33719.217 3.1648 345.62 17.337 63.20718.067 3.9157 393.08 15.186 59.33515.467 5.2791 493.51 10.635 51.14213.439 6.9821 584.71 6.5016 43.70313.044 7.6526 607.86 5.4526 41.81512.9 5.3014 566.29 7.3368 45.206
Reference1 “Wind Chill Errors”, Edwin Kessler, Bulletin of the American MeteorologySociety, Vol. 74, No. 9, September 1993, pp 1743-1744.
10.3.6.4 Summary of Select Line Syntax Rules
• A fixed numeric value must include a decimal point "." or be in scientificnotation. There are some exceptions to this as noted below.
• Scientific notation has the format "mantissa E power of ten” (e.g., 3E5 =3 x 10⁵).
• Element numbers are entered without a decimal point.
• Commas separate Select line parameters (e.g., 2,3,(3+4)/3.2,6).
• Two decimal points are used to select consecutive elements betweenstarting and ending elements (e.g., 3..6, refers to the elements 3,4,5, and 6).

Section 10. Split
10-38
• A set is a group of two or more elements and/or expressions separated bycommas and enclosed by parentheses. No member of a set can includeparentheses. Therefore, a set cannot include a set or a function as one ofits members. For example:
VALID EXPRESSION INVALID EXPRESSIONArctan (2/3) Arctan ((2/3))Arctan (2/3, 3/4, 4/5) Arctan ((2/3, 3/4), 4/5)Arctan (COS(2)) Arctan (COS(2), COS(3))
• A single expression can operate on a set of elements. For example, theexpression (3..6,8)/2.0 is the same as 3/2.0, 4/2.0, 5/2.0, 6/2.0, 8/2.0;(3..6)/(2..5) is the same as 3/2, 4/3, 5/4, 6/5.
• The element or expression that is the argument of a math or Time Seriesfunction, must be enclosed in parentheses. A range of elements can bespecified, resulting in as many outputs as elements (e.g., Avg(3..5,7) willoutput 4 averages).
• Square brackets are used to enclose an allowable range for a value (e.g.,3[3.6..12] ) to indicate that the allowable range for element 3 is from 3.6 to12. Whole numbers within brackets do not require a decimal point. Table10.3-6 explains how values outside the specified range are treated.
• The interval in a Time Series function is optional and does not require adecimal point.
• Semicolons are used in Time Series functions to separate the elements orexpressions from the number that determines the interval. Sample onmaximum and sample on minimum require two elements or expressionsalso separated by a semicolon.
10.3.7 Output FilesTo create an Output File, click on the OUTPUT FILE tab. The file is created onthe default drive or directory unless the file name is preceded with an alternativedrive or directory. Use the Browse button to change directories.
Split will assign this file an extension of .PRN if an extension is not specified bythe user. Whenever an Output file name is entered, regardless of extension, anOutput file is created only when the RUN | GO menu option is selected.
If the Append check box is selected, the file created when Split is run will beappended to the end of an existing file with the same name. If the check box isnot selected, the existing file will be overwritten.
If this line is left blank, Split does not write data to an Output File on disk;rather, it will display the processed values on the screen if the Screen Displaybox is checked. If Screen Display is not enabled, no data will be displayed onthe Split RUN screen.

Section 10. Split
10-39
The Output file name cannot be the same as the Input filename. Split will display an error message if this conditionoccurs.
Several output options may be specified to alter the default output to the file.Some are located on the main OUTPUT FILE screen and some are madeavailable by pressing the Other button.
FIGURE 10.3-1. Output File Template
10.3.7.1 Description of Output Option Commands
File FormatThere are five File Format options to choose from: No File, Field, Comma,Printable, and Custom. If No File is chosen, then only the .PRN file is saved todisk. The Field, Comma, and Printable options produce files formatted as FieldFormatted, Comma Separated, and Printable ASCII, respectively. An example ofeach of these file types is given in Table 10.3-1 in the Input Files section.
The Custom file format uses the regional settings in the Windows operating systemto determine the decimal symbol and the separator used with data values. In theRegional Settings for Numbers, the decimal symbol uses the character specified inthe Decimal Symbol field; the separator uses the character specified in the ListSeparator field. These settings are typically found in Control Panel | RegionalSettings (or Options), Numbers tab. This allows users who are used to the comma“,” as the decimal and the period “.” as a data separator to see the output data inthat format.
CAUTION

Section 10. Split
10-40
Default Column WidthsThe Default Column Widths field is used to set the default width of thecolumns. Valid entries are 6,7,8, and 9. The initial width is 8. HighResolution Final Storage data requires a minimum column width of 8. Enteringa number in the Width row for each column overrides the default settings andsets the width of individual columns. If this field is left blank, the DefaultColumn Widths field is used.
Screen DisplayThe Screen Display field controls writing the processed data to the screen. Towrite to the screen, check the box. For faster execution, uncheck the box toomit writing to screen. The data will then be written to the file only.
ReportA report, with page and column headings, can be sent to a file or printer. Thereare three report options: File, Printer, HTML One or more can be selected. Areport sent to a file has the extension of .RPT. If the report is sent to a printer,the printer must be on-line. In all cases a .PRN output file is created. A basicHTML file can be created containing the formatted report data. The HTML filecan be used as a display of the formatted data output in a web browser.
To remove page breaks in the HTML file, enable the “No FF”option.
Other
The Other button provides access to the dialog box shown below.
FIGURE 10.3-2. Other Output File Options
It allows the following settings to be modified:
Replace bad data with - The text in the field, to the right of this option, isentered into the .PRN output file data set if data are blank, bad, or out of
NOTE

Section 10. Split
10-41
range. See Table 10.3-9 for definition of blank or bad data. Whatevertext string the user enters in the field will be entered if a blank or questionmark is in the data or if data are out of range. This option is useful whenthe Output file is imported into a spreadsheet program, such as Excel.
TABLE 10.3-8. Definition of Blank or Bad Data for each Data FileFormat
File Format Definition of Blank or Bad Data
Printable ASCII ????
Comma Separated ASCII blank or any character except numeral or space
Field Formatted blank or "" (double quotation marks)
Only display lines with bad data - Outputs only those arrays containingone or more Out of Range elements. If a report is generated, an asteriskprecedes the Out of Range value in the .RPT file.
Trigger on Stop condition - Changes the meaning of Stop Condition totrigger Time Series processing output. The Stop Condition is included inthe Time Series processing if it satisfies the Copy line.
If the Trigger on Stop Condition is selected, a Time Series output willoccur each time the Stop Condition is met. See Select line elements(Section 10.3.3.2).
Match files - This option compares two files of the same data. If gooddata exists in one and not the other (question marks), then Split will fill theOUTPUT file with the good data. This is used to get a more completerecord from an error ridden file (e.g., one recorded at freezingtemperatures by reading a tape twice and running both files through Split).
For the Match files option to produce a correct Output File,the differences between the two Input Files can only bequestion marks. Both files must have the same StartCondition or the beginning of both files must be the same.
Transpose file - Transposes the rows and columns of the input file. Onlyone Input File can be transposed at a time and no Select options can bespecified. A maximum of 26 arrays are transposed per pass of Split.
To transpose a file containing more than 26 arrays, several passes arerequired. Change the Output file name and Start Condition for each pass.Split may then be used to merge the multiple files.
No FF – Suppresses form feeds and page breaks in RPT and HTML files.When this option is selected, a header appears on the first page only. Thisoption is used for printing reports on continuous feed paper or fordisplaying HTM files in a browser.
Break arrays - This option breaks up the Output Array into new arraysthat are #+1 elements in each new array. Split automatically assigns an
CAUTION

Section 10. Split
10-42
array ID number equal to the first element in the first array. Only oneInput File may be specified. Start, Stop, and Copy Conditions may bespecified, but the Select line must be left blank.
The Break Arrays function works only for array-based data. It istypically used when processing data from burst measurements.
10.3.7.2 Report Headings
A report is output to a printer or file with the extension .RPT. Headings are notincluded in the standard output to disk (.PRN or user named extension outputfile). However, a report can be labeled with a header by entering text into theReport Heading field. A report heading can have several lines, but it is limitedto a total of 253 characters including backslashes and carriage returns. “\”characters break the report heading into multiple lines.
When Time Series functions are used in the Select field without an interval,they appear as a final summary at the end of the report. They can be labeled byentering a title into the Time Series Heading field at the bottom of the OutputFile page. Time Series interval summaries cannot be assigned individual titles.
“PCDATE” within the Report Heading inserts the computer's current date(Month-Day-Year). For the European format (Day-Month-Year), enter“PCEDATE”.
10.3.7.3 Column Headings
Up to three lines per column can be entered as column headings. Theseheadings are limited to a length of one less than the Output field width.
Column headings associated with Time Series outputs are repeated for FinalSummaries if a title for the Final Summary is requested on the headings forreport line.
The number of digits to report to the right of the decimal point is entered in theDecimal field and can be set independently for each column. The value outputwill be rounded to the specified number of digits. Leave this field blank if youdo not want to round the data to a specific number of digits.
10.4 Help OptionOn-line Help is available from any location in Split. Simply select the area ofSplit in question and press <F1>. Split also offers a brief on-the-fly Help.Place the cursor on the area of Split in question; after a moment a briefdescription is displayed in the hint line of the Split window (bottom left).
10.5 Editing CommandsSplit supports the Windows Cut, Copy, and Paste commands. Text from anyfield in Split or other Windows applications can be Cut, Copied, or Pasted.
NOTE

Section 10. Split
10-43
10.6 Running Split From a Command LineExisting parameter files can be executed using Splitr.exe which is a "run-time"version of the Split Report Generator. When Splitr.exe is run, the file isprocessed as if the user chose Run | Go from the Split menu. Splitr.exe can beexecuted from a Task in LoggerNet, from a batch file, or from a Windowscommand line prompt.
10.6.1 Processing Alternate FilesSplitr allows the user to select different input and/or output files for an existingparameter file by entering them on the command line after the parameter filename. For example:
“Splitr LOGAN.PAR/R TEST.DAT TEST.PRN”
Replaces the Input and Output file names in LOGAN.PAR, with TEST.DATand TEST.PRN, respectively.
A space must be used to separate command line parameters. Splitr uses as manyentries as exist on the command line. However, the command line has a limit tothe number of characters it can accommodate—this limit is operating systemdependent. The parameters must be in the following sequence: Input filename, Output file name, Start Condition, Stop Condition, Copy Condition, andSelect. A comma space comma should be inserted for any parameter notspecified.
If a parameter is to be left as it is in the parameter file, space comma space ( , )may be entered in the command line. For instance, if the parameter fileLOGAN.PAR contained TEST1.DAT as an input file name, the followingcommand line would leave the input file TEST1.DAT and change the outputfile to TEST.PRN.
“SPLITR LOGAN/R , TEST.PRN”
10.6.2 Processing Multiple Parameter Files with One CommandLine
More than one .PAR file can be executed with a single Splitr command line.Each .PAR file and its associated parameters are separated from the next .PARfile by a semicolon with one space on each side ( ; ). For example:
“SPLITR LOGAN/R TEST.DAT TEST.PRN ; SINKS/R TEST1.DATTEST2.DAT 1[189]”
executes the LOGAN.PAR file on TEST.DAT and outputs the results toTEST.PRN, then executes the SINKS.PAR file on TEST1.DAT and outputs theresults to TEST2.DAT. Execution of SINKS.PAR starts when the first elementin TEST1.DAT is 189.
10.6.3 Using Splitr.exe in Batch FilesBatch files containing one or more Splitr command lines can be useful forautomating data processing. Batch files can be executed manually or by settingthem up as a Task in the LoggerNet Setup window.

Section 10. Split
10-44
Batch files process each command in succession, without waiting for executionof a command to be completed before proceeding to the next unless they areconfigured to do so. If multiple parameter files are being processed using Splitrin a batch file, there are no conflicts because only one copy of Splitr can beactive at any one time (unless the /M switch is used. Refer to the informationbelow on this option.). However, if other commands are used along with Splitr(such as opening the file in a spreadsheet, copying it to an archive directory, orappending it to an existing file) these commands might be executed beforeSplitr finishes processing data.
The Windows 95/NT Start /w (wait) parameter is added to a batch filecommand line to delay execution of the next command until the first commandhas finished. The syntax for this type of command line is:
Start /w Splitr LOGAN/R
By adding the Start /w parameter to the command line that initiates Splitr, nofurther commands will be processed until the LOGAN.PAR file has finishedexecution.
10.6.4 Command Line SwitchesSplitr has three switches that can be used to control how files are processed.
10.6.4.1 Closing the Splitr.exe Program After Execution (/R Switch)
Typically when Split is run, after the file is processed the user must close theScreen Display window. When Splitr.exe is run from a command line, the usermust also close the Screen Display window unless the /R switch is used.
The syntax for this switch is:
SPLITR LOGAN/R
where LOGAN is the parameter file name.
The /R switch should follow immediately after the parameter file name with nospace between the two. If a space is used, the following message will bedisplayed "There was a problem opening the input file. File could not be foundor may be in use."
10.6.4.2 Running Splitr in a Hidden or Minimized State (/H Switch)
Splitr can be run in a minimized state, so that the Screen Display window doesnot interrupt other processes on the computer. The syntax for running Splitrminimized is:
SPLITR /H LOGAN
where LOGAN is the parameter file name.
The /H switch must be positioned after SPLITR but before the parameter filename, and a space is required between the executable name and the switch.

Section 10. Split
10-45
10.6.4.3 Running Multiple Copies of Splitr (/M Switch)
Multiple copies of Splitr can be run at one time by using the /M switch. Thisswitch must appear immediately after Splitr. For instance, a batch file orLoggerNet task containing the lines:
SPLITR /M Logan/RSPLITR /M Sinks/R
will open two copies of Splitr and process the two files simultaneously.
When using the /M switch in a batch file under Windows NT,you must begin each line of the batch file that runs an instance ofSplitr with the "start" command. Otherwise, NT will wait untilthe first Splitr command has finished before proceeding to thenext.
This is a blank page.
NOTE

Section 10. Split
10-46
This is a blank page.

11-1
Section 11. ViewThe View screen provides a way to look at the data LoggerNet collected from thedataloggers. It will open data files (*.DAT, *.PRN, *.CSV), saved in a variety of formatsincluding files from array-based and table-based dataloggers. View can also open otherCSI file types (*.DLD, *.CSI, *.PTI, *.FSL, *.LOG, *.CR5, *.CR9).
Data can be viewed numerically, and up to two fields can be plotted on a graph. Bothnumeric data and graphs can be sent to a printer. Graphs can be saved to disk in BMP,WMF, or EMF format.
11.1 OverviewThe View button on the LoggerNet Toolbar brings up the file view program.This program can be used to look at any data file collected by LoggerNet fromdataloggers and storage devices, regardless of the format (comma separated,table oriented ASCII, binary, or printable).
Once a file is opened, data can be printed, graphed, or displayed in ASCII,tabular, or hexadecimal format. However, since View is primarily a fileviewing utility, a file cannot be edited or saved using this program.
11.2 Opening a FileView provides two ways to open a file. The one you use depends on the type offile. Use File Open to open a data file and File Open as Text to openother types of files.
Files with a particular extension can be configured in Windows to be opened byView automatically when double-clicked in Windows Explorer. Refer toSection 11.6.2 Assigning Data Files to View for more information.
11.2.1 Opening a Data FileTo open a data file, click the File Open icon or select File | Open from themenu. Any data file type stored by LoggerNet can be viewed: commaseparated, printable ASCII, binary, or Table Oriented ASCII (TOA). Thedefault file extension is DAT, but PRN and CSV files can also be opened inthis mode. (Opening files of types other than these may cause unexpectedresults in View.)
View will try to assign a time/date stamp automatically whenopening a data file. Therefore, it may take some time tocompletely open a large file.
When an array-based data file is opened in this mode View will automaticallyassociate an FSL file with a matching name if one exists in the active directory(see Final Storage Label below). If a matching FSL file does not exist, a boxwill appear asking whether or not you want to select one. When an FSL file is
NOTE

Section 11. View
11-2
associated with a data file, View uses information from the file to provide labelnames for the Data Panel column headings and Chart Panel traces. For moreinformation, refer to Section 11.2.3 on FSL files.
Table Oriented ASCII (TOA) files do not use FSL files. Thedata labels for each column of data is included as part of the datafile.
View can be run as a stand-alone program by double-clicking the View.exe filein Windows Explorer. This will allow you to open larger data files withoutmemory errors.
11.2.2 Opening Other Types of FilesTo open a file that is not a data file (e.g., *.DLD, *.CSI, *.PTI, *.FSL, *.LOG,*.CR5, or *.CR9) press the icon or select File | Open As Text from themenu. Files opened in this mode are not processed for time stamps, and thuscannot be graphed or displayed in the tabular format. .
A file opened in this mode can be viewed only in its original format or in hexmode. The Array Selection, Array Definitions, Tab options, and Graph Viewoptions do not work. This mode is most often used to open files other than datafiles (or to quickly open data files, but without any of View's graphing or timestamping capabilities). In Text Mode, data can be copied to the Windowsclipboard and pasted into other applications.
11.2.3 Final Storage Label (FSL) FilesA final storage label (FSL) file is created by Edlog when an array-baseddatalogger program is compiled. It provides information about the outputtables in the program and the labels associated with each output instruction.The information in this file is used by View for column headers and to assigndate and time values. To add or change an FSL file association, press the fileopen icon to the right of the FSL File field and select the desired FSL file.
View uses information from the *.FSL file to provide label names for the DataPanel column headings and Graph Panel traces. After choosing a data file fromFile | Open, View will handle the FSL association in one of the following ways:
1) If an FSL file exists that has the same name as the data file, Viewautomatically uses that FSL file.
2) If no FSL file exists with the same name, View will prompt you to select anFSL file. If you choose to select an FSL file, another file dialog box appears soyou can select the FSL file. If you choose not to select an FSL file, View willstill open the file. Selecting an FSL file allows column headers and time stampsto be displayed.
3) If you have opened a file before, View keeps track of what option you chosefor the FSL the first time it was opened, and opens it with that FSL option. Itkeeps this information for the last 50 files.
NOTE

Section 11. View
11-3
When viewing numeric data in the Data Panel, if more than onearray ID exists in the data file, View will display the header forthe last array that has been selected with the mouse pointer.
Table Oriented ASCII (TOA) files do not use FSL files. Data label informationis included directly in the data file.
11.3 Data PanelData Panel is the text display for data files or other files opened by View. Datacan be viewed as comma separated values, tab separated values in columns orin hexadecimal format.
ArraySelection
File OpenOptions
PrintingOptions
Text ViewOptions
ArrayDefinitions
Graph ViewOptions
11.3.1 Array SelectionWhen a data file is first opened, all the arrays in that file will be displayed inthe Data Panel. You can display, print, or graph elements from only one arrayby picking the array from the Array Selection list. This essentially acts as afilter so that all other arrays are hidden from view.
In the Array Selection list, there are two symbols that can precede the arraysdisplayed in the list. The check mark indicates the array is in the FSL file andis found in the data file being viewed. The X indicates the array is in the FSLfile but is not found in the data file. If no symbol precedes the array, the arrayis in the data file but is not listed in the FSL file.
NOTE

Section 11. View
11-4
Array Selection only applies to array-based dataloggers (CR510,CR10X, CR23X). Table-based dataloggers only store data forone table in each data file. CR5000, CR9000, and CRxxx-TDdataloggers store data in a table-based format.
11.3.2 Text View OptionsBy default, the Data Panel information is displayed in ASCII format (commaseparated, printable ASCII, and TOA files are displayed in the format theywere saved to disk; binary files are interpreted into ASCII format). Press thehexadecimal button on the toolbar to display the text as hexadecimalcharacters. This button is a toggle, so if you press it again the display willreturn to the default view. You can also display the text as hexadecimalcharacters by selecting View | Hex from the menu.
Data displayed on the Data Panel can be changed to an adjustable-tabularformat by pressing the tab button, or selecting View | Expand Tabs. The tabbutton is a toggle that turns the tabular display on or off. The column widths ofthe adjustable-tabular display can be changed by typing a number directly intothe combo box, or selecting the up or down arrow to change the value. Therange for the tab width is 8 to 27 character spaces.
The tabular format is unavailable for files opened using Open AsText.
11.3.3 Changing the FontThe font used for the text display can be changed with the font selection dialog.Click on the Font button or select View | Font from the menu to change the fontused for the printer and Data Panel display.
Only fixed width fonts can be selected to allow the data columns to line up.Typical fonts include Courier, Courier New, Fixedsys, Lucida Console, MSLineDraw, and Terminal. Normal font options such as color, bold, underlineand italic are also available.
11.4 Graph PanelThe Graph Panel is used to display a line graph of one or two data values. Thevalues to graph are selected in the Data Panel by clicking on one column andthen holding the <ctrl> key down while clicking on the second. The selectedcolumns will be highlighted in blue and red.
The Graph Panel is unavailable for files opened using Open AsText.
You choose the type of graph by the button you click on the Data PanelToolbar. Click the single axis graph button and the graph will be displayedwith only one vertical axis. Click the two axis graph button and the graph willbe displayed with two axes, one on each side.
NOTE
NOTE
NOTE

Section 11. View
11-5
The scale for the graph axes defaults to automatic. The upper and lower limitswill depend on the range of values in the selected data.
Graph Panel Options
The following options are available to set up how the Graph Panel displays theline graph. These options are available by clicking on the buttons at the top ofthe graph. Let the mouse cursor hover over a button for a few seconds to see apop-up hint describing the button’s function.
Graphs two traces on the same Y-axis.
Graphs one trace on the left axis and the other on the right.
Invokes the Print Preview screen. Paper orientation and margins can beadjusted and the graph can be printed.
Forces the Chart Panel to be on top. This button is toggled on or off tokeep the Chart Panel in front of other windows.
Forces the Data Panel to be on top. This button is toggled on or off tokeep the Data Panel in front of other windows.
Saves the graph to a file in BMP, WMF, or EMF format. The file typeis selected using the Save as Type option at the bottom of the Save As

Section 11. View
11-6
dialog.
Brings up the Customize Chart dialog that allows you to set theproperties of the Y axes.
Allows you to set the number of points that are displayedacross the width of the graph. Select the arrow to the right ofthis field to invoke a drop-down list box to select the numberof points.
Data Labels Feature
Data Labels allow you to get the exact numeric value andtimestamp for a data point on the graph. Click on a data pointto display a data label for that point. One data label isdisplayed for each trace on the graph.
Zoom Feature
The Zoom feature allows you to zoom in on a particular area ofa graph by holding the left mouse button and dragging themouse cursor from left to right over the area to be zoomed. Toreturn to normal view, click the Zoom Cancel button or holdthe mouse button and drag the cursor from right to left.
Returns a zoomed graph to normal view.
You can use the scroll bar at the bottom of the graph to scroll forward orbackward in time.
11.5 Printing OptionsAll printing is done through the Print Preview screen. Bring up the screen byclicking on the Print Preview button. Print Preview for the Data Panel willdisplay the pages of text as they will be printed. You can view any of the pagesand select the pages you want to print.

Section 11. View
11-7
11.5.1 Printing TextTo print numerical data, press the Print Preview button or select File | PrintPreview from the menu. From Print Preview you can browse among the pagesthat will be printed and change the paper orientation if desired. You can zoomin on a particular area of the previewed page by left clicking on the page. Toreturn to normal view, right click on the page, or choose the Page Width or theFull Page icon. Simply press the print button on the toolbar to print one ormore pages. See the online help for details of the Print Preview options.
11.5.2 Printing GraphsWith the Chart Panel window opened, click on the Print Preview to preview theprinted page, and then select the Print button to print the graph. You can alsoright click on the graph to bring up a menu from which you can select PrintPreview. The preview screen allows you to set options for the margin on thepage and whether to use portrait or landscape paper orientation.
11.6 Advanced Topics
11.6.1 Assigning Data Files to ViewWindows will let you assign the program with which a particular file type willbe opened based on that file's extension. When a file with an assignedextension is double-clicked, it will be opened with the associated program.You may want to associate *.DAT files with the View program for quickopening of data files. This association can be made by selecting View |Options | File Types from the Explorer menu.
Only one association can be made for each file type. If the*.DAT file is assigned to another program, you must remove thisassociation before the new association can be made.
NOTE

Section 11. View
11-8
11.6.2 Array Definitions (Array-based dataloggers only)
The Array Definitions button on the toolbar brings up the Array Definitionswindow. You can use this window to manually assign correct time and datestamps to an array-based data file, or to change or add an FSL file association.
When you bring up the Array Definition screen, View will attempt toautomatically assign elements from the selected array to the date and timevalues if they exist in the data file.
If these elements are not assigned automatically, you can assign valuesmanually. Click anywhere in the Year, Day, Time, or Seconds box, and in thesecond column, you can choose to assign no element, an element from the datafile, or a fixed value to any of the date and time values.
When the Array Definitions window is opened, if one of the top lines of thiswindow reads "No array selected", click on a text element in your data file forthe array you want to assign values. View will automatically assign elementsfrom the array to the year, date, and time values if your file's date and timevalues are at the beginning of the array and are in descending order (i.e., day isbefore time) and they are not separated by any non-date or non-time elements.The assigned date and time values will most likely be correct for files of morethan a few hundred lines.
In this window, you can assign a *.FSL file (final storage label file) to the datafile if one was not assigned when the data file was first opened. Enter a file

Section 11. View
11-9
name into the FSL file name field to make this assignment. View will then useinformation from the *.FSL file to provide label names for the Data Panelcolumn headings and Chart Panel traces. For more information, refer to FSLfiles section 11.2.3.
This option is unavailable for files opened using Open As Textand for TOA Files. (TOA files do not use FSL files. Columnheader information is included directly in the data file.)
NOTE

Section 11. View
11-10
This is a blank page.

12-1
Section 12. Real-Time Monitor andControlThe Real-Time Monitor and Control (RTMC) software provides the ability to create andrun graphical screens to display real-time data as LoggerNet collects it from thedataloggers. Controls are also provided to view and set datalogger ports and flags alongwith the data in settable variables. For graphical displays that can show historical data,such as line charts, RTMC will bring in and display the historical data available inLoggerNet’s data storage. RTMC also provides expressions to condition the collecteddata for display (e.g., convert temperature in Celsius to Fahrenheit).
RTMC creates files that can be used with RTMC Run-Time on another computer that isconnected to the LoggerNet computer by a local area network (LAN) or the Internet.
12.1 OverviewReal-Time Monitor and Control is an application that allows the user to quicklycreate graphical display screens that monitor real-time data, control set points,and toggle ports and flags. RTMC can combine data from multiple dataloggerson a single display. As LoggerNet collects data from the dataloggers, thedisplays in RTMC are automatically updated.
RTMC has two operating modes: Development and Run-Time. TheDevelopment mode allows you to create and edit a real-time graphic displayscreen to display the data collected from the dataloggers. Once the screen isbuilt and saved as a file, the screen can be displayed using RTMC Run-Time.This allows graphic display screens to run on other computers with just theRTMC Run-Time program.
12.2 Development ModeRTMC Development is a graphic display editor that allows the user to easilyplace graphical components on the display screen and connect them to datavalues.
The RTMC Development window, as shown below, has three sections.
Project Component List - The panel on the left shows the hierarchy of thedisplay components and how they are associated with each other. Everycomponent of the display screen is shown in this list and it provides a shortcutto get to any graphical component.
Project Workspace - The middle panel is the display screen workspace. Thegraphic components are placed in the workspace, as they should appear on thefinal display.
Display Components List - The panel on the right contains the display screencomponents that can be placed in the workspace. Selecting a component and

Section 12. Real-Time Monitor and Control (RTMC)
12-2
clicking in the workspace places the component and brings up the Propertieswindow for that component.
RTMC was designed to be easy and straightforward to use. Experiment withdifferent combinations and options to get the display results you are lookingfor.
As seen in the example screen above, different types of graphic components canbe combined to create an attractive real-time display. Company logos, maps, orany image stored in a standard graphic file format can be placed on the screen.Many images have been included with RTMC and others can be added asneeded.
12.2.1 The RTMC WorkspaceThe RTMC workspace is a fixed size container for holding one or more displayscreens. As new display screens are added they appear as tabs in the project.The display screen is a container for the various display components that makeup each tab of the real-time display.
12.2.2 Display ComponentsDisplay components are the objects that are used to display data. To add acomponent to the workspace, click on an item in the Display Components Listin the RTMC window and then click anywhere in the workspace. The

Section 12. Real-Time Monitor and Control (RTMC)
12-3
component’s Properties window is automatically displayed when the object isfirst placed in the work area. The Properties window is used to set colors, scalevalues, text, etc., and to assign the data value to be displayed by the component.
When a display component is linked to a data value, the valuewill be automatically updated on the display when data iscollected by LoggerNet. If data collection is not set up inLoggerNet or the selected data value is excluded from collection,the values will not update. Input locations, ports and flags forarray based dataloggers are collected at the scheduled collectioninterval or any time a custom collection is done.
After a component's properties have been set, select Apply to enable thechanges, or Apply & Close to enable the changes and close the Propertieswindow. Once the link to the data value has been applied, if there is dataavailable from LoggerNet for the component, the value on the display willupdate.
To make changes in display component settings, the Properties window can beinvoked by double clicking the component. If you make changes to acomponent’s properties but then decide to reject those changes, press theCancel button to return the properties to the last applied state. If Cancel isselected when a component is first placed in the work area (and Apply or Apply& Close has not been pressed), the display component will be removed fromthe screen.
Available Components
The following is an overview of the display components available. The onlinehelp has detailed information about each of the components and theirproperties.
Pointer returns the cursor to a normal selection tool.Several components can be moved as a group, by selectingeach with the pointer while holding the Ctrl key, anddragging them to a new position. A group of componentscan also be selected by dragging a box around them.
Status Bar is used for displays such as a thermometerwhere the height of the colored bar is based on the datavalue. You can set high and low values, bar color andplacement on a background graphic.
Numeric displays the selected data value as a numericvalue. You can set the font size and type along with thenumber of decimal points and a units label.
Alarm is used to set up a display component that changesappearance when an alarm condition occurs. You can setthe normal and alarm graphics, the alarm set point, and asound file to play when the alarm occurs. In run-time mode,right clicking the component with your mouse, and selecting
NOTE

Section 12. Real-Time Monitor and Control (RTMC)
12-4
Acknowledge Alarm will disable an audible alarm.
Slider is used to display a value as a point on a scale. It canalso be used to set the value of an input location or Publicvariable. You can set the color, background graphic and theupper and lower limits.
Label is text that can be used to put titles or labels on thegraphic components.
Toggle is used to display the value of flags, ports, or otherboolean data that can take one of two values. In run-timemode, it can be used to set a port, flag or boolean value.Any non-zero number is On or True and zero (0) is Off orFalse. In run-time mode, right click a toggle to change itsstate. The option to change the state of a toggle with adouble click can be enabled in the Properties window. Youcan set the two graphic images and separate locations to setand read the value.
Image is used to place graphic images on the display. Mosttypes of graphic image file formats are supported includingGIF, JPG, TIF, PNG, and BMP. You can set the angle ofrotation if you want the graphic at an angle or turnedsideways.
Graph is used to display a line graph of one or more datavalues. The time stamp on the X axis reflects the PC clock.Note that a difference in the PC clock and the dataloggerclock, coupled with a small time window for the graph,could result in no data being displayed. You can addmultiple traces to the graph, set the background, set rightand left axis scales, and colors for traces.
ComCheck is used to provide a visual and/or audible alarmwhen data collection has failed a sufficient number of timesto put the datalogger into a Primary or Secondary Retrymode. In run-time mode, right clicking the component withyour mouse will disable the audible alarm.
Time is used to display time and date. You can set optionsto display the server time, server time at last data collection,station time, station time of last record stored, or PC time.
SetPoint is used like the Numeric component to display theselected data value as a number. When linked with an inputlocation or Public variable in run-time mode, the data valuecan be set to a new value by double clicking the componentand entering a new value in the resulting dialog box.
Gauge is used to display the selected data value on acircular gauge. You can set the maximum and minimumscale along with the maximum and minimum pointer

Section 12. Real-Time Monitor and Control (RTMC)
12-5
position.
TableDisplay is used to display the data from a dataloggerin a row and column format. For array based dataloggers,the data for one array ID is displayed. For table baseddataloggers, the data from one table is displayed. You canset the time format for the timestamp displayed next to eachrecord.
A popup description of each field in a component’s Propertieswindow can be displayed by pressing F1 while that field has thefocus. Use the tab key or click with the mouse to select a field.
12.2.3 RTMC OperationsAll of the RTMC operations are available from the menus at the top of theDevelopment window. Many of the options are also available as buttons on thetoolbar, or by right clicking on the components or other parts of the window.Operations that have toolbar buttons will have the button icon shown next tothe description below.
File Menu
New Project starts a new RTMC project. The currently openedproject will be closed. If there are changes that have not been savedthe user will be prompted to save changes.
Open brings up the File Open dialog to open a previously savedproject.
Save will save the changes in the current project to the RTMC projectfile. If this is the first time the project has been saved, a Save As dialogwill open to select the file name and directory for the project file.
Save As brings up the Save As dialog to save the current project withanother name or in a different directory.
Exit closes RTMC. If there are unsaved changes, the user will beprompted to save changes before exiting.
Edit Menu
Undo cancels the last change made to the project.
Redo repeats the change that was just undone.
Cut/Copy/Paste are standard editing operations to take selected objects to aninternal clipboard and paste back into RTMC.
Cut/Copy does not go to the Windows clipboard so these objectsare not available to paste into other applications.
NOTE
NOTE

Section 12. Real-Time Monitor and Control (RTMC)
12-6
Project Menu options work with the whole project or workspace.
Change Workspace Size allows you to specify the size in pixels of the run-time display screen. Default is 640 x 480.
Change Server Connection allows you to connect to a LoggerNet server onthe same or a remote PC. The server name is the network name or IP addressof the computer where LoggerNet is running. If you are connecting to a versionof LoggerNet that supports server security, and security is enabled, you willneed to enter the username and password. (LoggerNet 2.0 does not supportsecurity.) The port number should always be 6789.
Enable Connection Management tells LoggerNet to try and maintain anactive communications link with the dataloggers for which data is beingdisplayed by RTMC. This might be beneficial if you are trying to display datain RTMC with a fast update rate, over a communications link that takes time toestablish (such as a phone modem).
Rename Project changes the name of the project as shown on the componenttree.
Screen Menu options work with the tabbed screens in the project. The ScreenMenu is also available by right clicking on any blank area of the workspace.
Screen Properties brings up the dialog to choose the background image for thecurrent screen.
Add Screen adds a new screen to the project. Each screen appears as a tabbedpage on the display. When the project is run the user can click on the tab tobring each screen to the front.
Delete Screen removes the current screen from the project. If there arecomponents on the screen, they will also be removed.
Rename Screen brings up a dialog to change the name of the current screen.This is the name that appears on the screen tab in run-time mode.
The Component Menu is used to set the component properties, placement andalignment. The Component Menu is also available by right clicking on any ofthe components in the workspace.
Component Properties brings up the Properties window for the selectedcomponent.
Rename Component lets you change the name of the component in the listtree.
Delete Component Selection removes the selected component from theworkspace.
Insert brings up a submenu allowing you select one of the components toinsert on the screen. When the component is added to the screen the Propertieswindow for the new component will come up.

Section 12. Real-Time Monitor and Control (RTMC)
12-7
Align provides some options for lining up a group of components with the firstcomponent selected. Select two or more components by using the cursor toclick and drag a bounding box around the desired components. Componentscan also be selected by selecting the first component and then selecting theother components while holding down the <ctrl> key. With the componentsselected choose one of the alignment options. The components will be alignedbased on the first component selected. The first component is identified by thedark red boundary. The other selected components have a light red boundary.
Be careful about the alignment you choose. Selecting Top Alignfor a group of components that are arranged vertically will causeall the components to end up on top of each other.
Top Align lines up the selected components to the top of the firstcomponent selected.
Bottom Align lines up the selected components to the bottom of thefirst component selected.
Left Align lines up the selected components with the left side of thefirst component selected.
Right Align lines up the selected components with the right side of thefirst component selected.
Size allows you to set two or more objects to the same overall size, width orheight as the first object selected. Select one or more components by using thecursor to click and drag a bounding box around the desired components. Thecomponents can also be selected by selecting the first component and thenselecting the other components while holding down the <ctrl> key. The firstcomponent is identified by the dark red boundary. The other selectedcomponents have a light red boundary.
Copy Size makes all the selected components the same size as the firstcomponent.
Copy Width makes the width of the selected components the same asthe first component.
Copy Height makes the width of the selected components the same asthe first component.
Ordering is used to manage the position of graphic objects on the workspace.Displays are often a combination of a background graphic and data displayobjects in front. Objects added to the workspace are, by default, placed on topof any existing objects. These operations are used to determine the order inwhich objects are displayed.
Bring to Front brings the selected component in front of all otherdisplay objects.
Send to Back places the selected component behind all of the other
NOTE

Section 12. Real-Time Monitor and Control (RTMC)
12-8
display objects.
Move Forward in areas where multiple objects are layered, brings theselected object forward ahead of display objects in the next layer up.
Move Backward in areas where multiple objects are layered, movesthe selected object in back of display objects in the next layer down.
Run-Time Menu is used to Save and Run Current Project. This willsave the project and start RTMC Run-Time to display the project.
Help Menu provides access to help for all of the features of RTMC.In Contents you can find an introduction and overview of RTMC aswell as detail descriptions of all of the display properties andoperations. The Index allows you to look up help topics based on akey word.
12.2.4 ExpressionsRTMC has a built-in expression interpreter that allows the user to condition thedata or create displays based on calculations on a data point.
The components that display data values (Status Bar, Numeric, Graph, andGauge) can be processed using mathematical expressions. For instance, atemperature reading in degrees Celsius can be processed to display in degreesFahrenheit using a mathematical expression.
An expression is entered for a component by first selecting the data value in theSelect Data field, and then entering the mathematical expression after thedefined data value. Using the above example, if the data value is defined asCR5000.TempData.Temp1 (datalogger.table.variable), you would enter
“CR5000.TempData.Temp1”*1.8+32
to convert the temperature reading from degrees Celsius to degrees Fahrenheit.
The data values from different dataloggers can be combined to form theexpression. Data values are referenced as in the above example by dataloggername as it appears in the Setup screen, followed by the table name or array ID,followed by the data label. An array-based example would beCR10X_2.109.BattV. (datalogger.arrayID.input location)
Spaces must be used before and after the predefined constantsand functions. Operators do not require spaces.
NOTE

Section 12. Real-Time Monitor and Control (RTMC)
12-9
12.2.4.1 Operators
Operator Description
( ) Prioritizes parts of an expression within the larger expression.
* Multiply by
/ Divide by
^ Raised to the power of
+ Add
- Subtract
= Equal
<> Not equal
> Greater than
< Less than
>= Greater than or equal to
<= Less than or equal to
12.2.4.2 Predefined Constants
Constant Description
e 2.718282
PI 3.141593
True -1
False 0
12.2.4.3 Functions
The following functions show the use and placement of the numbers thefunction operates on. The parentheses are not required unless there are two ormore parameter values. (e.g., ATN2(y,x))
Function Description
ABS(x) Returns the absolute value of a number.
ACOS(x)Returns the arc cosine of a number.
(x)AND(y) Performs a logical conjunction on two numbers.

Section 12. Real-Time Monitor and Control (RTMC)
12-10
ASIN(x) Returns the arc sine of a number.
ATN(x) Returns the arc tangent of a number.
ATN2(y,x) Returns the arctangent of y/x.
COS(x) Returns the cosine of a number.
COSH(x) Returns the hyperbolic cosine of a number.
CSGN(x) Changes the sign of a number by multiplying by -1.0.
(x)EQV(y) Performs a logical equivalence on two numbers.
EXP(x) Returns e raised to the x power.
FIX(x) Returns the integer portion of a number. If the number is anegative, the first negative integer greater than or equal tothe number is returned.
FRAC(x) Returns the fraction part of a number.
IIF(x,y,z) Evaluates an expression (x) and returns one value if true (y),a different value if false (z).
(x)IMP(y) Performs a logical implication on two numbers.
INT(x) Returns the integer portion of a number. If the number is anegative, the first negative integer less than or equal to thenumber is returned.
LOG(x) Returns the natural log of a number.
LOG10(x) Returns the logarithm base 10 of a number.
(x)MOD(y) Performs a modulo divide of two numbers.
NOT(x) Performs a logical negation on a number.
(x)OR(y) Performs a logical disjunction on two numbers.
PWR(x,y) Raises constant x to the power of y.
RND Generates a random number.
SGN(x) Used to find the sign value of a number (-1, 0, or 1).
SIN(x) Returns the sine of an angle.
SINH(x) Returns the hyperbolic sine of a number.
SQR(x) Returns the square root of a number.
TAN(x) Returns the tangent of an angle.

Section 12. Real-Time Monitor and Control (RTMC)
12-11
TANH(x) Returns the hyperbolic tangent of a number.
(x)XOR(y) Performs a logical exclusion on two numbers.
12.2.4.4 Order of Precedence
Anything inside parentheses ( )
Exponentiation ^
Negation (unary) -
Multiplication *, division /
Modulo (remainder) MOD
Addition +, subtraction -
When consecutive operators have the same priority, the expression evaluatesfrom left to right. This means that an expression such as a-b-c is evaluated as(a-b)-c.
12.2.5 Remote ConnectionRTMC has the ability to connect to LoggerNet software running on anothercomputer. By default RTMC connects to the computer where it is running.
To set a connection to LoggerNet on another computer bring up the serverconnection dialog from the Project | Change Server Connection menu. TheServer IP is the network computer name or IP address. The computer name isdefined by the network administrator. A connection can also be made over theInternet or local area network using the 4 number Internet Protocol (IP)address. This is a number that will have four digits between 0 and 255separated by decimal points. An example would be 192.168.4.32. Do not putleading zeros with the numbers.
The User Name and Password are only used if you are connecting to aLoggerNet server that supports security (LoggerNet version 1.1) and thenetwork administrator has implemented security. The Port Number shouldalways be 6789.

Section 12. Real-Time Monitor and Control (RTMC)
12-12
Clicking the Save Login Info will save the computer address, user name andpassword as part of the RTMC file so the screen can be run without requiringthe user to know the address.
12.3 Run-TimeThe run-time operation allows you to run the real-time graphic display screenthat was created in the developer mode. From the RTMC Developmentwindow you can test the operation of the display screen using the Runtime |Save and Run Current Project menu or clicking on the Run-Time icon on thetoolbar. This will close the development window and start the project windowwith RTMC Run-Time as shown in the window below.
When the run-time display screen is started, the display components will behighlighted in reverse video until data is received from LoggerNet. If data isnot displayed, check to see that the data is being collected by LoggerNet.
Once a project file has been created, the display screen can be run withoutstarting the development mode window. From the Windows Start Menu underPrograms | LoggerNet click on RTMC Run-Time. In the Run-Time windowselect File | Open Project to select the RTMC project screen to run.
RTMC Run-Time will print an image of the display screen by selecting File |Print Screen.

13-1
Section 13. Storage Module Software(SMS)SMS is a software application that provides a simple and efficient way of collecting datafrom and storing programs to Card Storage Modules (CSM1 and MCR1), StorageModules (SM192, SM716, SM4M, and SM16M) or a PC (PCMCIA) Card. The softwarecommunicates with the Storage Modules through an SC532 asynchronous adapter orthrough a datalogger. The software communicates with PC cards using either CampbellScientific’s Card Storage Modules (CSM1 or MCR1) or the PC card slots installed in thecomputer. The software is provided with an extensive online help system.
SMS is used only with array-based dataloggers because storage modules are notsupported in the table-based dataloggers. (CR5000, CR9000,CR510TD, CR10T, CR10X-TD, and CR23X-TD)
13.1 OverviewClicking the Stg Module button on the LoggerNet Toolbar will bring up theStorage Module Software (SMS). Using a special interface, SMS provides easycommunication with Campbell Scientific’s external Storage Modules, cardreaders and dataloggers for collection and storage of both programs and data.Data can also be read directly from a PC card if the computer is fitted with a PCcard reader.
The CSM1 Storage Module, the MCR1 Card Reader and acomputer fitted with an internal PC Card reader all use SRAMPCMCIA cards which must formatted to Campbell Scientific’sspecifications.
Windows NT, Windows 2000, and Windows XP do not support16-bit card services. Therefore, SMS cannot communicate withPCMCIA card slots running under Windows NT, 2000 or XP.
There is extensive online help available either by pressing the F1 key oraccessing help from the menu. The online help along with the user guide forthe module you are using, will help you get the most out of your storagemodules.
The CSM1, MCR1 and SM192/716 User Guides containreferences to other Campbell Scientific software (CSMCOM andSMCOM). These programs are not required if you are usingSMS.
NOTE
NOTE

Section 13. Storage Module Software (SMS)
13-2
13.2 Getting StartedWhen you start SMS the main window appears with tabbed configurationscreens that give you access to the options you need for the type of storagemodule you have. An example screen for the SM192/716 module is shown.
FIGURE 13.2-1. Typical SMS Screen
CSM1, SM192, SM176, SM4M, or SM16M Storage Modules usually requirean SC532 interface, plus a 7026(standard serial) or SC25PS cable. A basicconnection diagram is shown in Figure 13.2-2 below. If you are using anSC532A interface you will need a 9 pin to 9 pin serial cable instead of the 9 to25. The Storage Module manuals give full details of connecting the modules tothe computer.
The MCR1 Memory Card Reader does not require an SC532interface.
NOTE

Section 13. Storage Module Software (SMS)
13-3
12V DC
COM Port of a PC SC532 Storage Module
AC/DCAdaptor or
7026 orSC25PS
CableSC12Cable
(standardserialcable)
FIGURE 13.2-2. Connecting the Storage Module to a PC using an SC532 Interface
If your computer is fitted with a PC card reader supporting Card Servicesprotocol, SMS can be used to interrogate the memory card in a similar way tointerrogating a card in the CSM1/MCR1 Storage Module.
Start SMS by clicking on the Stg Module button of the LoggerNet toolbar. Thefirst time you use the program it will show the screen for the CSM1/MCR1Card Storage Module as in the screen in Figure 13-3.
13.2.1 The Setup ScreenThe setup screen shown in Figure 13.2-3 is used to set the Communications(COM) Port and Baud Rate before communications between the module andcomputer are established.

Section 13. Storage Module Software (SMS)
13-4
FIGURE 13.2-3. Typical SETUP Screen and StatusBox for the CSM1/MCR1 Module
13.2.2 Establishing CommunicationsFor storage modules, the first step is to establish communications between yourstorage device and the computer. This involves selecting the correctcommunication port and baud rate for the device being used from the Setupscreen.
If you have a computer fitted with a correctly configured card reader you canset it up for use with SMS. This is accomplished by going to the PC CARDSETUP screen, and clicking the Setup PC Card button. When you click thisbutton you will be guided through the correct setup procedure and the optimumsoftware drivers will be used to establish communications.
The PC Card drivers are NOT set up automatically, and shouldbe set up as described above. Even if you are already using PCCards successfully with your PC, it is recommended that you usethe setup facility provided for use with SMS. This will notdisrupt the normal use of other PCMCIA cards.
NOTE

Section 13. Storage Module Software (SMS)
13-5
Selecting a COM Port
This section is applicable for Campbell Scientific’s external Solid State StorageModules such as the SM192/716 and SM4M/16M.
For an externally connected storage device you can use one of your computer’sCommunication (COM) ports for connecting the storage module to thecomputer. If you are not using COM1 for connection, you will need to select theport being used by clicking on the appropriate check box in the Port Selectionbox. This will be COM1 or COM2 for most computers, but SMS can useCOM3 and COM4 if your computer is equipped with these.
The physical implementation of the COM port is hidden from the software.The Windows environment provides a common interface via a COM portdriver, with which SMS communicates. Sometimes, however, you might have aCOM port which shares interrupts with other COM ports. This can be checkedby examining the “Ports” (Settings/Advanced) setting in the Windows ControlPanel. A COM port sharing an interrupt with another device can preventWindows from performing high-speed communications using that port. Thisshared interrupt problem would, therefore, also affect operation of SMS.
If you appear to be experiencing communication problems whenusing external modules, always check the COM ports setting inthe Windows Control Panel, using the “Ports”(Settings/Advanced) option, and check for any shared interrupts.
Baud Rate
The first time you use SMS with a storage module a default baud rate of38,400bps is automatically selected for the CSM1/MCR1 and a baud rate of19,200bps is set for the SM192/716 modules connected using an SC532. If youare connecting to a storage module via a datalogger, the baud rate will varydepending upon the datalogger chosen.
The default (maximum) baud rate (38,400bps for CSM1/MCR1 and 19,200bpsfor SM192/716) can be adjusted to your own requirements, depending on,among other things, the speed of your COM port and processor speed.
When SMS reads data from the storage device, it automatically performs achecksum test and requests that bad data be re-transmitted. If bad data isdetected, the computer will beep.
If communication errors occur, it may help to reduce the baud rate. Possiblereasons why good communications cannot be established using higher baudrates under Windows are:
• Using low-quality cards, or using generic drivers rather than the hardwarespecific drivers.
• Processor is loaded down by other applications (e.g., DOS programs set toexclusive mode or other operating Windows communication programs).
• A computer without a buffered UART (Universal AsynchronousReceive/Transmit) serial port (e.g., a 16550 UART), or without the FIFO(First In First Out) option enabled. (Other communications problems can
NOTE
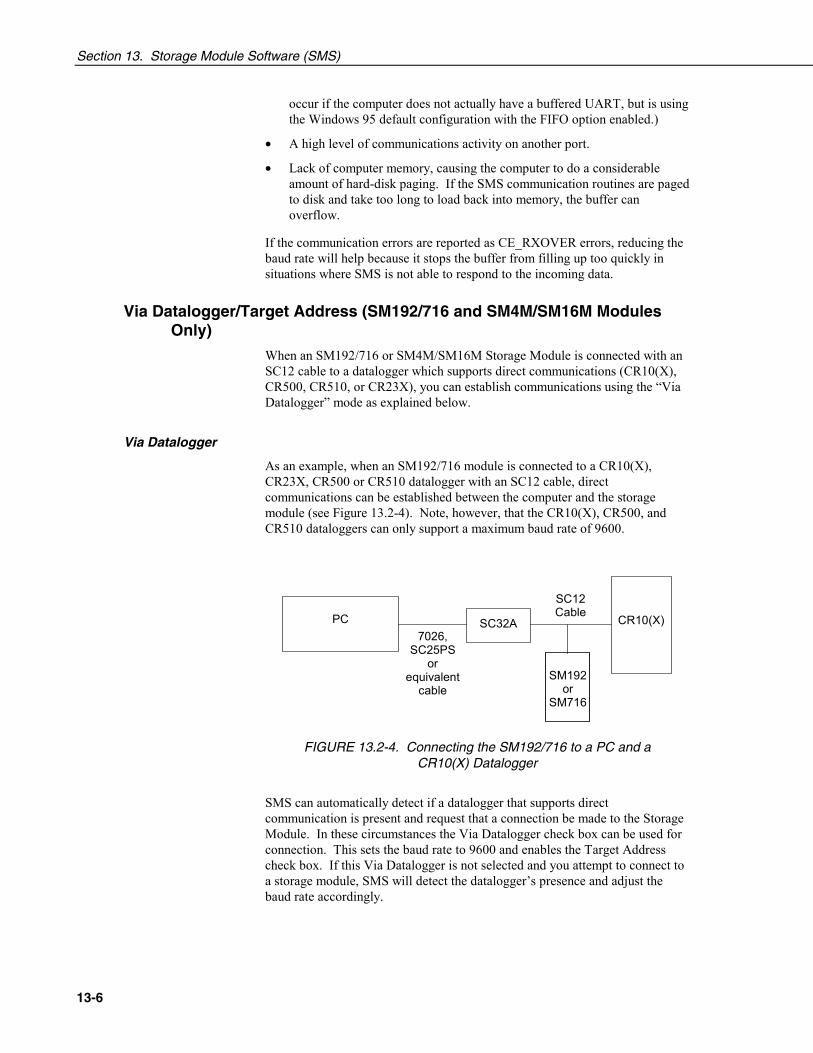
Section 13. Storage Module Software (SMS)
13-6
occur if the computer does not actually have a buffered UART, but is usingthe Windows 95 default configuration with the FIFO option enabled.)
• A high level of communications activity on another port.
• Lack of computer memory, causing the computer to do a considerableamount of hard-disk paging. If the SMS communication routines are pagedto disk and take too long to load back into memory, the buffer canoverflow.
If the communication errors are reported as CE_RXOVER errors, reducing thebaud rate will help because it stops the buffer from filling up too quickly insituations where SMS is not able to respond to the incoming data.
Via Datalogger/Target Address (SM192/716 and SM4M/SM16M ModulesOnly)
When an SM192/716 or SM4M/SM16M Storage Module is connected with anSC12 cable to a datalogger which supports direct communications (CR10(X),CR500, CR510, or CR23X), you can establish communications using the “ViaDatalogger” mode as explained below.
Via Datalogger
As an example, when an SM192/716 module is connected to a CR10(X),CR23X, CR500 or CR510 datalogger with an SC12 cable, directcommunications can be established between the computer and the storagemodule (see Figure 13.2-4). Note, however, that the CR10(X), CR500, andCR510 dataloggers can only support a maximum baud rate of 9600.
PC SC32A CR10(X)7026,
SC25PSor
equivalentcable
SC12Cable
SM192or
SM716
FIGURE 13.2-4. Connecting the SM192/716 to a PC and aCR10(X) Datalogger
SMS can automatically detect if a datalogger that supports directcommunication is present and request that a connection be made to the StorageModule. In these circumstances the Via Datalogger check box can be used forconnection. This sets the baud rate to 9600 and enables the Target Addresscheck box. If this Via Datalogger is not selected and you attempt to connect toa storage module, SMS will detect the datalogger’s presence and adjust thebaud rate accordingly.

Section 13. Storage Module Software (SMS)
13-7
Target Address
The Target Address selector is disabled unless you check the Via Dataloggerbox, because this is the only mode that simultaneously supports multiplestorage modules.
An appropriate datalogger can be connected to up to eight storage modulessimultaneously, each having a different address. The address selector is used tospecify the address of the module to which you wish to connect. Note,however, that any module having a high address may answer to a call of a loweraddress if no module of the lower address is present.
For example, if only one storage module with an address of 8 is present, andyou set the target address to 1, you will still be able to connect to the storagemodule. However, if your module had an address of 1 and your target addresswas set to 5, you could not connect.
The above shows that the target address need not represent the actual addressof the Storage Module. The physical address of the Module is shown on the“Advanced” status page. Changing the physical module address will notchange the selected target address, and, in fact, changing the physical addresswill not have any noticeable effect until you disconnect from the StorageModule.
While up to eight SM4M or SM16M storage modules can beaddressed, communications may be unreliable if more than fourare connected to a datalogger at a time.
Connect/Disconnect
After connecting your storage module to your computer and selecting therequired COM port and baud rate, click on the Connect button to establishcommunication between the computer and the storage module. If everything issatisfactory, a successful communications link will be established and thewording on the Connect button will change to Disconnect.
If your first attempt at connection fails and an error message “Cannot connectto CSM1” or “Communications Problems:...” appears, try to connect again (byclicking the Connect button). It may take some time (up to 30 seconds) toestablish the connection. The most likely cause of a failed communication linkis selection of the wrong COM port or a loose physical connection between thestorage module and the computer.
13.3 Status Information
13.3.1 Status Box/Update StatusWhen successful communication has been established, a set of values willappear in the StatusBox at the right-hand-side of the screen. This screen showsthe current status (values) for the card or module. Some typical values areshown in Figures 13-1 and 13-3 above.
NOTE

Section 13. Storage Module Software (SMS)
13-8
The information in the main StatusBox is relatively straightforward and issimilar for all modules. The SM192/716 and SM4M/SM16M modules have anadditional Switch Settings information box that shows the settings made usingthe ADVANCED SETTING screen. Further information on each item in theSTATUS screen can be obtained by clicking on that item and pressing F1.Additional information is also available in the appropriate Storage ModuleManual.
The status information can be updated at any time by clicking the UpdateStatus button.
13.3.2 Advanced Status InformationThe ADVANCED STATUS screen is different for each type of module, andprovides extra information and configuration facilities.
CSM1/MCR1
Display Pointer
The Display Location Pointer (DLP) indicates the location which holds thefirst value that will be read when extracting data from the card. The pointer canbe positioned anywhere within the readable area of the card, either by typingthe location directly into the window or by using the up/down arrows toincrement the value. The green arrow moves the pointer to successivefilemarks.
If the Display Pointer points to a filemark or the start of aprogram, no data will be output in response to the “Get One”request. It must be moved past the filemark to get further data.
Further details on Filemarks and Pointers can be found in the relevant StorageModule Manual and the on-line help system.
Card Format Type
This is a format code for the card currently in use. It is an internal reference foruse by Campbell Scientific and so has no significance for the end-user.
PROM Details
The PROM checksum calculates a unique signature for that PROM version.For all storage devices the PROM checksum is displayed on the ADVANCEDscreen. At start-up the value may be displayed as a series of ??????. The truevalue can be shown by clicking the Re-Calculate Checksum button. Oncedisplayed, this value is retained and will normally remain until you disconnector remove power from the storage module. You can recheck the value at anytime by clicking the Re-Calculate Checksum button.
SM192/SM716
The SM192/716 ADVANCED STATUS screen is similar to the CSM1 screen,but has additional configuration facilities. These settings configure the storage
NOTE

Section 13. Storage Module Software (SMS)
13-9
module, which has its own process that controls datalogger communications.These settings don’t affect getting data out to the PC. These settings are listedbelow.
Print Enable Mode
Data from 21X and CR7 dataloggers with older PROMs, and data from non-datalogger devices are stored in the Storage Module using the “Print Enable”mode. Full details of this storage method can be found in the SM192/716Instruction Manual.
Baud Rate – Print Enable Mode
This is the printer baud rate when data are collected by the Printer Enable (PE)method. For this method of collection you must ensure that the baud rate of theStorage Module and the datalogger are matched. Most Campbell Scientificdataloggers have selectable baud rates. You can select the baud rate using theBaud Rate setting box in the Print Enable Mode section. The SM192/716Instruction Manual gives further details.
The 76,800/9600 setting is the default after an SM reset. In thissetting the SM can automatically change from capturing data at76,800 baud to capturing data at 9600 baud. Baud rate errors(baud rate mismatches between SM and datalogger) cause theSM to increment its error counter and enter a low power standbystate.
Encoding
These check boxes allow you to select how data are encoded in the Print Enablemethod of data storage:
Encode ASCII is the normal default setting. The Storage Module will encodeincoming Printer Enable Method printable ASCII data and store it as CampbellScientific Final Storage Format (binary) data.
No Encoding enables incoming data to be stored “as is”, regardless of itsformat. This permits storage of raw ASCII data.
Raw ASCII data will take up much more storage space thanencoded data, and so it is generally recommended that data arealways stored as binary.
Module Address
This shows the actual address of the Storage Module. Changing the actualaddress will not change the selected target address.
See Target Address for further details.
NOTE
NOTE

Section 13. Storage Module Software (SMS)
13-10
Display Pointer
This has exactly the same function as the Display Pointer for the CSM1/MCR1(see above).
Storage Mode
Two methods of memory allocation for storage of data are provided – RingMode and Fill and Stop, as explained below.
Ring Mode: When the storage module is set to Ring Mode, data arestored sequentially. When all memory locations become full the ringmemory “wraps around” and new data are then written over the oldest datastored in memory. To avoid data loss, retrieve all data from the storagemodule before this occurs.
Fill and Stop: When the storage module is set to Fill and Stop, data arestored sequentially, but, data storage stops when all memory locationsbecome full.
When multiple storage modules are used, each should be assigned its ownaddress and set to Fill and Stop. When one module is filled, data will thenbe stored in the module with the next highest address.
Test Battery (Unloaded)
The value shown under “Test Battery” is for the state of the battery whencompared to a 2.5V DC reference without any load on the battery.
Test Battery (Loaded)
The battery can be checked when a 100 ohm load is connected for 1 second.This test shortens the overall battery life by approximately 3 minutes, but it is amuch better test of the battery’s integrity. It is particularly important to carryout a Loaded Battery Test if the battery is more than four years old and you areintending to leave the Storage Module unattended to collect data for severalmonths or you are leaving the module unattended to collect data in coldweather.
Failure to check the battery can lead to data loss in theabove conditions.
SM4M/SM16M
Many options on the SM4M/SM6M ADVANCED STATUS tab are similar tothe other modules. Options unique to these two types of modules are explainedbelow.
Data Block Size - The data block size is the physical size, in bytes, of flashmemory blocks.
CAUTION

Section 13. Storage Module Software (SMS)
13-11
Data Memory Size - The data memory size is the total amount of memory, inbytes, for the storage module. Each low resolution data point uses 2 bytes;therefore, the SM4M can store 2 million data points and the SM16M can store8 million data points (a high resolution data point uses 4 bytes and reduces thenumber of data points that can be stored in half).
Max Program Size - The Max Program Size is the amount of memory, in bytes,currently available for datalogger program storage.
Program Area Size - The Program Area Size is the total capacity that themodule has for datalogger program storage.
13.4 ProgramsClicking the PROGRAMS tab brings up the PROGRAM CONTROLOPTION screen. The screen is very similar for the storage devices and the PCCard. It is essentially an interface for extracting programs, saving programs orclearing programs from the storage device.
The screen in Figure 13.4-1 shows the program selection check boxes and theprogram manipulation buttons. Datalogger programs can be stored in a card ormodule for subsequent downloading into a datalogger. The programs arestored in the same memory space available for data storage and are stored in upto eight memory locations. With the correct version of datalogger operatingsystem, the program in location 8 can be automatically loaded, compiled andrun in a datalogger on power-up of the datalogger. (See appropriate StorageModule Instruction Manual for more details.)

Section 13. Storage Module Software (SMS)
13-12
FIGURE 13.4-1. PROGRAMS Screen
13.4.1 Program LocationThere are eight memory locations available. The Program Status box willeither:
• Display a number indicating the starting position in memory of theprogram (CSM1/MCR1 and PC Card),
• Say “Used” for a program in a specific location (SM192/716 andSM4M/SM16M),
• Say “Free” for an unused location.
A program location is selected by clicking on it to highlight its check box.Once you have selected the program location(s) you can carry out the desiredaction by clicking on one of the three buttons.
13.4.2 ClearClicking on the Clear button will clear the selected programs from the card ormodule memory. You will be asked to confirm this request before theprogram(s) are actually cleared.
13.4.3 StoreClicking on the Store button will allow you to store a program in the selectedprogram location. If a program already exists in this location, you will be askedto confirm that it can be overwritten. Once a valid location has been selected, aProgram Selection box appears showing any valid program files (.dldextension) on the current drive and directory. You can select any of these, orchoose any other valid program file by browsing the directory structure. Onceyou have selected the required program, it will be written to the storage card ormodule. A Progress Indicator at the bottom right of the screen will confirm thatthe program is being written to the card or module.
13.4.4 ReadThis is the reverse operation to the Store request. Clicking the Read buttonwill allow you to read a program from the selected program location to disk.Once a location containing a program has been selected, clicking on the Readbutton brings up a file selection menu for you to select the location in which tostore the program on disk. A progress indicator will confirm that the programis being read from the card or module.
13.5 DataClicking on the DATA tab will bring up the DATA CONTROL OPTIONscreen as shown in Figure 13.5-1, below.

Section 13. Storage Module Software (SMS)
13-13
FIGURE 13-5.1. DATA CONTROL Screen
13.5.1 File FormatBefore you attempt to “get” (collect) any data you should select your preferredfile format.
Comma Separated
This format has array elements separated by commas. No element identifiersare included and all leading zeros and trailing zeros after the decimal point areremoved. Each array is terminated with a carriage return and line feed.Comma separated format is comparatively compact, can be read when printed,and can be imported into most data analysis packages (e.g., if you use a .CSVfile extension, Microsoft Excel will auto-import the file).
An example is given below.
101,279,1413,12.68,24.75,75.3,25.42,75.1101,279,1414,12.68,24.75,75.2,25.42,75.2101,279,1415,12.68,24.77,75.4,25.49,75.1101,279,1416,12.68,24.77,75.4,25.55,75.2101,279,1417,12.68,24.78,75.4,25.42,75.2101,279,1418,12.68,24.80,75.3,25.35,75.2

Section 13. Storage Module Software (SMS)
13-14
ASCII with Array IDs
This format is ASCII with Array Identifiers. Each data value is preceded by anidentifier indicating its position in the array. This format requires the most diskspace on the computer, and can be difficult to use in some data analysispackages.
An example of this format is:
01+0101. 02+0279. 03+1413. 04+12.68 05+24.75 06+075.3 07+25.42 08+075.101+0101. 02+0279. 03+1414. 04+12.68 05+24.75 06+075.2 07+25.42 08+075.201+0101. 02+0279. 03+1415. 04+12.68 05+24.77 06+075.4 07+25.49 08+075.101+0101. 02+0279. 03+1416. 04+12.68 05+24.77 06+075.4 07+25.55 08+075.201+0101. 02+0279. 03+1417. 04+12.68 05+24.78 06+075.4 07+25.42 08+075.201+0101. 02+0279. 03+1418. 04+12.68 05+24.80 06+075.3 07+25.35 08+075.2
This format is also ambiguous for arrays of 100 or more data values. It istherefore not recommended unless sending the raw data directly to a printer.
As Stored
When this option is used the software does not perform any decoding on thedata in the card or module. Data are read out of the module and written to disk“as it is” (8-bit data).
If data has been stored from a datalogger in a binary format, this option writesthe data to disk in the same format. This is the most compact format for datastorage on disk, but the data needs to be decoded before it can be read. SPLIT(see Section 10) can be used to decode the data. If you wish to decode datawith your own software, refer to the appropriate datalogger Operator’s Manual.
If the data was stored in the module in ASCII format, you shoulduse the “As Stored” format to collect data from the module (seebelow). Storing data directly in ASCII format is inefficient interms of use of the module memory, as printable ASCII requiresfive storage locations in the module (10 bytes) as compared toone (2 bytes) for binary data.
13.5.2 File Naming OptionsData files can be collected either individually or collectively. The File NamingOptions box gives you control over how the extracted files are collected andnamed.
File name
Data files will normally be stored under a file name with the .DAT extension.When first using SMS, the button in the FILE NAMING OPTION screen willshow the name DATA000.DAT. This name can be changed to any other nameof your choice. By clicking on the button, a standard Windows File Name boxappears that will allow you to type in the name you want.
NOTE

Section 13. Storage Module Software (SMS)
13-15
Auto Name Control
You may choose to Auto Increment the file name, to Append the data to acurrent file or to manually choose a New Name for each file saved.
Auto Increment Name
When the software is first used, the program will always select a default filename and use automatic file incrementing. This means that the file name willinitially be DATA000.DAT. Unless you change the default, further files willbe saved in the sequence DATA001.DAT ... DATA999.DAT. This means thatwhenever you store new data files to disk, the name will automaticallyincrement by adding one to the number at the end of the name.
If you are collecting multiple files (as in the Get All command), the file namewill be incremented automatically as each file is collected. The program willscan the computer for files with the same base file name. If a file is found witha higher numeric suffix than the one you enter, the program will ask forconfirmation to avoid the possibility of existing files being overwritten.
You may change the “base” file name by clicking on the button showing the filename. The three-digit counter will be automatically added to the file name.
For example, if you chose a file name of ANDREW.DAT the program wouldconvert it to ANDREW000.DAT so that auto incrementing could take place.
If you want completely unique names for each file, choose the “New name foreach file” option.
Append to Current File
In this option files to be collected are added to the end of the current file (asindicated by the name on the File Name button). The new file will retain thecurrent file name.
New Name for Each File
By selecting this option you have the flexibility to choose a completelydifferent name for each collected file. The names can be any name conformingto standard Windows convention. As the files are collected, you will beprompted to enter a valid file name for each individual file.
13.5.3 Show Card/Module DirectoryBy clicking the Show Card Directory (CSM1/MCR1/PC Card) or the ShowModule Directory (SM192/716 or SM4M/SM16M) buttons, a windowshowing the directory structure appears as shown below. Initially, the directoryis in a concise, or folded, form showing just the locations of the filemarks.Click on the Unfold button to expand the directory to show data file locationsand other filemarks and pointers. Data can be read into a file and/or vieweddirectly from the DIRECTORY screen using the Read File and View Filebuttons. For a card or module with a large number of data files the ShowDirectory command may take several seconds to complete.

Section 13. Storage Module Software (SMS)
13-16
The Show Directory command is repeated on the menu bar. See the on-linehelp system for further details.
13.5.4 Get AllThis option collects all valid data files in the card or module and stores them tothe specified directory, starting with the file name shown in the File Name box.The way that the file is named is controlled from the Auto Name Controlselection buttons (see above).
As the files are read to the disk, a Progress Indicator showing the file names isdisplayed at the bottom right of the display.
13.5.5 Get NewThis option collects new data files, starting from the position of the storagemodule dump pointer. This pointer marks where data was last collected, and isautomatically moved after each successful collection of data. This option canbe used to collect any new data files stored in the card or module since data waslast read. As the file is read to the disk a Progress Indicator showing the filename is displayed at the bottom right of the display.
See the relevant Storage Module Manuals and on-line help system for furtherdetails about Filemarks and Pointers in memory.

Section 13. Storage Module Software (SMS)
13-17
13.5.6 Get OneThis option collects one data file starting at the specified location of the displaypointer. You can position the display pointer to any starting position requiredby using the ADVANCED STATUS INFORMATION screen (see section13.2).
This option is used mainly for re-collecting old data that has already beencollected, or to recover data from a corrupted card.
As the file is saved to disk a Progress Indicator showing the file name isdisplayed at the bottom right of the display.
13.6 EraseClicking on the ERASE tab will bring up the ERASE OPTIONS screen. Thisgives control over how data is erased or cleared from the card or module.
13.6.1 Erase DataThis option “erases” data by removing the references to the data files anderasing all filemarks. Only DATA from the card or module is affected. Anyprograms are temporarily off-loaded to disk, all pointers to data and programson the card/module memory are erased and the pointers reset. The programsare then copied back to the card or module. Before any data is “erased” youwill have the chance to cancel the option.
13.6.2 Erase Data and ProgramsThis option will completely “erase” (see above) all data and programs from thecard or module. You will have the opportunity to cancel the option before thecard/module is erased.
13.6.3 Erase and Test Card/ModuleThis option is similar to the Erase Data and Programs option except that a fullintegrity test is carried out on the card or module. This option takesconsiderably longer than the simple Erase Data option, and all memory locationvalues are reset.
Do not disconnect an SM4M/SM16M module from theSC532 or datalogger until the full memory test is complete.Doing so will corrupt the module’s flash memory and makeit unusable until a full memory test is performed.
13.7 The Menu BarThe Menu Bar appears along the top of all SMS screens with four optionswhich can be accessed either by clicking with the mouse, or from the keyboardby pressing <Alt> + Underlined Character (F, O, D, T or H). Each option
CAUTION

Section 13. Storage Module Software (SMS)
13-18
provides a further pull-down menu. The underscored character in the name isthe “hot-key” for keyboard access.
13.7.1 FileThe File pull-down menu gives three additional options:
Terminal Emulator
Clicking on Terminal on the pull-down menu produces a TERMINALEMULATOR screen. It allows you to communicate directly with the StorageModule and is provided so that you can issue storage moduletelecommunication commands manually. When the TERMINALEMULATOR screen is opened, it automatically establishes a connection to thestorage module. The storage module prompt (%) should be displayed while theconnection is active.
Keyboard entries are transmitted from the COM port to the storage module, andstorage module responses are displayed on the computer screen. Pressing<Esc> exits this mode and returns you to the main SMS screen. This option isseldom used because all normal operations can be accomplished easily by usingother sections of the software. You are unlikely to need Terminal Mode unlessyou are trying to diagnose problems with a corrupted module.
Full details of direct module communication commands are given in CampbellScientific’s Storage Module Instruction Manual.
Show Directory
Clicking Show Directory produces exactly the same result as clicking the ShowCard/Module Directory button (see Section 13.5.3).
Exit
Clicking Exit on the Menu Bar will close all communications completely, exitthe program, and return you to LoggerNet. Alternatively, you can exit thesystem by double-clicking the small box at the top left-hand corner of the SMSscreen or by clicking this box and choosing Close from the pull-down menu, orby using the small “Exit” icon at the top right-hand corner of the screen. Donot use this option merely to close the pull-down menu and return to the SMSscreen. To return to SMS, click the mouse anywhere on the SMS screenoutside the pull-down menu box.
13.7.2 OptionsThe options menu provides a pull-down menu with two options:
Enable Pop-Up Hints
Clicking this option acts as a toggle. If Pop-Up Hints are already enabled, acheck appears at the left hand side of the name. By clicking on the name, thePop-Up Hints in the MAIN PROGRAM screen can be disabled. An additionalclick will re-enable them.

Section 13. Storage Module Software (SMS)
13-19
Save Settings on Exit
If you want to save all your set-up information when you leave SMS, ensure thatSave Settings on Exit is checked. Again, this option may be enabled/disabled byclicking the mouse on the name.
13.7.3 DataSelecting Data from the Menu Bar provides a pull-down menu with five items.The first threeGet All, Get New and Get One are identical to the similarlyworded buttons on the SMS DATA Screen (see Section 13.5).
The two remaining items on the pull-down menu are:
Insert Filemark
Filemarks are used to separate data in the storage device. A Filemark isautomatically placed in the device’s memory when it is connected to a powersource (a datalogger or retrieval interface), when a datalogger compiles aprogram containing Instruction 96, or under program control. For example, ifyou retrieve data from one datalogger and disconnect the storage module, andthen connect it to another datalogger, a Filemark is placed in the data when thesecond datalogger is connected. This mark follows the data from the firstdatalogger and precedes the data from the second.
Next Filemark
The Next Filemark option moves the Display Pointer to the next filemark in thedata in a similar way to clicking on the green arrow in the ADVANCEDSTATUS screen (see Section 13.3.2).
13.7.4 ToolsThe Tools menu provides a way to access the tabs for each module when amouse or other pointing device is unavailable. The Tools menu has six options:Setup, Programs, Data, Erase, Status, and Advanced. By selecting one of theseoptions, you will be taken to that tab for the module to which you areconnected.
13.7.5 HelpThe final option on the Menu Bar is Help. This provides a pull-down menuwith five items connected with the SMS on-line help system and Windows helpin general. The options are self-explanatory.
Note that the option “About...” will display the current version number of thesoftware. This may be required if you need to contact Campbell Scientific forfurther information or support for SMS.
“About...” also indicates if any Card Services drivers have been found on yoursystem.

Section 13. Storage Module Software (SMS)
13-20
13.8 AbortMost SMS operations can be aborted by clicking the Abort button. Forexample, if you click Abort while the software is attempting to establishcommunications between a storage module and computer, that operation will beaborted. Note that for some rapid operations, such as reading or storing smallprogram or data files from a module, the operation may be completed beforethe abort option can take effect.

14-1
Section 14. Troubleshooting GuideThis section is provided as an aid to solving some of the common problems that might beencountered using the LoggerNet software. This list is not comprehensive but shouldprovide some insight and ability to correct simple errors without a call to CampbellScientific technical support.
This section also includes descriptions of some of the tools such as Terminal Emulator andData Table Monitor that can be useful in troubleshooting LoggerNet problems.
When things stop working the most important thing to ask yourself is: “What’schanged?” A new computer, new software (especially non-Campbell Scientificsoftware), different communication peripheral such as a new modem, newdatalogger program, etc., can all interrupt communications. If you can’t deducethe nature of the problem, go back to the original configuration. If a phonetelecommunications or socket link starts to fail for no apparent reason, asksomeone else to try it from a different computer. Try swapping out components– one at a time – from a link in the network that you know works or from spareequipment that you are certain is functioning correctly. Sometimes the smallestthing – a cable or a new PC utility program – can cause widespread havoc. Ifusing TCP/IP or cellular telephone communications, check with the networkadministrator to see if anything changed that coincided with the loss ofcommunications.
14.1 LoggerNet Server ProblemsThe following sections identify problems that have been observed withoperation of the server. If you are experiencing problems with the server lookthrough the following conditions to see if any of these match the problem youare having. If you find the problem listed, try the suggested remedies. If yourproblem is not listed or the remedies don’t fix the problem, contact CampbellScientific for technical assistance.
14.1.1 Starting LoggerNet and Connecting to the ServerProblem: Cannot start LoggerNet on a laptop computer. (Error message“LoggerNet was unable to start the communications server.” Socket Failurecreation 10047.”)
Remedy 1: If the computer is sometimes used on a computer networkand no network card is installed, TCP-IP services may not be starting.Try starting the computer with the network adapter card installed.
Remedy 2: If remedy 1 doesn’t work, you will need to configure anon-existent dialup service with a fixed IP address. There is adescription of this procedure in Section 2.2.

Section 14. Troubleshooting Guide
14-2
Problem: Message indicating Server Connection Lost.
Remedy : This message indicates that the main communicationssoftware has stopped responding to the user interface screens. Youneed to close down all of the applications along with the Toolbar andstart over.
14.1.2 Socket ErrorsThe LoggerNet Server uses TCP/IP sockets for communications. Variousproblems can occur with these socket connections. Some of the most commonerrors and remedies are listed below.
Maximum Number of Sockets Open
The Windows operating system has limits on the number of socket connectionsthat can be held open. For Windows NT/2000/XP this number is about 5000.For most operations this should be more than enough to cover the openapplications that use sockets. One situation that does cause problems is usingthe IPPorts to communicate with dataloggers where the socket is being openedand closed quickly. For example if you have 20 stations on IPPorts and you donormal data collection every 5 seconds, 20 new sockets are created every 5seconds. The normal lifetime of the created socket is about 2 minutes leavingover 500 active sockets at a time. If there are other applications that usesockets, it is possible to exceed the allowed number of sockets.
To work around this problem, either slow down the rate of data collection, orkeep the stations on line. There is an application called Managecomms.exe inthe LoggerNet program file directory. The documentation for this program isalso included in an Adobe Acrobat PDF file. Use this program to maintain anactive connection to all of the stations so the sockets are open all the time.
Note that if you are using Windows 95, 98, or ME, the number of socketsdefaults to about 100.
Socket Error Messages
When you get an error message that says Socket Error and a number, check thechart below for the type of error that occurred and what to do about it. Notethat these error messages can show up either in pop up error boxes or as part ofthe LoggerNet Communications log.

Section 14. Troubleshooting Guide
14-3
Socket Error Number Message Meaning User Response to Message10013 Permission Denied. The
requested socketconnection has refusedthe connection.
This is normally a network type ofissue. Check with your computernetwork operator.
10024 Too many open files.Too many open socketsfor the applicationsrunning.
This can occur when you have manyapplications that are using socketsrunning at the same time.
10047 Address family notsupported by protocolfamily. The socket beingaddressed does notsupport the type ofconnection beingattempted.
This message shows up when theLoggerNet Toolbar comes up butthe server did not come up becauseTCP/IP is not installed on thecomputer. Install TCP/IP andrestart LoggerNet. (Section 2.2)
10055 No buffer spaceavailable. Cannot moretemporary sockets.
The operating system cannot createany more socket connection. Seethe text above about MaximumNumber of Sockets Open.
10058 Cannot send after socketshutdown. A messagewas sent to a socket thathas been closed.
This would be an indication that anapplication is not communicatingwell with the server. Check theapplication.
10060 Connection timed out. Either the server has crashed and isnot responding or the applicationdid not maintain the connection tothe server. Try restartingLoggerNet. This message can alsobe seen in connection with theNL100 LAN interface.
10061 Connection refused. TheLoggerNet server or anNL100 refused to allowthe socket connection.
This is normally associated with theNL100 and occurs because the lastconnection did not have enoughtime to close before a newconnection is requested. Slow downthe low level polling delay interval.
10065 No route to host. Theapplication is trying toconnect to a host addressthat isn’t in the routingtable.
This occurs with remote connectionsto a LoggerNet server running onanother computer. The requestedhost name can’t be found.

Section 14. Troubleshooting Guide
14-4
14.1.3 Data Collection IssuesProblem: Scheduled data collection is enabled but no data is being saved in thedata files, or data is not updating on numeric or graphical display.
Remedy 1: Make sure that communications are enabled for the datalogger andall the devices in the communications link.
Remedy 2: For table-based dataloggers, make sure tables are included forcollection and the table definitions are current. For array-based dataloggers,make sure the correct final storage areas are included for collection.
Remedy 3: Check communication state on Status Monitor. An indication ofPrimary or Secondary retry indicates that LoggerNet is waiting for the nextcollect time. If the station is waiting in Secondary Retry mode, open theConnect Screen and click the Collect Now button. This will force collectionfrom the datalogger and will return the datalogger to the normal collectionstate.
Invalid Table Defs indicates that LoggerNet does not have a current copy of thedatalogger table definitions so you have to Get Table Defs from the Setupscreen.
Network Paused indicates that data collection for the entire network has beensuspended. So look on the Status Monitor for the Pause Schedule check box.
14.2 Application Screen ProblemsProblem: Cannot set the clock from the Connect screen. Othercommunications with the datalogger succeed.
Remedy: Check the Allowed Clock Deviation on the Clock tab forthe datalogger in the Setup screen. If the difference in the dataloggerand system clock is less than the deviation specified, the clock willnot be set.
Problem: Table-based datalogger program won’t compile and returns an E43error.
Remedy: There is an interval mismatch between the P84 instructionsand the program scan rate. If the P84 intervals are not multiples ofthe scan rate, the program won’t compile and will return this error.

Section 14. Troubleshooting Guide
14-5
14.3 General Communication Link ProblemsProblem: Communications are not solid and difficulty is experienced sendingprograms to the datalogger.
Remedy 1: If there are slow serial devices in the communicationpath, such as older modems, the server might be overrunning thebuffers. Set the maximum packet size in the Setup Screen for thedatalogger to a smaller number.
Remedy 2: On noisy phone links try lowering the max baud rate forthe datalogger on the Setup screen.
Remedy 3: On RF networks, make sure that the extra response timeis sufficient for the reply to come back, especially if there arerepeaters in the network. Use the minimum value necessary to makethe link function; usually less than 5 seconds.
14.4 Terminal Emulator to Test CommunicationsTerminal Emulator is a utility to test communications with the devices in thedatalogger network. Terminal Emulator is accessed from the Test menu of theToolbar. The operation of a ComPort and the connection to a phone modemcan be tested.
The Terminal Emulator utility is available from the main toolbar to helptroubleshoot communications problems. When you choose a device with theSelect Device field, the Terminal Emulator will attempt to establishcommunications with that device. The Terminal Emulator will use the lowestbaud rate among all of the devices involved in the link. For example ifchoosing a COM port, the baud rate will typically be 115,200 baud andLoggerNet simply opens the port. For a phone modem, the baud rate will be setto the value in the Setup screen for that phone modem, the COM port will beopened and the DTR line will be asserted to enable the phone modem. For adatalogger on a phone link, the baud rate will be set for the lower of the phonemodem or datalogger baud rates in the Setup screen, AND LoggerNet will tryto dial the phone modem and get a prompt from the datalogger. You can alsouse terminal emulation to send commands to the dataloggers.
When the Terminal Emulator screen comes up as shown click on the drop downarrow to the right of the Select Device box to choose the device from the list ofdevices in the network map. The correct baud rate for the link is automaticallyset. The characters you type in the window are sent as ASCII text to theselected device. The options that are available from this screen depend on thedevice you select.

Section 14. Troubleshooting Guide
14-6
Dataloggers
The example above shows a terminal emulation session with a datalogger.Once you have selected the datalogger click on Open Terminal to startcommunications. Array-based dataloggers require you to type in the letters 7H(2178H for CR7 and 21X) and pressing Enter to establish terminal emulationmode. Table-based dataloggers are ready for terminal emulation when they arefirst selected. Just press Enter. For a definition of commands that are availablein terminal emulation mode see the datalogger operators manual or promptsheet. On CR5000 dataloggers type H when the prompt comes up and a list ofoptions will be displayed.
Use caution while in terminal emulation mode. You can changeor disable operation of the datalogger with these commands.
ComPort
You can use the Terminal Emulator to perform a communications test on aComPort. To perform a feedback test, select the ComPort and click on OpenTerminal. Then connect the Transmit and Receive lines (2 and 3) of the serialport cable using a small screw driver or paper clip. Click in the window to getthe cursor and type some characters on the computer keyboard. If thecharacters are echoed back to the screen, the ComPort is working.
The characters on the screen can be cleared by clicking on Clear.
NOTE
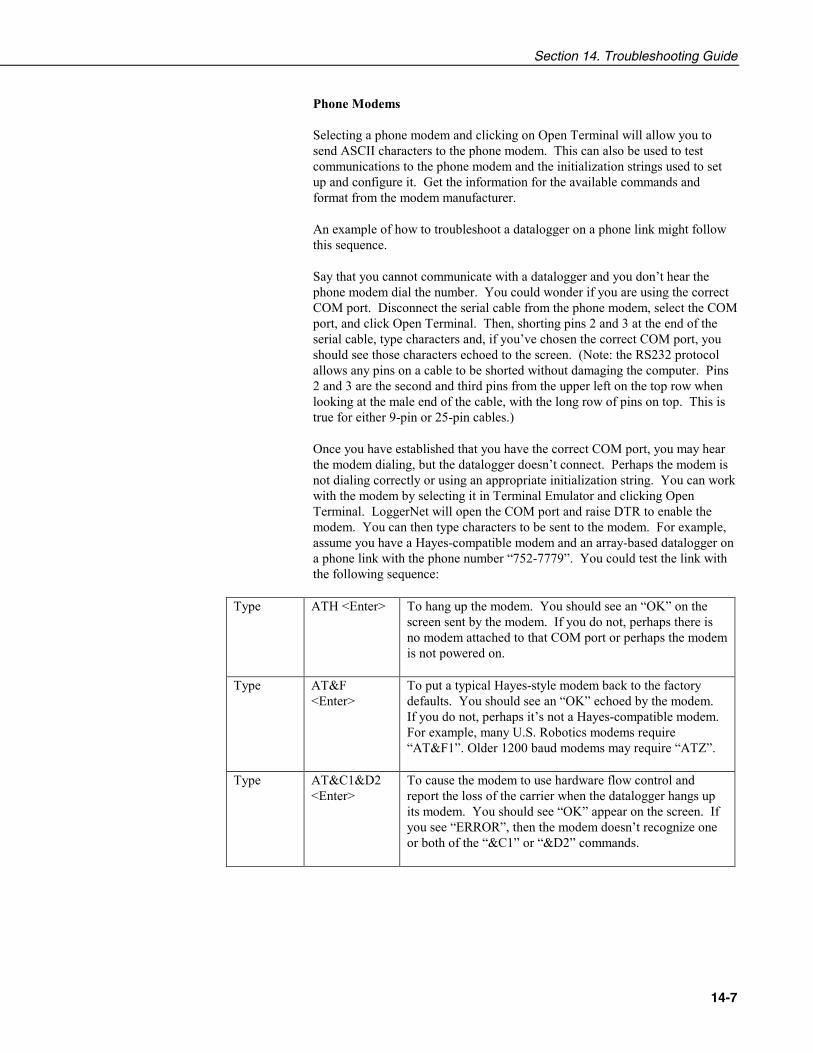
Section 14. Troubleshooting Guide
14-7
Phone Modems
Selecting a phone modem and clicking on Open Terminal will allow you tosend ASCII characters to the phone modem. This can also be used to testcommunications to the phone modem and the initialization strings used to setup and configure it. Get the information for the available commands andformat from the modem manufacturer.
An example of how to troubleshoot a datalogger on a phone link might followthis sequence.
Say that you cannot communicate with a datalogger and you don’t hear thephone modem dial the number. You could wonder if you are using the correctCOM port. Disconnect the serial cable from the phone modem, select the COMport, and click Open Terminal. Then, shorting pins 2 and 3 at the end of theserial cable, type characters and, if you’ve chosen the correct COM port, youshould see those characters echoed to the screen. (Note: the RS232 protocolallows any pins on a cable to be shorted without damaging the computer. Pins2 and 3 are the second and third pins from the upper left on the top row whenlooking at the male end of the cable, with the long row of pins on top. This istrue for either 9-pin or 25-pin cables.)
Once you have established that you have the correct COM port, you may hearthe modem dialing, but the datalogger doesn’t connect. Perhaps the modem isnot dialing correctly or using an appropriate initialization string. You can workwith the modem by selecting it in Terminal Emulator and clicking OpenTerminal. LoggerNet will open the COM port and raise DTR to enable themodem. You can then type characters to be sent to the modem. For example,assume you have a Hayes-compatible modem and an array-based datalogger ona phone link with the phone number “752-7779”. You could test the link withthe following sequence:
Type ATH <Enter> To hang up the modem. You should see an “OK” on thescreen sent by the modem. If you do not, perhaps there isno modem attached to that COM port or perhaps the modemis not powered on.
Type AT&F<Enter>
To put a typical Hayes-style modem back to the factorydefaults. You should see an “OK” echoed by the modem.If you do not, perhaps it’s not a Hayes-compatible modem.For example, many U.S. Robotics modems require“AT&F1”. Older 1200 baud modems may require “ATZ”.
Type AT&C1&D2<Enter>
To cause the modem to use hardware flow control andreport the loss of the carrier when the datalogger hangs upits modem. You should see “OK” appear on the screen. Ifyou see “ERROR”, then the modem doesn’t recognize oneor both of the “&C1” or “&D2” commands.

Section 14. Troubleshooting Guide
14-8
Type AT\J1 <Enter> To force the modem to follow the serial port rate rather thantry to connect at the fastest rate the remote modem willsupport. You should see “OK” appear on the screen. If yousee “ERROR”, then the modem doesn’t recognize thiscommand.
Type ATDT7527779 <Enter>
To dial, using tone dialing, a datalogger at “7527779”. Youshould hear a dial tone, followed by a series of beeps andtones, followed by what sounds like white noise orscratching sounds and screeches. When the modemsconnect, you should see the word, “CONNEC T”, appear onthe screen, perhaps followed by information about the speedand type of connection. If you don’t hear a dial tone,perhaps you haven’t plugged in the telephone line or theline is not operational. If you hear the dial tone and thebeeps of the phone number being dialed, but there’s no ringon the other end, perhaps the number isn’t valid or youdidn’t “get an outside line”. If a person answers, perhapsyou have the wrong phone number. If it rings, and answerswith tones and screeches, but you don’t get a “CONNECT”message, perhaps you have dialed a fax number, or otherdata modem, but not one with a datalogger attached or thedatalogger is the wrong type.
Type <Enter><Enter><Enter>about 2-3seconds apart
To send carriage return characters to the array-baseddatalogger. If the datalogger recognizes these characters, itwill send back an asterisk, “ * ” for every <Enter>keystroke. If it does not, perhaps it’s not an array-baseddatalogger, or you’ve chosen a baud rate that’s too high forthe datalogger or the quality of the phone line is too poor tosupport that baud rate.
Type A <Enter> You should see a string of characters from the dataloggerthat report its status, including final storage pointers,memory size, perhaps lithium battery voltage, and internalerror counters. (See Section 5 in the datalogger manual formore information on telecommunication commands.) If youdo not, then the phone line may be too poor to supportcommunications. A long series of nonsense charactersusually indicates electrical noise in the vicinity of thetelephone cable that the modems are interpreting as highand low digital signals and reporting them as characters.
Type E <Enter> To hang up the datalogger, which causes it to turn off itsphone modem, which in turn causes loss of the carrier signalbetween the modems. After a few seconds you should see“NO CARRIER” reported by your base modem.
Type ATH <Enter> To hang up your base modem.

Section 14. Troubleshooting Guide
14-9
If the modem you select in LoggerNet’s Setup screen doesn’t work, check tomake sure you’ve selected the correct modem, that it’s powered up and that thephone line is working. You may have to adjust the baud rate. If you still havetrouble, you may need to consult your modem manual for the appropriateinitialization strings.
Perhaps you can communicate with other dataloggers on this phone line andwith this base modem, but there’s one remote datalogger that’s problematic.You could try communicating with that datalogger in remote keyboard mode.Using the example above, choose instead the datalogger in the TerminalEmulator and click Open Terminal. You should hear the phone modem dial,followed by screeches as the modems negotiate a connection, followed by“CONNECT”, etc., and then a response from the datalogger. Pressing <Enter>for an array-based logger should return an asterisk “ * ”. Typing “A” <Enter>should return the status line. Type “7H” (“2718H” for 21X or CR7Xdataloggers) to put the datalogger in remote keyboard mode. From there, youcan enter commands much like from a keyboard/display handheld interface.Pressing “*6” followed by several <Enter> keys should cause the datalogger toreport its input locations. If all you get from some of these commands is“MODE”, perhaps the datalogger has security set. See your datalogger manualfor other remote keyboard commands. You may also call your CampbellScientific application engineer for more help on troubleshooting links.
Using remote keyboard mode can result in loss of programs, data,or the ability to further communicate with a datalogger over aremote link, for example, by altering security settings or changinga program leading to memory resets or powering down a cellularphone. Remember that keystrokes entered may not reach thedatalogger intact. That is, the datalogger may not receive whatyou send.
14.5 RF Communication Link IssuesThere are two sets of problems that can degrade RF communications. The firstis using combinations of RF components that do not work well together. Thesecond is deterioration or failure of the RF components in the system. Thereare also situations where the equipment is performing as it should but marginalcommunications are due to poor line-of-sight or other environmental factors.There are a number ways to test the operation of an RF system. The threesections following illustrate things to look for and tests to perform totroubleshoot RF operations.
14.5.1 Checking RF Components and Connections
Before testing RF signal strength, there are several things that should be doneto verify that the right RF components are in place.
1. Check that the RF modem has the correct switch ID set on the DIP switches.(This is a common problem and should be checked first.)
2. Check the type and brand of the radio. In general, the radios in a networkshould be the same type.
NOTE
Section 14. Troubleshooting Guide
14-10
3. Check that the radio is set for the right frequency. With a programmableradio, verify that the correct frequency and other settings are set properly. Ifthe radio is crystal based there should be a label showing the frequency. If not,you will have to test the radio with a programmable scanner or frequencyanalyzer.
4. Check the cable connecting the radio to the RF modem. Differentcombinations of radios and RF modems require specific cables to make theright connections. For questions in this area, contact the network installer orCampbell Scientific.
5. Check that the antenna is the right type (directional or omnidirectional) andis designed for the frequency being used. Most antennas will have labelsidentifying the frequency range. Make sure the antenna is mounted for a clearline-of-sight and that directional antennas are properly oriented.
6. Make sure the antenna is the right impedance to match the system. This isalmost always 50 Ω. This should match the cable connecting the antenna to theradio and the radio connection.
7. Check that the cable connecting the radio to the antenna matches theimpedance of the antenna and the radio. This is almost always 50 Ω.
One simple, but very effective, technique is to swap out components. Usecomponents from a part of the network that you know is working, and swapthem out one at a time to isolate a faulty hardware component.
14.5.2 RF Signal Strength Testing
Once you have verified that the right equipment is in place, make sure that allof the components have power. Then you are ready to proceed withperformance testing.
To test a station’s radio/cable/antenna transmission capabilities, a directionalwattmeter is needed such as the Bird Electronic Corporation’s Model 4304AWattmeter. Proper connectors are also needed to place the wattmeter in seriesbetween the radio and antenna cable. A voltmeter is required to measure thebattery voltage of the datalogger with and without radio transmission.
If you are using a data radio that does not have a transmit buttonbuilt in, you can easily build a push to transmit button from thedocumentation of the radio/RF modem interface connector.There will be one pin that when pulled high or pulled low willinitiate radio communication. See the radio documentation toidentify this pin. Connect a momentary pushbutton to either raiseor ground that pin. Always make sure that the antenna isconnected to the radio before attempting to transmit. Seriousdamage to the radio can occur if transmitting without an antenna.
Place the wattmeter in series between the radio and antenna cable. Set thewattmeter to the 15-Watt range, or the next highest wattmeter setting, and pointthe directional arrow first toward the antenna cable to measure forward power(Wf). Initiate radio communication, let the wattmeter stabilize, and record the
NOTE
Section 14. Troubleshooting Guide
14-11
wattmeter reading. Reverse the directional arrow so it is pointing back towardthe radio, initiate radio communication, let the wattmeter stabilize, and recordthe wattmeter reading. This second reading is the reflected power (Wr). Takethe square root of the reflected power divided by the forward power to arrive atthe square root ratio (R). Calculate the Voltage Standing Wave Ratio (VSWR)with the following equation:
VSWR = [(1+R)/(1-R)]
Where, R = (Wr/Wf)½
The impedance of the RF transmission cable (usually RG-8A/U) and antennacombination should match the impedance (50 Ω) of the radio output circuit.When the transmission cable or antenna does not match the impedance of theoutput circuit of the radio, not all of the energy supplied to the cable will flowinto the antenna. Some of the energy supplied will be reflected back to theradio, causing standing waves on the cable. The ratio of voltage across the lineat the high voltage points to that at the low voltage points is known as theVoltage Standing Wave Ratio, or VSWR. The VSWR should be less than1.5:1 for error-free radiotelemetry.
For example, if the forward power (Wf) is 5 Watts and the reflected power(Wr) is 0.2 Watts, the VSWR is 1.5:1.
The VSWR will increase when:
• There is a problem with the connectors. Check for loose, corroded ordamaged connectors. (Connector problems are the most common source ofRF communications failures.) Pull gently on the cable to make sure theconnectors are still attached securely.
• The antenna is used in proximity of metal, which is reflecting the signalback to the radio.
• Transmitting inside a building.
• The cable is worn, cut or damaged so that not all of the radio energy cantravel through to the antenna.
• The antenna design frequency does not match the radio frequency.
If the VSWR is below 1.5:1, then power transmission is good. However, besure the antenna is oriented properly.
While at the station, check the voltage on the 12 V port of the datalogger bothwith and without the radio transmitting. Regardless of the battery type, thedatalogger requires a minimum of 9.6 Volts.
14.5.3 Troubleshooting With Attenuation Pads
This test is used to measure the signal strength of the radio signal between tworadios. There are situations where the signal from one radio can be heard bythe other, but the signal is not strong enough to establish communications. In

Section 14. Troubleshooting Guide
14-12
general a signal strength of greater than -95 dBm must be maintained for goodcommunications.
There are many factors than can contribute to inadequate power in an RFsystem.
• Line of sight may be marginal or poor.
• Vegetation on trees or other obstacles.
• Corroded connectors or connections not made properly.
• Inadequate antenna gain.
• Improper antenna alignment.
• Outside interference on the channel frequency from another source.
Testing the radio transmission quality between radios requires the use of aprogrammable scanner and a set of attenuators or attenuation pads. You willneed someone at each end of the radio link with a way to talk to each other.
If the carrier detect light is coming on at the RF base station radio, butcommunication quality is poor or not being set up properly, there may be amarginal or low signal power inherent in the RF link. In this case, it is a goodidea to do a signal power check with attenuation pads for each sub-link in acomplete RF link. Every RF link has one or more sub-links. For example, ifthere is one repeater in an RF link then there is a sub-link between the basestation and the repeater and a sub-link between the repeater and the fieldstation. The sub-links should be checked in both directions of communication.
Before proceeding, it is a good idea to calculate the theoretical signal power foreach of the RF links. Appendix C of Campbell Scientific’s RF Telemetrymanual outlines the calculations.
For proper radio communications the signal power must be greater than –95dBm at the standard transmission rate. However, a signal can be detected onthe radios with a power greater than –115 dBm. Therefore, there is a 20 dBmrange in which the radios are not working, but may “sound” proper.
An attenuation pad inserted into the link increases the power loss of the system.If a 20 dB attenuation pad, or two 10dB pads in series, are inserted into the linkand subsequently the radio will not detect the signal, the signal power isbetween –95 and –115 dBm which is below the power limit for good datatransmission.
Similarly, if a 10 dBm attenuation pad is inserted in the link and the radiosubsequently will not detect the signal, the actual signal power is between –105and –115 dBm. In this case, the signal power is far below the power limit.

Section 14. Troubleshooting Guide
14-13
Attenuation Pads(10 - 20 dB)
Radio
ProgrammableScanner
To test the power being received by a radio over an RF link, disconnect theradio from the antenna and insert the programmable scanner as shown in thefigure above. Program the scanner to the radio frequency and adjust thesquelch control until ambient RF noise is just cut out. This level will normallybe around -110 to -115 dBm. The scanner is now ready to conduct the test.
If you are using a data radio that does not have a transmit buttonbuilt in, you can easily build a push to transmit button from thedocumentation of the radio/RF modem interface connector.There will be one pin that when pulled high or pulled low willinitiate radio communication. See the radio documentation toidentify this pin. Connect a momentary pushbutton to either raiseor ground that pin. Always make sure that the antenna isconnected to the radio before attempting to transmit. Seriousdamage to the radio can occur if transmitting without an antenna.
First, test the sub-link of the base station to the first repeater or field station.Initially treat the base station as the transmitting station and the first field orrepeater station as the receiving station. Disconnect the radio’s multicoloredcable from the RF modem. To start the test have the person at the base stationinitiate a radio transmission. When the radio transmission is received, if squelchis broken, you will hear it on the speaker of the scanner. If you don’t hear theradio transmission, the signal is getting lost in the ambient noise and will not bepicked up. If squelch is not broken, then either the signal power is less than-115 dBm, or something is wrong with the power supply, antenna orientation,or cable connections. If squelch is broken on the receiving radio, the site canbe tested with the attenuation pads to determine the approximate signal power ifit is between –115 and –95 dBm.
NOTE
Section 14. Troubleshooting Guide
14-14
Insert the attenuation pad(s) (20 dB) between the scanner and antenna of thereceiving station ONLY (most attenuation pads have a limited currentcapacity). Initiate radio transmission from the base station transceiver. Ifsquelch is broken at the receiving station, this sub-link is good in this direction.If squelch is not broken this sub-link has signal power between –95 and –115dBm which should be corrected. Corrections can involve shortening thedistance between radios, reorienting antennas, fixing connectors or cables,providing a better power supply, or shortening coaxial cable lengths.
If it did not break squelch with the 20 dBm attenuation pad, it is possible todecrease the attenuation to 10 dBm to determine if signal power is between -95and –105 dBm, or between –105 and –115 dBm. This will identify if the signalpower is close to or far away from –95 dBm.
If it did break squelch with the 20 dBm attenuation pad, then that sub-link isgood in that direction. The next sub-link can now be tested. Remember toplace the attenuation pads at the receiving station only! If all of the sub-linkswere good, the same sub-links can be tested in the opposite direction. Ifreversing directions in a sub-link gives bad results while the other direction isgood, be suspicious of the transmitting radio in the bad direction and the radio’spower supply.
14.6 Using Data Table MonitorData Table Monitor is a utility that was created to retrieve data from theLoggerNet server data cache and display it on the screen. It also has the optionto export it to a file. Once the utility has been started, as new records arecollected by the server, the new records will be displayed and sent to the file.
The most important use of Data Table Monitor is to see what records are beingstored in the data cache and to diagnose suspected data cache problems.
Data Table Monitor gets all the data available from the data cache that matchesthe export conditions. As the server collects new records from the datalogger,they are automatically displayed and sent to the data file. This continues untilData Table Monitor is closed or data export is stopped.
One caution about the data file created by Data TableMonitor—there are no limits to size or longevity. If you planto use the export to file feature on a regular basis, makesure to either restart Data Table Monitor (which overwritesthe exported file) or delete the files periodically. The dataexport can easily be restarted by clicking on the Startbutton. This will delete the old file and start a new one.
To start Data Table Monitor open Windows Explorer and got to the ProgramFiles\CampbellSci\LoggerNet directory. Double click on the Tablemon2.exefile. The utility will start with a screen similar to the one shown below.
CAUTION

Section 14. Troubleshooting Guide
14-15
Click on the Connect button to connect to the LoggerNet server. The dialogbox shown below will be displayed. If you are working on the same computerwhere LoggerNet is running leave the default Server Host Address as localhost.The Server Port number should also be 6789. The Logon Name and LogonPassword are only used with versions of LoggerNet that support security. Toconnect to LoggerNet on another computer, enter the computer network nameor IP address as the Server Host Address. When you click on OK a list of thedataloggers in the network will be shown in the upper left window.
Selecting a datalogger will list the names of the data tables or array IDs in thedatalogger. Note that if data collection has not been set up and enabled in theSetup Screen, no data will be coming into the data cache. Data Table Monitor

Section 14. Troubleshooting Guide
14-16
can only display and output data from the data cache. Data Table Monitordisplays and outputs all the data points from an array or table.
Click on the Start button to bring up the Start Advise Options dialog. Thisdialog gives you choices about which records to display and the data file inwhich to store them.
Start Option: This selects the starting point for the data to be displayed andoutput to the file.
• 1 At Record: This option allows a selection of starting position based onthe file mark and record number. An entry of 0 in both fields will get all ofthe data in the data cache.
• 2 At Time: This option allows a selection of the starting position based onthe timestamp in the data. The time and date are set in the Begin Date field.All of the records available after this timestamp are output.
• 3 At Newest: This option will set the starting position to the last recordstored in the data cache. This last record and any future records stored willbe output.
• 4 After Newest: This option will set the starting position to be the nextrecord stored in the data cache. Output begins with the next record storedin the data cache. No historical records will be output.
• 5 Relative to Newest: This option starts from the most recent recordcollected. The Offset from Newest specifies how much time to go back

Section 14. Troubleshooting Guide
14-17
from the current write index. For example, an offset of 10 with a setting ofminutes will get the last 10 minutes of data collected.
• 6 At Offset from Newest: This option allows you to specify how manyrecords back from the current write index to go. A setting of 10 in theStart Offset box will display the last 10 records collected.
The Start File Mark, Start Record Number, Start Offset, Begin Date, and Offsetfrom Newest edit boxes are used only with the corresponding start optionsabove. For each option selected, the appropriate boxes are enabled.
Once the start options have been set, click on the OK button to start writing tothe file. The records are always displayed in the list box on the bottom of thescreen. If you have set up an output file they are also sent to the output file.
Ordering Option:
• 1 Collected: displays and writes the data to the file in the order it wascollected by the server. This setting is useful to look at the actual datarecord storage in the data cache.
• 2 Logged With Holes: The output will include only complete datasequences. If the Data Table Monitor comes to a hole that has not yet beenfilled, it will wait for the hole to fill before displaying or writing the nextrecord to the file.
• 3 Logged Without Holes: The data output will be displayed and written tofile as quickly as it is collected, without waiting for holes to be filled. Anydata in holes will be skipped in the output.
• 4 Real Time: the most recent data is always sent out starting with the lastrecord stored. This will not provide a complete data set.
Holes in the data only apply to table-based dataloggers that areusing data advise collection. This option is supported in version1.1 of LoggerNet and will be supported in future versions ofLoggerNet 2. Only the Collected and Real Time options applyfor array-based dataloggers.
Set the output file directory and name in the Export File box. The Browsebutton will bring up a Windows Save As dialog box to select the file name anddirectory.
Click on OK to begin displaying the data.
NOTE

Section 14. Troubleshooting Guide
14-18
This is a blank page.

15-1
Section 15. Implementing AdvancedCommunications LinksThis section describes the configuration and operation of a variety of communicationslinks. The communications links included here require special setup or configuration, orrequire special consideration in the implementation to work properly.
Refer to Section 5.1 if you need general information on addingdevices to the device map.
15.1 Phone to RFPhone to RF is used in situations where the RF network is far away from wherethe LoggerNet server computer is located and phone access is available to theRF base site. Before implementing this type of network, consideration needs tobe given to the collection intervals and the communication time requiredbetween the computer and the RF base.
LoggerNet will make a call each time that it does data collection for a station.It will stay on-line until a response is received - either the data, or an errorindicating that the data collection failed. LoggerNet will also initiate a call forany datalogger operations such as connect in the Connect screen or get tabledefinitions in the Setup screen.
15.1.1 SetupThe device map set up in the Setup Screen for a Phone to RF link would looksimilar to the communications network below.
To begin, add a Serial Port to the device map if one does not exist. Add aPhone Modem to the Serial Port. To this Phone Modem, add a Remote PhoneModem. Next, add an RF base modem and then an RF remote modem. Tocomplete the network, add your datalogger to the remote RF modem. Reviewall of the settings for each device, and make any changes to customize thesettings for your network configuration.
NOTE

Section 15. Implementing Advanced Communications Links
15-2
15.1.2 Operational Considerations
15.1.2.1 Scheduled Data Collection
The intervals for scheduled data collection need to set up to allow time for thecommunications link to be established. Keep in mind that the phone modemrequires 15-20 seconds to dial and establish communication. Also each link inthe RF connection requires 3-5 seconds to link to the next device. This meansthat a phone to RF network with 2 repeaters could take over 30 seconds toestablish the link and start collecting data. Some time is also required to closedown the link before another station can be contacted. Make sure the collectionschedule allows enough time for each station to be contacted before contactingthe first station again.
15.1.2.2 Extra Response Time
LoggerNet is pre-programmed to expect certain response times from devicesdepending on the type of intermediate devices and the communication rateschosen. If the datalogger network communications link is marginal, it may takelonger to negotiate communication between the devices. Extra response timeadded to one or more of the devices may help to prevent the software fromtiming out. Note that the extra response times added for each device arecumulative for the entire communications link, and the total response timeincludes the default times plus any extra response time that has been added.
15.1.2.3 RF Address
The hardware settings for the address of the RF base must be 255 for phone toRF operation. Additionally, ensure that the addresses set for the RF remotehardware match the settings defined in Setup.
15.1.2.4 Max Time Online
The Max Time Online setting is used to force LoggerNet to terminate aconnection if the maximum time limit is exceeded. This is used to prevent aphone modem from getting stuck online and incurring extra long distancephone charges or inhibiting scheduled data collection from other stations. Inphone to RF systems this value should be long enough to allow data collectionfor the anticipated amount of data. If the Max Time Online is reached,LoggerNet will force the connection to close, even if it is in the middle ofcollecting data.
15.1.3 Attaching a Datalogger to the RF BaseConnecting a datalogger at the RF Base in a Phone to RF system requires someadditional configuration. The operational considerations are the same as for thestandard Phone to RF network. (See section 15.1.2.)
15.1.3.1 Hardware Setup
The RF modem in the RF Base has to be configured to work in SynchronousDevice Communication (SDC) mode. This is done by changing the 9th DIP

Section 15. Implementing Advanced Communications Links
15-3
switch inside the RF Base modem to a 0 or closed. This will allow thedatalogger to pass communication to the RF Base.
SDC mode cannot be used with 21X or CR7 dataloggers or anyof the table based dataloggers.
The datalogger and the RF base must both be connected to the remote phonemodem on the same 9 pin ribbon cable.
15.1.3.2 Network Setup in LoggerNet
Setting up a datalogger at the RF base in a Phone to RF system requires that thedatalogger be connected as a child of the remote phone modem, and the RFBase be connected as a child of the datalogger. Then the RF network isconnected to the RF Base. An example of this type of configuration is shownbelow.
In Phone to RF systems with a datalogger at the RF base, youshould set all three levels of datalogger security so the computerhas to unlock the datalogger before getting data. This willprevent a situation where the computer can be getting data fromthe wrong datalogger when a connection to a remote station fails.
15.2 Phone to MD9
15.2.1 SetupThe device map for a phone to MD9 link would look similar to thecommunications network below.
NOTE
NOTE

Section 15. Implementing Advanced Communications Links
15-4
To begin, add a Serial Port to the device map if one does not exist. Add aPhone Modem to the Serial Port. To this Phone Modem, add a Remote PhoneModem. Next, add an MD9 base and then a remote MD9. To complete thenetwork, add your datalogger to the remote MD9. Review all of the settings foreach device, and make any changes to customize the settings for your networkconfiguration.
15.2.2 Operational Considerations
15.2.2.1 Scheduled Data Collection
The intervals for scheduled data collection need to set up to allow time for thecommunications link to be established. Keep in mind that the phone modemrequires 15-20 seconds to dial and establish communication. Some time is alsorequired to close down the link before another station can be contacted. Makesure the collection schedule allows enough time for each station to be contactedbefore contacting the first station again.
15.2.2.2 MD9 Addresses
The address for an MD9 base device is set in the LoggerNet communicationssoftware at 255. The hardware configuration in the MD9 base modem mustmatch for successful communications (refer to your MD9 users manual forinformation on setting the hardware switches within the device). In addition, theaddress specified in Setup for the MD9 remote modem must match its hardwareconfiguration.
15.2.2.3 Extra Response Time
LoggerNet is pre-programmed to expect certain response times from devicesdepending on the type of intermediate devices and the communication rateschosen. If the datalogger network communications link is marginal, it may takelonger to negotiate communication between the devices. Extra response timeadded to one or more of the devices may help to prevent the software fromtiming out. Note that the extra response times added for each device arecumulative for the entire communications link, and the total response timeincludes the default times plus any extra response time that has been added.
15.2.2.4 Max Time Online
The Max Time Online setting is used to force LoggerNet to terminate aconnection if the maximum time limit is exceeded. This is used to prevent aphone modem from getting stuck online and incurring extra long distancephone charges or inhibiting scheduled data collection from other stations. Inphone to MD9 systems this value should be long enough to allow datacollection for the anticipated amount of data. If the Max Time Online isreached, LoggerNet will force the connection to close, even if it is in the middleof collecting data.
15.2.2.5 Grounding
Depending on the configuration and distance of the MD9 network, be sure tofollow the grounding guidelines provided in the MD9 hardware manual.

Section 15. Implementing Advanced Communications Links
15-5
Grounding issues have been known to prevent reliable communications anddata collection.
15.3 TCP/IP to RFThe development of Serial Server devices that allow serial communicationsdevices to be connected to TCP/IP networks now allows an RF network to beconnected to the LoggerNet server over the Internet or across a Local AreaNetwork. A Serial Server has a standard TCP/IP connection on one side andone or more serial ports, typically RS232, on the other. This type of networksetup is typically used for organizations that have field offices or stations thatare connected together by a TCP/IP network. This allows the LoggerNet servercomputer to be located in a central area for administration while providingcommunications to remote RF networks.
15.3.1 SetupThe device map set up in the Setup screen for a TCP/IP to RF link would looksimilar to the communications network below.
To begin, add an IPPort to the device map if one does not exist. Add an RFbase modem to the IPPort, and to this, add the remote RF modem. To completethe network, add your datalogger to the remote RF modem. Review all of thesettings for each device, and make any changes to customize the settings foryour network configuration.
15.3.2 Operational ConsiderationsThere are several settings that should be configured to optimize the TCP/IP toRF network.
The Low Level Packet Delay is configured using CoraScript (see AppendixF). This is setting number 53 for the RF Base. This governs how rapidlyhandshaking packets are exchanged by the server and the RF base while adatalogger transaction is pending. By default there is no delay so these packetspass back and forth about 5 or 6 times a second. For TCP/IP communicationsthis should be slowed down by setting the number of milliseconds to wait to atleast 1000 (1 second delay).
Max Time online – This should be set to zero (disabled) for all of the stationsin the RF network. Otherwise, when the communications link is droppedbecause this value is exceeded, communication will be re-attemptedimmediately. Forcing the connection offline and back on quickly causes errorsbecause not enough time is allowed for the serial server to reset the TCP/IPsocket.

Section 15. Implementing Advanced Communications Links
15-6
15.3.3 Special ConsiderationsTo implement TCP/IP to RF communications, a serial server has to be providedas the interface between TCP/IP and the serial connection on the RF base.There are a number of Serial Server devices available including the NL100Network Link Interface manufactured by Campbell Scientific.
When connecting the RF Base to a Serial Server or the RS232 connector of theNL100 you will need to build or modify a serial cable to either cut or removethe RTS line. The other standard serial communication lines need to be inplace.
This special cable is needed to allow an RF base to work with the standard RS-232 Port on other Internet serial devices. The drawing below depicts the cableneeded.
Third-PartySerial Server
Campbell ScientificRF232
RF Network Base
25pin
RS-232
25pin
RS-232
EtherN
et port
Radio C
onnection
TxDRxD
CTSDSRDTRDCDGND
RTS
2
887
20654
32
7
20654
3
The serial server must be configured for this application before operation. Thebasic settings that must be configured are listed below. Depending on thespecific serial server, there may be other settings that must be configured forproper operation.
IP address – This is the Internet Protocol address that is used by LoggerNet tocommunicate with the serial server. This address must be unique on thenetwork where it is running and is typically assigned by a networkadministrator. An IP address is typically entered as four numbers separated byperiods. As an example 198.199.32.45 would be an IP address. Do not useleading zeros for any of the numbers in the IP address. An address of198.192.035.002 would cause an error in the network configuration.
Subnet Mask - This setting is used to limit the search applicability area for IPaddresses. If both the server and the serial server are in the same low levelsubnet this would be set to 255.255.255.0. Consult with the networkadministrator for the proper setting.
Default Gateway - This specifies the IP address of the router for the localcomputer network. Consult with the computer network administrator for theproper setting.

Section 15. Implementing Advanced Communications Links
15-7
Baud Rate – This specifies the baud rate used by the serial server tocommunicate with the serial device attached to the COM port. The RF basecommunicates at a baud rate of 9600.
IP Port ID – This specifies the port ID used by the serial server to direct serialcommunications. This must be set even on devices with only one port. Thisnumber is entered as part of the IP address in Setup for the IPPort device. Forexample, if the port ID was specified to be 3201, using the IP address above theentry in Setup would appear as follows: 198.199.32.45:3201
Inactivity Timeout – This timer resets the TCP/IP socket port if there has notbeen any activity on the port for the specified period of time. The time isusually specified in minutes. This prevents a situation where the socket getsleft open after a call and blocks other incoming calls.

Section 15. Implementing Advanced Communications Links
15-8
This is a blank page.

A-1
Appendix A. Glossary of TermsA
Advise – See Data Advise
ASCII File - A computer file containing letters, numbers, and other charactersusing the ASCII character encoding.
Asynchronous - The transmission of data between a transmitting and areceiving device occurs as a series of zeros and ones. For the data to be "read"correctly, the receiving device must begin reading at the proper point in theseries. In asynchronous communications, this coordination is accomplished byhaving each character surrounded by one or more start and stop bits thatdesignate the beginning and ending points of the information (seeSynchronous). The transfer of information is not otherwise coordinatedbetween the sender and receiver.
Analog Channel - A terminal on the datalogger's wiring panel where leads foranalog signals are connected. The analog channels are designated single-ended(SE) or differential (DIFF) on the wiring panel. Many sensors, such asthermistor temperature probes and wind vanes, output analog signals.
Array-based Datalogger - Array-based dataloggers save all output in thedatalogger's final storage memory. When data is directed to final storage, aunique array ID number is stored, followed by other values as determined bythe datalogger program. These are called “elements”. Array-based dataloggerssave all information that is directed to output storage to the same area ofdatalogger memory (as opposed to table-based dataloggers that store differentoutput processing to separate tables in datalogger memory). Data retrieved byPC software is separated based on the array IDs.
B
Baling – The process by which the Baler produces data files containing theinformation collected by the LoggerNet Server during a user specified interval.
Batch Files - An ACSII text file that contains one or more DOS commands orexecutable file commands. When the batch file is run, the commands in the fileare executed sequentially.
Battery - This entry in the status table returns the datalogger battery voltage.
Baud - The rate at which a communication signal travels between two devices.
Binary File - A file based on software defined formatting. A binary file canonly be interpreted by the software programmed to decode the formatting. Thisformat is used for more efficient data storage than is provided by ASCII.
BMP (Block Mode Protocol) – The communications protocol used by theserver to communicate with table-based dataloggers and RF modems.
Broadcast – Part of the radio (RF) technique of polling remote radio modemdatalogger sites. A single modem sends a message (broadcast) that all affectedremotes hear and respond to.

Appendix A. Glossary of Terms
A-2
C
Call-back - When a datalogger is programmed for Call-back, it willautomatically call the host computer when a specified condition is met. Thecomputer must be set up to look for such an incoming call.
Call-back ID Number - A three-digit number that is used to identify whatdatalogger has called the host computer. (Not available for Table-baseddataloggers.)
Cancel - Choosing Cancel from a dialog box will ignore any changes made andclose the box.
Carrier – An electrical signal used to convey data or other information. Forexample, radio and phone modems use carrier signals. Phone modems attemptto detect carrier when the call is placed. The red LED on the RF95T lightswhen the modem detects a carrier.
Child Node – See Node. A node that is accessed through another device(parent node). For example a remote radio (RF) site is accessed through thebase RF232T. All nodes are child nodes of the PC.
Client – a software application designed to connect to a server. Usuallyprovides some type of user interface or data acquisition.
Coaxial cable – Special type of cable with two conductors (center conductorand outer shield conductor). Classified by size, impedance, and losscharacteristics. Used to connect MD9 modems and to connect radios toantennas.
Collection - (see Data Collection)
COM Port - A computer's serial communications port. Cables and otherinterface devices are connected between the computer's COM port and thedatalogger.
Control Port - Dataloggers have digital output ports that can be used to switchpower to sensors such as the HMP35C relative humidity circuit or to controlrelays. These digital outputs are called Control Ports and are labeled C1, C2,etc., on the wiring panel. Control ports on some dataloggers can also be used asinputs to sense the digital (high or low) state of a signal, or used as datainput/output connections for SDI-12 sensors.
CoraScript – This is a command line interpreter that allows the user access tomany of the capabilities of the LoggerNet server using direct commands orprogrammed script files.
CR10X-TD Family of Dataloggers - This includes the table-baseddataloggers, specifically the CR10T, CR510-TD, CR10X-TD, and CR23X-TD.
CRBasic - The programming language used for CR5000/9000 dataloggers.The CRBasic editor is used to create the program files for these dataloggers.

Appendix A. Glossary of Terms
A-3
D
Data Advise (Datalogger) – A mutual agreement between the server and thedatalogger about which tables are to be collected every time the datalogger iscontacted. Based on the dataloggers table definitions.
Data Advise (Server) – an agreement between a client application and theserver to provide specified data as it is collected by the server.
Data Advise Notification – The packet of data sent by the datalogger based onthe Data Advise agreement.
Data Cache – The storage for data collected from the datalogger by theLoggerNet server. This data is stored in binary files on the hard disk of thecomputer where the server is running.
Data Collection - Getting stored data from the datalogger and saving it in thecommunication server's data cache (compare to Data Retrieval).
Data Point - A data value which is sent to Final Storage as the result of anOutput Instruction. A group of data points output at the same time make up arecord in a data table.
Data Retrieval - Extracting data from the communication server's data cacheto export to a file, network, or data display (compare to Data Collection).
Data Storage Table, Data Table - A portion of the datalogger’s Final Storageallocated for a particular output. Each time output for a given data table occurs,a new record is written to the table. The size of the table (in number of records)and when records are written to the data table are determined by thedatalogger’s Data Table Instruction (P84). The fields (columns) of the table aredetermined by the Output Processing Instructions that follow the Data TableInstruction.
Data Table Instruction - Instruction 84. Used to create a Data Table and tocause records to be written to the Data Table.
DaysFull - This field in the status table shows the number of days remainingbefore any of the tables using automatic record allocation are filled.
Differential Analog Input - Some sensors have two signal wires and themeasurement is reflected in the voltage difference between them. This type ofsensor requires two analog connections. The channels marked DIFF on thedatalogger wiring panel are used to connect differential sensors.
DLD File - The DLD file is an ASCII file that can be sent to program thedatalogger. Dataloggers must be programmed to perform measurements,convert data to final units, and to save data for retrieval. Edlog is used to createthese files that are saved to disk with a DLD file name extension. A programmust be sent to the datalogger before the datalogger will begin to collect data.
E
Edlog - Campbell Scientific's editor application to create new or edit existingdatalogger programs.
EEPROM - Electrically erasable read only memory. The memoryCR10X-TD, CR510-TD, and CR23X-TD dataloggers use to store their

Appendix A. Glossary of Terms
A-4
operating system. A new operating system can be transferred to the dataloggerusing a special software package (see PROM).
Execution Interval - The periodic interval on which the datalogger program isrun. The execution interval is sometimes referred to as the Scan Interval. Forexample, when an execution interval of 60 seconds is set, the datalogger willexecute its program table every 60 seconds. Between executions the dataloggerenters a sleep (quiescent) mode. This conserves battery power and createspredictable measurement intervals. The execution interval is synchronized withthe datalogger's real-time clock.
Execution Time - The time required to execute an instruction or group ofinstructions. If the total execution time of a Program Table exceeds the table'sExecution Interval, the Program Table will be executed less frequently thanprogrammed. Each time this occurs, a Table Overrun occurs. Table Overrunsare considered to be “errors” and are reported in the datalogger statusinformation table.
Excitation Channel - Many sensors require a precise electrical voltage to beapplied. The excitation channels, marked as E1, E2, etc., on the dataloggerwiring panel, provide this required voltage.
F
Fault – Message relating to network activity where repeated problems or errorshave occurred. Repeated faults usually indicate a failure of some kind.
F1 - In most instances, pressing the F1 key will provide context sensitive helpfor the highlighted object on the screen.
Final Storage - Final Storage is an area in the datalogger's memory where datais stored for collection to a PC. When you collect data from the datalogger youare collecting data from a Final Storage table.
Flag - Memory locations where the program can store a logical high or lowvalue. These locations, called User Flags, are typically used to signal a state toanother part of the program.
G
Ground Connection - Most sensors require one or more ground connections inaddition to excitation or signal inputs. Ground connections may serve any ofseveral purposes:
• a reference for a single-ended (SE) analog voltage
• a power return path
• a connection for cable shield wire to help reduce electrical noise
H
Appendix A. Glossary of Terms
A-5
Highlight – Text or objects can be highlighted, by positioning the cursor whereyou want the highlight to begin, holding the left mouse button, and dragging itacross the words or group of objects to be highlighted. A single object can behighlighted, by clicking it once with the left mouse button. Highlighted itemscan then be edited or activated.
Holes – Because Data Advise always get the most recent data records, therecan be sequences of older data available from the datalogger that have not yetbeen collected to the data cache. The server tracks and optionally collects theseholes. This entry in the status table shows the number of data points in missedrecords for the data storage tables in that station.
Hole Collection – The process used by the server to collect from thedatalogger, data records missing from the data cache. If Hole Collection isdelayed or disabled, the memory in the datalogger can ring around andoverwrite the missing data records resulting in an Uncollectable Hole.
Host Computer - The machine where the LoggerNet communication serversoftware is running.
I
INI Files - Configuration files that are used to preserve the last known setups ofa program or device.
Initialization String - A string of alphanumeric characters that are sent to adevice, such as a modem, to prepare that device for communications.
InLocs - Abbreviation for “Input Locations”. This entry in the status tableshows the number of input locations allocated for the program.
Input Location Storage - Each time a measurement or calculation isperformed the resultant value is stored in an Input (memory) Location,sometimes abbreviated as "InLoc."
Input/Output Instructions - Datalogger program instructions used to makemeasurements or send data automatically to other devices.
Intermediate Storage - Datalogger memory used to temporarily store values,typically to be used for output calculations. The datalogger uses IntermediateStorage to accumulate sensor readings until output.
L
Link – Communications route between two devices, for example the phone linkbetween two phone modems.
Log Files - Log files are text files that are stored on the host computer’s harddrive. They contain information about communications between the LoggerNetserver and other devices in the datalogger network. Log files are typically usedfor troubleshooting purposes. LoggerNet has four types of log files:Communications Status, Object State, Transaction, and Low Level I/O. Referto Appendix D for information on these log files.

Appendix A. Glossary of Terms
A-6
M
MD9 - An MD9, or multi-drop modem, is a communications device that usestwisted pair cable for connection. Typically, the system consists of one MD9base modem that is attached to the user’s computer, with one or more remotemodems at the datalogger field site. One remote modem is needed for eachdatalogger at the field site.
Measurements - Measurements are what the datalogger stores in an InputLocation after reading an electronic signal from a sensor and converting the rawsignal into meaningful units.
Modem - A device used to transmit and receive digital data over normallyanalog communications lines, usually as an audio signal on telephone circuits.A modem attached to a computer performs a digital-to-analog conversion ofdata and transmits them to another modem which performs an analog-to-digitalconversion that permits its attached computer to use the data.
Monitor - A computer’s CRT, or display, is referred to as a monitor.
N
Net Description – Description of dataloggers and communications devices thatform the datalogger network. Entered using the Setup screen and used byLoggerNet to communicate with the various dataloggers.
Node – Part of the description of a datalogger network. Each node represents adevice that the server will dial through or communicate with directly. Nodes areorganized as a hierarchy with all nodes accessed by the same device (parentnode) entered as child nodes. A node can be both a parent and a child node.
O
ObjSrlNo - This entry in the status table provides the revision number of thedatalogger PROM.
Output Interval - The output interval is the interval in which the dataloggerwrites data to Final Storage. The output interval is defined by Instruction 84 inEdlog (for table-based dataloggers).
Output Processing - Writing to final storage memory a sample or summarystatistic of data measurements. Output processing options include sending asample, average, maximum, minimum, total, or wind vector of data to FinalStorage. Each Output Processing data value is kept in a separate location withinthe datalogger. This allows multiple output processing for each measurement.For example, you can average air temperature over a 60-second interval, a one-hour interval, and a 24-hour interval.
Overrun Errors - Overrun errors occur when the actual program executiontime exceeds the execution interval. This causes program executions to beskipped. When an overrun error occurs, the Table Overrun parameter in thedatalogger's status table is incremented by 1.
Overruns - This entry in the status table provides the number of table overrunsthat have occurred. A table overrun occurs when the datalogger has insufficient

Appendix A. Glossary of Terms
A-7
time between execution intervals to complete one pass through the program.This counter is incremented with each table overrun.
P
Packet – a unit of information sent between two BMP devices that arecommunicating. Each packet can contain data, messages, programming, etc.Usually contains addressing and routing information.
Parameter - Numbers or codes which are entered to specify exactly what agiven datalogger instruction is to do.
Path – The modems, or other devices that make up a link to communicate witha remote site datalogger.
Polling – Process where a datalogger or other communications device isperiodically checked for any packets it needs to send. The server pollsdataloggers for most communications links. With Radio (RF) the RF232T baseor repeaters can poll datalogger sites.
Polling Interval – The user-specified interval that determines when to poll agiven device.
PrgmFree - An entry in the status table that shows the amount of remainingprogram memory, in bytes.
PrgmSig - An entry in the status table that shows the signature of thedatalogger program. The signature is a unique number derived from the sizeand format of the datalogger program
PromID - An entry in the status table that shows the version number of thedatalogger PROM or OS.
PromSig - An entry in the status table that shows the signature of thedatalogger PROM or OS. As with the PrgmSig, if this signature changes, thedatalogger instruction set has somehow been changed.
Processing Instructions - Datalogger instructions that further process inputlocation data values and return the result to Input Storage where it can beaccessed for output processing. Arithmetic and transcendental functions areincluded in these instructions.
Program Control Instructions - Datalogger instructions that modify thesequence of execution of other instructions in the datalogger program; also usedto set or clear user flags.
Program Signature - A program signature is a unique value calculated by thedatalogger based on program structure. Record this signature in a daily outputto document when the datalogger program is changed.
Program Table - The area where a datalogger program is stored. Programmingcan be separated into two tables, each having its own execution interval. A thirdtable is available for programming subroutines which may be called byinstructions in Tables 1 or 2. The length of the tables is constrained only by thetotal memory available for programming.
PROM - Programmable Read-Only Memory. PROM integrated circuit chipsare used to store the datalogger Operating System (OS) in the CR10T

Appendix A. Glossary of Terms
A-8
datalogger. The PROM can be replaced to install a new operating system (seeEEPROM).
Pulse Channel - Some sensors output voltage pulse signals. Such sensors canbe connected to Pulse Channels for measurement (labeled as P1, P2, etc., on thedatalogger's wiring panel).
Q
Quiescent Mode - Often referred to as "sleep mode". The datalogger is in alow power state between program execution intervals.
R
Real-Time Clock - All dataloggers have an internal clock. The date and timeinformation from this clock are used in the time stamp for stored data. Thedatalogger's execution interval and timer are synchronized with the clock. TheCR10X-TD, CR510-TD, and CR23X-TD have battery backups which maintainthe clock even when 12 V power is not available.
Record - A group of data values output at the same time to the same data table.Records are written in response to the Data Table Instruction (84). Theindividual fields within each record are determined by the Output Processinginstructions following the Data Table Instruction that created the data table.
RecNbr - An entry in the status table that shows the record number in the table.
Remote Site – Usually refers to the site where datalogger is located at the otherend of a communications link. Also can refer to the site where a radio (RF)repeater is located.
Repeater – a radio (RF site that relays packets of information to a remote site.Used to extend the range of radio transmissions. Any remote datalogger sitewith radio can act as a repeater.
Retries – When a transaction or communication between two devices orprograms fail, the transaction or communication is usually repeated until itsucceeds.
Retrieval - (see Data Retrieval)
RF – Dealing with radio telemetry. Stands for Radio Frequency.
RTMS – Real-Time Monitoring Software. A software application designed byCampbell Scientific for fast real-time data acquisition. RTMS was designed forIBM’s OS/2 PC operating system and replaced by LoggerNet.
S
Scan Interval - See Execution Interval.
SDI-12 - SDI-12 stands for Serial Digital Interface at 1200 baud. It is anelectrical interface standard and communications protocol that was originallydeveloped by Campbell Scientific and other manufacturers for the U.S.Geological Survey for hydrologic and environmental sensors. SDI-12 was

Appendix A. Glossary of Terms
A-9
designed to be a simple interface (ground, 12 volts, and signal) that improvescompatibility between dataloggers and "smart" microprocessor-based sensors.
Other goals of the SDI-12 standard are:
• low power consumption for battery powered operation via the datalogger
• low system cost
• use of multiple sensors on one cable connected to one datalogger
• allow up to 200 feet of cable between a sensor and a datalogger
Security Code - A four-digit code entered into the datalogger to preventunauthorized access to datalogger settings, programs, and data.
Server – Refers to a software application that accepts connections from clientapplications and provides data or other information as requested. TheLoggerNet server manages all the communications and data collection for anetwork of dataloggers. The collected data is made available for clientapplications.
Signature – Number calculated to verify both sequence and validity of byteswithin a packet.
Single-ended Analog Input - Some analog sensors have only one signal wire.(They will also have another wire that can be grounded and that is used as thereference for the signal wire.) With this type of sensor, only one analogconnection is required. Hence, it needs a "single-ended" or SE analog input.The single ended channels are marked as SE on the datalogger wiring panel.
Socket Data Export – a software application that connects to the LoggerNetserver and provides a TCP/IP socket for a user created application to receivedata records from the server data cache.
Station - A datalogger site is often referred to as a station.
Station Number – The LoggerNet server assigns and uses station numbers forrouting packets to the dataloggers. These numbers can be modified usingCoraScript.
Storage - An entry in the status table that shows the number of final storagelocations available.
Synchronous - The transmission of data between a transmitting and a receivingdevice occurs as a series of zeros and ones. For the data to be "read" correctly,the receiving device must begin reading at the proper point in the series. Insynchronous communications, this coordination is accomplished bysynchronizing the transmitting and receiving devices to a common clock signal(see Asynchronous).
T
Tab Windows - Some screens depict a series of related windows in a multi-tabbed notebook format. When you click on the file folder tab, the informationon the tab you chose will be displayed.
Tables - An entry in the status table that shows the number of user-created datatables. (See also Data Table.)

Appendix A. Glossary of Terms
A-10
Table-based Dataloggers - Table-based dataloggers store each record of datathat follows an output instruction in a table. Each separate occurrence of anoutput instruction directs the datalogger to store the data in a separate table.Refer to Appendix B for additional information on table-based dataloggers.
Table Definitions – List of data available from a datalogger. The dataloggersupplies this list on request. The tables are based on the dataloggerprogramming. The LoggerNet server must have a current version of the tabledefinitions to collect data from the datalogger.
Throughput - The rate at which a measurement can be made, scaled toengineering units, and the reading stored in Final Storage.
Time Stamp - The date and time when data are stored in the datalogger.
TMStamp - An entry in the status table that shows the date and time the statusinformation was recorded.
Transaction - The exchange of data or information between two devices orprograms. For example setting of the clock in a datalogger is a transactionbetween the server and the datalogger.
U
Uncollectable Hole – Occurs when a hole in the data cache cannot be collectedfrom the datalogger before the data table wraps around and the records areoverwritten.
V
Variable Name - Edlog uses variable names in expressions. Variables areanother name for input location labels. For instance, in the equation TempF =(TempC*1.8) + 32, TempC is an input location label and TempF is a newlocation calculated from TempC.
W
Wiring Panel - The set of terminals and underlying circuits that enableconnections of sensors, control and power supply wiring to the dataloggeritself. Some dataloggers such as the CR23X-TD have built-in wiring panels.Others, such as the CR10X-TD, have removable wiring panels.
Watchdog - An entry in the status table that shows the number of watchdogerrors that have occurred. The watchdog checks the processor state and resets itif necessary. If an error occurs, the watchdog error counter is incremented.

B-1
Appendix B. Table-Based DataloggersThis section describes some of the characteristics and features of the CR10X-TD familyand CRx000 family of table-based dataloggers. The dataloggers included in these familiesare CR510-TD, CR10T, CR10X-TD, CR23X-TD, CR5000 and CR9000.
B.1 Memory Allocation for Final StorageThe datalogger memory includes four important areas: the datalogger programstorage, input storage, intermediate storage, and final storage. When a programis downloaded to the datalogger and compiled, datalogger memory is allocatedfor each of these areas.
The CR10X family of array-based and table-based dataloggers are identical inhardware and differ only in the operating system. The primary distinctionbetween array-based and table-based dataloggers is how final storage isallocated and filled. CRx000 family of dataloggers are based on CRbasicprograms and have a different memory allocation structure.
B.1.1 CR10X-TD Family Table-Based DataloggersCR510-TD, CR10T, CR10X-TD, and CR23X-TD table-based dataloggersstore data from different intervals in different final storage tables. Final storagetables are made up of records and fields. Each row in a table represents a recordand each column represents a field. The number of fields in a record isdetermined by the output processing instructions in the datalogger program thatfollow the Data Table output instruction (P84 Output Table; refer to yourdatalogger user’s manual for more information). The total number of fields foreach table will be the number of output processing instructions multiplied bythe number of values stored by each of the output instructions.
The number of records to be kept in a table before the oldest data is overwrittencan be fixed by the user, or left for the datalogger to determine automatically.With automatic allocation the datalogger tries to set the sizes of automaticallyallocated tables such that all of the tables will fill up at about the same time.Once the sizes of the tables are determined, the datalogger allocates availablefinal storage to these tables.
Note that the tables are allocated by size with the smallest tables first. Fordataloggers with extended flash memory, any tables that will not fit in SRAMmemory are allocated to flash memory. Flash memory is allocated in 64 Kblocks; therefore, even a very small table will take 64 K of flash memory. If thetable sizes specified by the user exceed the amount of memory available for thatpurpose in the datalogger, an error will occur when the program is compiled bythe datalogger.

Appendix B. Table-Based Dataloggers
B-2
Event driven tables should have a fixed size rather than allowingthem to be allocated automatically. Event driven tables inCR10X-TD type dataloggers that are automatically allocated areassumed to have one record stored per second in calculating thelength. Since the datalogger tries to make the tables fill up at thesame time, these event driven tables will take up most of thememory leaving very little for the other, longer interval,automatically allocated data tables.
B.1.2 CR5000/CR9000 Memory for Programs and Data StorageThe datalogger memory for the CR5000 and CR9000 is divided betweenRandom Access Memory (RAM) and Electrically Erasable Programmable ReadOnly Memory (EEPROM). The EEPROM, or flash memory, is used to storethe operating system and the user programs that have been saved in thedatalogger. When the datalogger powers up, the program marked as “Run onPower-up” is transferred to RAM and executes from there. Additional storageis available using PCMCIA cards.
When a datalogger program is sent to the datalogger, it is divided into two tasksthat run simultaneously. All of the program instructions that deal withmeasuring sensors, controlling outputs, or are time sensitive, are placed in themeasurement task. The instructions that deal with data processing, includingcalculations, data storage, averaging, minimum and maximum tracking, anddata I/O operations, are placed in the processing task.
The measurement task is executed at the precise specified scan rate and storesthe raw data into a memory buffer. As soon as the measurement task hascompleted filling the buffer for the current scan, the processing task starts thedata processing on the buffered data. There are at least two memory buffers,allowing the measurement task to fill one buffer while the processing task isworking with the data in the other.
The data processing task stores data as records in final storage data tables.LoggerNet can collect the records from these data tables either manually orwith scheduled data collection. The datalogger program can also make some orall of the variables used for measurement storage or calculations available toLoggerNet. These variables are found in the Public table, which is similar tothe Input Location table in CR10X or CR10X-TD type dataloggers.
Final storage tables are made up of records and fields. Each row in a tablerepresents a record and each column represents a field. The number of fields ina record is determined by the number and configuration of output processinginstructions that are included as part of the Data Table definition.
The number of records to be kept in a table before the oldest data is overwrittencan be limited by the user, or left for the datalogger to determine automatically.The datalogger tries to set the sizes of automatically allocated tables such thatall of the tables will fill up at about the same time. Once the sizes of the tablesare determined, the datalogger allocates the available memory to these tables.
If the amount of memory requested for the data tables exceeds the availablememory, the program will not run.
NOTE

Appendix B. Table-Based Dataloggers
B-3
Event driven tables should have a fixed size rather than allowingthem to be allocated automatically. Event driven tables inCR5000/CR9000 dataloggers that are automatically allocated areassumed to have one record stored per execution interval incalculating the length. Since the datalogger tries to make thetables fill up at the same time, these event driven tables will takeup most of the memory leaving very little for other, longerinterval, automatically allocated data tables.
B.2 Converting an Array-Based Program to aCR10X-TD Table-Based Program using Edlog
The following information is provided for those users familiar with writingprograms for array-based dataloggers or users who have existing array-baseddatalogger programs that need to be changed to table-based programs.
B.2.1 Steps for Program ConversionIf you are converting a program for the same series of datalogger (e.g., aCR10X program to a CR10X-TD program) you can edit the existing programin Edlog. If you are converting a program from one datalogger series to another(e.g., CR10X to CR23X-TD), you may need to start the program from scratch.
To convert a program for the same series of datalogger:
1. Open the CSI file in Edlog.
2. The first line of the file will read
;CR10X
Change this line to
;CR10X-TD
3. Review all of the instructions provided in the section below. If any ofthese are included in your program, format them as a comment or deletethem from the program.
4. Save the file to a new file name, but do not compile the file whenprompted.
5. Open the newly created file in Edlog. It will be opened using the CR10X-TD datalogger template instead of the CR10X. Make any changesnecessary to replace the commented or deleted instructions.
6. Save and compile the program, correcting any errors that may be found bythe compiler.
NOTE

Appendix B. Table-Based Dataloggers
B-4
B.2.2 Program Instruction ChangesSeveral programming instructions have changed or are not used in table-baseddatalogger programs. Make sure you “comment out” any of these instructionsbefore you try to convert the array-based program. These are listed below:
• Check any instructions that may set the Output Flag (Flag 0) high or low byusing the Command Code Options. The output flag is not used in table-based programming. Instructions that may include reference to the outputflag are: P83, If Case; P86, Do; P88, If (X< = > Y); P89, If (X< = > F);P91, If Port/Flag; and P92, If Time.
If any of these instructions set the output flag high, the instruction can bereplaced with Instruction 84, Table Data. Instruction 84 is used to define atable of final storage data. New records of data are stored in the table-based on time (interval data) or when a user flag is set (event data). Timebased output intervals are specified in seconds.
• Instruction 18, Time - Instruction 18 is used to store the current time intoan input location. Parameter 1 designates what format will be used whenstoring the time. There are differences in this instruction's Parameter 1 forthe two datalogger types.
• Instructions 73 and 74, Maximum and Minimum - These instructionsare used to store the maximum or minimum for a value over a period oftime. Parameter 2 in these instructions is used to designate a time option.There are differences in the instructions' Parameter 2 for the twodatalogger types.
• Instruction 77, Real Time - Instruction 77 is used to store the current timein final storage for array-based dataloggers. This instruction is not includedin table-based dataloggers, since the time is assigned to recordsautomatically when data is retrieved (see Section 5.3 for information onhow data is time stamped).
• Instruction 80, Set Active Storage Area - Instruction 80 is used to directoutput processing to final storage area 1, final storage area 2, or an inputlocation. This instruction is not included in the table-based programminginstructions. Output processing can be redirected to input locations in atable-based datalogger using Instruction P84, Table Data (see Edlog’shelp).
• Instruction 92, If Time - Instruction 92 is used to perform one or moreactions based on time. The interval for table-based dataloggers is inseconds only; array-based dataloggers offer the options of seconds orminutes. The instruction for array-based dataloggers defaults to minutes, soif you are using this instruction it may need to be changed.
Also, check any Instruction 92s for Command Codes that may affect theoutput flag (see discussion above on output flag instructions).
• Instruction 96, Serial Output - Instruction 96 is used to send data in theactive Final Storage area to a storage module, computer, printer, or

Appendix B. Table-Based Dataloggers
B-5
alternate final storage area. This instruction is not included in the table-based programming instructions.
• Instruction 97, Initiate Telecommunication (“Call-back”) - Instruction97 is used to program the datalogger to call a remote computer, voicemodem, or other datalogger when a user flag is set low. This instruction isnot included in the CR10T datalogger. Newer operating systems for theother dataloggers do support instruction 97.
• Instruction 98, Send Printer Character - Instruction 98 is used to sendcharacters to either an addressed or pin-enabled printer. This instruction isnot included in the table-based programming instructions.
• Conditional Data Output – check to make sure that the output data is notbeing output conditionally. Table-based dataloggers require that the sizeof the output record is constant. Any instructions that dynamically changethe number of data values in a record or the size of the record need to beremoved. (e.g., don’t change data resolution from low to high based on aconditional. )
B.3 Table Data OverviewIn the datalogger all data is organized into tables with fixed data records. Eachof these tables has a definite number of records that is either fixed by thedatalogger program or allocated when the program is compiled by thedatalogger. Once the maximum number of records for a table have been stored,the next record stored will overwrite the oldest record in the table.
Tables that are automatically allocated in the datalogger program are allocateda number of records based on the time interval for the records. The dataloggerattempts to allocate these tables so that all of the automatically allocated tablesfill up at the same time. For example a tables with records stored every 30minutes and 60 minutes would have twice as many records allocated for the 30-minute table.
Event driven tables should have a fixed size rather than allowingthem to be allocated automatically. Event driven tables in theCR10X-TD type dataloggers that are automatically allocated areassumed to have one record stored per second in calculating thelength.
In CR5000/CR9000 dataloggers event tables are assumed to haveone record stored per execution interval.
Since the datalogger tries to make the tables fill up at the sametime, these event driven tables will take up most of the memoryleaving very little for the other, longer interval, automaticallyallocated data tables.
Within a data table, data is organized in records and fields. Each row in a tablerepresents a record and each column represents a field. To understand theconcept of records it may be helpful to consider an example.
NOTE

Appendix B. Table-Based Dataloggers
B-6
Example:A CR10X-TD is to be used to monitor three thermocouples (TC). Each hour atemperature for each of the three thermocouples is to be stored. The table hasfive fields: DATE_TIME, RECORD #, TEMP1, TEMP2, TEMP3.
The program is written so that each hour an Instruction 84, Table Data,generates a new "record" in the data table. This hourly table would then beorganized as follows:
DATE_TIME RECORD # TEMP1 TEMP2 TEMP32002-01-27 10:00:00 14 23.5 24.6 28.22002-01-27 11:00:00 15 24.2 22.4 23.4
Only the hourly data triggered by the Instruction 84 above would be written tothis table. If other table data instructions existed, the output for these tableswould be written to their own tables.
Data tables can also be event driven rather than interval driven. That is, a newrecord is stored when a specified event occurs rather than based on time.
Each table is completely independent of any other tables and all records in agiven table have the same number of fields.
B.4 Default TablesEach table-based datalogger has a set of default tables plus the tables created bythe datalogger program. The four default tables in the CR10X-TD family ofdataloggers, are Timeset, Errorlog, Inlocs, and Status. The default tables inCR5000/9000 dataloggers are Status and Public.
• Timeset Table - The Timeset table contains a history of clock sets for thedatalogger. It includes three fields: TimeStamp, RecordNumber, andOldTime. TimeStamp is the time and date the clock was set. RecordNumberis incremented each time the clock is set. When the datalogger is reset or anew program is loaded, RecordNumber is reset to 1. OldTime is thedatalogger's clock value before the time was set (CR10X-TD familydataloggers only).
• Errorlog Table - The Errorlog table contains any errors that occur in thedatalogger. It includes three fields: TimeStamp, RecordNumber, andErrorCode. TimeStamp is the time and date the error occurred.RecordNumber is incremented each time an error occurs. When thedatalogger is reset or a new program is loaded, RecordNumber is reset to 1.ErrorCode is the code returned by the datalogger when an error occurs.Refer to the datalogger user's manual for a list of all error codes (CR10X-TD family dataloggers only).
• Inlocs Table (CR10X-TD family dataloggers) or Public Table (CR-x000dataloggers) - When a datalogger measures a sensor, the sensor reading isstored in a temporary register called an input location or variable. Witheach new measurement, the old value is overwritten by the new value. TheInlocs or Public table contains a time stamp, record number, flag status,

Appendix B. Table-Based Dataloggers
B-7
port status, and the reading from each sensor scanned or user created inputlocations.
• Status Table - The Status table contains information on the datalogger.Data is written to the table with each datalogger program execution. Notethat the actual fields contained in the table are datalogger-specific. TableB-1 below describes each of the fields in the table for a CR10T. CR10X-TD, CR510TD and CR23X-TD status tables are similar. See thedatalogger operator’s manual for specifics. Table B-2 describes the fieldsfor the CR5000 datalogger. CR9000 is similar.
Table B-1. Example of Status Table Entries (CR10T)TMStamp Date and time the status information was recorded.
RecNBR The record number in the table.
Battery Datalogger battery voltage.
Watchdog The watchdog checks the processor state, software timers, and programrelated counters. If an error occurs, the watchdog counter is incremented.
Overruns A table overrun occurs when the datalogger has insufficient time betweenexecution intervals to complete one pass through the program. This counteris incremented with each table overrun.
InLocs Number of input locations allocated for the program.
PrgmFree Amount of remaining program memory, in bytes.
Storage Number of final storage locations available.
Tables Number of user-created data tables.
DaysFull Estimated number of days of data the tables using automatic recordallocation can hold. (NOTE: this number is only based on tables stored atintervals. Automatically allocating an event based table will often result invery small interval tables.)
Holes Number of missed records in all data storage tables.
PrgmSig Signature of the datalogger program. The signature is a unique numberderived from the size and format of the datalogger program. If thissignature changes, the program has been altered.
PromSig Signature of the datalogger PROM. As with the PrgmSig, if this signaturechanges, the datalogger instruction set has somehow been changed.
PromID Version number of the datalogger PROM.
ObjSrlNo Revision number of the datalogger PROM.

Appendix B. Table-Based Dataloggers
B-8
Table B-2. CR5000 Status Table EntriesROMVersion Version of the ROM code. This value is stored in the ROM and read by
the OS at compile time.
OSVersion Current version of the operating system.
OSItem The CSI item number for the operating system.
OSDate Date that the Operating System was compiled.
StationName String stored as the Station Name of the CR5000.
ProgName The Name of the currently running program.
StartTime Time that the program began running.
Battery Current value of the battery voltage. This measurement is made in thebackground calibration.
PanelTemp Current Panel temperature measurement.
LithiumBattery A Boolean variable signaling ”True” (-1) if the lithium battery is OK and”False” (0) if not. The lithium battery is loaded and a comparator checkedevery 4 seconds to verify that the battery is charged.
CPUSignature The Operating System signature. The value should match the valueobtained by running the CSI sig program on the name.obj operating systemfile.
DLDSignature Signature of the current running program file.
ProgSignature Signature of the compiled binary data structure for the current program.This value is independent of comments added or non functional changes tothe program file.
PC-CardBytesFree Gives the number of bytes free on the PC-Card.
MemoryFree Amount (in bytes) of unallocated memory on the CPU (SRAM). The usermay not be able to allocate all of free memory for data tables as finalstorage must be contiguous. As memory is allocated and freed there may beholes that are unusable for final storage, but that will show up as free bytes.
DLDBytesFree Amount of free space in the CPU RAM disk that is used to store programfiles.
ProcessTime Time in microseconds that it took to run through processing on the lastscan. Time is measured from the end of the EndScan instruction (after themeasurement event is set) to the beginning of the EndScan (before the waitfor the measurement event begins) for the subsequent scan.
MaxProcTime The maximum time required to run through processing for the current scan.This value is reset when the scan exits.
MeasureTime The time required by the hardware to make the measurements in this scan.The sum of all integration times and settling times. Processing will occurconcurrent with this time so the sum of measure time and process time isnot the time required in the scan instruction.
SkippedScan Number of skipped scans that have occurred while running the current

Appendix B. Table-Based Dataloggers
B-9
Table B-2. CR5000 Status Table Entriesprogram.
SlowProcTime Time required to process the current slow scan. If the user has slow scansthen this variable becomes an array with a value for the system slow scanand each of the user’s scans.
MaxSlowProcTime The maximum Time required to process the current slow scan. If the userhas slow scans then this variable becomes an array with a value for thesystem slow scan and each of the user’s scans.
LastSlowScan The last time that this slow scan executed. If the user has slow scans thenthis variable becomes an array with a value for the system slow scan andeach of the user’s scans.
SkippedSlowScan The number of scans that have been skipped in this slow sequence. If theuser has slow scans then this variable becomes an array with a value for thesystem slow scan and each of the user’s scans.
MeasureOps This is the number of task sequencer opcodes required to do allmeasurements in the system. This value includes the Calibration opcodes(compile time) and the system slow sequence opcodes.
WatchdogErrors The number of Watchdog errors that have occurred while running thisprogram. This value can be reset from the keyboard by going to status andscrolling down to the variable and pressing the DEL key. It is also resetupon compiling a new program.
Low12VCount Keeps a running count of the number of occurrences of the 12VLow signalbeing asserted. When this condition is detected the logger ceases makingmeasurements and goes into a low power mode until the system voltage isup to a safe level.
StartUpCode A code variable that allows the user to know how the system woke up frompoweroff.
CommActive A variable signaling whether or not communications is currently active(increments each time the autobaud detect code is executed).
ProgErrors The number of compile (or runtime) errors for the current program.
ErrorCalib A counter that is incremented each time a bad calibration value ismeasured. The value is discarded (not included in the filter update) and thisvariable is incremented.
VarOutOfBound Flags whether a variable array was accessed out of bounds.
SkippedRecord Variable that tells how many records have been skipped for a given table.Each table has its own entry in this array.
SecsPerRecord Output interval for a given table. Each table has its own entry in this array.
SrlNbr Machine specific serial number. Stored in FLASH memory.
Rev Hardware revision number. Stored in FLASH memory.
CalVolts Factory calibration numbers. This array contains twenty valuescorresponding to the 20 integration / range combinations. These numbersare loaded by the Factory Calibration and are stored in FLASH.
CalGain Calibration table Gain values. Each integration / range combination has a

Appendix B. Table-Based Dataloggers
B-10
Table B-2. CR5000 Status Table Entriesgain associated with it. These numbers are updated by the background slowsequence if the running program uses the integration / range.
CalSeOffset Calibration table single ended offset values. Each integration / rangecombination has a single ended offset associated with it. These numbersare updated by the background slow sequence if the running program usesthe integration / range.
CalDiffOffset Calibration table differential offset values. Each integration / rangecombination has a differential offset associated with it. These numbers areupdated by the background slow sequence if the running program uses theintegration / range.
CardStatus Contains a string with the most recent card status information.
CompileResults Contains any error messages that were generated by compilation or duringrun time.

C-1
Appendix C. Software Organization
C.1 LoggerNet/Client ArchitectureThe LoggerNet communication server provides the interface to all of thedataloggers and the support for the different communications mediums. It runsin the background and provides an attachment for the clients that provide theuser interface. The server handles all communications with the dataloggers.
The LoggerNet server handles connections from all the user interface screenssimultaneously, allowing many different views and ways to access the datacollected from the dataloggers. In addition to running on the same computerwith LoggerNet some applications such as RTMC can be run on othercomputers connected to the LoggerNet computer over a local area network(LAN).
LoggerNet can automatically collect data from the dataloggers on a schedule aswell as on request from the user. It can automatically check and update theclocks in the dataloggers and handle administration support functions.
C.2 LoggerNet Server Data CacheThe LoggerNet server data cache is a set of files kept on the hard disk of thecomputer where the server is running. These data files are in binary format andcan only be used or interpreted by the LoggerNet server. The data cache filesare stored in addition to the output data files.
C.2.1 OrganizationThe data cache is set up to emulate the way data is stored in the datalogger.When a new datalogger station is defined for the network and communication isestablished with the station, the server requests the table definitions from tabledata dataloggers. For array based dataloggers the array definitions arecontained in a final storage label file that is associated with a datalogger. Thistable or array information is used to set up equivalent tables and data arrays fordata storage in the data cache. The size of the areas set up in the data cache isdependent on the size of final storage in the datalogger.
Datalogger tables that hold only one record, such as the Input Locations tableand the Status table, would have only two records assigned in the data cache.
The storage in the data cache is designed to operate with “ring memory” justlike the datalogger. This means that records will be stored in the data cachearea for that table until it has reached the maximum number of records, the nextdata record will replace the oldest record in the storage table, and so on.
C.2.2 OperationNormal data collection from the datalogger is done with polling based on thescheduled collection interval set up by the user. This is the most efficient

Appendix C. Software Organization
C-2
means of data collection for networks with rapid direct communications links.When it is time for a scheduled data collection the server sends a data pollrequest to the datalogger to get all of the data stored in the selected tables sincethe last poll. The tables to be collected are specified by the user in the Setupscreen.
As each record is written to the data cache, the server adds a filemark numberto the record as it is stored. This filemark number is used to identifydiscontinuities in the data. The filemark number starts out as zero when thetable for the data cache is created or re-initialized. This number is incrementedeach time a discontinuity is seen in the data records. Such a discontinuity canoccur when there is a gap in the record numbers because the data table filledand overwrote the requested data. This also can occur if the record number rollsover from the maximum to start back at zero or an identical program is loadedinto the datalogger without going through the server.
Data can also be collected from the datalogger using a manual poll operation.This is achieved by selecting Collect Now from the Connect Screen. When amanual poll is done the data from the datalogger is saved in the output data fileand is also put into the data cache.
C.2.3 Retrieving Data from the CacheOnce the data has been stored in the data cache it is retrieved by theapplications such as the graphical and numerical displays that request the databy datalogger, table or array, and data field. The data can be requested by aquery where the request specifies the starting and ending timestamp or recordnumber along with the data to retrieve. A server data advise can also be set upthat will automatically send the selected data out to the client applications as itis collected from the dataloggers to the data cache. This improves efficiencysince the client doesn’t have to keep checking to see if new data has beencollected.
C.2.4 Updating Table DefinitionsWhen the table definitions are obtained from the datalogger they are kept in theserver and used to identify the data available in the data cache. Every time newdata is collected from a datalogger, a table definition signature is sent thatshould match the signature stored in the server. If this table definition signaturedoesn’t match it indicates that the table definitions in the datalogger havechanged.
There are a number of things that could cause datalogger table definitions tochange. A new program may have been downloaded to the datalogger, or thekeyboard display may have been used to manually make changes to thedatalogger program.
If the datalogger program is re-compiled without changing tabledefinitions, the record numbers will reset to zero causing theserver to assume the datalogger record numbers have wrapped
NOTE

Appendix C. Software Organization
C-3
around. This will result in the re-collection of all of the data in the datalogger.
When a change in table definitions is detected, the server stops data collectionand indicates in the Collection State of Status Monitor that the table definitionshave been changed. Data collection cannot be restarted until either a newdatalogger program is loaded into the datalogger by the server, or updated tabledefinitions are received from the datalogger. Either of these actions causes thedata in the data cache for that datalogger to be removed and new data cachetables set up based on the new table definitions for that datalogger. LoggerNetwill save the existing output data file with a modified name and create a newoutput data file.
C.3 Directory Organization
The default installation of the LoggerNet software installs two directories: theC:\CampbellSci\LoggerNet working directory and C:\ProgramFiles\CampbellSci\LoggerNet program directory.
C.3.1 C:\CampbellSci\LoggerNet Directory (Working Directory)The C:\CampbellSci\LoggerNet working directory includes four subdirectories:Data, Logs, RTMC and SYS. The c:\CampbellSci\LoggerNet directory is usedfor storing user-created files, data files, and status information files fromLoggerNet.
By default all user created datalogger programs and the data files collected withscheduled data collection are stored in the c:\CampbellSci\LoggerNet directory.
The files collected using the Custom Collect on the Connect Screen are storedby default in the C:\CampbellSci\LoggerNet\Data subdirectory to avoidconfusion with the main data collection files.
The Logs directory contains the LoggerNet operational logs if they are beingsaved to disk. The RTMC directory contains the images, sounds and workingfiles for RTMC.

Appendix C. Software Organization
C-4
The Inifiles subdirectory under C:\CampbellSci\LoggerNet\SYS contains allconfiguration files for the Setup Screen, Connect Screen, Status Monitor andother applications.
The C:\CampbellSci\LoggerNet\SYS\bin subdirectory contains configurationfiles for the devices in your datalogger network (*_CONF), and the modemconfiguration file (modem.ini). This subdirectory has a C:\CampbellSci\LoggerNet\SYS\bin\Data subdirectory that is used to store the Data Cache forthe devices in the network.
Changing or removing any of the files in theC:\CampbellSci\LoggerNet\SYS\bin directory can cause loss ofdata, a system crash or destruction of the network map. Thereare no user editable files in this directory.
System administrators concerned about security and system integrity should useWindows NT and its directory access tools to control access to the workingdirectories.
C.3.2 C:\Program Files\CampbellSci\LoggerNet Directory(Program File Directory)
All files necessary for running the LoggerNet programs are stored in theC:\Program Files\CampbellSci\LoggerNet subdirectory.
No other files are saved to these program file subdirectories in order to protectthe integrity of the LoggerNet communication server and the clients.
C.3.3 Backing Up Critical InformationSince after installation, no files are stored in the programs directory(C:\Program Files\Campbellsci\LoggerNet) all you need to back up is theworking directory, c:\Campbellsci\LoggerNet. We recommend that you backup this entire directory, with all of its files and subdirectories, on a regularbasis.
NOTE

D-1
Appendix D. Log Files
D.1 Event LoggingAs LoggerNet performs its work, it will create records of various kinds ofevents. The log files are very useful for troubleshooting problems andmonitoring the operation of the datalogger network. See Section 7.2.10 forinformation on saving the logs to disk.
D.1.1 Log CategoriesThe LoggerNet server logs events in four different kinds of logs as follows:
Transaction Status (TranX.log) — This log file documents the state of thevarious transactions that occur between the LoggerNet server and devices in thedatalogger network. This is the most readable of the logs and contains eventmessages that are meaningful to most users. Examples of these events are:
• Datalogger clock check/set
• Datalogger program downloads
• Data collection
The format and type of records in this log are strictly defined to make itpossible for a software program to parse the log records.
Communications Status (CommsX.log) — This log file documents the qualityof communications in the datalogger network.
Object State (StateX.log) — This log file documents the state of an object.This is primarily for troubleshooting by software developers and the messagesare relatively free in form.
Low Level I/O (IOXSerial Port_1.log) — A low level log file is associatedwith each root device in the datalogger network to record incoming andoutgoing communications. While the entire network can be monitored from asingle messaging session of the transaction, communications status, or objectstate logs, monitoring of the low-level log is performed on a session with theroot device for that log.
D.1.2 Enabling Log FilesUse Status Monitor (Edit |Log Settings) to enable logging of events to files. Ifenabled, the server will write log records to text files in the log file directoryusing the following file names (depending on the log type):
• Transaction Log - TranX.log
• Communications Log - CommsX.log

Appendix D. Log Files
D-2
• Object State Log - StateX.log
• Low Level Log - IOXSerial Port_1.log
where “X” is “$” for the currently active file and 0, 1, 2, etc. for archived files.
The server stores the most recent log records in a file that has a $ character inthe place of the version number. When this file grows to the point that it willexceed the threshold set by the File Size setting for that log, the server willrename the log file by replacing the dollar sign with a new version number. Atthe same time that the server rolls over to a new log file, the File Countparameter for that log will also be evaluated. If there are more saved files forthat log than are allowed by the File Count parameter, the server will delete theoldest of these files until the count is less than or equal to the File Count.
D.1.3 Log File Message Formats
D.1.3.1 General File Format Information
The communications status, transaction, and object state logs all share the samebasic file format. Each record in a log file ends with a carriage return and linefeed. A single record will consist of two or more fields where each field issurrounded by quotation marks and separated by commas.
The two fields that will be present in all records are:
Timestamp - The server time when the record was generated. It will have thefollowing format:
YYYY-MM-DD HH:MM:SS.mmm
where "YYYY" is the 4-digit year, "MM" is the month number, "DD" is theday of the month, "HH" is the hour in the day (24 hour format), "MM" is theminutes into the hour, "SS" is the seconds into the minute, and "mmm" is themilliseconds into the second.
Device Name - The name of the device associated with the message. If themessage is associated with the LoggerNet server, this will be an empty string.
D.1.3.2 Communications Status Log Format
Each record in the communications status log includes two fields in addition tothe timestamp and device name:
Severity - A single character code that indicates the type of message. Thefollowing values are legal:
• "S" (Status) Indicates that the identified operation has successfullycompleted.
• "W" (Warning) Indicates that the server has attempted to retry theoperation with the identified device.

Appendix D. Log Files
D-3
• "F" (Fault) Indicates that the identified operation has failed and that theserver has stopped retrying.
Description - text providing more details about the event.
Communications Status Log Example
3/6/2002 12:06:00 PM | "IPPort_2","S","opening","192.168.8.129,3001"3/6/2002 12:06:00 PM | "IPPort_2","S","Provider opened"3/6/2002 12:06:00 PM | "IPPort_2","S","Open succeeded"3/6/2002 12:06:00 PM | "IPPort_2","S","Device dialed"3/6/2002 12:06:00 PM | "ComPort_2","S","opening comm port","com2","38400"3/6/2002 12:06:00 PM | "ComPort_2","S","Provider opened","38400"3/6/2002 12:06:00 PM | "ComPort_2","S","Open succeeded"3/6/2002 12:06:00 PM | "ComPort_2","S","Device dialed"3/6/2002 12:06:05 PM | "CR23X_2","S","Classic::CmdA"3/6/2002 12:06:05 PM | "CR23X_2","S","Classic::CmdClockSet"3/6/2002 12:06:07 PM | "CR510TD","W","Unable to locate serial synch byte"3/6/2002 12:06:07 PM | "CR510TD","S","Serial packet 2 exchanged"3/6/2002 12:06:08 PM | "CR510TD","S","Serial packet 3 exchanged"3/6/2002 12:06:08 PM | "CR510TD","S","Serial packet 0 exchanged"3/6/2002 12:06:08 PM | "CR510TD","S","BMP1 packet received"
Message Text Message Meaning User Response to MessageSerial packet X exchanged The low level serial
BMP1 communicationframing packet was sentand the responsereceived from the device.(CR10X-TD table basedtype devices)
Classic;;Cmd The listed command wassent to an array baseddatalogger.
For a list of the commands and theirmeanings see the dataloggeroperator’s manual.
BMP1 packet received A BMP1 packet wasreceived from the device.(CR10X-TD typedevices only)
RPC packet exchanged A BMP3 packet wasexchanged. (CR5000,CR9000 dataloggersonly)
Datalogger did not respond toend command
The computer tried toterminate the connectionbut the datalogger didnot acknowledge theshutdown.
This is an indication that there is acommunications problem betweenthe computer and the datalogger.Check the cables and connectorsand make sure the datalogger haspower.

Appendix D. Log Files
D-4
Message Text Message Meaning User Response to MessageInvalid low level signature The packet received
from the device gotcorrupted and the packetsignature doesn’t matchthe packet contents.
Check to find out where in thecommunications link noise or signalcorruption is causing the data to bedisrupted.
Provider opened The serialcommunications port hasbeen initialized.
Device dialed The communications linkhas been initialized totransfer data packets.
Provider closed The serialcommunications port hasbeen closed.
Unable to Locate Serial synchbyte
The low levelcommunicationssynchronization byte wasnot received after thecomputer sent out aserial packet.
This indicates that the device iseither not responding or respondingwith an invalid communicationsprotocol. This message wouldappear if trying to talk to an arraybased datalogger that is set up as atable based datalogger in thenetwork map.
D.1.3.3 Transaction Log Format
Each record in the transaction log includes at least two fields in addition to thetimestamp and device name:
Message Type Code - Identifies the type of event that has occurred. This is anumber that corresponds to the description immediately following. If this log isbeing read by a software program, a number is very easy to use for comparisonwhen looking for specific message types.
Message Type Description - Text that describes the message type code.
The following table is a list of the different messages that can appear in thetransaction log, some of the optional parameters and what the message means.Where appropriate, a suggested response to the message is provided.
Code Message Text Message Parameters Message Meaning User Response toMessage
1 Network deviceadded
Device Name A new device wasadded to the networkmap.
2 Network branchdeleted
Device Name A branch of thenetwork map wasdeleted (this mayconsist of a singledevice)

Appendix D. Log Files
D-5
Code Message Text Message Parameters Message Meaning User Response toMessage
3 Network branchmoved
Device Name A branch of thenetwork map wasmoved from oneparent device toanother (notsupported inLoggerNet 1.1)
5 Network logonsucceeded
Logon Name A client applicationsuccessfully attachedto the server
6 Network logonfailed
Logon Name A client applicationfailed to attach to theserver
If unsuccessful logonmessages occurfrequently, use anetwork monitor todetermine who is tryingto connect. If securityis enabled this messagewill appear for someonetrying to connect withthe wrong user name orpassword.
7 Security sessionopened
The securityconfiguration utilityhas attached to theserver.
8 Securitydatabase readfailed
When the serverstarted up it could notread the securitysettings file.
This is a normalmessage on serverstartup if security hasnot been set up. Ifsecurity should be setthe file needs to beremoved and securityre-configured.
9 Modem defaultdatabase readfailed
When the serverstarted up it could notread the defaultmodem filewmodem.ini.
This file should exist inthe working directoryon the server computer(c:\campbellsci\loggernet\sys\bin). Mayindicate a permissionsor configurationproblem on thecomputer.
10 Modem customdatabase readfailed
When the serverstarted up it could notread the usercustomized modemsettings filewmodem.cust.
If the user has not setup custom modemconfigurations, this filewill not exist.

Appendix D. Log Files
D-6
Code Message Text Message Parameters Message Meaning User Response toMessage
11 Clock checkstarted
A clock check hasbeen initiated. Thisclock check is notsent out to the stationuntil the transaction issent.
12 Clock set Device time before set;Server time;
The device clock hasbeen set.
13 Clock checked Datalogger time The datalogger clockhas been checked.
14 Clock checkfailed
Reason code:3. Communication failure4. Invalid dataloggersecurity clearance5. Invalid transactionnumber specified (alreadyin use)6. Communications aredisabled for this device7. The transaction wasaborted by client request8. The device is busy withanother transaction
The clock check/setfailed for the reasonspecified in thereason code.
Check the connectionsof the communicationpath to the datalogger,make sure thedatalogger is connectedand has power, checkthe security setting inthe datalogger and inSetup, check thatcommunications areenabled in Setup for allthe devices in the path.
15 Starting BMPdata advisetransaction
A start data adviseoperation has beeninitiated. Data adviseis not in place untilthe dataloggerresponds.
16 Stopping BMPdata advisetransaction
A stop data adviseoperation has beeninitiated.
17 BMP dataadvisetransactionstarted
The message from thedataloggerconfirming the startof data advise hasbeen received.
18 BMP dataadvisetransactionstopped
The message from thedataloggerconfirming thesuspension of dataadvise has beenreceived.
19 BMP dataadvisetransactionfailed
The attempt to startor stop a data advisewith the dataloggerhas failed or theoperation has timedout waiting for aresponse.
Check communicationswith the datalogger bytrying to check theclock. If that failsfollow the steps formessage 14.
20 Hole detected Table name; Beginning A hole or missed The server will

Appendix D. Log Files
D-7
Code Message Text Message Parameters Message Meaning User Response toMessage
record number; Endingrecord number
records has beendetected in the datacoming from thedatalogger.
automatically try tocollect the data if holecollection is enabled.
21 Hole collected Table name; Beginningrecord number; Endingrecord number
The missing recordsspecified have beencollected from thedatalogger.
22 Hole lost Table name; Beginningrecord number; Endingrecord number
The missing recordshave beenoverwritten in thedatalogger.
23 Hole collectstart
Table name; Beginningrecord number; Endingrecord number
The hole collectrequest has beenstarted. This messagewon’t go to thedatalogger until theBMP1 message issent. (see message104)
24 Hole collectresponsereceived
The datalogger hasreturned the responseto the hole collectrequest. This willcontain either thedata or state that thehole is lost.
25 Hole collectfailed
The hole collectionrequest either timedout or acommunicationfailure occurred.
Check communicationswith the datalogger bytrying to check theclock. If that failsfollow the steps formessage 14.
26 Data pollingstarted
Data collection bypolling started.
27 Data pollingcomplete
Data collection bypolling completed
28 Data pollingfailed
Data collection bypolling failed due tocommunicationfailure or a timeout.
Check communicationswith the datalogger bytrying to check theclock. If that fails,follow the steps formessage 14.
29 Directed dataquery start
A user initiated queryhas been started.

Appendix D. Log Files
D-8
Code Message Text Message Parameters Message Meaning User Response toMessage
30 Directed dataquery continue
The requested data inthe directed querycould not fit in oneblock and the nextpart is beingrequested.
31 Directed dataquery complete
The user requesteddata has beenreceived by theserver.
32 Directed dataquery failed
The directed queryrequest failed.
33 Getting loggertable definitions
The server is gettingthe table definitionsfrom the datalogger.
Getting the dataloggertable definitions willerase any data in thedata cache.
34 Received loggertable definitions
The server hasreceived thedatalogger tabledefinitions.
35 Failed to getlogger tabledefinitions
The request to gettable definitions hasfailed.
36 Logger tabledefinitions havechanged
The server hasdetected a change inthe table definitionsin the datalogger.
A change in tabledefinitions indicatesthat the dataloggerprogram may havechanged. Beforeupdating tabledefinitions make surethe needed data in thedata cache has beensaved to a file ifdesired.
37 UpdatingBMP1 networkdescription
The networkdescription in the RFbase is being updatedto reflect changes incollection schedule orstations to collect.
38 BMP1 networkdescriptionupdate complete
The RF base hasacknowledged thenetwork descriptionupdate.
39 BMP1 networkdescriptionupdate failed
The networkdescription update tothe RF base has eithertimed out orcommunication hasfailed.
Check the connectionsfrom the PC to the RFbase.
40 Datalogger Severity (S for Status, W This is a message that Datalogger warning and

Appendix D. Log Files
D-9
Code Message Text Message Parameters Message Meaning User Response toMessage
message for Warning, F for Fault);Message text.
has been generated bythe datalogger (or insome cases the RFbase on behalf of thedatalogger).
fault messages shouldbe investigated usingthe datalogger operatorsmanual or contacting anapplications engineer atCampbell Scientific.
41 Recordsreceived
Table name; Beginningrecord number; Endingrecord number
Datalogger recordshave been receivedand stored in the datacache.
42 A dataloggertransaction hastimed out
Time out period inmilliseconds
The server has waitedlonger than theallotted time for theexpected response toa transaction.
Determine the reasonfor the timeout. This isusually due to aproblem with thecommunications pathbetween the PC and thedatalogger.
43 Terminalemulationtransactionstarted
Terminal emulationmessage has beensent to the datalogger.
44 Terminalemulationtransactioncomplete
Terminal emulationresponse message hasbeen received fromthe datalogger.
45 Terminalemulationtransactionfailed
The expectedterminal emulationresponse from thedatalogger was notreceived.
46 Set variablestarted
The message to set aninput location, flag orport has been sent tothe datalogger.
47 Set variablecomplete
The datalogger hasacknowledged the setof an input location,flag or port.
48 Set variablefailed
The datalogger failedto acknowledge theset variable message.
49 Table resized The size of the tablestorage area in thedata cache has beenchanged.
If the table is madesmaller the oldest datawill be lost.

Appendix D. Log Files
D-10
Code Message Text Message Parameters Message Meaning User Response toMessage
50 Program filesend start
The server is sendinga program to thedatalogger. Theactual programsegments will appearas BMP1 messagetype 4.
51 Program filesend status
The datalogger hasreceived the programsegment.
52 Program filesend complete
The datalogger hascompiled theprogram.
53 Program filesend failed
The datalogger didnot acknowledge thereceipt of theprogram, the programdid not compile, orcommunicationsfailed with thedatalogger.
If the program did notcompile check the errormessages. Otherwise,check communicationswith the datalogger bytrying to check theclock. If that fails,follow the steps formessage 14.
54 Program filereceive start
The server isrequesting thedatalogger program.The actual programsegments will appearsas BMP1 messagetype 5.
55 Program filereceive status
A program segmenthas been received.
56 Program filereceivecomplete
The dataloggerprogram has beenreceived from thedatalogger.
57 Program filereceive failed
The datalogger failedto send the programor communicationswith the dataloggerfailed.
Check communicationswith the datalogger bytrying to check theclock. If that fails,follow the steps formessage 14.
58 Collectionschedule:normal
This is an advisorymessage that thenormal datacollection schedule isactive.

Appendix D. Log Files
D-11
Code Message Text Message Parameters Message Meaning User Response toMessage
59 Collectionschedule:primary retry
A normal datacollection has failedand data collectionwill be attempted atthe primary retryinterval.
Determine the reasonfor communicationfailure. Temporarycommunicationproblems may cause thecollection state tochange between normaland primary.
60 Collectionschedule:secondary retry
The number ofprimary retriesspecified has passedand data collectionwill be attempted atthe secondary retryinterval.
61 Collectionschedulesuspended
The scheduled datacollection has beenturned off orsuspended becausecommunication isdisabled or tabledefinitions havechanged.
62 Primary retrycollectionattempt failed
Data collection on theprimary datacollection intervalfailed.
Check communicationswith the datalogger bytrying to check theclock. If that fails,follow the steps formessage 14.
63 Secondary retrycollectionattempt failed
Data collection on thesecondary datacollection intervalfailed.
Check communicationswith the datalogger bytrying to check theclock. If that fails,follow the steps formessage 14.
64 Device restorefrom filesucceeded
On server startup adevice previouslyentered in thenetwork map hasbeen restored.
65 Device restorefrom file failed
On server startup adevice in the networkmap could not berestored.
This is an indicationthat the configurationfile has been corrupted.Check the network mapand the computer filesystem.
66 Device save tofile succeeded
The update to thedevice configurationfile was successful.

Appendix D. Log Files
D-12
Code Message Text Message Parameters Message Meaning User Response toMessage
67 Device save tofile failed
The update to thedevice configurationfile failed.
This may be due to aproblem with directorypermissions or acorrupted directory.
68 Packet deliveryfailed
Fault code:1. Incompatible BMP1device or malformedpacket2. Routing failureunrecognized stationnumber3. Temporarily out ofresources4. Link failure
This is a messagefrom the RF baseindicating that aBMP1 messagedidn’t make it to thedata logger.
Codes 1 and 3 are rare.If ever seen contact anapplication engineer atCampbell Scientific.Code 2 indicates thatthe RF base has lost thenetwork map anddoesn’t know how toroute the message. Theserver automaticallyresends the networkmap.Code 4 is an indicationthat the RF base wasnot able tocommunicate with theRF modem attached tothe datalogger. Thesewill happenoccasionally as part ofnormal operations.Frequent occurrencesindicate that the radio,antenna, connectors andRF link be reviewed.
69 Unexpectedchange indatalogger tabledefinitions
As part of datacollection the serverhas detected a changein the datalogger’stable definitions.
A change in tabledefinitions indicatesthat the dataloggerprogram may havechanged. This willsuspend data collectionand warnings will beshown in the StatusMonitor. DataCollection can only berestored by updatingtable definitions. Beforeupdating tabledefinitions make surethe needed data in thedata cache has beensaved to a file ifdesired. See section7.4.3

Appendix D. Log Files
D-13
Code Message Text Message Parameters Message Meaning User Response toMessage
70 A device settingvalue haschanged
Setting Identifier; Client'slogon name; New value ofthe setting
A client has changedone of the deviceconfigurationsettings.
71 A LgrNetsetting valuehas changed
Setting Identifier; Client'slogon name;
A client has changedone of the serverconfigurationsettings.
72 Client definedmessage
Client defined message These messages areplaced in thetransaction log byclient applications.The message shouldindicate which cliententered the message.
73 Socket listenfailed
Indicates an error inthe computer systemthat prevents theserver from listeningfor client connectionson a socket.
This is a rare error andresults in a problemwith the computeroperating system. Ifrebooting the computerdoes not clear the error,contact an applicationengineer.
74 Device renamed The name of a devicein the network waschanged.
75 Logger locked This messageindicates the start of atransaction such asterminal emulationthat will tie up thedatalogger preventingother operations.
76 Loggerunlocked
The transactionblocking dataloggeraccess has completed.
77 Null programsent
The server has sent anull program to getan older datalogger(CR7X or 21X) outof keyboardemulation mode.
78 Server started The server version The server has beenstarted.

Appendix D. Log Files
D-14
Code Message Text Message Parameters Message Meaning User Response toMessage
79 Server shutdown
The server is beingshut down
If a new “server started”message is seen withoutthe shut down messagebefore it, this is anindication that theserver or the PCcrashed without exitingproperly.
80 Collect areainitialized
Collect area name A data cache collectarea has been created.
82 Collect arearemoved
A data cache collectarea has beenremoved
83 LgrNet restorefailed
On server startup thenetwork descriptionfile, csilgrnet.dnd,could not be read.
The network setup andconfiguration will haveto be restored from abackup or re-entered.Try to determine whatcorrupted or removedthe network descriptionfile.
84 Securitymanager restorefailed
On server startup thesecurity managerdatabase could not berestored.
There is a problem withthe computer oroperating system. Ifrebooting the machinedoes not get it workingget help from someonewho can troubleshootcomputer problems.
85 Data restorefailed
On server startup thedata broker datastorage area could notbe created.
This is a computerproblem. The files areeither not present or arecorrupted. See notes formessage 83.
86 Manual polltransactionstarted
Client logon name The listed client isstarting a manual polloperation accordingto the scheduledcollection settings. Amanual poll isinitiated from the“Collect Now” buttonon the Connectscreen.
87 Manual polltransactioncomplete
The manual polloperation hasreceived the datafrom the datalogger.

Appendix D. Log Files
D-15
Code Message Text Message Parameters Message Meaning User Response toMessage
88 Manual pollaborted
The manual polloperation wasstopped or failed tocomplete due tocommunicationsfailure or a timeout.
Check communicationswith the datalogger bytrying to check theclock. If that fails,follow the steps formessage 14.
89 Selectivemanual pollbegun
Collect area name A user specified pollhas been started forone of the dataloggercollect areas.
90 Selectivemanual pollcomplete
Collect area name The user specifiedmanual poll hascompleted.
91 Selectivemanual pollaborted
Collect area name The user specifiedmanual poll failed.
Check communicationswith the datalogger bytrying to check theclock. If that fails,follow the steps formessage 14.
92 Polling startedon collect area
Collect area name Data has beenrequested for thespecified collect area.This message isalways associatedwith another messageindicating whetherthis is scheduled,manual or selectivemanual polling.
Collect areas can betable for table modedataloggers, finalstorage areas, ports andflags, or input locations.
93 Collect areapoll data
Collect area name Data has beenreceived from anarray baseddatalogger for thespecified collect area.
94 Collect areapollingcomplete
Collect area name Data collection forthe specified collectarea has successfullycompleted.
95 Collect areapolling failed
Collect area name Data collection forthe specified collectarea failed.
Check communicationswith the datalogger bytrying to check theclock. If that fails,follow the steps formessage 14.
96 Scheduledpolling begun
Scheduled datacollection has started.
97 Scheduledpollingsucceeded
Scheduled datacollection hascompleted.

Appendix D. Log Files
D-16
Code Message Text Message Parameters Message Meaning User Response toMessage
98 Scheduledpolling failed
Scheduled datacollection failed.
Check communicationswith the datalogger bytrying to check theclock. If that fails,follow the steps formessage 14.
99 Collect areafirst poll
This message isposted either the firsttime data is collectedfor a collect area, orholes were lost forthe datalogger.
If this is not the firstpoll for the collect area,this message indicatesthat data that had beenstored in the dataloggerwas lost before it couldbe collected.
100 Table mountfailed
Table name; Operatingsystem informationregarding the failure
The server was notable to create a datacollection area fromthe stored tableconfiguration file ornew table definitions.This could be theresult of trying tocreate table files thatare too large for thecomputer system.
Check the computeroperating systemintegrity. Verify thatthe LoggerNet systemconfiguration files existand the directory hasnot been corrupted.
101 Add recordfailed
Table name; Beginningrecord number; End recordnumber; A reason for thefailure
The server was notable to write datarecords to the datastorage area.
This indicates aproblem writing to fileson the computer harddisk. Verify writepermissions are set andthat there is sufficientspace left on the disk.
102 Collect areaskippedwarning
Collect area name The specified collectarea was skippedbecause theassociated table hasnot been initializedby the server yet.
During system startupthis is a normalmessage. If it occurs atother times contact anapplication engineer.
103 Collect areaskipped error
Collect area name The specified collectarea was skippedbecause the servercould not initializethe associated table.
See message 100

Appendix D. Log Files
D-17
Code Message Text Message Parameters Message Meaning User Response toMessage
104 BMP1 packetsent
The packet message typecode:0 Packet Delivery FaultNotification1 Status/Warning/FaultNotification2 Network DescriptionTransaction3 Clock Check/SetTransaction4 Program Down-loadTransaction5 Program Up-loadTransaction7 Data Advise CommandTransaction8 Data Advise NotificationPacket9 Hole CollectionCommand Transaction10 Control Command (SetVariable) Transaction11 User I/O Transaction(Terminal Mode)12 Memory Image Down-load Transaction13 Memory Image Up-loadTransaction14 Get Table DefinitionsTransaction15 RF Test Transaction16 Communication StatusNotification
The specified BMP1packet was sent to theserial communicationinterface. Thenumber specifies thetype of message thatwas sent.

Appendix D. Log Files
D-18
Code Message Text Message Parameters Message Meaning User Response toMessage
105 BMP1 packetreceived
The packet message typecode:0 Packet Delivery FaultNotification1 Status/Warning/FaultNotification2 Network DescriptionTransaction3 Clock Check/SetTransaction4 Program Down-loadTransaction5 Program Up-loadTransaction7 Data Advise CommandTransaction8 Data Advise NotificationPacket9 Hole CollectionCommand Transaction10 Control Command (SetVariable) Transaction11 User I/O Transaction(Terminal Mode)12 Memory Image Down-load Transaction13 Memory Image Up-loadTransaction14 Get Table DefinitionsTransaction15 RF Test Transaction16 Communication StatusNotification
The specified BMP1packet was receivedover the serialcommunications link.The number indicatesthe type of messagereceived.
106 Data file outputfailed
Data collected from adatalogger could notbe written to the dataoutput file.
Check that there isspace available on thehard disk and that writepermissions allow theserver to write the dataoutput files.
107 Max time on-line exceeded
The amount of time thedevice was connected, inmilliseconds
A client kept thecommunication linkon-line longer thanthe specified maxtime on-line.

Appendix D. Log Files
D-19
Code Message Text Message Parameters Message Meaning User Response toMessage
108 Table reset The name of the table thatwas reset; The accountname of the logged inclient
The name of a tablewas changed at therequest of a client.On CR5000 andCR9000 loggers thisis a reset for the tablein the datalogger andon the PC.
109 Collectschedule reset
The account name of thelogged in client
The collectionschedule was reset bythe indicated client.
110 Collect areasetting changed
The name of the collectionarea; The setting identifierfor the setting that waschanged; The new value ofthe setting; The accountname of the logged inclient.
One of the settingsfor the specifiedcollect area waschanged. Theidentifiers for thesetting can be foundin Cora Script help.
111 PakBus routeadded
A new PakBus routehas been added to therouting table.
112 PakBus routelost
A PakBus route hasbeen lost and will beremoved from therouting table.
113 PakBus stationadded
A new PakBus stationwas added to thenetwork.
114 Call-back begin A device has called into the server startingthe call-backresponse.
116 Call-backstopped
A datalogger thatcalled in to the serverwith call-back ishanging up.
117 Client loggedoff
The login name of theclient; The reason thesession was closed.
A client applicationhas closed or lost theconnection to theserver.
118 Table sizereduced duringcreation
The name of the table thatwas resized; The originalspecified size of the table;The new size of the table.
The size of the tablein the data cache wasreduced because therewas not enoughcomputer disk spaceto create it, or the filewould have exceededthe 2 Gbyte size limit.
Reduce the size of thetables in the dataloggerprogram or get morehard disk storage spacefor the computer.

Appendix D. Log Files
D-20
Transaction Log Example
"2002-03-06 11:30:01.075","CR510TD","94","Collect area poll complete","TimeSet","0""2002-03-06 11:30:01.325","CR510TD","41","Records received","TenSecond","242747","242751""2002-03-06 11:30:01.325","CR510TD","94","Collect area poll complete","TenSecond","12""2002-03-06 11:30:01.325","CR510TD","97","Scheduled polling complete""2002-03-06 11:30:04.670","CR23X_2","93","Final storage values received","final_storage_1","72""2002-03-06 11:30:04.670","CR23X_2","94","Collect area poll complete","final_storage_1","72""2002-03-06 11:30:04.700","CR23X_2","94","Collect area poll complete","ports_and_flags","0""2002-03-06 11:30:04.700","CR23X_2","97","Scheduled polling complete""2002-03-06 11:30:30.097","CR510TD","13","Clock checked","20020306 11:28:32.455""2002-03-06 11:31:00.010","CR23X_2","96","Scheduled poll started""2002-03-06 11:31:00.010","CR510TD","96","Scheduled poll started""2002-03-06 11:31:00.010","CR23X_2","92","Collect area poll started","final_storage_1""2002-03-06 11:31:00.010","CR23X_2","92","Collect area poll started","ports_and_flags""2002-03-06 11:31:00.010","CR510TD","92","Collect area poll started","ErrorLog""2002-03-06 11:31:00.010","CR510TD","92","Collect area poll started","Hourly""2002-03-06 11:31:00.010","CR510TD","92","Collect area poll started","OneMinute""2002-03-06 11:31:00.010","CR510TD","92","Collect area poll started","TenSecond""2002-03-06 11:31:00.010","CR510TD","92","Collect area poll started","TimeSet""2002-03-06 11:31:00.100","CR510TD","13","Clock checked","20020306 11:29:02.454""2002-03-06 11:31:00.290","CR510TD","41","Records received","ErrorLog","5","5""2002-03-06 11:31:00.290","CR510TD","94","Collect area poll complete","ErrorLog","0""2002-03-06 11:31:00.530","CR510TD","41","Records received","Hourly","673","673""2002-03-06 11:31:00.530","CR510TD","94","Collect area poll complete","Hourly","0""2002-03-06 11:31:00.731","CR510TD","41","Records received","OneMinute","40459","40459""2002-03-06 11:31:00.731","CR510TD","94","Collect area poll complete","OneMinute","3""2002-03-06 11:31:00.961","CR510TD","41","Records received","TenSecond","242758","242758"
D.1.3.4 Object State Log Format
The object state log includes two fields in addition to the timestamp and devicename:
Object Name - The name of the object from which the message is beinggenerated. Typically this will be the name of an object method.
Description - Any extra information associated with the event.

Appendix D. Log Files
D-21
Object State Log Example
"2002-02-07 12:04:29.003","CR10T","Logger::on_selective_manual_poll_cmd","66","9557""2002-02-07 12:04:29.003","CR10T","Dev::cmdAdd","BMP1 Low Level Serial","3""2002-02-07 12:04:29.003","CR10T","Dev::onNextCommand","Executing command","BMP1 LowLevel Serial","3""2002-02-07 12:04:29.003","CR10T","Bmp1::Bmp1Tran::get_next_out_message","hole collection""2002-02-07 12:04:29.233","CR10T","Dev::cmdFinished","BMP1 Low Level Serial""2002-02-07 12:04:30.004","CR10T","Logger::on_selective_manual_poll_cmd","66","9558""2002-02-07 12:04:30.004","CR10T","Dev::cmdAdd","BMP1 Low Level Serial","3""2002-02-07 12:04:30.004","CR10T","Dev::onNextCommand","Executing command","BMP1 LowLevel Serial","3""2002-02-07 12:04:30.004","CR10T","Bmp1::Bmp1Tran::get_next_out_message","hole collection""2002-02-07 12:04:30.234","CR10T","Bmp1::Bmp1Tran::get_next_out_message","hole collection""2002-02-07 12:04:30.325","CR10T","Bmp1::Bmp1Tran::get_next_out_message","hole collection""2002-02-07 12:04:30.495","CR10T","Bmp1::Bmp1Tran::get_next_out_message","hole collection""2002-02-07 12:04:30.685","CR10T","Bmp1::Bmp1Tran::get_next_out_message","hole collection""2002-02-07 12:04:31.006","CR10T","Logger::on_selective_manual_poll_cmd","66","9559""2002-02-07 12:04:31.446","CR10T","Bmp1::Bmp1Tran::get_next_out_message","hole collection""2002-02-07 12:04:31.807","CR10T","Dev::shouldGetOffLine","communication disabled""2002-02-07 12:04:31.807","CR10T","Dev::cmdFinished","BMP1 Low Level Serial""2002-02-07 12:04:31.807","CR10T","Dev::onNextCommand","Ending""2002-02-07 12:04:31.837","ComPort_1","Dev::relDevice","CR10T""2002-02-07 12:04:31.837","CR10T","Dev::cmdFinished","BMP1 low level serial end""2002-02-07 12:04:31.837","CR10T","Dev::goingOffLine","Reset off-line counter""2002-02-07 12:04:31.837","ComPort_1","Dev::onNextCommand","Ending""2002-02-07 12:04:31.867","ComPort_1","Dev::cmdFinished","Comm::Root::end_command_type""2002-02-07 12:04:31.867","ComPort_1","Dev::goingOffLine","Reset off-line counter""2002-02-07 12:04:31.867","ComPort_1","SerialProvider::execute","thread stopping""2002-02-07 12:04:31.907","CR10T","Dev::shutDown","Shutting down""2002-02-07 12:04:31.997","CR10T","Dev::shutDown","Shutting down""2002-02-07 12:04:32.047","ComPort_1","Dev::shutDown","Shutting down""2002-02-07 12:04:32.047","ComPort_1","Dev::shutDown","Shutting down"
This is a blank page.

Appendix D. Log Files
D-22
This is a blank page.

E-1
Appendix E. Importing Files into ExcelData files saved by LoggerNet can be imported into a spreadsheet program foranalysis or manipulation. Instructions are given below for importing a commaseparated file into Microsoft Excel.
From the Excel menu, select File | Open. Browse for the *.dat file that you wantto import. Excel will recognize the file as not being in an xls format, and willinvoke the Text Import Wizard. The Text Import Wizard consists of threesteps, each having its own window.
E.1 Array-Based Data File ImportArray-based data files are typically comma separated with the first column ofeach line being an array ID. If time and date are included in the arrays, theymay be in columns 2 through 5, with some of the columns optional. Excel willeasily read the comma separated file. Getting the different time columns pulledtogether into one timestamp field takes a little manipulation.
Step 1 of 3Select the Delimited option from the Original Data Type group box. Using thearrow buttons to the right of the Start Import at Row field, select the number ofthe first row of data to be imported. Select the Next button.
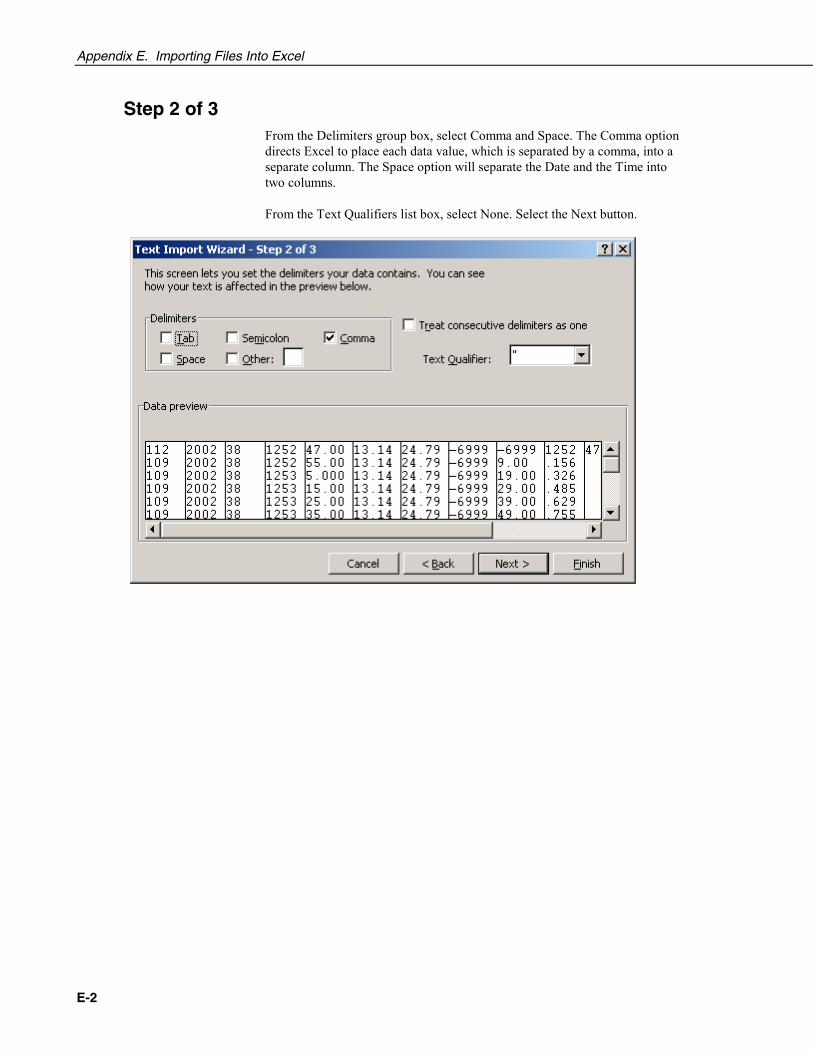
Appendix E. Importing Files Into Excel
E-2
Step 2 of 3From the Delimiters group box, select Comma and Space. The Comma optiondirects Excel to place each data value, which is separated by a comma, into aseparate column. The Space option will separate the Date and the Time intotwo columns.
From the Text Qualifiers list box, select None. Select the Next button.

Appendix E. Importing Files Into Excel
E-3
Step 3 of 3A quick look at the columns of data is provided in the Data Preview group box.
To complete the import, select the Finish button.
Converting to Excel Format Date and Time
Once the data file has been imported into Excel, the time fields are stilldisplayed as comma separated numbers such as Year, Day of Year, andHours/Minutes in HHMM format.
Split can take array-based data files and convert the year, day of year, andhours/minutes fields into a standard timestamp format that Excel will readdirectly. See Section 10.3.5.3.
You can also enter formulas as described below to convert the timestamp fieldsin the array data to the decimal format used by Excel. Microsoft’s database(MS Access) and spreadsheet (MS Excel) programs store dates and times asreal numbers, where the integer portion of the number represents the number ofdays since some base date (usually January 1, 1900), and the fractional portionrepresents the time of day. For example, June 1, 2000 at 10:00 a.m. would bestored as “36678.41667.”
This formula will take the comma separated date and time fields and convertthem to the decimal date use by Excel. The variables shown in brackets [ ]should be replaced by the cell location for that data. If you don’t have all of thedate or time elements in your data, you can replace that part of the equation

Appendix E. Importing Files Into Excel
E-4
with a number (e.g. [Year] = 2002), or for Hours, Minutes, and Seconds leavethat part of the formula out.
([Year]-1900)*365+1+Int(([Year] –1901)/4)+[Day]+Int([HHMM]/100)/24+([HHMM]/100-Int([HHMM]/100))*100/60/24+[Sec]/60/60/24
Section of formula: Results:[Year]-1900)*365+1+Int(([Year]-1901/4
Delivers the number of days since the beginning ofthe 20th century through the end of last year takinginto account leap years
+[Day] Adds the Julian date to the above+Int([HHMM]/100/24 Converts the hour portion of the HHMM time field
to a fraction of a day+([HHMM]/100-Int([HHMM]/100))*100/60/24
Converts the minutes portion of the HHMM timefield to a fraction of a day
+[Sec]/60/60/24 Converts the seconds field in to a fraction of a day
Once you have entered the formula for one cell you can apply it to multiplecells using Excel’s Fill function. Selecting the cells and using Format Cells canset the display format of the timestamp.
E.2 Table-Based Data File Import
Step 1 of 3Select the Delimited option from the Original Data Type group box. Using thearrow buttons to the right of the Start Import at Row field, select the number ofthe first row of data to be imported. If your data file has headers included, youcan import those or start the import at the first row of data (typically row 3).Select the Next button.

Appendix E. Importing Files Into Excel
E-5
Step 2 of 3From the Delimiters group box, select Comma and Space. The Comma optiondirects Excel to place each data value, which is separated by a comma, into aseparate column. The Space option will separate the Date and the Time intotwo columns.
From the Text Qualifiers list box, select None. Select the Next button.

Appendix E. Importing Files Into Excel
E-6
Step 3 of 3A quick look at the columns of data is provided in the Data Preview group box.Highlight the column with the year/month/day and from the Column DataFormat group box, select the Date option. From the drop down list box to theright of this option select the YMD format.
To complete the import, select the Finish button.
As imported, the Date and Time fields have a quotation mark in the field.
"TOACI1" "CR10T" "FiveSecond""TMSTAMP" "RECNBR" "counter" "SineOut" "IntTemp_C" "BattVolt""2002-01-17 16:31:45" 19787 340 -0.342 23.83 13.96"2002-01-17 16:31:50" 19788 22 0.375 23.83 13.97"2002-01-17 16:31:55" 19789 62 0.883 23.83 13.97"2002-01-17 16:32:00" 19790 102 0.978 23.83 13.97"2002-01-17 16:32:05" 19791 142 0.616 23.83 13.96"2002-01-17 16:32:10" 19792 182 -0.035 23.83 13.97
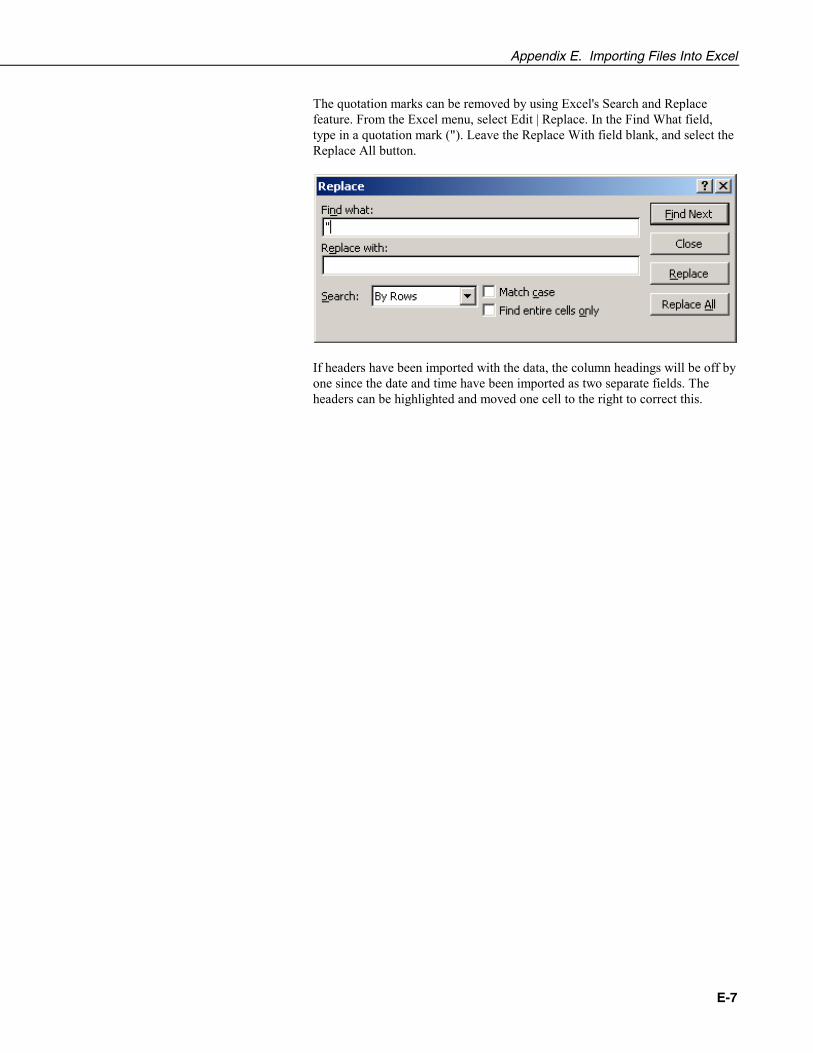
Appendix E. Importing Files Into Excel
E-7
The quotation marks can be removed by using Excel's Search and Replacefeature. From the Excel menu, select Edit | Replace. In the Find What field,type in a quotation mark ("). Leave the Replace With field blank, and select theReplace All button.
If headers have been imported with the data, the column headings will be off byone since the date and time have been imported as two separate fields. Theheaders can be highlighted and moved one cell to the right to correct this.
This is a blank page.

Appendix E. Importing Files Into Excel
E-8
This is a blank page.

F-1
Appendix F. CoraScript
F.1 CoraScript FundamentalsCoraScript is a command line interpreter that reads its commands as text fromits standard input device and writes the results of those commands as text to itsstandard output device. This style of input and output makes it possible toexternally control the LoggerNet server operation using input and outputredirection. It also makes it possible to string together commands in scripts thatcan be executed from the command line.
The CoraScript command interpreter is started by executing the program fileCora_Cmd.exe in a command prompt environment. CoraScript is alsoavailable through the LoggerNet program files start menu under “Tools”. Whenthe script processor starts up it will output a response:
CoraScript 1,1,1,30
The numbers indicate the version number of the current CoraScript.
CoraScript is a batch processing interpreter. It treats its input (from the standardinput device) as a sequence of commands that are processed serially from thefirst to the last. As a command is processed, the results are written to thestandard output device. A command is defined as the text up to a semicolon (;).The semicolon tells Cora Script that the command is complete and ready toexecute.
The flexibility of the commands available within CoraScript and theindependence from user interface considerations make CoraScript a valuabletool for testing, troubleshooting, and automating LoggerNet server operations.
Because the commands available in CoraScript operate directlyon the LoggerNet server and not through a user interface, thereare no confirmation prompts for critical operations. Care shouldbe exercised in using the commands to avoid interrupting normalserver operations.
There is an extensive on-line help file available for CoraScript. To bring up thehelp file, type “help;” on the command line. (Make sure and include thesemicolon ‘;’ at the end and leave off the quotes.) Read through the directionsand try some examples.
NOTE

Appendix F. CoraScript
F-2
F.2 Useful CoraScript OperationsThe following sections provide an overview of some common and very usefulcommands available with CoraScript. Some rules about formatting input andinterpreting the responses:
• Always end the command with the semicolon (;) character. CoraScriptuses the semicolon to mark the end of the command input and will notprocess anything until it is detected.
• Command parameters are often set using a combination of the parametername and the value in this format: --name=login. Be sure to read thehelp for the command you are using.
• A response preceded by a plus sign (+) indicates that the command wassuccessfully processed.
• A response preceded by a minus sign (-) indicates that the command failedand will usually be accompanied by a reason for the failure.
F.2.1 Connecting to the LoggerNet ServerBefore you can execute any commands a connection to the LoggerNet servermust be established. The connect command sets up the server context in whichsubsequent commands will operate until the end of the script is reached oranother connect command is processed. The following segment shows a sampleuse of the connect command:
connect # the name of the command localhost # specifies the server's host address --name="bilbo" # specifies the logon name (optional) --password=baggins # specifies the password (optional) ; # marks the end of the command
This command would normally appear on one line as follows:
connect localhost --name=”bilbo” --password=baggins ;
For a more detailed explanation of the interpretation of the symbols and syntaxrefer to the CoraScript help.
F.2.2 Checking and Setting Device SettingsThe current value of any of the configuration settings for a device is availableusing the get-device-setting command. Devices are referred to by the name asshown in the Setup screen network map and settings are referenced by number.The setting numbers and their meanings are described in the CoraScript help.
To set the configuration setting for any device, use the set-device-settingcommand. As with get-device-setting the device is referred to by name and thesetting by number.

Appendix F. CoraScript
F-3
F.2.3 Creating and using a Network Backup ScriptOne of the most useful commands for network maintenance is create-backup-script. Executing this command will create a script file of CoraScriptcommands that can be used to rebuild the existing datalogger network andconfigure all of the device settings. It will not save or restore any data that hasbeen collected but can serve as a means to restore the network map andsettings.
To create the script enter the command along with a file name and path for thescript file:
create-backup-script c:\temp\mynetwork.script;
This will write all of the commands necessary to build and configure thenetwork map into the file mynetwork.script. To restore the network map,remove all of the devices in the current map and then from a command promptenter:
Cora_cmd.exe < c:\temp\mynetwork.script
The less than symbol ( < ) is redirection that tells the CoraScript executable toread commands from the specified file. For more information about thiscommand see the CoraScript help.
F.2.4 Hole ManagementThere are several commands available with CoraScript to manage the holecollection process. These functions are not available through the standard userinterface applications. See the CoraScript help for details about thesecommands.
List-holes
Purge-holes
Delete-holes
F.2.5 Scripting CoraScript CommandsTo automate network processes, scripts can be created with other scriptinglanguage tools that would call the CoraScript interpreter, and send commandsto the LoggerNet server. This provides an alternate means of controlling datacollection, hole collection and maintenance functions such as clock check andset.

Appendix F. CoraScript
F-4
This is a blank page.