
LODGING INDUSTRY TRENDS 2015
4
LODGING INDUSTRY TRENDS 2015
Transcript of LODGING INDUSTRY TRENDS 2015

LODGING INDUSTRY TRENDS 2015

4.8 MILLIONAverage number
of guests each night
1.9 MILLIONEmployed by
hotel properties
The lodging industry is boosting economic growth, marking five years of consecutive job creation. The latest trends reinforce the industry’s ability to create good-paying jobs, grow communities
and promote tourism and travel across the United States.
In the last year, there were more jobs and higher wages in our industry: the industry added more than 30,000 new hotel jobs and more than 100,000 new travel-related jobs, resulting in an increase of over $12 billion in travel-related wages and salaries, up six percent. The pace of hotel development remains robust: the total number of properties grew from some 52,000 properties to 53,432 properties; and rooms grew from some 4.8 million rooms to 4,978,705 rooms, in just one year. The industry also provides billions of dollars to communities across the country. Just this year, hotels generated $141.5 billion in business travel tax revenue, which is up $6.5 billion from last year.
Travelers are spending more too. The typical business traveler spends about 3 percent more per night, and the typical leisure traveler spends about 6 percent more per night. Not only has the industry promoted domestic growth, but international travel to the U.S. continues to increase, making the U.S., by far, the top destination for international travel. By 2020, 96.4 million visitors are forecasted to visit, which amounts to an increase of 29 percent over 2014.
*Based on properties with 15 or more rooms.
AT-A-GLANCE STATISTICAL FIGURES TRENDING UPWARD
53,432Properties*
4,978,705Guestrooms
$176 BILLIONLodging sales revenue
$141.5 BILLIONBusiness travel
tax revenue
$74.12Revenue per available
room (RevPAR)
64.4%Average
occupancy rate
LODGING INDUSTRY TRENDS 2015
All figures are for year-end 2014. Figures for 2015 will be available in mid-2016.Sources: U.S. Department of Commerce, International Trade Administration, National Travel & Tourism Office; Bureau of Economic Analysis; Statistics Canada; Banco de Mexico.
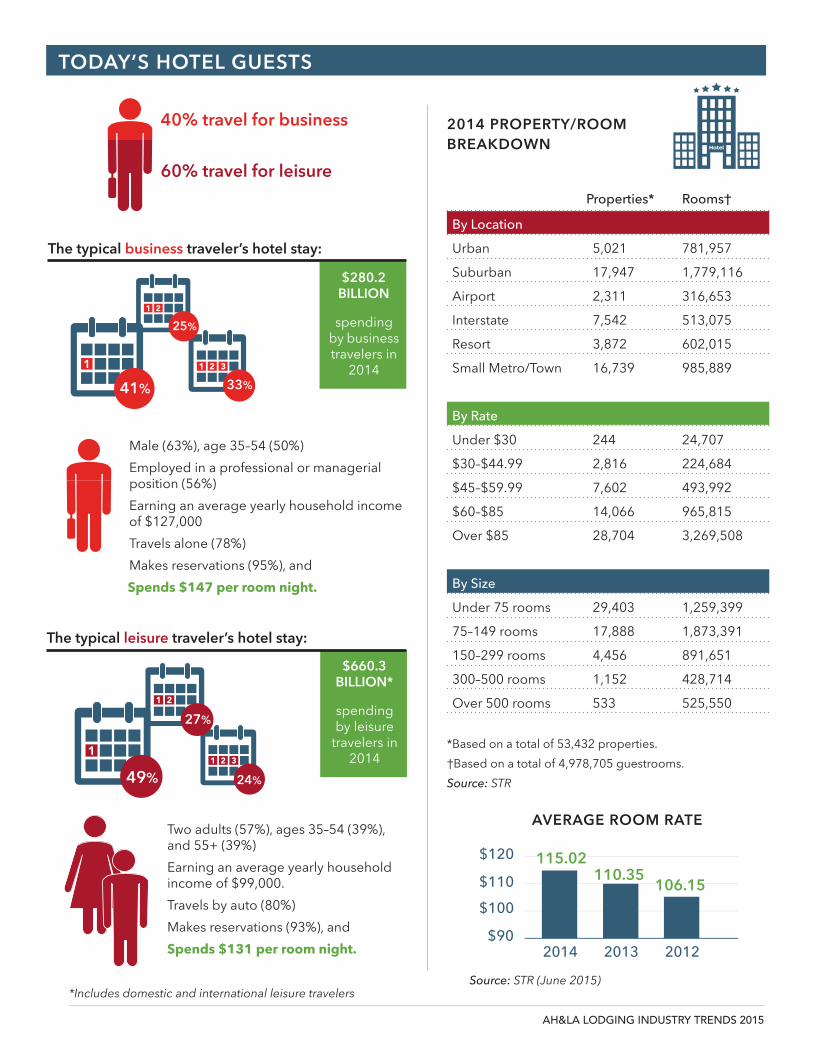
$660.3 BILLION*
spending by leisure
travelers in 2014
$280.2 BILLION
spending by business travelers in
2014
By Location
Urban 5,021 781,957
Suburban 17,947 1,779,116
Airport 2,311 316,653
Interstate 7,542 513,075
Resort 3,872 602,015
Small Metro/Town 16,739 985,889
By Rate
Under $30 244 24,707
$30–$44.99 2,816 224,684
$45–$59.99 7,602 493,992
$60–$85 14,066 965,815
Over $85 28,704 3,269,508
By Size
Under 75 rooms 29,403 1,259,399
75–149 rooms 17,888 1,873,391
150–299 rooms 4,456 891,651
300–500 rooms 1,152 428,714
Over 500 rooms 533 525,550
Properties* Rooms†
*Based on a total of 53,432 properties.
†Based on a total of 4,978,705 guestrooms.
Source: STR
AVERAGE ROOM RATE
Source: STR (June 2015)*Includes domestic and international leisure travelers
$90
$100
$110
$120
106.15110.35
115.02
201220132014
AH&LA LODGING INDUSTRY TRENDS 2015
2014 PROPERTY/ROOM BREAKDOWN
TODAY’S HOTEL GUESTS
40% travel for business
60% travel for leisure
41% 33%
25%
The typical business traveler’s hotel stay:
Male (63%), age 35–54 (50%)
Employed in a professional or managerial position (56%)
Earning an average yearly household income of $127,000
Travels alone (78%)
Makes reservations (95%), and
Spends $147 per room night.
The typical leisure traveler’s hotel stay:
Two adults (57%), ages 35–54 (39%), and 55+ (39%)
Earning an average yearly household income of $99,000.
Travels by auto (80%)
Makes reservations (93%), and
Spends $131 per room night.
27%
49% 24%
Tourism Boosts Our Economy
$141.5 billion - combined tax revenue generated each year by business travel.
Resident and international travelers in the United States spend an average of $2.5 billion a day, $105.8 million an hour, $1.8 million a minute, and $29,398 a second.
Tourism generates $927.9 billion in sales.
The tourism industry pays $141.5 billion in federal, state, and local taxes.
Lodging and Tourism Create Jobs
1 in every 9 American jobs depend on travel and tourism.
The travel and tourism industry pays $221.7 billion in travel-related wages and salaries and employs 1.89 million hotel property workers.
Tourism directly supports more than 8 million travel and tourism jobs.
Travel and Tourism Drive Business
$1.4 trillion - travel revenue generated throughout the economic chain or 8.0% of GDP.
In the United States, travel and tourism is among the nation’s largest services export industries, and one of America’s largest employers. In fact, it ranks as one of the top 10 largest industries in 49 states plus the District of Columbia.
The tourism industry includes a number of interrelated businesses – lodging properties, airlines, restaurants, cruise lines, car rental firms, travel agents, and tour operators, among others.
AH&LA LODGING INDUSTRY TRENDS 2015
THE TOURISM INDUSTRY
The United States receives a larger share of world international tourism receipts than any other country in the world. In 2014, international travelers spent an estimated $220.6 billion. The U.S. share of 2014 world tourism receipts was at the top (14.2%); well ahead of second-ranked Spain and third-ranked France.
In 2014 international* travelers to the United States increased 6.7% over 2013 to a record 74.8 million. Overseas** arrivals grew by 7.2% to a record 34.5 million. Overseas markets accounted for 46.1% of total arrivals to the U.S. Arrivals from Mexico increased dramatically by 17.3%, while arrivals from Canada saw a slight decrease of 1.7%.
The top 10 countries in terms of U.S. arrivals for 2014 were:
These 10 countries accounted for 78.5% of U.S. visitors.
The impact of international travelers on the hotel industry is considerable; international visitors accounted for 20% of all lodging sales. In 2014, 26.5 million overseas travelers stayed in a hotel/motel during their U.S. visit. The average length of stay for overseas hotel visitors was 9.7 nights; the average party size was 1.7 travelers. 76.2% of these overseas travelers were repeat visitors.
Strong growth in international travel to the U.S. is expected to continue through 2020 with an average annual growth rate of 4.3% in the volume of international visitors.
INTERNATIONAL TRAVEL
1. Canada (23.0 million)2. Mexico (17.3 million)3. United Kingdom
(4.0 million)4. Japan (3.6 million)5. Brazil (2.3 million)
6. China (2.2 million)7. Germany (2.0 million)8. France (1.6 million)9. South Korea
(1.4 million) 10. Australia (1.3 million)
* International includes Canada, Mexico, and overseas.
** Overseas excludes Canada and Mexico.
Serving the hospitality industry for more than a century, the American Hotel & Lodging Association (AH&LA) is the sole national association representing all segments of the 1.9 million-employee U.S. lodging industry, including hotel owners, REITs, chains, franchisees, management companies, independent properties, state hotel associations, and industry suppliers.
![Security and the lodging industry [compatibility mode]](https://static.fdocuments.us/doc/165x107/556aea86d8b42a86218b4ccc/security-and-the-lodging-industry-compatibility-mode.jpg)