Locus of Control and Job Search Strategiesjenni.uchicago.edu/Spencer_Conference/Papers...
33
Locus of Control and Job Search Strategies Marco Caliendo * Deborah Cobb-Clark † Arne Uhlendorff ‡ November 19, 2010 Abstract Standard job search theory assumes that unemployed individuals have perfect infor- mation about the effect of their search effort on the job offer arrival rate. In this paper, we present an alternative model which assumes instead that each individual has a subjective belief about the impact of his or her search effort on the rate at which job offers arrive. These beliefs depend in part on an individual’s locus of control, i.e., the extent to which a person believes that future outcomes are determined by his or her own actions as opposed to external factors. We estimate the impact of locus of control on job search behavior using a novel panel data set of newly-unemployed individuals in Germany. Consistent with our theoretical predictions, we find evidence that individuals with an internal locus of control search more and that individuals who believe that their future outcomes are determined by external factors have lower reservation wages. Keywords: job search behavior, search effort, reservation wage, locus of control, un- employment duration JEL codes: J64 * IZA, DIW Berlin, IAB, e-mail: [email protected]. Corresponding address: Institute for the Study of Labor (IZA), P.O. Box 7240, 53072 Bonn, Germany. † ANU/Canberra, IZA, e-mail: [email protected] ‡ University of Mannheim, IZA, DIW Berlin, e-mail: [email protected] The authors thank Silke Anger, Lex Borghans, Dirk Hofmann, Pia Pinger, Stefanie Schurer, Thomas Siedler and Gerard van den Berg for helpful comments and suggestions. We also thank the participants in seminars and conferences at the Australian National University, the 2009 Labour Econometrics Workshop (Brisbane), EEA 2009 (Barcelona), University of Maastricht and AEA 2010 (Atlanta) for valuable comments. The IAB (Nuremberg) kindly gave us permission to use the data. Marco Caliendo and Arne Uhlendorff thank the German Research Foundation (DFG) for financial support of the project CA 829/1-1.
Transcript of Locus of Control and Job Search Strategiesjenni.uchicago.edu/Spencer_Conference/Papers...

Locus of Control and Job Search Strategies
Marco Caliendo∗
Deborah Cobb-Clark†
Arne Uhlendorff ‡
November 19, 2010
Abstract
Standard job search theory assumes that unemployed individuals have perfect infor-mation about the effect of their search effort on the job offer arrival rate. In thispaper, we present an alternative model which assumes instead that each individualhas a subjective belief about the impact of his or her search effort on the rate at whichjob offers arrive. These beliefs depend in part on an individual’s locus of control, i.e.,the extent to which a person believes that future outcomes are determined by hisor her own actions as opposed to external factors. We estimate the impact of locusof control on job search behavior using a novel panel data set of newly-unemployedindividuals in Germany. Consistent with our theoretical predictions, we find evidencethat individuals with an internal locus of control search more and that individualswho believe that their future outcomes are determined by external factors have lowerreservation wages.
Keywords: job search behavior, search effort, reservation wage, locus of control, un-employment durationJEL codes: J64
∗IZA, DIW Berlin, IAB, e-mail: [email protected]. Corresponding address: Institute for the Study of
Labor (IZA), P.O. Box 7240, 53072 Bonn, Germany.†ANU/Canberra, IZA, e-mail: [email protected]‡University of Mannheim, IZA, DIW Berlin, e-mail: [email protected]
The authors thank Silke Anger, Lex Borghans, Dirk Hofmann, Pia Pinger, Stefanie Schurer, Thomas
Siedler and Gerard van den Berg for helpful comments and suggestions. We also thank the participants
in seminars and conferences at the Australian National University, the 2009 Labour Econometrics
Workshop (Brisbane), EEA 2009 (Barcelona), University of Maastricht and AEA 2010 (Atlanta) for
valuable comments. The IAB (Nuremberg) kindly gave us permission to use the data. Marco Caliendo
and Arne Uhlendorff thank the German Research Foundation (DFG) for financial support of the project
CA 829/1-1.
1 Introduction
Standard job search theory assumes that unemployed individuals have perfect informationabout the effect of their search effort on the job offer arrival rate. In this paper, we presentan alternative model which assumes instead that each individual has a subjective beliefabout the impact of his or her search effort on the rate at which job offers arrive. Thissubjective belief depends in part on individuals’ ‘locus of control’, which is defined as ageneralized expectation about the internal versus external control of reinforcement (Rotter,1966). A person whose external locus of control dominates tends to believe that much ofwhat happens is beyond his or her control. Life’s outcomes are instead attributed toother forces, like fate or luck, rather than to ones own actions. In contrast, a person withan internal locus of control sees future outcomes as being contingent on his or her owndecisions and behavior.
It is quite intuitive that people who believe that success in life largely depends ontheir own actions and efforts rather than on luck or other “external” forces in turn expectdifferent returns to their own behavior—particularly with respect to investment decisionslike educational choices—than individuals with a more external locus of control. Giventhis, it seems sensible to expect that locus of control will have an important effect onmany economic outcomes and in particular, that internality will be positively correlatedwith economic success.
In fact, several empirical studies do conclude that locus of control is correlated withlabor market success, in particular wages. An early example is Andrisani (1977, 1981) whoexamines National Longitudinal Survey data and finds that individuals with an internallocus of control in 1968 had significantly higher hourly wages two years later. Similarly,Osborne Groves (2005) analyzes data from the National Longitudinal Survey of YoungWomen and concludes that women with an internal locus of control earn more than womenwith an external locus of control. Semykina and Linz (2007) also find a positive associationbetween the locus of control and wages for Russian women, though not for Russian men.The evidence from studies based on the Panel Study of Income Dynamics (PSID) is moremixed. For example Duncan and Morgan’s (1981) replication study of Andrisani (1977)fails to produce evidence of a strong link between locus of control and wage rates1, thoughDuncan and Dunifon (1998) find that an internal locus of control is positively related towages some 20-25 years later. Using German data Anger and Heineck (2010) find a wagepenalty for individuals with a highly external locus of control.
Investment decisions also appear to be linked to individuals’ locus of control. In partic-ular, Coleman and Deleire (2003) conclude that locus of control affects education decisionsprimarily by influencing teenagers’ expectations regarding the return to human capital in-vestments.2 Cebi (2007), however, is not able to replicate these results using a differentdata set. Still, the potential link between individuals’ locus of control and their humancapital investments raises questions about the extent to which locus of control affects
1In a reply to this article Andrisani (1981) argues that Duncan and Morgan actually failed to disprovehis results and cites several other studies that confirm his findings.
2Hansemark (2003) finds evidence for a positive impact of internal locus of control on the probabilityof starting a new business for men, but not for women.
2

wages directly via productivity versus indirectly through skills acquisition. Piatek andPinger (2010), for example, conclude that locus of control affects wages only indirectlythrough the schooling decision. Heckman et al. (2006) use indicators of self-esteem andlocus of control to construct a one-dimensional, latent factor representing noncognitiveskills. They find that noncognitive skills have both a direct wage effect (via productivity)and an indirect wage effect (via schooling and work experience).
To our knowledge, there exist only three previous studies that assess the effect of locusof control on transitions from unemployment to employment.3 Gallo et al. (2003) andUhlendorff (2004) analyze the German Socio Economic Panel (SOEP) and conclude thata higher sense of internal control is associated with a higher probability of reemploymentand with shorter spells of unemployment, respectively.4 Neither study, however, analyzesthe association between locus of control and the search behavior directly. In independentwork, McGee (2010) takes a similar approach to ours to investigate job search amongrespondents in the 1979 National Longitudinal Survey of Youth (NLSY) and finds thatyoung unemployed men with an internal locus of control search more and have higherreservation wages. Although he lacks a direct measure of individuals’ beliefs about thepayoffs to job search, McGee estimates models of the propensity to receive a job offerconditional on having made contact with an employer and finds results that are consistentwith his assumption that locus of control influences search behavior through beliefs aboutthe efficacy of job search rather than productivity per se.
Our paper advances this previous literature in two important ways. First, unlike McGee(2010), we directly examine the link between individuals’ locus of control and their beliefsabout the payoffs to job search. Second, we develop a job search model which incorporatesindividuals’ subjective beliefs about the effect of their search effort on the job offer arrivalrate. Specifically, individuals with an internal locus of control believe that job search isassociated with a relatively large increase in the probability of finding a job, while thosewith an external locus of control believe that search has little effect on the job offer arrivalrate. Unemployed individuals who believe that labor market success depends on their ownefforts are consequently expected to search more and have higher reservation wages. Wecontrast these predictions to those from an alternative model in which individuals with amore internal locus of control have a higher subjective job arrival rate independent of theirsearch effort, perhaps because they are simply more optimistic. They are expected to havehigher reservation wages, but to search less. Thus, we are able to use our theoretical modelto generate empirically testable predictions and to distinguish between these alternativeexplanations for the link between locus of control and job search.
We test the implications of our model by estimating the impact of an individual’s lo-cus of control on his or her search intensity and reservation wage using a novel panel dataset of newly unemployed individuals in Germany. Specifically, our data are from the firstwave of the IZA Evaluation Data Set (see Caliendo et al., 2010, for details). This dataset is based on approximately 17,000 individuals who became unemployed between late
3Job search strategies have been linked to workers’ impatience, however, see DellaVigna and Paserman(2005).
4Uhlendorff (2004) finds this effect only for West Germany.
3

2007 and early 2008. This large number of observations allows us to apply non-parametricmatching methods in addition to standard regression techniques. This is an advantagecompared to data sources like the SOEP or the NLSY which usually contain a relativelysmall number of unemployment spells per year. The data are unique in providing us withdetailed information about search behavior, reservation wages and different psychologicaltraits including locus of control. Moreover, our survey data can be linked to administrativedata containing detailed information about previous employment histories including pre-vious wages and time spent in unemployment. This information goes a long way towardscapturing unobserved individual characteristics which might be correlated with both locusof control and current job search behavior.
Our interviews were conducted approximately two months after individuals entered un-employment. The data allow us to observe the impact of the locus of control on job searchbehavior directly and thereby to discriminate between alternative mechanisms throughwhich locus of control affects job search. In addition, all individuals are interviewed at thesame point in their unemployment spell. Thus concerns about potential reverse causalitybetween noncognitive skills and labor market outcomes are reduced substantially. In con-trast, the point of an individual’s unemployment spell at which locus of control is measuredoften varies dramatically in surveys like the SOEP and the NLSY.
We find that the marginal effect of an additional job application on individuals’ propen-sity to report that they are very likely to get a job in the next period is higher among thosejob seekers with an internal locus of control. Moreover, individuals with a more externallocus of control have lower reservation wages and search less intensively. These results areconsistent with locus of control affecting search behavior through individuals’ subjectivebeliefs about the payoff to job search.
The outline of this paper is as follows. Section 2 presents the theoretical model, whileSection 3 describes the data in detail. In Section 4 we present our estimation strategy andthe results before Section 5 concludes.
2 Theoretical Framework
We begin by assuming that each unemployed individual searches sequentially for a job in astationary environment. Job offers arrive for a given search effort s with arrival rate λ(s).This arrival rate depends positively on individuals’ search effort and the marginal return tosearch effort is decreasing (i.e. λ′ > 0 and λ′′ < 0). Job offers represent independent drawsfrom a wage distribution F (w) which is known by the unemployed. Each unemployedindividual receives unemployment benefits b and and faces search costs c(s) which areincreasing in search effort (i.e. c′ > 0 and c′′ > 0).
Each time a job offer arrives, individuals must decide whether to accept the offer or toreject it and to search further. The optimal search strategy will rest in part on choosing areservation wage, i.e., the wage at which the benefits of continued search are just equal tothe additional search costs.5 Any wage offer above the reservation wage is accepted, while
5For a description of job search models see for example Mortensen and Pissarides (1999) or Cahuc andZylberberg (2004). An overview of the empirical research is given by Eckstein and van den Berg (2007).
4
any offer below the reservation wage is rejected.
2.1 Locus of Control and the Return to Search Effort
Unlike the standard search model, we assume that individuals do not know the exactrelationship between their own search effort s and the job offer arrival rate λ(s). Instead,we assume that each individual has a subjective belief—given by (λ∗(s, loc))—about theeffect of s on λ which depends on the extent to which an individual has an internallocus of control (loc).6 Individuals with an internal locus of control believe that increasedsearch effort results in a relatively large increase in the job offer arrival rate. In contrast,individuals who feel that their own behavior does not influence future outcomes believethat additional search effort has little effect on the rate at which job offers arrive. In otherwords, ∂λ∗(s,loc)
∂s is assumed to be higher for those with a more internal locus of control
than for those with a more external locus of control, i.e., ∂2λ∗(s,loc)∂s∂loc > 0. Our objective is to
adopt a straightforward, parsimonious specification of the relationship between individuals’beliefs about the job arrival rate and the degree to which they have an internal locus ofcontrol which is consistent with this assumption. Consequently, we model individuals’locus of control to have a multiplicative impact on the subjective beliefs about arrivalrates: λ∗(s, loc) = λ(s)f(loc), with f ′(loc) > 0.
If a job-seeker receives no job offer at time t, he or she continues searching. If, however,a job offer with wage w is received, he or she accepts that job offer so long as the cor-responding discounted expected utility associated with being hired at that wage (Ve(w))exceeds the discounted expected utility (Vu) of remaining unemployed and continuingto search. It is important to note that individuals maximize their subjectively perceivedexpected utilities. The perception of future utility flows for a given search effort and aspecific reservation wage depends on the locus of control. The reservation wage φ definesthe stopping rule and corresponds to the wage offer for which Vu = Ve(φ) implying thatevery wage offer above φ will be accepted while every wage offer below φ will be rejected.
More specifically, the utilities associated with accepting a job offer and with continuedsearch are given by the following:
Ve(w) =1
1 + rdt[wdt + (1− qdt)Ve(w) + qdtVu] (1)
Vu =1
1 + rdt[(b− c(s))dt + λ(s)f(loc)dt(
∫ φ
0VudF (w) +
∫ ∞
φVe(w)dF (w))
+(1− λ(s)f(loc)dt)Vu] (2)
where r is the real instantaneous rate of interest, dt describes a short interval of time t,and the job separation rate is q. The discounted expected utility of being hired is equalto the income received in the period (wdt) plus the discounted expected future incomestream. With probability (1 − qdt) this is Ve(w) and with probability qdt this is Vu. The
6In other words, we measure locus of control such that higher values of loc are associated with a moreinternal locus of control.
5

discounted expected utility of continuing to search is the net income ((b−c(s))dt) receivedin the period plus the discounted expected utility of receiving a future job offer. Takentogether the discounted expected utilities associated with being unemployed (Vu) and withbeing hired at wage w (Ve(w)) implicitly define the reservation wage for a given searcheffort s. In particular, using equations (1) and (2) we can show that the reservation wageoffer φ at which Vu = Ve(φ) is given by
φ = b− c(s) +λ(s)f(loc)
r + q
∫ ∞
φ(w − φ)dF (w). (3)
Unemployed individuals choose both their search effort s and reservation wage φ so asto maximize their discounted expected utility Vu over an infinite horizon. Substituting theconstraint that Vu − Ve(φ) = 0 into this optimization problem, we can show that optimalsearch behavior is determined by the maximization of Vu = φ/r with respect to s. Thisimplies that we can solve for the optimal search effort s∗ by differentiating the relation(3) with respect to s and solving for s∗ such that ∂φ/∂s = 0. Specifically,
c′(s∗) =λ′(s∗)f(loc)
r + q
∫ ∞
φ(w − φ)dF (w). (4)
Equation (4) implies that individuals choose their optimal search effort by equating themarginal cost of job search with the marginal benefits associated with additional search,i.e., an increased probability of receiving a job offer paying more than their reservationwage.
Combining equations (3) and (4) we can solve for individuals’ reservation wage at theoptimal level of search s∗ as follows:
φ = b− c(s∗) +λ(s∗)λ′(s∗)
c′(s∗). (5)
Reservation wages are increasing in unemployment benefits and the job offer arrival rate,but decreasing in the costs of job search. Finally, higher marginal search costs raise reser-vation wages, while reservation wages are lower the greater is the marginal effect of jobsearch on the job offer arrival rate.
We now consider the effect that individuals’ beliefs about the offer arrival rate haveon their optimal search behavior. In particular, we are interested in the effect of a changein individuals’ locus of control on φ and s∗. It can be shown that individuals who have amore internal locus of control, i.e., those who believe that their own efforts have relativelylarge effects on future outcomes, have higher reservation wages and search more intensivelythan those with a more external locus of control. Specifically, we find that
∂φ
∂loc> 0 and
∂s∗
∂loc> 0. (6)
See Appendix B for details.7 The implications are quite intuitive. Conditional on search7These implications correspond to the theoretical results given by van den Berg and van der Klaauw
(2006). They show in the context of a job search model with multiple search channels that an increase insearch productivity—which corresponds to an increase in the subjective returns to search in our model—leads to a higher reservation wage and an increase in search effort.
6

intensity, individuals with a highly internal locus of control expect more future job offers.For them remaining unemployed and waiting for new job offers has a higher expectedutility, which leads to a higher reservation wage. For a given amount of search and aspecific reservation wage, the subjective marginal returns of search are also higher forindividuals with a highly internal locus of control. So, in order to equalize the marginalreturns and marginal costs of search, they search more.
For simplicity, the model is based on the assumption that the locus of control is stableover time, i.e., that the unemployment duration itself does not have any impact on f(loc)and that individuals do not update their beliefs about the impact of their search effort onthe probability of receiving a job offer. This simplifying assumption allows us to maintaintractability and focus attention on the key relationships of interest. In the empirical anal-ysis, we analyze the effect of locus of control on job search behavior by comparing onlyindividuals who are at the same point in the unemployment spell. Thus, our estimatesare unaffected by any subsequent updating of beliefs as individuals’ unemployment spellsprogress.
2.2 Locus of Control Independent of Search Effort
Thus far we have assumed that locus of control affects individuals’ search behavior throughtheir perceptions of the effect of job search on the probability of finding a job. Specifically,we have assumed that ∂λ∗(s∗,loc)
∂s∗ is higher for those with a more internal locus of controlthan for those with a more external locus of control.
The implications of this can be compared to the case when locus of control affectsthe probability of receiving a job offer independent of search effort. We investigate thispossibility by specifying an alternative model in which the relationship between job offerarrivals and an individual’s locus of control is given by λa(s, loc) = λ(s) + f(loc) withf ′(loc) > 0. In this case, individuals with an internal locus of control have a highersubjective probability of receiving a job offer for any given search intensity perhaps becausethey are more optimistic. This implies that – in contrast to the model above – the expectedeffect of search on the probability of receiving a job offer is independent of an individuals’locus of control, i.e. ∂λa(s,loc)
∂s = ∂λ(s)∂s .
Solving for the optimal search effort implies that
c′(s∗) =λ′(s∗)r + q
∫ ∞
φ(w − φ)dF (w). (7)
Reservation wages are given by:
φ = b− c(s∗) +λ(s∗)λ(s∗)′
c′(s∗) +f(loc)r + q
∫ ∞
φ(w − φ)dF (w). (8)
Unlike the case when locus of control operates through beliefs about the payoff to ad-ditional search effort (see equation (4)), here an individual’s locus of control affects hisor her optimal search level only through the effect that it has on his or her reservationwage φ. Reservation wages are higher the more internal an individual’s locus of control isbecause, for a given search effort s∗, the probability of receiving an acceptable job offer
7

is higher. This implies that – unlike the previous case – individuals with a more internallocus of control are expected to search less because their internal locus of control leads toa uniformly higher job offer arrival rate no matter how hard they search. Specifically, wefind that
∂φ
∂loc> 0 and
∂s∗
∂loc< 0. (9)
See Appendix B for details. The intuition behind the reservation wage result is the sameas before. For a given search effort, remaining unemployed and waiting for new job offershas a higher expected utility for individuals with a highly internal locus of control leadingthem to have a higher reservation wage. However, unlike the previous case, the effect ofsearch in increasing the rate at which job offers arrive is the same as for those with anexternal locus of control. This implies that the chances that a given search intensity willresult in an acceptable wage offer are lower for individuals with a highly internal locus ofcontrol because they receive job offers at the same rate, but their reservation wages arehigher. This leads to a lower optimal search intensity for them.8
Having a more internal locus of control has an ambiguous effect on the length of timean individual spends being unemployed irrespective how we model the link between locusof control and the returns to search effort. In particular, the expected unemploymentduration is given by Tu = 1/[λ(s∗)(1 − F (φ)]. Having a more internal locus of controlincreases the reservation wage in both models which tends to increase the duration ofunemployment. When locus of control is related to subjective beliefs about the payoffto search, individuals with a highly internal locus of control search more, which leads toa higher job arrival rate and decreases the time spent in unemployment. When locus ofcontrol is independent of search returns, those with an internal locus of control searchless, but have a higher probability of receiving a job offer conditional on their searchintensity. Neither model implies a clear prediction on the impact of the locus of control onunemployment duration. This underscores the importance of observing job search behaviordirectly.
3 The IZA Evaluation Data Set
The data come from the IZA Evaluation Data Set which targets a sample of individualsentering unemployment between June 2007 and May 2008. In particular, from the monthlyunemployment inflows of approximately 206,000 individuals identified in the administra-tive records, a nine percent random sample is selected for interview. These individualsconstitute the gross sample from which representative samples of approximately 1,450 in-dividuals are interviewed each month, so that after one year twelve monthly cohorts aregathered. These survey data are then matched to administrative employment records of
8The additive model and its implications are similar to the one presented by Fougere, Pradel, and Roger(2009). In their study the unemployed workers receive job offers via own search and via public employmentservice (PES), the latter is costless and independent of own search effort. They show that search effort isa decreasing function of the exogenous PES rate of job contacts, similar to our results with search beinga decreasing function of the locus of control.
8

the Public Employment Services.9 The IZA Evaluation Data Set is ideal for our purposesbecause individuals are interviewed shortly after they become unemployed and are askeda variety of non-standard questions about attitudes, expectations, and different person-ality traits including locus of control (see Caliendo et al., 2010, for details). Unlike otherresearchers, we are able to compare a large number of individuals with similar, short un-employment durations which reduces concerns about the potential for reverse causalityto affect the analysis. Moreover, access to administrative data on employment historiesincluding previous wages and time spent in employment allows us to carefully control fordifferences in human capital endowments which affect individuals’ reservation wages andthe likelihood of receiving a job offer.
We restrict our sample to individuals who are 16 to 54 years old, and who receive or areeligible to receive unemployment benefits.10 In wave 1, 17,396 interviews were completedwith individuals each of whom had begun an unemployment spell approximately twomonths earlier. We restrict our analysis to individuals who were still unemployed andactively searching for a job at the time of interview. That is, we exclude individuals whohad already found a job or were not searching for other reasons. We further exclude thoseindividuals whose reported hourly reservation wages and benefit levels were in the lowestor highest percentile of the distribution and who had missing values in key variables. Thisleaves us with an estimation sample of roughly 7,900 individuals.
3.1 Measuring Locus of Control
We measure an individual’s locus of control using his or her responses to ten separate itemsfrom the Rotter (1966) scale. Locus of control refers to a general expectation about internalversus external control of reinforcement (Rotter, 1966). People with a more external locusof control believe that much of what happens in life is beyond their control, while peoplewith an internal locus of control see life’s outcomes as dependent on their own decisions andbehavior. Psychologists argue that these beliefs are central to understanding a person’smotivation and the way that he or she makes decisions and sets goals. Those with anexternal locus of control are more likely to avoid situations in which they feel unable tocope, while those with an internal locus of control tend to set higher goals, persevere inchallenging situations, and be more likely to achieve successful outcomes (Strauser, Ketz,and Keim, 2002).
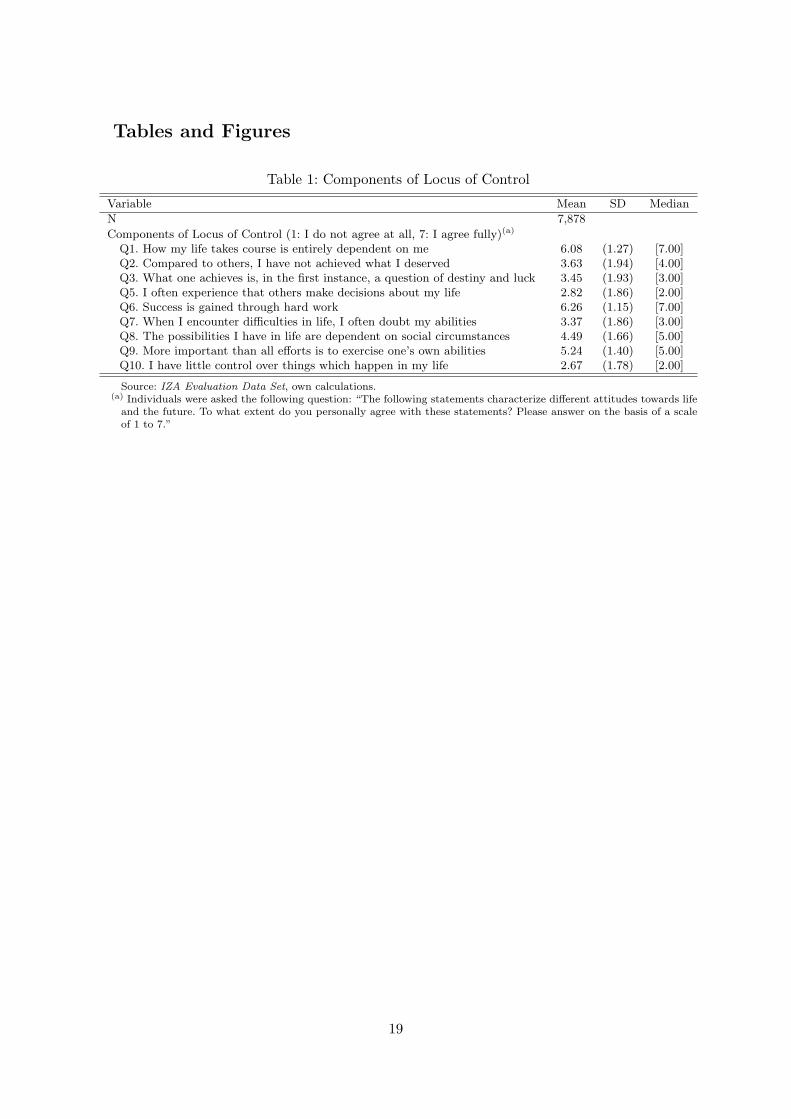
The ten separate items underlying the Rotter scale are summarized in Table 1. Foreach item respondents were asked to respond on a scale from ‘1: I do not agree at all’to ‘7: I fully agree’. As a first step in creating a measure of individuals’ locus of control,we used factor analysis to identify the number of common factors underlying our tenitems. Our factor analysis (see upper part of Figure 1) indicated that items 1, 6 and 9
9For those individuals who gave us their permission we are able to link the survey data with adminis-trative records based on the ‘Integrated Labour Market Biographies’ of the Public Employment Services,containing relevant register data from four sources: employment history, unemployment support recipience,participation in active labor market programs, and job seeker history.
10To generate a claim for unemployment benefits workers have to be employed for at least 12 months inthe last three years before entering unemployment.
9

load onto one factor (interpretable as ‘internal’), while items 2, 3, 5, 7, 8, and 10 loadonto another factor (interpretable as ‘external’). Item 4 did not load on to either factorand was discarded. We conducted a parallel factor analysis for a representative sampleof respondents in the German Socio-Economic Panel (SOEP, see lower part of Figure 1).We found that these ten items load onto two factors in exactly the same way in the twosamples indicating that our distinction between internal and external control is not specificto unemployed individuals, but rather is representative of the German population moregenerally. The presence of two common factors suggests that ‘internal’ and ‘external’ locusof control may represent two separate concepts. At the same time, our theoretical model isconsistent with the early psychological literature in conceptualizing internal and externallocus of control as being opposite ends of the same spectrum (see Rotter, 1966). Moreover,Rotter (1975) argues that factor analysis in and of itself is not useful in identifying whetherthe true structure of locus of control is uni- or multi-dimensional. Consequently, we followothers in the literature by constructing a continuous, uni-dimensional measure of locus ofcontrol with higher values corresponding to a more internal perspective and lower valuescorresponding to a more external perspective.11 We do this by reversing the order ofresponses to the six items loading onto the external factor, averaging responses to all nineitems, and then standardizing the result so that it has mean 0 and variance 1. Figure2 shows the distribution of the index. We use this index to then categorize individualsas being ‘internal’ whenenver they have index scores above the median and ‘external’whenever they have index scores below the median (Indicator 1).
Insert Table 1 about here
Insert Figures 1, 2 about here
Table 2 compares the demographic, human capital, and personality characteristics ofindividuals with an internal as opposed to external locus of control. Women, immigrants,married individuals, and older workers are significantly more likely than others to believethat much of what happens in life is outside their control. Having higher educationalattainment on the other hand is associated with a more internal locus of control. Inter-estingly, there also appears to be a relationship between personality traits and locus ofcontrol. Those with an internal locus of control report significantly higher levels of open-ness, conscientiousness, extraversion, and significantly lower levels of neuroticism. Thesedifferences imply that it will be important to carefully control for individual characteristicswhen evaluating the effects of locus of control on job search outcomes.
Insert Tables 2 about here
One of the advantages of the IZA Evaluation Data Set is that we have detailed in-formation about individuals’ previous labor market experiences making it apparent thatthose with an internal locus of control have somewhat more favorable employment histo-ries. Those with an internal locus of control, for example, are significantly less likely to
11Piatek and Pinger (2010) also extract a single factor when measuring locus of control in the SEOPdata.
10
have entered unemployment from employment (or subsidized employment) and are sig-nificantly more likely to have entered from education or other pathways. Since turning18, those with an internal locus of control have spent on average 0.68 months per year inunemployment, while those with an external locus of control have spent 0.87 months peryear being unemployed. Moreover, an internal locus of control is associated with signifi-cantly higher months in employment in the years before entering unemployment, higherpre-unemployment wages and therefore also higher unemployment benefits. These rela-tionships are consistent with previous evidence that having an internal locus of controlis correlated with labor market success (Andrisani, 1977, 1981; Osborne Groves, 2005;Semykina and Linz, 2007; Duncan and Dunifon, 1998). In terms of the intergenerationaltransmission of noncognitive skills, we see that having a father with A-level qualificationsor an employed father at age 15 is associated with a more internal locus of control. Finally,individuals with an internal locus of control are also significantly more likely to have accessto a number of communication modes including mobile phones, computers, the internet,and e-mail. This, along with their advantaged employment history, is expected to facilitatejob search.
Importantly, there are no significant differences across the two groups in either themonth of entry into the sample or in the period between entry and first interview whichis consistent with random sample selection.
3.2 Locus of Control and Job Search Behavior
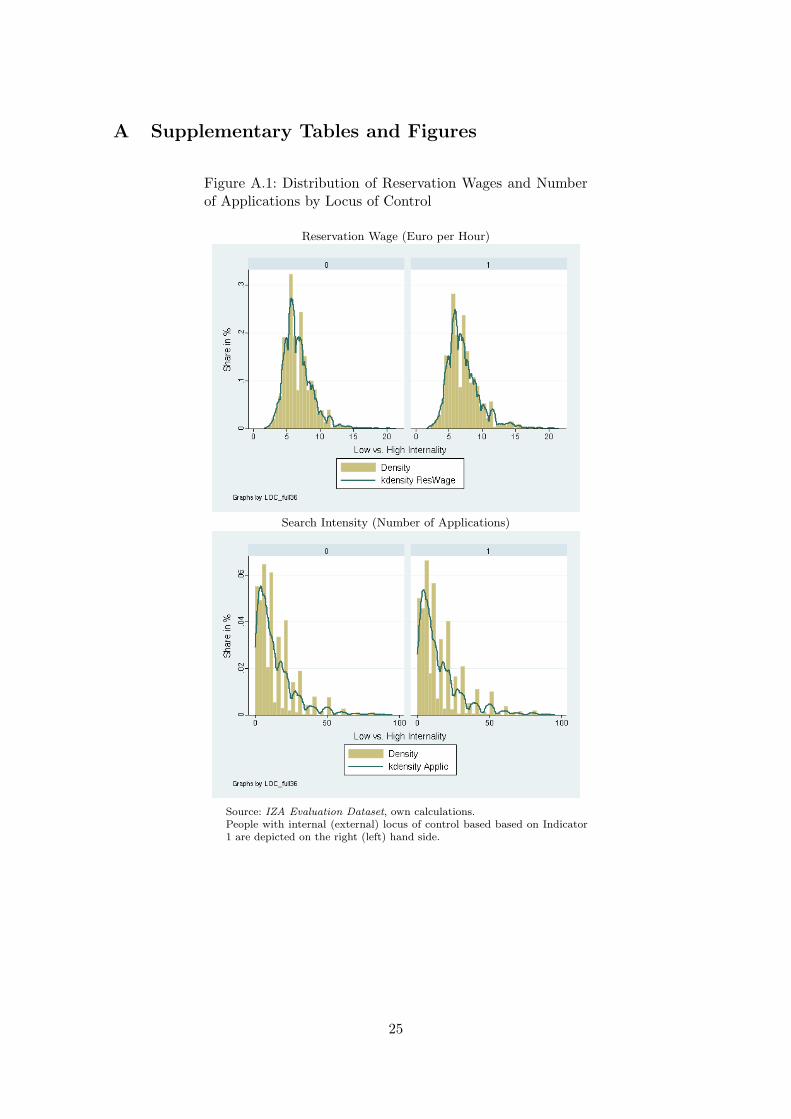
Table 3 provides information about the reservation wages and search strategies for individ-uals in our sample. The results indicate that people with an internal locus of control havehigher reservation wages and send out more job applications. In particular, those with aninternal locus of control report a reservation wage of e7.18/hour on average, while thosewith an external locus of control have a reservation wage that is on average e0.47 lower.Individuals who believe that much of what happens in life is under their own control searchmore intensively sending out nearly two (11 percent) additional applications on averagethan individuals who think that events are outside their control. The corresponding dis-tributions of the reservation wage and and the search intensity are reported in Figure A.1in the Appendix.
Insert Table 3 about here
Interestingly, individuals with an internal locus of control are more optimistic abouttheir chances of finding a job in the next period despite having higher reservation wages.Fully, 51 percent of those with an internal locus of control report that it is very likelythat they will take up a job within the next six months, while only 38 percent of thosewith an external locus of control report the same. This degree of optimism is perhapsnot surprising given that those with an internal locus of control also have more favorablejob histories and are less likely to be in a disadvantaged labor market group (i.e. women,migrants, low educated).
11

4 Estimation Approach and Results
Our interest is in understanding whether individuals’ beliefs about the extent to whichthey control life’s outcomes affect the way they search for jobs. We are particularly inter-ested in understanding whether any effect of locus of control operates through individuals’perceptions of the return to their own search efforts. Our strategy to address this issue istwofold: First, we directly analyze the effect of locus of control on individuals’ beliefs aboutthe probability of receiving an acceptable job offer. This allows us to assess whether thosewith an internal locus of control do in fact perceive a higher return to their job search in-vestments. Second, we formally test the empirical predictions of the two competing modelsdiscussed in Sections 2.2 and 2.3 using both OLS and propensity score matching methods.
4.1 The Probability of Receiving an Acceptable Wage Offer
Coleman and Deleire (2003) conclude that locus of control affects individuals’ educationdecisions primarily by altering their expectations regarding the return to investments inhuman capital. If a similar process operates here, we should expect to see a relationshipbetween a person’s locus of control and the return that he or she expects from greatersearch effort. We test this proposition by using probit regression to estimate the effect ofsearch intensity (as measured by the number of applications submitted) on the likelihoodthat an individual believes the probability that he or she will receive an acceptable job offeris ‘very high’.12 Our model includes controls for the number of applications submitted,an indicator for whether or not the individual has an internal locus of control, and theinteraction between them. This interaction term allows the relationship between searchintensity and the perceived pay off to job search (i.e. the probability of finding a job) todiffer between those with an internal locus of control and those without. In this model wecontrol for other personality traits like openness, extraversion and neuroticism as well asthe reservation wage.13
Insert Table 4 about here
The main results in Table 4 show that the effect of an additional application on thebelief that one is ‘very likely’ to receive a job offer is significantly higher amongst thosewith an internal locus of control.14 In particular, the marginal effect of each additionalapplication is 0.2 percentage points higher for those individuals with an internal locus ofcontrol than for those with an external locus of control. Our results are virtually identi-cal whether we use our continuous locus of control index (column 1) or whether we useinclude a simple dummy variable for being internal (column 2). As a robustness check,we also consider a more restrictive indicator of an internal locus of control. Specifically,only those individuals scoring high (above the median) on the three items underlying the
12Probit estimation on the probability that an individual believes getting a job is ‘likely’ or ‘very likely’and OLS estimation on all four response categories lead to very similar results.
13The model also includes controls for demographic characteristics, human capital endowments, andprevious employment histories.
14Full estimation results are available in Table A.1 in the Appendix.
12

internal factor and low (below the median) on the six items underlying the external factorare categorized as being ‘internal’ (Indicator 2). This categorization takes seriously thenotion that internal and external locus of control may be separate concepts and classi-fies individuals as being ‘internal’ only if they score high on the internal and low on theexternal factor. These individuals are then compared to those ‘external’ individuals whoscore low on the three internal items and high on the six external items.15 Using this morerestrictive measure, we find that the marginal effect of one additional application is 0.3percentage points higher for individuals who believe that future outcomes are determinedby their own actions (see column 3).
Having an internal locus of control therefore appears to be associated with the beliefthat there is a higher return (in terms of reemployment probabilities) to investments in jobsearch. This suggests that locus of control may influence economic decisions by affectingthe perceived returns to various sorts of investments. Individuals, however, simultaneouslychoose their search effort and their reservation wage both of which affect the expectedprobability of finding an acceptable job. Consequently, this analysis—while suggestive—does not allow us to test the different implications of the two models directly. We turn tothis issue below.16
4.2 Reservation Wages and Search Intensity
4.2.1 OLS Estimation
We begin by using OLS regression to estimate the effect of locus of control on bothreservation wages and the number of applications that each individual has submitted. Weconsider three specifications each of which corresponds to an alternative measure of locusof control. Table 5 summarizes the main OLS results, full estimation results are availablein Tables A.2 and A.3 in the Appendix.
Insert Table 5 about here
We find that reservation wages increase as individuals’ locus of control becomes moreinternal everything else equal (see upper part of Table 5). Specifically, a one standarddeviation increase in the extent to which an individual has an internal locus of control isassociated with a 1.6 percent increase in his or her reservation wage. The magnitude of thiseffect is consistent with McGee (2010) who finds that a one standard deviation increasein internality is associated with a 2.0 percent increase in young unemployed men’s firstreported reservation wage and with a 1.3 percent increase in reservation wages over all.On balance, individuals who are in the top half of the locus of control distribution havereservation wages that are 2.7 percent higher than their counterparts with an externallocus of control (see column 2). Results are similar when we consider our more restricted
15Individuals scoring either high or low on both the internal and external items are disregarded.16It is also interesting that, in models 1 and 2, the overall number of applications submitted is negatively
related to the probability that an individual believes finding a job is very likely. This seems to point tosome reverse causality highlighting the correlational nature of the estimates. Full results are available uponrequest.
13
definition of internal and external locus of control (see column 3). It is important to notethat all of these effects are highly significant and are net of a number of other variables(e.g. human capital characteristics, employment history, etc.) which serve to control fordisparity in individuals’ ability.
There is also evidence that individuals with a more internal locus of control also searchfor jobs more intensively (see lower part of Table 5). Each standard deviation increase inthe degree to which an individual sees life’s events as under his or her own control resultsin the submission of 0.15 additional job applications, while individuals in the top half ofthe locus of control distribution submit 0.54 more applications than do those in the bottomhalf of the distribution. Neither effect is statistically significant. However, when we focuson our more restricted locus of control measure, we find large differences in the searchintensity of those who are clearly internal relative to those who are clearly external intheir perspectives. Individuals scoring high on the internal factor and low on the externalfactor submit 2.30 applications more than their counterparts who score the reverse. Thisis an increase of 14.5 percent. In comparison, McGee (2010) estimates that a one standarddeviation increase in internality increases the hours of job search by more than 19 percent,but has no significant effect on the number of search methods utilized. This diversity ofresults across alternative measures of search intensity indicates that individuals’ locus ofcontrol may affect not only how intensively they search for new jobs, but also the waythey go about finding them.
4.2.2 Propensity Score Matching
In order to improve the efficiency and precision of our estimates we also use propensityscore matching (PSM) to assess the impact of the locus of control on job search behavior.The primary motivation for applying PSM in this context is to make internal and externalindividuals as comparable as possible in all other characteristics so that we can moredirectly compare differences in their search behavior.17
To this end, we use our two binary locus of control indicators to categorize individualsinto two groups – external and internal – based on their locus of control. We then estimatetwo separate logit models of the probability of being classified as ‘internal’ (see Table A.4in Appendix A). In order to isolate the effect of locus of control we need to include as manyrelevant variables in our model as possible. In addition to socio-demographic information,we also include human capital, personality characteristics and intergenerational variables(analogous to our OLS estimation in Tables A.2 and A.3). Based on these estimations wepredict the propensity scores (i.e. the probability of having an internal locus of control)and use these scores in the subsequent matching process. Figure A.2 shows the distributionof the propensity scores in the different groups. For example, the first graph shows thepropensity score distribution when ‘internal’ is defined as being above the median of thecontinuous locus of control distribution, while the second graph shows the distributionwhen ‘internal’ is defined to have a high score on the three items underlying the internalfactor and a low score on the six items underlying the external factor. Individuals who are
17See Caliendo and Kopeinig (2008) or Imbens and Wooldridge (2009) for more details on the method.
14
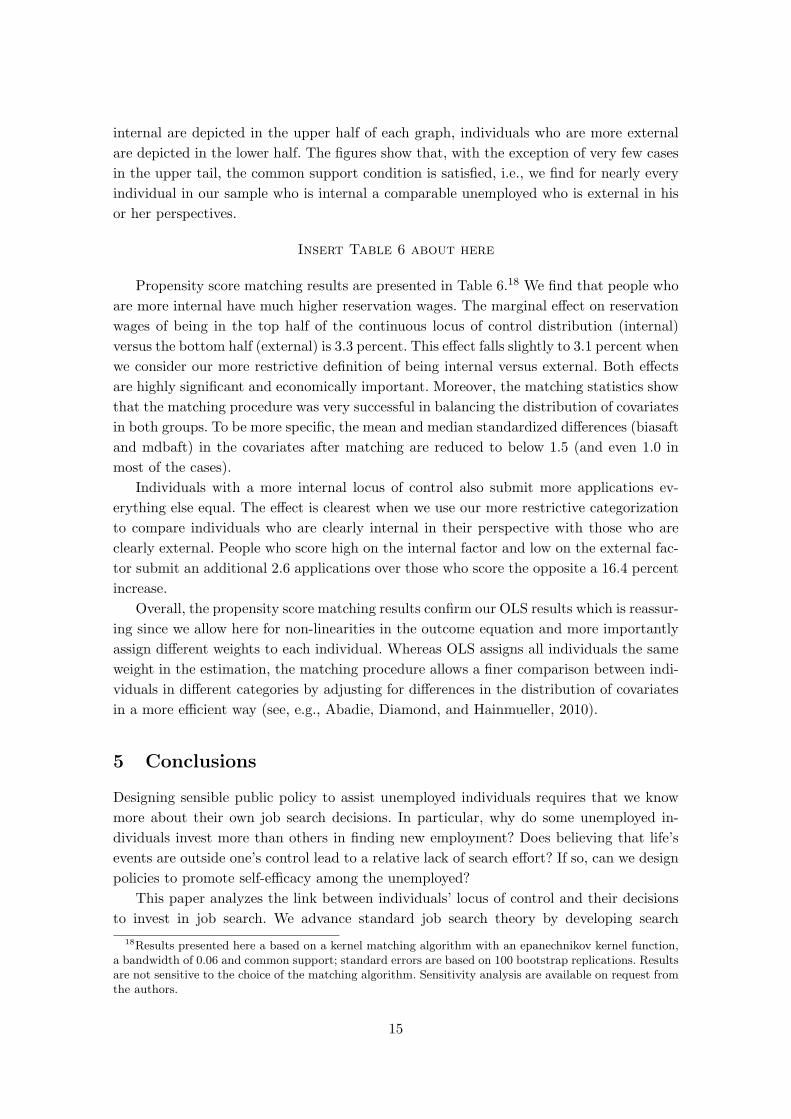
internal are depicted in the upper half of each graph, individuals who are more externalare depicted in the lower half. The figures show that, with the exception of very few casesin the upper tail, the common support condition is satisfied, i.e., we find for nearly everyindividual in our sample who is internal a comparable unemployed who is external in hisor her perspectives.
Insert Table 6 about here
Propensity score matching results are presented in Table 6.18 We find that people whoare more internal have much higher reservation wages. The marginal effect on reservationwages of being in the top half of the continuous locus of control distribution (internal)versus the bottom half (external) is 3.3 percent. This effect falls slightly to 3.1 percent whenwe consider our more restrictive definition of being internal versus external. Both effectsare highly significant and economically important. Moreover, the matching statistics showthat the matching procedure was very successful in balancing the distribution of covariatesin both groups. To be more specific, the mean and median standardized differences (biasaftand mdbaft) in the covariates after matching are reduced to below 1.5 (and even 1.0 inmost of the cases).
Individuals with a more internal locus of control also submit more applications ev-erything else equal. The effect is clearest when we use our more restrictive categorizationto compare individuals who are clearly internal in their perspective with those who areclearly external. People who score high on the internal factor and low on the external fac-tor submit an additional 2.6 applications over those who score the opposite a 16.4 percentincrease.
Overall, the propensity score matching results confirm our OLS results which is reassur-ing since we allow here for non-linearities in the outcome equation and more importantlyassign different weights to each individual. Whereas OLS assigns all individuals the sameweight in the estimation, the matching procedure allows a finer comparison between indi-viduals in different categories by adjusting for differences in the distribution of covariatesin a more efficient way (see, e.g., Abadie, Diamond, and Hainmueller, 2010).
5 Conclusions
Designing sensible public policy to assist unemployed individuals requires that we knowmore about their own job search decisions. In particular, why do some unemployed in-dividuals invest more than others in finding new employment? Does believing that life’sevents are outside one’s control lead to a relative lack of search effort? If so, can we designpolicies to promote self-efficacy among the unemployed?
This paper analyzes the link between individuals’ locus of control and their decisionsto invest in job search. We advance standard job search theory by developing search
18Results presented here a based on a kernel matching algorithm with an epanechnikov kernel function,a bandwidth of 0.06 and common support; standard errors are based on 100 bootstrap replications. Resultsare not sensitive to the choice of the matching algorithm. Sensitivity analysis are available on request fromthe authors.
15

models which incorporate individuals’ subjective beliefs about the effect of their job searcheffort on the job offer arrival rate. These subjective beliefs depend on individuals’ locus ofcontrol, i.e., the extent to which they believe that their actions affect future outcomes. Weempirically estimate the impact of locus of control on job search behavior using novel linkedsurvey and administrative data for a large sample of newly-unemployed Germans. We findthat having an internal locus of control is associated with the belief that investments injob search have a higher payoff in terms of reemployment probabilities. Moreover, thosewho believe that they have control over what happens in their lives set higher reservationwages and search more intensively than those who feel little control over their lives. Takentogether, these results are consistent with a model of job search in which locus of controlaffects offer arrival rates through individuals’ subjective beliefs about the payoffs to jobsearch. They cannot be explained by a model in which an internal locus of control simplyincreases the probability of receiving a job offer no matter how hard an individual searches.
These results advance our understanding of the role that individuals’ self-efficacy playsin human capital investments generally, and job search in particular. At the same time,there are a number of issues yet to be resolved. In particular, while we have argued thatlocus of control affects search behavior through its effect on individuals’ subjective beliefsabout the returns to search investments, we cannot rule out the possibility that locus ofcontrol instead operates by altering the productivity of search itself. Those with an internallocus of control may simply be able to generate more job offers at every level of search. Ourtheoretical framework is certainly consistent with this alternative explanation, however,our estimates of the link between individuals’ locus of control and their expectations aboutfinding an acceptable job offer certainly suggest that beliefs about the returns to searchare important. Moreover, if locus of control operates through search productivity, ratherthan through the perceived returns to search, our modeling exercise makes it clear thatthis cannot occur in a simple linear way.
There is a need for additional empirical research which estimates these relationshipsfor different labor market groups across a number of countries so that we can begin tounderstand how the institutional arrangements underpinning the unemployment benefitssystem might interact with individuals’ sense of self-efficacy in driving job search. Finally,it would be useful to incorporate locus of control into dynamic models of the job searchprocess. This would allow us to begin to understand the way that individuals’ self-efficacyevolves over time in response to labor market events.
16

References
Abadie, A., A. Diamond, and J. Hainmueller (2010): “Synthetic Control Methodsfor Comparative Case Studies: Estimating the Effect of California’s Tobacco ControlProgram,” Journal of the American Statistical Association, 105, 493–505.
Andrisani, P. J. (1977): “Inter-External Attitudes, Personal Initiative, and the LaborMarket Experience of Black and White Men,” Journal of Human Resources, 12, 308–328.
(1981): “Internal-External Attitudes, Personal Initiative, And The Labor MarketExperience: A Reply To Duncan and Morgan,” Journal of Human Resources, 16, 658–666.
Anger, S., and G. Heineck (2010): “The returns to cognitive abilities and personalitytraits in Germany,” Labour Economics, 13, 535–546.
Cahuc, P., and A. Zylberberg (2004): Labor Economics. MIT Press, Cambridge, Lon-don.
Caliendo, M., A. Falk, L. Kaiser, H. Schneider, A. Uhlendorff, G. Van denBerg, and K.F. Zimmermann (2010): “The IZA Evaluation Dataset,” Working Paper,IZA, Bonn.
Caliendo, M., and S. Kopeinig (2008): “Some Practical Guidance for the Implemen-tation of Propensity Score Matching,” Journal of Economic Surveys, 22(1), 31–72.
Cebi, M. (2007): “Locus of Control and Human Capital Investment Revisited,” Journalof Human Resources, 42, 919–932.
Coleman, M., and T. Deleire (2003): “An Economic Model of Locus of Control andthe Human Capital Investment Decision,” Journal of Human Resources, 38, 701–721.
DellaVigna, S., and M. D. Paserman (2005): “Job Search and Impatience,” Journalof Labor Economics, 23(1), 527–588.
Duncan, G. J., and R. Dunifon (1998): “”Soft-Skills” and Long-Run Labor MarketSuccess,” Research in Labor Economics, 17, 123–149.
Duncan, G. J., and J. N. Morgan (1981): “Sense of Efficacy and Subsequent Changein Earnings - A Replication,” Journal of Human Resources, 16, 649–657.
Eckstein, Z., and G. J. van den Berg (2007): “Empirical labor search: A survey,”Journal of Econometrics, 136, 531–564.
Fougere, D., J. Pradel, and M. Roger (2009): “Does the public employment serviceaffect search effort and outcomes?,” European Economic Review, 53, 846–869.
Gallo, W. T., J. Endrass, E. H. Bradley, D. Hell, and S. V. Kasl (2003):“The Influence of Internal Control on the Employment Status of German Workers,”Schmollers Jahrbuch, 123, 71–82.
Hansemark, O. C. (2003): “Need for Achievement, Locus of Control and the Predictionof Business Start-Ups: A Longitudinal Study,” Journal of Economic Psychology, 24,301–319.
Heckman, J. J., J. Stixrud, and S. Urzua (2006): “The Effects of Cognitive andNoncognitive Abilities on Labor Market Outcomes and Social Behavior,” Journal ofLabor Economics, 24, 411–482.
17
Imbens, G., and J. M. Wooldridge (2009): “Recent Developments in the Econometricsof Program Evaluation,” Journal of Economic Literature, 47(1), 5–86.
McGee, A. (2010): “How the Perception of Control Influences Unemployed Job Search,”Working Paper.
Mortensen, D. T., and C. A. Pissarides (1999): “New develpoments in models ofsearch in the labor market,” in Handbook of Labor Economics, Vol. 3b, ed. by O. Ashen-felter, and D. Card, pp. 2567–2627. Elsevier, Amsterdam.
Osborne Groves, M. (2005): “How important is your personality? Labor market returnsto personality for women in the US and UK,” Journal of Economic Psychology, 26, 827–841.
Piatek, R., and P. Pinger (2010): “Maintaining (locus of) Control? Assessing thestability and impact of noncognitive skills over the life-cycle,” IZA Discussion Paper,5289.
Rotter, J. (1966): “Generalized Expectancies for Internal Versus External Control ofReinforcement,” Psychological Monographs, 80.
(1975): “Some problems and Misconceptions Related to the Construct of In-ternal Versus External Control of Reinforcement,” Journal of Consulting and ClinicalPsychology, 43(1), 56–67.
Semykina, A., and S. J. Linz (2007): “Gender Differences in Personality and Earnings:Evidence from Russia,” Journal of Economic Psychology, 28, 387–410.
Strauser, D., K. Ketz, and J. Keim (2002): “The relationship between self-efficacy,locus of control and work personality,” Journal of Rehabilitation, 68(1), 20–26.
Uhlendorff, A. (2004): “Der Einfluss von Personlichkeitseigenschaften und sozialenRessourcen auf die Arbeitslosigkeitsdauer,” Kolner Zeitschrift fur Soziologie undSozialpsychologie, 56, 279–303.
van den Berg, G. J., and B. van der Klaauw (2006): “Counseling and Monitoringof Unemployed Workers: Theory and Evidence form a controlled Social Experiment,”International Economic Review, 47(3), 895–936.
18
Tables and Figures
Table 1: Components of Locus of Control
Variable Mean SD Median
N 7,878
Components of Locus of Control (1: I do not agree at all, 7: I agree fully)(a)
Q1. How my life takes course is entirely dependent on me 6.08 (1.27) [7.00]Q2. Compared to others, I have not achieved what I deserved 3.63 (1.94) [4.00]Q3. What one achieves is, in the first instance, a question of destiny and luck 3.45 (1.93) [3.00]Q5. I often experience that others make decisions about my life 2.82 (1.86) [2.00]Q6. Success is gained through hard work 6.26 (1.15) [7.00]Q7. When I encounter difficulties in life, I often doubt my abilities 3.37 (1.86) [3.00]Q8. The possibilities I have in life are dependent on social circumstances 4.49 (1.66) [5.00]Q9. More important than all efforts is to exercise one’s own abilities 5.24 (1.40) [5.00]Q10. I have little control over things which happen in my life 2.67 (1.78) [2.00]
Source: IZA Evaluation Data Set, own calculations.(a) Individuals were asked the following question: “The following statements characterize different attitudes towards life
and the future. To what extent do you personally agree with these statements? Please answer on the basis of a scaleof 1 to 7.”
19
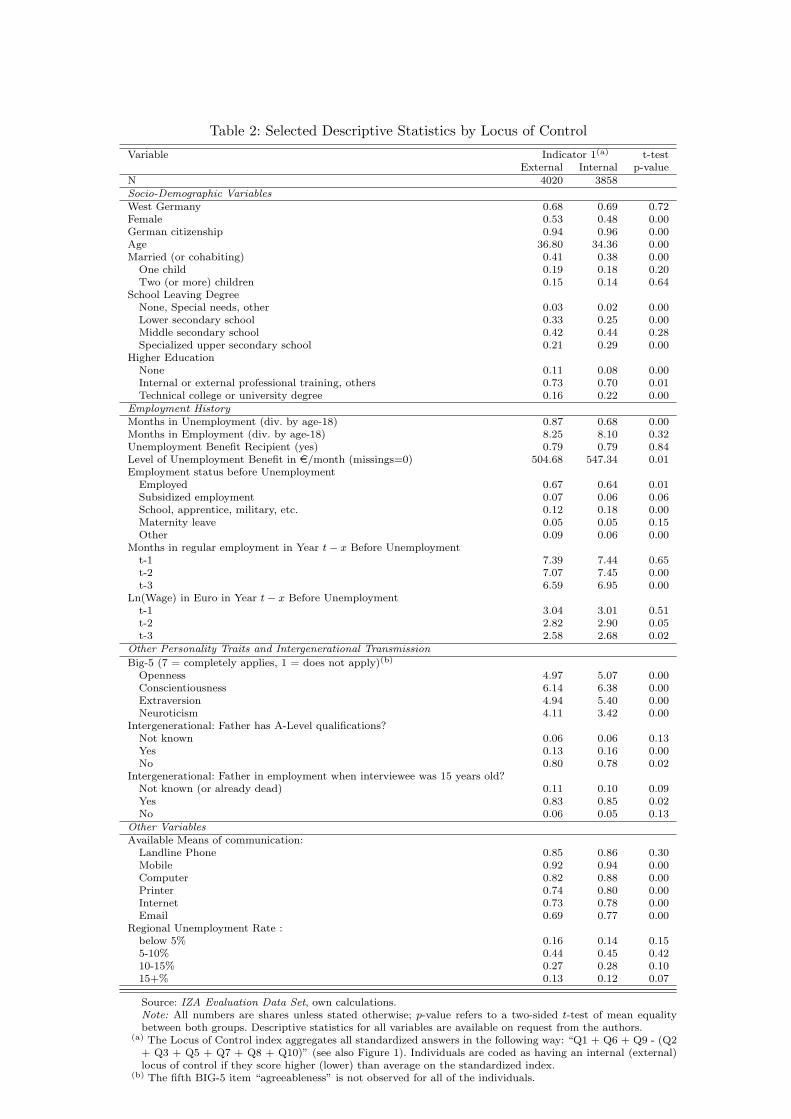
Table 2: Selected Descriptive Statistics by Locus of Control
Variable Indicator 1(a) t-testExternal Internal p-value
N 4020 3858Socio-Demographic VariablesWest Germany 0.68 0.69 0.72Female 0.53 0.48 0.00German citizenship 0.94 0.96 0.00Age 36.80 34.36 0.00Married (or cohabiting) 0.41 0.38 0.00
One child 0.19 0.18 0.20Two (or more) children 0.15 0.14 0.64
School Leaving DegreeNone, Special needs, other 0.03 0.02 0.00Lower secondary school 0.33 0.25 0.00Middle secondary school 0.42 0.44 0.28Specialized upper secondary school 0.21 0.29 0.00
Higher EducationNone 0.11 0.08 0.00Internal or external professional training, others 0.73 0.70 0.01Technical college or university degree 0.16 0.22 0.00
Employment HistoryMonths in Unemployment (div. by age-18) 0.87 0.68 0.00Months in Employment (div. by age-18) 8.25 8.10 0.32Unemployment Benefit Recipient (yes) 0.79 0.79 0.84Level of Unemployment Benefit in e/month (missings=0) 504.68 547.34 0.01Employment status before Unemployment
Employed 0.67 0.64 0.01Subsidized employment 0.07 0.06 0.06School, apprentice, military, etc. 0.12 0.18 0.00Maternity leave 0.05 0.05 0.15Other 0.09 0.06 0.00
Months in regular employment in Year t − x Before Unemploymentt-1 7.39 7.44 0.65t-2 7.07 7.45 0.00t-3 6.59 6.95 0.00
Ln(Wage) in Euro in Year t − x Before Unemploymentt-1 3.04 3.01 0.51t-2 2.82 2.90 0.05t-3 2.58 2.68 0.02
Other Personality Traits and Intergenerational Transmission
Big-5 (7 = completely applies, 1 = does not apply)(b)
Openness 4.97 5.07 0.00Conscientiousness 6.14 6.38 0.00Extraversion 4.94 5.40 0.00Neuroticism 4.11 3.42 0.00
Intergenerational: Father has A-Level qualifications?Not known 0.06 0.06 0.13Yes 0.13 0.16 0.00No 0.80 0.78 0.02
Intergenerational: Father in employment when interviewee was 15 years old?Not known (or already dead) 0.11 0.10 0.09Yes 0.83 0.85 0.02No 0.06 0.05 0.13
Other VariablesAvailable Means of communication:
Landline Phone 0.85 0.86 0.30Mobile 0.92 0.94 0.00Computer 0.82 0.88 0.00Printer 0.74 0.80 0.00Internet 0.73 0.78 0.00Email 0.69 0.77 0.00
Regional Unemployment Rate :below 5% 0.16 0.14 0.155-10% 0.44 0.45 0.4210-15% 0.27 0.28 0.1015+% 0.13 0.12 0.07
Source: IZA Evaluation Data Set, own calculations.Note: All numbers are shares unless stated otherwise; p-value refers to a two-sided t-test of mean equalitybetween both groups. Descriptive statistics for all variables are available on request from the authors.
(a) The Locus of Control index aggregates all standardized answers in the following way: “Q1 + Q6 + Q9 - (Q2+ Q3 + Q5 + Q7 + Q8 + Q10)” (see also Figure 1). Individuals are coded as having an internal (external)locus of control if they score higher (lower) than average on the standardized index.
(b) The fifth BIG-5 item “agreeableness” is not observed for all of the individuals.

Table 3: Job Search Behavior by Locus of Control
Variable Indicator 1 t-testExternal Internal p-value
N 4,020 3,858Hourly Reservation Wage (in Euro) 6.71 7.18 0.00Log(Reservation Wage) 1.86 1.92 0.00Number of Own Applications (Mean) 14.91 16.80 0.00
0 0.05 0.04 0.001-4 0.20 0.19 0.095-9 0.21 0.21 0.8810-19 0.25 0.24 0.5920-29 0.14 0.15 0.3130+ 0.13 0.17 0.00
Expected probability of finding a job in the next 6 month
(1=very probable, 4=very improbable)(a) 1.78 1.57 0.00very probable 0.38 0.51 0.00probable 0.38 0.30 0.00improbable 0.11 0.06 0.00very improbable 0.04 0.03 0.10
Source: IZA Evaluation Data Set, own calculations.Note: All numbers are shares unless stated otherwise; p-value refers to a two-sided t-test of meanequality between both groups.
(a) This information is observed for 3,622 individuals with external locus of control and 3,468 indi-viduals with internal locus of control.
Table 4: Probit Estimation Results: Probability of Finding a Job is VeryHigh (Marginal Effects)
(1) (2) (3)
Number of Own Applications -.002∗∗∗ -.002∗∗∗ -.002∗∗∗
Log(Reservation wage) 0.077∗∗∗ 0.079∗∗∗ 0.095∗∗∗
Number of Own Applications x LOC 0.002∗∗∗ 0.002∗∗∗
Number of Own Applications x Interaction 0.003∗∗∗
Locus of Control (Standardized) 0.047∗∗∗
LOC: Indicator 1 (Dummy, 1 = High) 0.08∗∗∗
LOC: Indicator 2 (High Internal and Low External)(c) 0.112∗∗∗
Including Control Variables(a) Yes Yes Yes
Including Personality Traitsb) Yes Yes Yes
Including Variables potentially determined by LOC (c) Yes Yes Yes
Obs. 7,090 7,090 3,268Pseudo R-2 0.089 0.088 0.108log-Likelihood -4475.54 -4482.74 -2015.43
Note: ∗ ∗ ∗/ ∗ ∗/∗ indicate significance at the 1%/5%/10%-level. Indices are standardized inthe following way: Indexst
i = (Indexi − Mean(Index))/SD(Index).(a) Full estimation results are available in Table A.1 in the Appendix.(b) Openness, Conscientiousness, Extraversion, Neuroticism.(c) Previous Employment Outcomes and Educational Attainment(d) Dummy variable for individuals with High Internal LOC (loc-int 50+) and Low External
LOC (loc-ext6 50-)
21
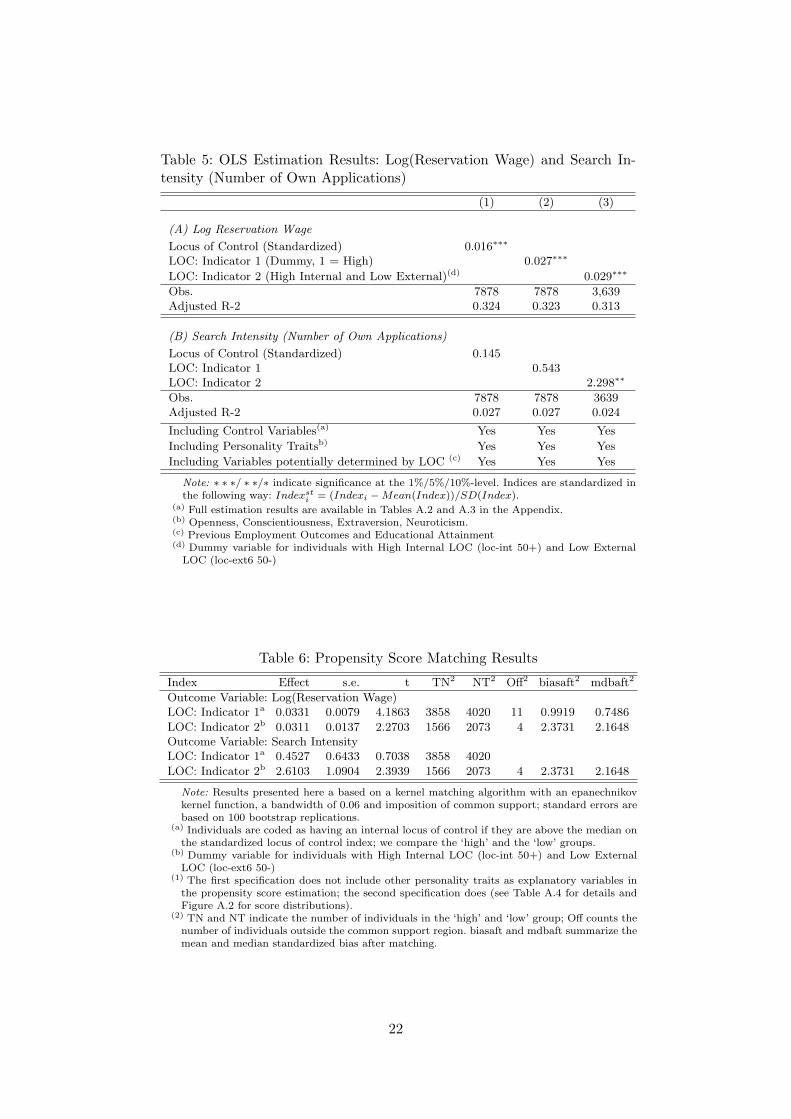
Table 5: OLS Estimation Results: Log(Reservation Wage) and Search In-tensity (Number of Own Applications)
(1) (2) (3)
(A) Log Reservation Wage
Locus of Control (Standardized) 0.016∗∗∗
LOC: Indicator 1 (Dummy, 1 = High) 0.027∗∗∗
LOC: Indicator 2 (High Internal and Low External)(d) 0.029∗∗∗
Obs. 7878 7878 3,639Adjusted R-2 0.324 0.323 0.313
(B) Search Intensity (Number of Own Applications)
Locus of Control (Standardized) 0.145LOC: Indicator 1 0.543LOC: Indicator 2 2.298∗∗
Obs. 7878 7878 3639Adjusted R-2 0.027 0.027 0.024
Including Control Variables(a) Yes Yes Yes
Including Personality Traitsb) Yes Yes Yes
Including Variables potentially determined by LOC (c) Yes Yes Yes
Note: ∗ ∗ ∗/ ∗ ∗/∗ indicate significance at the 1%/5%/10%-level. Indices are standardized inthe following way: Indexst
i = (Indexi − Mean(Index))/SD(Index).(a) Full estimation results are available in Tables A.2 and A.3 in the Appendix.(b) Openness, Conscientiousness, Extraversion, Neuroticism.(c) Previous Employment Outcomes and Educational Attainment(d) Dummy variable for individuals with High Internal LOC (loc-int 50+) and Low External
LOC (loc-ext6 50-)
Table 6: Propensity Score Matching Results
Index Effect s.e. t TN2 NT2 Off2 biasaft2 mdbaft2
Outcome Variable: Log(Reservation Wage)LOC: Indicator 1a 0.0331 0.0079 4.1863 3858 4020 11 0.9919 0.7486
LOC: Indicator 2b 0.0311 0.0137 2.2703 1566 2073 4 2.3731 2.1648Outcome Variable: Search IntensityLOC: Indicator 1a 0.4527 0.6433 0.7038 3858 4020
LOC: Indicator 2b 2.6103 1.0904 2.3939 1566 2073 4 2.3731 2.1648
Note: Results presented here a based on a kernel matching algorithm with an epanechnikovkernel function, a bandwidth of 0.06 and imposition of common support; standard errors arebased on 100 bootstrap replications.
(a) Individuals are coded as having an internal locus of control if they are above the median onthe standardized locus of control index; we compare the ‘high’ and the ‘low’ groups.
(b) Dummy variable for individuals with High Internal LOC (loc-int 50+) and Low ExternalLOC (loc-ext6 50-)
(1) The first specification does not include other personality traits as explanatory variables inthe propensity score estimation; the second specification does (see Table A.4 for details andFigure A.2 for score distributions).
(2) TN and NT indicate the number of individuals in the ‘high’ and ‘low’ group; Off counts thenumber of individuals outside the common support region. biasaft and mdbaft summarize themean and median standardized bias after matching.
22

Figure 1: Factor Loadings of the LOC Variables
Our Sample
Representative Population Sample (SOEP)
Note: Factor 1 is interpreted as ‘External Locus of Control’;Factor 2 as ‘Internal Locus of Control’.
(a) The ‘Internal Index’ aggregates the standardized answers inthe following way: “Q1 + Q6 + Q9”.
(b) The ‘External Index’ aggregates the standardized answers inthe following way: “Q2 + Q3 + Q5 + Q7 + Q8 + Q10”.
(c) Finally, the ‘Full Index’ aggregates all standardized answersin the following way: “Q1 + Q6 + Q9 - (Q2 + Q3 + Q5 + Q7+ Q8 + Q10)”.
23

Figure 2: Distribution of the Locus of Control Indices
Note: See Figure 1 for a definition of the index.
24
A Supplementary Tables and Figures
Figure A.1: Distribution of Reservation Wages and Numberof Applications by Locus of Control
Reservation Wage (Euro per Hour)
Search Intensity (Number of Applications)
Source: IZA Evaluation Dataset, own calculations.People with internal (external) locus of control based based on Indicator1 are depicted on the right (left) hand side.
25

Figure A.2: Propensity Score DistributionFull Index (High vs. Low)
Interaction (High Internal and Low External)
Note:
26
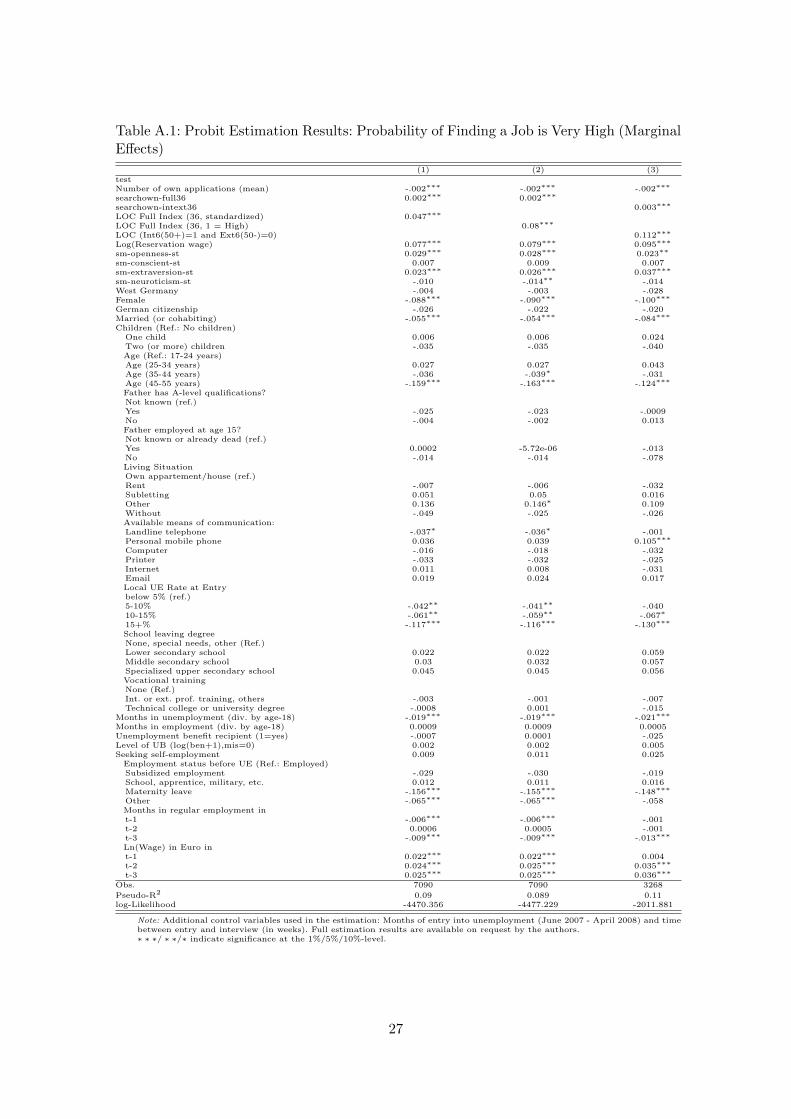
Table A.1: Probit Estimation Results: Probability of Finding a Job is Very High (MarginalEffects)
(1) (2) (3)testNumber of own applications (mean) -.002∗∗∗ -.002∗∗∗ -.002∗∗∗
searchown-full36 0.002∗∗∗ 0.002∗∗∗
searchown-intext36 0.003∗∗∗
LOC Full Index (36, standardized) 0.047∗∗∗
LOC Full Index (36, 1 = High) 0.08∗∗∗
LOC (Int6(50+)=1 and Ext6(50-)=0) 0.112∗∗∗
Log(Reservation wage) 0.077∗∗∗ 0.079∗∗∗ 0.095∗∗∗
sm-openness-st 0.029∗∗∗ 0.028∗∗∗ 0.023∗∗
sm-conscient-st 0.007 0.009 0.007sm-extraversion-st 0.023∗∗∗ 0.026∗∗∗ 0.037∗∗∗
sm-neuroticism-st -.010 -.014∗∗ -.014West Germany -.004 -.003 -.028Female -.088∗∗∗ -.090∗∗∗ -.100∗∗∗
German citizenship -.026 -.022 -.020Married (or cohabiting) -.055∗∗∗ -.054∗∗∗ -.084∗∗∗
Children (Ref.: No children)One child 0.006 0.006 0.024Two (or more) children -.035 -.035 -.040Age (Ref.: 17-24 years)Age (25-34 years) 0.027 0.027 0.043Age (35-44 years) -.036 -.039∗ -.031Age (45-55 years) -.159∗∗∗ -.163∗∗∗ -.124∗∗∗
Father has A-level qualifications?Not known (ref.)Yes -.025 -.023 -.0009No -.004 -.002 0.013Father employed at age 15?Not known or already dead (ref.)Yes 0.0002 -5.72e-06 -.013No -.014 -.014 -.078Living SituationOwn appartement/house (ref.)Rent -.007 -.006 -.032Subletting 0.051 0.05 0.016Other 0.136 0.146∗ 0.109Without -.049 -.025 -.026Available means of communication:Landline telephone -.037∗ -.036∗ -.001Personal mobile phone 0.036 0.039 0.105∗∗∗
Computer -.016 -.018 -.032Printer -.033 -.032 -.025Internet 0.011 0.008 -.031Email 0.019 0.024 0.017Local UE Rate at Entrybelow 5% (ref.)5-10% -.042∗∗ -.041∗∗ -.04010-15% -.061∗∗ -.059∗∗ -.067∗
15+% -.117∗∗∗ -.116∗∗∗ -.130∗∗∗
School leaving degreeNone, special needs, other (Ref.)Lower secondary school 0.022 0.022 0.059Middle secondary school 0.03 0.032 0.057Specialized upper secondary school 0.045 0.045 0.056Vocational trainingNone (Ref.)Int. or ext. prof. training, others -.003 -.001 -.007Technical college or university degree -.0008 0.001 -.015
Months in unemployment (div. by age-18) -.019∗∗∗ -.019∗∗∗ -.021∗∗∗
Months in employment (div. by age-18) 0.0009 0.0009 0.0005Unemployment benefit recipient (1=yes) -.0007 0.0001 -.025Level of UB (log(ben+1),mis=0) 0.002 0.002 0.005Seeking self-employment 0.009 0.011 0.025
Employment status before UE (Ref.: Employed)Subsidized employment -.029 -.030 -.019School, apprentice, military, etc. 0.012 0.011 0.016Maternity leave -.156∗∗∗ -.155∗∗∗ -.148∗∗∗
Other -.065∗∗∗ -.065∗∗∗ -.058Months in regular employment int-1 -.006∗∗∗ -.006∗∗∗ -.001t-2 0.0006 0.0005 -.001t-3 -.009∗∗∗ -.009∗∗∗ -.013∗∗∗
Ln(Wage) in Euro int-1 0.022∗∗∗ 0.022∗∗∗ 0.004t-2 0.024∗∗∗ 0.025∗∗∗ 0.035∗∗∗
t-3 0.025∗∗∗ 0.025∗∗∗ 0.036∗∗∗
Obs. 7090 7090 3268
Pseudo-R2 0.09 0.089 0.11log-Likelihood -4470.356 -4477.229 -2011.881
Note: Additional control variables used in the estimation: Months of entry into unemployment (June 2007 - April 2008) and timebetween entry and interview (in weeks). Full estimation results are available on request by the authors.∗ ∗ ∗/ ∗ ∗/∗ indicate significance at the 1%/5%/10%-level.
27

Table A.2: OLS Estimation Results: Log(Reservation Wage)(1) (2) (3)
LOC Full Index (36, standardized) 0.016∗∗∗
LOC Full Index (36, 1 = High) 0.027∗∗∗
LOC (Int6(50+)=1 and Ext6(50-)=0) 0.029∗∗∗
sm-openness-st 0.017∗∗∗ 0.017∗∗∗ 0.011∗∗
sm-conscient-st -.0009 -.0004 0.0008sm-extraversion-st 0.005 0.006 0.009sm-neuroticism-st -.013∗∗∗ -.014∗∗∗ -.011∗∗
West Germany 0.131∗∗∗ 0.132∗∗∗ 0.143∗∗∗
Female -.103∗∗∗ -.104∗∗∗ -.118∗∗∗
German citizenship -.014 -.012 0.0002Married (or cohabiting) -.003 -.002 0.005Children (Ref.: No children)
One child 0.03∗∗∗ 0.031∗∗∗ 0.024∗∗
Two (or more) children 0.069∗∗∗ 0.069∗∗∗ 0.065∗∗∗
Age (Ref.: 17-24 years)Age (25-34 years) 0.085∗∗∗ 0.085∗∗∗ 0.072∗∗∗
Age (35-44 years) 0.133∗∗∗ 0.132∗∗∗ 0.126∗∗∗
Age (45-55 years) 0.145∗∗∗ 0.144∗∗∗ 0.128∗∗∗
Father has A-level qualifications?Not known (ref.)Yes 0.033∗∗ 0.033∗∗ 0.025No -.0009 -.0003 -.018Father employed at age 15?Not known or already dead (ref.)Yes 0.007 0.006 0.003No 0.018 0.018 -.018Living SituationOwn appartement/house (ref.)Rent -.008 -.007 -.005Subletting -.033∗∗ -.033∗∗ -.020Other 0.001 0.003 -.041Without 0.02 0.026 -.009Available means of communication:Landline telephone -.025∗∗ -.024∗∗ -.033∗∗
Personal mobile phone 0.03∗∗ 0.031∗∗∗ 0.036∗∗
Computer -.004 -.005 -.014Printer -.003 -.002 -.001Internet 0.022 0.021 0.021Email 0.028∗∗ 0.029∗∗ 0.034∗
Local UE Rate at Entrybelow 5% (ref.)5-10% -.028∗∗∗ -.028∗∗∗ -.033∗∗
10-15% -.036∗∗∗ -.036∗∗∗ -.046∗∗
15+% -.032∗∗ -.032∗∗ -.029School leaving degreeNone, special needs, other (Ref.)Lower secondary school 0.037∗ 0.037∗ 0.003Middle secondary school 0.045∗∗ 0.045∗∗ 0.037Specialized upper secondary school 0.125∗∗∗ 0.125∗∗∗ 0.099∗∗∗
Vocational trainingNone (Ref.)Int. or ext. prof. training, others 0.072∗∗∗ 0.073∗∗∗ 0.069∗∗∗
Technical college or university degree 0.217∗∗∗ 0.218∗∗∗ 0.22∗∗∗
Months in unemployment (div. by age-18) -.015∗∗∗ -.015∗∗∗ -.011∗∗∗
Months in employment (div. by age-18) 0.0003 0.0003 0.0004Unemployment benefit recipient (1=yes) -.068∗∗∗ -.068∗∗∗ -.056∗∗
Level of UB (log(ben+1),mis=0) 0.01∗∗∗ 0.01∗∗∗ 0.008∗∗
Seeking self-employment 0.039∗∗∗ 0.04∗∗∗ 0.044∗∗
School, apprentice, military, etc. -.008 -.008 -.026Maternity leave 0.039∗∗ 0.04∗∗ 0.051∗∗
Other 0.018 0.018 0.015Months in regular employment int-1 -.005∗∗∗ -.005∗∗∗ -.005∗∗∗
t-2 -.0001 -.0002 0.002t-3 -.0005 -.0005 -.0002Ln(Wage) in Euro int-1 0.017∗∗∗ 0.017∗∗∗ 0.021∗∗∗
t-2 0.016∗∗∗ 0.016∗∗∗ 0.013∗∗∗
t-3 0.014∗∗∗ 0.014∗∗∗ 0.014∗∗∗
Obs. 7878 7878 3639
R2 0.33 0.329 0.326
Adjusted R2 0.324 0.323 0.313
Note: Additional control variables used: Month of entry into unemployment (June 2007-May2008) and time between unemploy-ment entry and interview (7-14 weeks). Full estimation results are available on request by the authors.∗ ∗ ∗/ ∗ ∗/∗ indicate significance at the 1%/5%/10%-level.
(a) Indices are standardized in the following way: Indexsti = (Indexi − Mean(Index))/SD(Index).
28
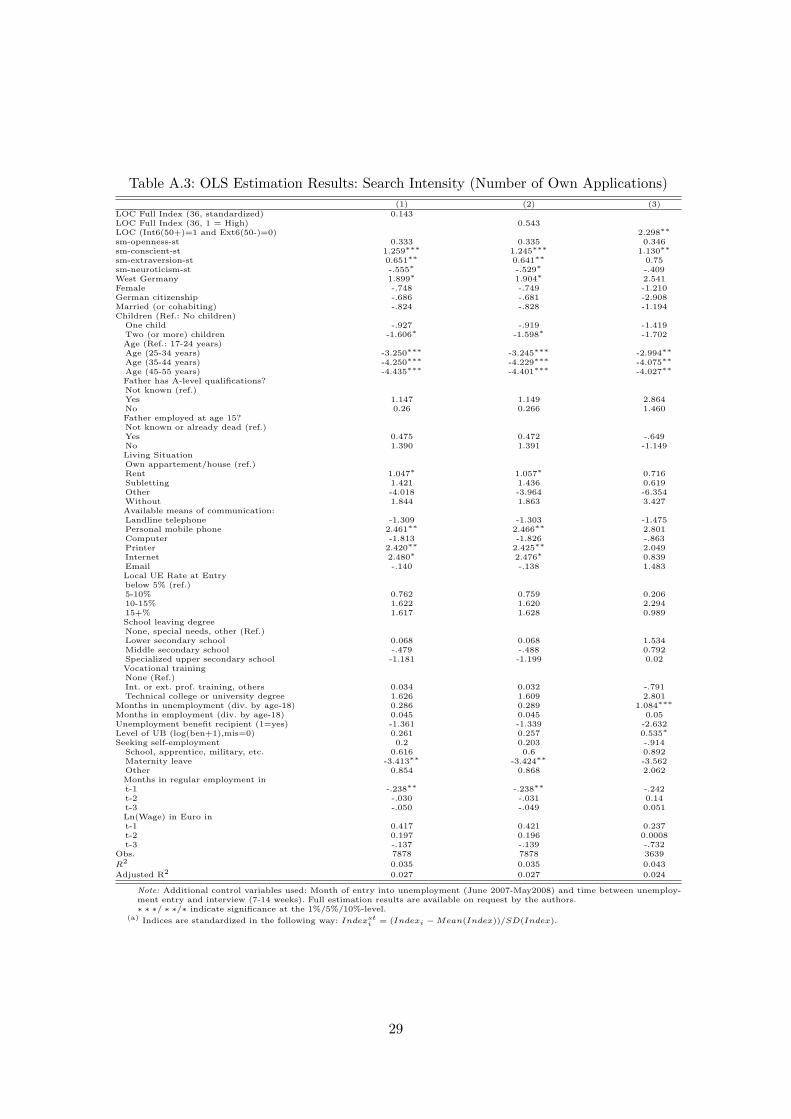
Table A.3: OLS Estimation Results: Search Intensity (Number of Own Applications)(1) (2) (3)
LOC Full Index (36, standardized) 0.143LOC Full Index (36, 1 = High) 0.543LOC (Int6(50+)=1 and Ext6(50-)=0) 2.298∗∗
sm-openness-st 0.333 0.335 0.346sm-conscient-st 1.259∗∗∗ 1.245∗∗∗ 1.130∗∗
sm-extraversion-st 0.651∗∗ 0.641∗∗ 0.75sm-neuroticism-st -.555∗ -.529∗ -.409West Germany 1.899∗ 1.904∗ 2.541Female -.748 -.749 -1.210German citizenship -.686 -.681 -2.908Married (or cohabiting) -.824 -.828 -1.194Children (Ref.: No children)
One child -.927 -.919 -1.419Two (or more) children -1.606∗ -1.598∗ -1.702Age (Ref.: 17-24 years)Age (25-34 years) -3.250∗∗∗ -3.245∗∗∗ -2.994∗∗
Age (35-44 years) -4.250∗∗∗ -4.229∗∗∗ -4.075∗∗
Age (45-55 years) -4.435∗∗∗ -4.401∗∗∗ -4.027∗∗
Father has A-level qualifications?Not known (ref.)Yes 1.147 1.149 2.864No 0.26 0.266 1.460Father employed at age 15?Not known or already dead (ref.)Yes 0.475 0.472 -.649No 1.390 1.391 -1.149Living SituationOwn appartement/house (ref.)Rent 1.047∗ 1.057∗ 0.716Subletting 1.421 1.436 0.619Other -4.018 -3.964 -6.354Without 1.844 1.863 3.427Available means of communication:Landline telephone -1.309 -1.303 -1.475Personal mobile phone 2.461∗∗ 2.466∗∗ 2.801Computer -1.813 -1.826 -.863Printer 2.420∗∗ 2.425∗∗ 2.049Internet 2.480∗ 2.476∗ 0.839Email -.140 -.138 1.483Local UE Rate at Entrybelow 5% (ref.)5-10% 0.762 0.759 0.20610-15% 1.622 1.620 2.29415+% 1.617 1.628 0.989School leaving degreeNone, special needs, other (Ref.)Lower secondary school 0.068 0.068 1.534Middle secondary school -.479 -.488 0.792Specialized upper secondary school -1.181 -1.199 0.02Vocational trainingNone (Ref.)Int. or ext. prof. training, others 0.034 0.032 -.791Technical college or university degree 1.626 1.609 2.801
Months in unemployment (div. by age-18) 0.286 0.289 1.084∗∗∗
Months in employment (div. by age-18) 0.045 0.045 0.05Unemployment benefit recipient (1=yes) -1.361 -1.339 -2.632Level of UB (log(ben+1),mis=0) 0.261 0.257 0.535∗
Seeking self-employment 0.2 0.203 -.914School, apprentice, military, etc. 0.616 0.6 0.892Maternity leave -3.413∗∗ -3.424∗∗ -3.562Other 0.854 0.868 2.062Months in regular employment int-1 -.238∗∗ -.238∗∗ -.242t-2 -.030 -.031 0.14t-3 -.050 -.049 0.051Ln(Wage) in Euro int-1 0.417 0.421 0.237t-2 0.197 0.196 0.0008t-3 -.137 -.139 -.732
Obs. 7878 7878 3639
R2 0.035 0.035 0.043
Adjusted R2 0.027 0.027 0.024
Note: Additional control variables used: Month of entry into unemployment (June 2007-May2008) and time between unemploy-ment entry and interview (7-14 weeks). Full estimation results are available on request by the authors.∗ ∗ ∗/ ∗ ∗/∗ indicate significance at the 1%/5%/10%-level.
(a) Indices are standardized in the following way: Indexsti = (Indexi − Mean(Index))/SD(Index).
29
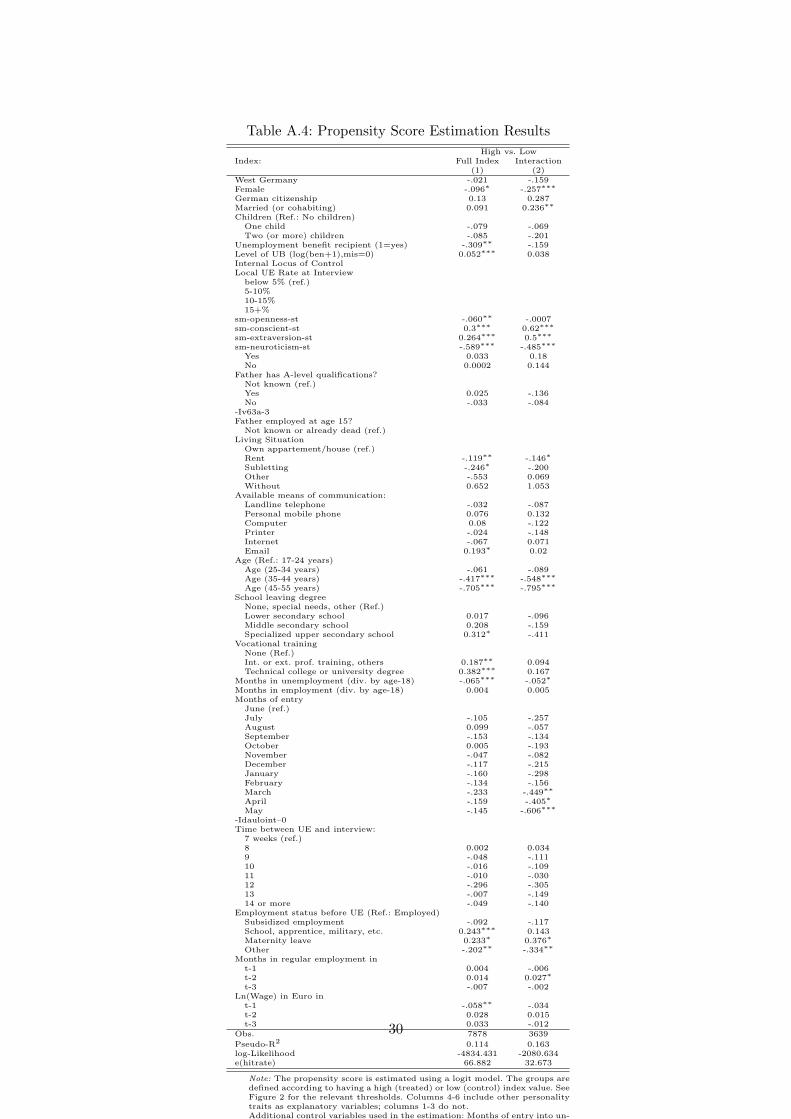
Table A.4: Propensity Score Estimation ResultsHigh vs. Low
Index: Full Index Interaction(1) (2)
West Germany -.021 -.159Female -.096∗ -.257∗∗∗
German citizenship 0.13 0.287Married (or cohabiting) 0.091 0.236∗∗
Children (Ref.: No children)One child -.079 -.069Two (or more) children -.085 -.201
Unemployment benefit recipient (1=yes) -.309∗∗ -.159Level of UB (log(ben+1),mis=0) 0.052∗∗∗ 0.038Internal Locus of ControlLocal UE Rate at Interview
below 5% (ref.)5-10%10-15%15+%
sm-openness-st -.060∗∗ -.0007sm-conscient-st 0.3∗∗∗ 0.62∗∗∗
sm-extraversion-st 0.264∗∗∗ 0.5∗∗∗
sm-neuroticism-st -.589∗∗∗ -.485∗∗∗
Yes 0.033 0.18No 0.0002 0.144
Father has A-level qualifications?Not known (ref.)Yes 0.025 -.136No -.033 -.084
-Iv63a-3Father employed at age 15?
Not known or already dead (ref.)Living Situation
Own appartement/house (ref.)Rent -.119∗∗ -.146∗
Subletting -.246∗ -.200Other -.553 0.069Without 0.652 1.053
Available means of communication:Landline telephone -.032 -.087Personal mobile phone 0.076 0.132Computer 0.08 -.122Printer -.024 -.148Internet -.067 0.071Email 0.193∗ 0.02
Age (Ref.: 17-24 years)Age (25-34 years) -.061 -.089Age (35-44 years) -.417∗∗∗ -.548∗∗∗
Age (45-55 years) -.705∗∗∗ -.795∗∗∗
School leaving degreeNone, special needs, other (Ref.)Lower secondary school 0.017 -.096Middle secondary school 0.208 -.159Specialized upper secondary school 0.312∗ -.411
Vocational trainingNone (Ref.)Int. or ext. prof. training, others 0.187∗∗ 0.094Technical college or university degree 0.382∗∗∗ 0.167
Months in unemployment (div. by age-18) -.065∗∗∗ -.052∗
Months in employment (div. by age-18) 0.004 0.005Months of entry
June (ref.)July -.105 -.257August 0.099 -.057September -.153 -.134October 0.005 -.193November -.047 -.082December -.117 -.215January -.160 -.298February -.134 -.156March -.233 -.449∗∗
April -.159 -.405∗
May -.145 -.606∗∗∗
-Idauloint–0Time between UE and interview:
7 weeks (ref.)8 0.002 0.0349 -.048 -.11110 -.016 -.10911 -.010 -.03012 -.296 -.30513 -.007 -.14914 or more -.049 -.140
Employment status before UE (Ref.: Employed)Subsidized employment -.092 -.117School, apprentice, military, etc. 0.243∗∗∗ 0.143Maternity leave 0.233∗ 0.376∗
Other -.202∗∗ -.334∗∗
Months in regular employment int-1 0.004 -.006t-2 0.014 0.027∗
t-3 -.007 -.002Ln(Wage) in Euro in
t-1 -.058∗∗ -.034t-2 0.028 0.015t-3 0.033 -.012
Obs. 7878 3639
Pseudo-R2 0.114 0.163log-Likelihood -4834.431 -2080.634e(hitrate) 66.882 32.673
Note: The propensity score is estimated using a logit model. The groups aredefined according to having a high (treated) or low (control) index value. SeeFigure 2 for the relevant thresholds. Columns 4-6 include other personalitytraits as explanatory variables; columns 1-3 do not.Additional control variables used in the estimation: Months of entry into un-employment (June 2007 - April 2008) and time between entry and interview(in weeks). Full estimation results are available on request by the authors.∗ ∗ ∗/ ∗ ∗/∗ indicate significance at the 1%/5%/10%-level.
30

B Notes on Theoretical Framework
Proposition 1. Individuals with a more internal locus of control have higher reservationwages and search more intensively than those with a more external locus of control, i.e.,∂s∗
∂loc > 0 and ∂φ∂loc > 0.
Proof. Equation (5) gives the relationship between the reservation wage φ and the optimallevel of search effort s∗. Differentiating equation (5) with respect to loc gives:
∂φ
∂loc=
∂
∂loc
[λ(s∗)λ′(s∗)
c′(s)]− c′(s∗)
∂s∗
∂loc
=λ(s∗)λ′(s∗)
c′′(s∗)∂s
∂loc+
λ′(s∗)2 ∂s∗
∂loc − λ(s∗)λ′′(s) ∂s∗
∂loc
λ′(s∗)2c′(s∗)− c′(s∗)
∂s∗
∂loc
=[
λ(s∗)λ′(s∗)
c′′(s∗)− λ(s∗)λ′′(s∗)c′(s∗)λ′(s∗)2
]∂s∗
∂loc(10)
The job arrival rate depends positively on an individual’s search effort, but at a decreasingrate, i.e., λ′ > 0 and λ′′ < 0, while search costs are increasing in search effort, i.e., c′ > 0and c′′ > 0. Thus, the expression in square brackets is positive which implies that ∂φ/∂locand ∂s∗/∂loc have the same sign.Equation (4) shows that individuals choose their optimal search effort by equating themarginal cost of job search with the marginal benefits of additional search. Differentiating(4) with respect to loc gives:
c′′(s∗)∂s∗
∂loc=
λ′(s∗)f ′(loc)r + q
∫ ∞
φ(w − φ)dF (w) +
λ′′(s∗)f(loc)r + q
∂s∗
∂loc
∫ ∞
φ(w − φ)dF (w)
+λ′(s∗)f(loc)
r + q
∂
∂loc
∫ ∞
φ(w − φ)dF (w)
=λ′(s∗)f ′(loc)
r + q
∫ ∞
φ(w − φ)dF (w) +
λ′′(s∗)f(loc)r + q
∂s∗
∂loc
∫ ∞
φ(w − φ)dF (w)
−λ′(s∗)f(loc)r + q
[1− F (φ)]∂φ
∂loc(11)
Rearranging the above expression yields:
∂s∗
∂loc
[c′′(s∗)− λ′′(s∗)f(loc)
r + q
∫ ∞
φ(w − φ)dF (w)
]= −λ′(s∗)f(loc)
r + q[1− F (φ)]
∂φ
∂loc
+λ′(s∗)f ′(loc)
r + q
∫ ∞
φ(w − φ)dF (w) (12)
The right-hand-side term in square brackets is positive. This implies that in order forequation (12) to hold ∂s∗
∂loc and ∂φ∂loc must both be positive. If they were both negative,
the left-hand side of equation (12) would be negative while the right-hand side would bepositive.
31

B.1 Alternative Model
We now consider an alternative model, in which a function of the locus of control con-tributes to the job arrival rate additively: λa(s, loc) = λ(s)+f(loc). As before, we continueto assume that f ′(loc) > 0, c′ > 0, c′′ > 0, λ′ > 0 and λ′′ < 0.
In this case, the utilities of accepting a job offer at wage w, Ve(w) and of continuingjob search, Vu, are given by:
Ve(w) =1
1 + rdt[wdt + (1− qdt)Ve(w) + qdtVu] (13)
Vu =1
1 + rdt[(b− c(s))dt + (λ(s) + f(loc))dt(
∫ φ
0VudF (w) +
∫ ∞
φVe(w)dF (w))
+(1− (λ(s) + f(loc))dt)Vu] (14)
The reservation wage is given by:
φ = b− c(s) +λ(s) + f(loc)
r + q
∫ ∞
φ(w − φ)dF (w)
= b− c(s) +λ(s)r + q
∫ ∞
φ(w − φ)dF (w) +
f(loc)r + q
∫ ∞
φ(w − φ)dF (w) (15)
Unemployed individuals choose their search effort and reservation wage so as to max-imize Vu over an infinite horizon. The reservation wage defines the search stopping ruleand thus satisfies the condition that Vu = Ve(w). Substituting this constraint into theoptimization problem, we can show that the optimal search behavior is determined by themaximization of Vu = φ/r with resoect to s. This implies that we can solve for the optimalsearch effort s∗ by differentiating the previous equation with respect to (s) and solving forthe s∗ such that ∂φ/∂s = 0. Specifically, we find that
c′(s) =λ′(s)r + q
∫ ∞
φ(w − φ)dF (w) (16)
Substituting this expression into equation 15 we get:
φ = b− c(s) +λ(s)λ′(s)
c′(s) +f(loc)r + q
∫ ∞
φ(w − φ)dF (w) (17)
Proposition 2. In this alternative model, individuals with a more internal locus ofcontrol have higher reservation wages, but search less intensively than those with a moreexternal locus of control, i.e., ∂s∗
∂loc < 0 and ∂φ∂loc > 0.
Proof. Differentiating 16 with respect to loc gives:
c′′(s)∂s
∂loc=
λ′′(s)r + q
∂s
∂loc
∫ ∞
φ(w − φ)dF (w) +
λ′(s)r + q
∂
∂loc
∫ ∞
φ(w − φ)dF (w)
=λ′′(s)r + q
∂s
∂loc
∫ ∞
φ(w − φ)dF (w)− λ′(s)
r + q[1− F (φ)]
∂φ
∂loc(18)
Rearranging the above expression yields:
32

∂s
∂loc
[c′′(s)− λ′′(s)
r + q
∫ ∞
φ(w − φ)dF (w)
]= [−λ′(s)
r + q[1− F (φ)]]
∂φ
∂loc(19)
Given that c′′ > 0, λ′ > 0 and λ′′ < 0, the expression in square brackets on the right-hand side is positive, while the expression in square brackets on the left-hand side isnegative. Thus, equation (19) shows that ∂s
∂loc and ∂φ∂loc must have opposite signs. Moreover,
differentiating the expression for the reservation wage in equation (17) with respect to locgives:
∂φ
∂loc=
∂
∂loc
[λ(s)λ′(s)
c′(s)]− c′(s)
∂s
∂loc
+f ′(loc)r + q
∫ ∞
φ(w − φ)dF (w) +
f(loc)r + q
∂
∂loc
∫ ∞
φ(w − φ)dF (w)
=λ(s)λ′(s)
c′′(s)∂s
∂loc+
λ′(s)2 ∂s∂loc − λ(s)λ′′(s) ∂s
∂loc
λ′(s)2c′(s)− c′(s)
∂s
∂loc
+f ′(loc)r + q
∫ ∞
φ(w − φ)dF (w) +
f(loc)r + q
∂
∂loc
∫ ∞
φ(w − φ)dF (w)
=[
λ(s)λ′(s)
c′′(s)− λ(s)λ′′(s)λ′(s)2
]∂s
∂loc
+f ′(loc)r + q
∫ ∞
φ(w − φ)dF (w)− f(loc)
r + q[1− F (φ)]
∂φ
∂loc(20)
Rearranging the above expression yields:
∂φ
∂loc
[1 +
f(loc)r + q
[1− F (φ)]]
=[
λ(s)λ′(s)
c′′(s)− λ(s)λ′′(s)λ′(s)2
]∂s
∂loc+
f ′(loc)r + q
∫ ∞
φ(w − φ)dF (w)(21)
In equation (21) the terms in square brackets are both positive. Thus, equation (21) onlyholds if ∂s
∂loc < 0 and ∂φ∂loc > 0.
33