
Location Selection for Setting a Shared Service Center · 1 The Financial Professionals Forum 2012...
23
The Financial Professionals Forum 2012 1 Location Selection for Setting a Shared Service Center
Transcript of Location Selection for Setting a Shared Service Center · 1 The Financial Professionals Forum 2012...

The Financial Professionals Forum 20121
Location Selection for
Setting a Shared Service Center
The Financial Professionals Forum 20122
Table of Contents
• On Shared Service Centers
• Location Strategy 2.0 - Our perspective
• Approach to select optimal Location Strategy

The Financial Professionals Forum 20123
4 levers needed to create (and continuously
improve) a high performing shared service center
Primary levers
Enablers
Detailed further
SourcingEnd-to-end
processes
Site role and
performance
Governance
and contracting
Management and
operational
practices
Optimize shared-service network for:
Cost and productivity
Customer experience
Risk and resilience
▪ Mix of ownership
model (e.g., captive,
hybrid, third party)
▪ Local-regional-global mix
▪ Consolidation in regions
▪ Low-cost country leverage
▪ End-state supply footprint
▪ Lean
▪ Demand
management
▪ Automation
▪ Site comparison
(cost, quality, and
productivity)
▪ Inter-site variation in
practice maturity
Consolidation
and locations
SOURCE: McKinsey

The Financial Professionals Forum 20124
Table of Contents
• On Shared Service Centers
• Location Strategy 2.0 - Our perspective
• Approach to select optimal Location Strategy

The Financial Professionals Forum 20125
Our perspectives on Location Strategy 2.0
Overall portfolio
trends
Significant volatility in cost economics and risk profiles of existing and emerging
locations driven by structural macroeconomic factors
To minimize network risk and flexibility, several large firms are expanding footprint
to at least 2-3 countries
Site choices
New scale delivery locations getting established e.g., Philippines, Poland and
several emerging countries e.g., Vietnam, Argentina, Colombia
Interesting alternates such as nearshoring and emergence of tier 2/3 cities as
country risk becomes localized as city risk (for large hubs)
Organizations are building competency based capabilities in specific locations building
towards a more networked, balanced delivery model
Site strategy
Beyond city-specific threshold size levels, O&O centres show diseconomies of
scale
Integrated centers (across similar skill categories) demonstrate better performance
Offshore unit
performance
Best-in-class centers have actually reduced costs through excellence on end to end
process delivery, productivity, team lead attrition that are better determinants of
customer satisfaction
1
2
3
4
5
6
7
8
SOURCE: McKinsey

The Financial Professionals Forum 20126
Significant changes in cost economics and risk
profiles of existing and emerging locations
Risk rating
10,000 30,000 35,0005,000
Cost/FTE (USD p.a.)
15,000
Russia
Poland
Philippines
India
Egypt
China
Brazil
2.0
2.5
3.0
3.5
4.0
2008 country position
Bubble size represents
size of talent pool
2010 country position
Russia
Poland
Philippines
India
Egypt
China
Brazil
Macroeconomic factors and environment
mostly stable. Return of double-digit growth
in O&O industry, currency appreciation &
inflation could drive costs up 10-15%
Macroeconomic environ-ment
rating (e.g. currency and
interest rate volatility)
Lower costs due to nearly
30% fluctuation in exchange
rate
1
SOURCE: McKinsey LRI database

The Financial Professionals Forum 20127
Uncontrollable macroeconomic factors can exhibit substantial
volatility leading to uncertain O&O business cases
1
30
40
50
60
70
80
2
3
4
0
5
10
15
20
0
5
10
15
20
1 Based on trends observed till 31st Oct, 2010
SOURCE: Oanda; press; Global Insight (WMM)
Factor Development
Wage
inflation
Percent
Per annum
Exchange
Rate
INR/$
2008 2009 2010
+6 PP-11 PP +9 PP
-6%+26% -5%
Factor Development
Wage
inflation
Percent
Per annum
Exchange
Rate
PLN/USD
2008 2009 2010
+1.4 PP-5.7 PP
-7%+38%
+1.1 PP
-1%
2008 2009 2010 2008 2009-10 2010
India Poland

The Financial Professionals Forum 20128
Hence to reduce network risk, more large
companies are globalizing their footprints
2
44
72%
28%
100% =
1-2
countries
3+
countries
2011
44
57%
43%
2009
44
61%
39%
2008
More globalized country footprint
# of companies in the sample
4942
5158
2011
~500
~45
~55
2009
~215-250
2008
~355100% =
India
Other
locations
Percent: FTEs 000s (incremental additions)
Share of growth in seats for BPO and ITO
ESTIMATES
SOURCE: McKinsey LRI database

The Financial Professionals Forum 20129
65% of CxOs surveyed believe near-shoring
could be an integral part of global delivery
SOURCE: McKinsey survey, 2010
Percent of respondents
17
34
48
Critical to have
Makes no difference,
can be remotely
managed/offshored
Good to have, not
critical
41
7
14
14
17
17
24
Others
Specific skills
Quality
Regulatory
Cost
Control/
supervision
Language
How important is near-shoring for
your business
What are the top reasons/benefits of near-
shoring
4

The Financial Professionals Forum 201210
Newer network architectures are emerging5
Dominant models Emerging models
Several sites of service delivery, with each site having
independent delivery capability
Sites balance out the risk of currency and talent between
each other
Balanced
Web E
A Single or few large sites for delivery
Large site providing economies of scale
World
Factory
B Multiple sites of service delivery, with close
proximity to customers/markets
Sites mapped onto demand locations
Local for
local
C Service delivery spread across several locations to
utilise specific location advantages for each
process step
Delivery sites customised to supply
Regional
factories
D Service delivery value chain split into two parts:
– Single locations (Hubs) providing benefits of
scale and differentiating capabilities
– Multiple locations (Spoke) linked to the Hub
providing flexibility and customer proximity
Hub &
Spoke
Location
Archetypes Description Customer examples Illustrative details
Nascent model, no established
examples as yet
Large concentration in Tier-1 locations
of early off-shoring destinations (e.g.,
Mumbai, India)
Extensively leveraged close shoring in
Europe to save on cost and gain
market access
Leveraged mix of onshore and offshore
locations depending on customer
needs
Honeywell has established business
analytics hub in India with multiple
spokes across client locations
Orange developed Egypt as hub with
spokes in Eastern Europe
SOURCE: McKinsey

The Financial Professionals Forum 201211
Beyond threshold levels, O&O sites show
diseconomies of scale
6
SOURCE: P360 data, team Analysis
Center size, no of seats
Cost
USD/FTE/hr
0
20
40
60
80
100
120
4000200 2000
Hyderabad
Bangalore
Cost performance analysis by center size

The Financial Professionals Forum 201212
What ensures high customer satisfaction for
offshore units?
8
X Customer satisfaction (on
a scale of 1 to 5; where 5
is most satisfied)
What does not ensure
Team leader
span of control
Agent attrition
Monthly SLA
compliance
Proportion
of fresh hires
Top
quartile
3.7
Bottom
quartile
3.6
3.7 3.7
4.1 4.0
4.0 4.2
What ensures
Team leader attrition
Proportion of end-
to-end process
delivered
Time to ramp up
Annual productivity
improvement
Top
quartile
Bottom
quartile
4.4 3.7
4.5 3.7
4.5 3.8
4.5 3.5
1
23
4
56
7
8
Based on data across 70+ O&O units
SOURCE: McKinsey P360º benchmarking

The Financial Professionals Forum 201213
Table of Contents
• On Shared Service Centers
• Location Strategy 2.0 - Our perspective
• Approach to select optimal Location Strategy
The Financial Professionals Forum 201214
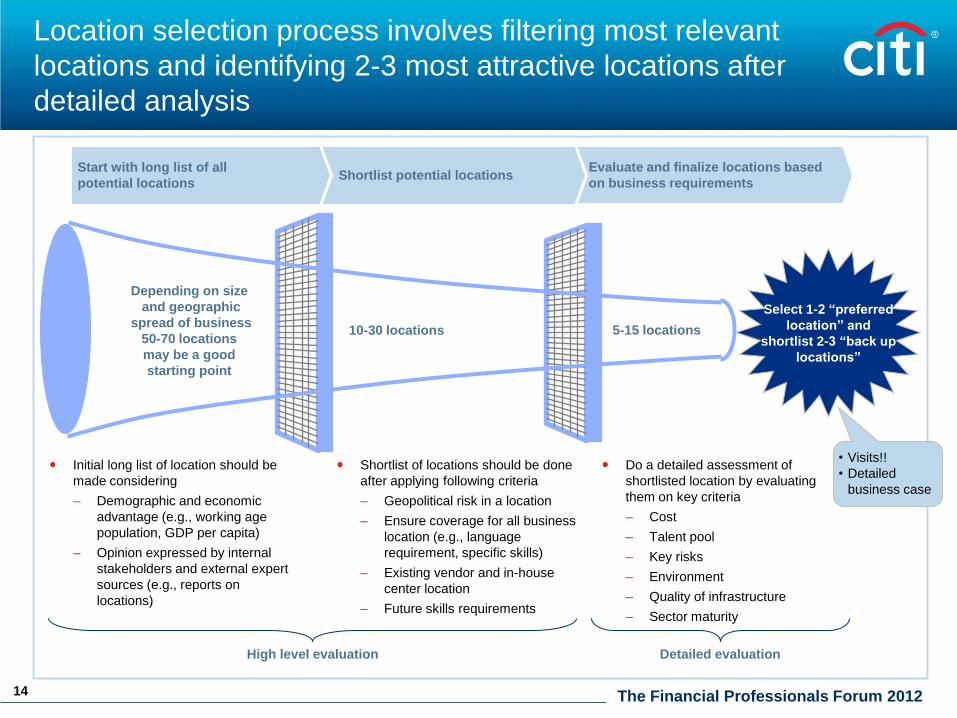
Location selection process involves filtering most relevant
locations and identifying 2-3 most attractive locations after
detailed analysis
Start with long list of all
potential locations
Evaluate and finalize locations based
on business requirementsShortlist potential locations
Select 1-2 “preferred
location” and
shortlist 2-3 “back up
locations”
10-30 locations 5-15 locations
Depending on size
and geographic
spread of business
50-70 locations
may be a good
starting point
Initial long list of location should be
made considering
– Demographic and economic
advantage (e.g., working age
population, GDP per capita)
– Opinion expressed by internal
stakeholders and external expert
sources (e.g., reports on
locations)
Shortlist of locations should be done
after applying following criteria
– Geopolitical risk in a location
– Ensure coverage for all business
location (e.g., language
requirement, specific skills)
– Existing vendor and in-house
center location
– Future skills requirements
Do a detailed assessment of
shortlisted location by evaluating
them on key criteria
– Cost
– Talent pool
– Key risks
– Environment
– Quality of infrastructure
– Sector maturity
High level evaluation Detailed evaluation
• Visits!!
• Detailed
business case

The Financial Professionals Forum 201215
Location readiness is assessed in 6 dimensions
(for detailed evaluation)
Cost
Environ-ment
Key risks Talent pool
Sector maturity
Quality of infra-
structure
Maturity of IT/BPO
industry
Government support
Business and living
environment
Accessibility
Living environment
Labor cost (fully loaded for different data,
voice, knowledge, and IT service lines)
– Infrastructure cost, IT and bandwidth
cost, SG&A
Talent pool for:
– Engineers
– MBAs
– Other specialized
degrees (math,
physics, or
statistics)
– Generalists:
With needed
language skills
No particular
language skills
– Support staff
Telecom/IT
Real estate
Transportation
Power
Geopolitical
Regulatory risks
Country
investment risks
Data protection

The Financial Professionals Forum 201216
Key topics to be considered for each dimension (1/6)
Cost
Environ-ment
Key risksTalent pool
Sector maturity
Quality of infra-
structure
NOT EXHAUSTIVE
Clear understanding of corporate tax rate
(gross + deductions)
View on government incentives (VAT exemptions,
infrastructure support, training grants, land subsides)
Setup upfront investment (fully loaded)
Detailed view of operating cost (fully loaded – direct &
indirect labor costs, facilities, IT/Telecom and G&A)
– Past evolution of cost drivers
– Past evolution of productivity
– Trends for cost drivers
– Macroeconomic factors
(Recent evolution & trends)
Ensure current costs
are in time with your
expectation
Gain confidence cost
will remain an asset
in the future
The Financial Professionals Forum 201217
Key topics to be considered for each dimension (2/6)
Cost
Environ-ment
Key risksTalent pool
Sector maturity
Quality of infra-
structure
NOT EXHAUSTIVE
View on existing shared service centers
– Number of companies
– Functions
– Number of seats
View on existing models operating in the market
– Capture
– Shared/Blended
– Outsourced
Recent evolution & trends in the industry
– Seats evolution (as a proxy of quality)
– Expected entries by companies
– Expected entries by vendorsSaturation/
Opportunities

The Financial Professionals Forum 201218
Key topics to be considered for each dimension (3/6)
Cost
Environ-ment
Key risksTalent pool
Sector maturity
Quality of infra-
structure
NOT EXHAUSTIVE
Clear view on readiness to hire (hard factors)
– Availability: number of fresh graduates with right
qualification per annum
– Suitability: Skill sets, language fluency, IT
knowledge,…
– Accessibility: Mobility to relocate talent
– Willingness: lead of attractiveness of “BPO”
industry for graduates
Clear view on potential alternatives (trainability in 1-3
months for not suitable pool)
Clear view on critical drivers
– Willingness to understand the expectations of
regional staff
– Adaptative toward demands of work

The Financial Professionals Forum 201219
Key topics to be considered for each dimension (4/6)
Cost
Environ-ment
Key risksTalent pool
Sector maturity
Quality of infra-
structure
NOT EXHAUSTIVE
Quality of telecom and network service
– Uptime of end-to-end network
– Mean time to restore
Real state
– Availability of “quality” (your quality) real state
– Vacancy rate of “your quality” space
Quality of power supply
Providers competitive dynamics
Providers service track record
Qualitative
sanity checks

The Financial Professionals Forum 201220
Key topics to be considered for each dimension (5/6)
Cost
Environ-ment
Key risksTalent pool
Sector maturity
Quality of infra-
structure
NOT EXHAUSTIVE
View on regulatory risks (Will my business be
interrupted or affected by unpredictable regulatory and
bureaucratic environment?)
– Transparency of law/regulation
– Fairness of legal system (“independence”)
– Bureaucracy (“favoritism”)
View on country investment risk (Does the location
have a strong macroeconomic environment that will
protect the viability of my financial investment in the
country?)
– Macroeconomic stability
– Currency fluctuation
Data protection (“protection” of data & intellectual
property)

The Financial Professionals Forum 201221
Key topics to be considered for each dimension (6/6)
Cost
Environ-ment
Key risksTalent pool
Sector maturity
Quality of infra-
structure
NOT EXHAUSTIVE
View on government support
– Government policy towards forcing investment
– Labor levers
– Flexibility of regulation (for doing business)
– Corruption
View on business environment
– Rating of overall business environment
– Compatibility of business ethics/culture
Accessibility (time difference, frequency of flights)
Living environment (rating of quality of life, organized
crime, reliability of police services)

The Financial Professionals Forum 201222
How to go about it?
NOT EXHAUSTIVE
Cost
KPMG’s Corporate Tax
Rates Survey
Press search, local
industry association
Estimated based on P360
cost assumptions and
inputs from external
sources such as Watson
Wyatt
Sector maturity
Industry associations
Press releases
Talent pool
Local government
education statistics
Local government
labor/employment
statistics
Vendor interviews
Quality of infrastructure
Telecom regulations
Companies such as CB
Richard Ellis, Colliers,
Jones Lang LaSalle,
Cushman & Wakefield
World Economic Forum –
Global competitiveness
report
Key risks
World Economic Forum –
Global competitiveness
report
EIU Currency: risk rating
agencies
Environment
DiongBusiness.org
Corruption Perception
index Transparency
International
World Economic Forum –
Global competitiveness
report
Mercer - Quality of Living
Survey
Build up your
model
– Choose
variables
– Assign
weights
Leverage
existing sources

The Financial Professionals Forum 201223
Think big!! Think strategy first (objectives, network, levers,
sourcing,…)
Key messages to wrap-up
Funnel approach
Objectivity is king (sources are there to make it objective)
No decision without a detailed and quantitative business case
Go & see approach before taking decisions
1
2
3
4
5


![TTM-339 · Intermediate point2 setting=[Setting value of intermediate point1] to [Maximum value of setting temperature range] PV start/SV start selection ... Input power supply](https://static.fdocuments.us/doc/165x107/602d3c141f981863c11644ad/ttm-339-intermediate-point2-settingisetting-value-of-intermediate-point1-to.jpg)


