
LOCATION, OPERATION AND -GUIDELINES
117
Transcript of LOCATION, OPERATION AND -GUIDELINES
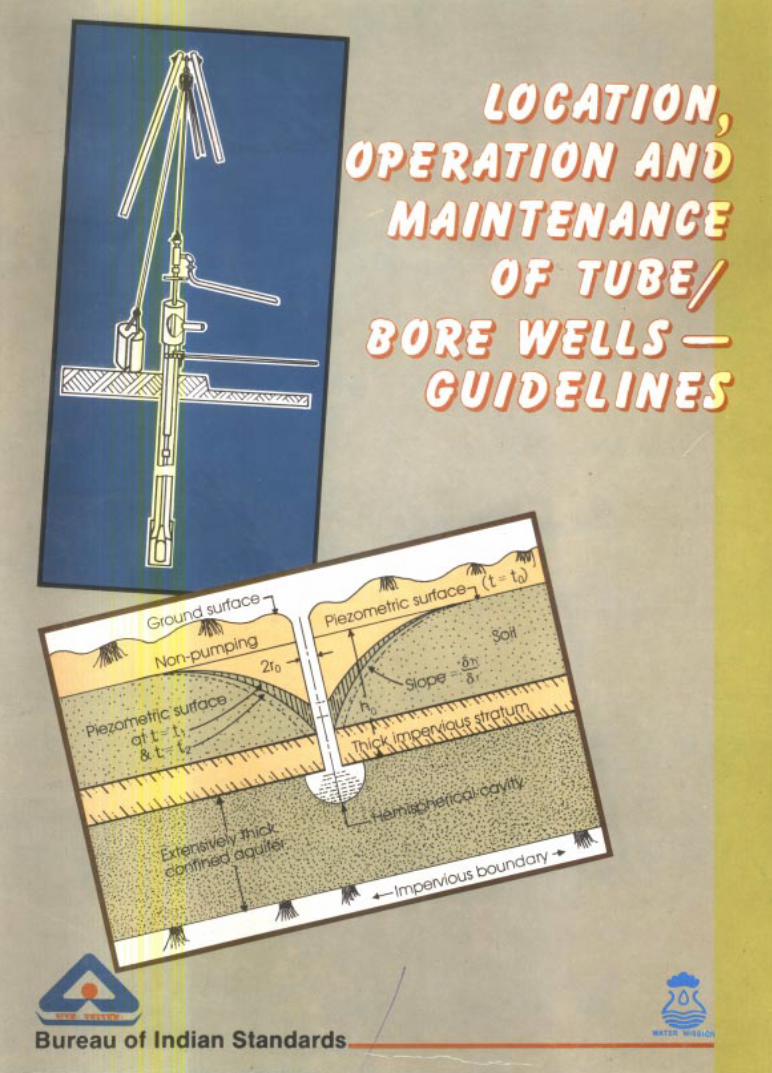

LOCATION, OPERATION AND
MAINTENANCE OF TUBE/BORE WELLS
-GUIDELINES
BUREAU QF INDIAN STANDARDS
MANAK BHAVAN’9 BAHADUR SHAH ZAFAR MARG
NEW DELHI 110002

SP ( QAWSM ) 56 : 1994
FIRST PUBLISHED NOVEMBER 1994
0 BUREAU OF INDIAN STANDARDS
UDC 628.11224:622243
ISBN 81-7061-041-9
PRICE : RS. 30O.j~)
Printed in India at Dee Kay Printers, S/37A, Industrial Area, Kirti Nagar, New Delhi-110015 and Published by the Bureau of Indian Standards, New Delhi-J 10002

NIRMAIA BUCH SECRETARY GOVERNMENT OF INDIA
Tl-afcr;mrm ij+vFv$m- 110001 MINISTRY OF RURAL DEVELOPMENT KRISHI BHAVAN. NEW DELHI - 110 001
FOREWORD
As a signatory of the Alma Ata Declaration 1977, Government of India decided to provide potable water for all by 1991, during the International Drinking Water SUPPlY and Sanitation Decade (1981-91).
Considerable work has been done in India towards this laudable objective. Cost effective technologies have been identified and pushed through. The work gained momentum after the launching of the National Drinking Water Mission (now named after Rajiv Gandhi) in 1986.
In the present programme for supplying water to the rural population, nearly 1,25,000 handpumps are installed every year. The deep well handpump India Mark-II and its improved. version India Mark-III and the shallow well TARA pumps have brought in significant improvement in the rural water supply sector in the country. All but 750 identified problem villages have been covered with atleast one safe source by the end of March, 1993. These 750 villages are also expected to be covered during 1993-94.
At the request of the Rajiv Gandhi National Drinking Water Mission, the Bureau of Indian Standards has compiled a handbook, containing extensive information on the location, operation and maintenance aspects of tube/bore wells. The! compendium contains a comprehensive and analytical study of all the technical aspects of ground water exploration, water quality, well drilling and design parameters, and maintenance and rehabilitation of tubewells. The chapters on well casings and screens, gravel packing, well development techniques and well completion have been discussed in depth. The Annexures to the handbook also contain a summary of the latest techniques for ground water exploration like satellite imagery, a glossary of the technical expressions and a list of all the relevant Indian standards issued by the Bureau of Indian Standards.
This book, which elaborates the Guidelines and Standards in the field of ground water development, would be very useful for the field Engineers and the officers who are engaged in ground water projects.
October 4, 1993
III

As in the Original Standard, this Page is Intentionally Left Blank

N. S. CHOUDHARY I.A.S. meld)
DIRECTOR GENERAL \A, w=fm:w :
P R'E F A C E -_
J?ln;TJi YFT, 9 amypllx qm3 mf, * RF 110002
BUREAU OF INDIAN STANDARDS Manak Bhavan. 9 Bahadur Shah Zafar Marg, New Delhi 110002
The Bureau has been actively associated with the Rajiv Gandhi National Drinking Water Mission. It has significantly contributed to the Mission by way of Quality Assurance services through a cell namely Quality Assurance for Water Supply Mission (QAWSM).
Bureau's contribution primarily focusses on quality in the materials/products, construction/installation, operation and maintenance of works by way of formulation of standards in order to ensure uniformity, save time and resources at least in repetitive items. As 'further contribution to Water Mission, Bureau conducts training programmes on
il Statistical quality control for BIS licensed manufacturers
ii) Sampling and testing of products/materials for organised purchasers.
It also conducts awareness programmes for water supply engineers for effective interaction and feed back, BIS also provides third party certification for products which helps users in choosing products conforming to Indian thereby avoiding further inspection and testing.
Standards.'
A strong has been felt during the interactions for concise Handbook based on Indian Standards on some subjects of water supply to cover it fully.
This Handbook on Tubewells and Borewells is based on materials from more than 95 Indian Standards and imputs provided by various organizations in this field and gives a comprehensive idea of the subject.
Other handbook in the series, on Pipes and Pipe Fittings is already issued and Book on Pumps will be issued shortly.
Use of this Handbook will go a long way in enhancing the life of the water supply project in the form of assured quality and quantity of drinking water in the rural and in
meeting the objectives of Water Mission.
V

As in the Original Standard, this Page is Intentionally Left Blank

INTRODUCTION
As society demands larger and larger quantities of fresh, potable water, the utilization of groundwater,
which constitutes major part of the world’s total fresh water supply and is largely uncontaminated, is becoming vitally important. This marked trend towards development of groundwater sources either
integrated with or in ureference to surface water sources offers a major advantage in the rural environment. - Thus if a well is located judiciously in relation to existing or future sources of contamination, it assures supply of reasonably safe water.
A full groundwater management strategy involves surveys to locate the water-bearing strata, methods of defining the aquifer geometry and determining its capacity and water quality, design of suitable methods
of groundwater withdrawal, tamination.
and measures to regulate its exploitation and ensure its protection from con-
The amount of information about groundwater needed to ensure reliable designs for rural water supply
schemes varies considerably from region to region. The effectiveness and reliability of the programme can be significantly influenced by proper consideration of the local groundwater conditions. Problems typically arise when designers fail to recognize seasonal movements in the water table or competing
demands from irrigation pumps, or when low yielding aquifers are developed without allowing for
drawdown which will arise during pumping, or when the chemical quality of the water makes it unpalatable or corrosive. Any large scale water supply programme should, therefore, include preparatory groundwa- ter studies, geophysical surveys and continuous monitoring and record keeping.
Proper well design, its construction and development considerably improves the long term performance of the tubewell and reduces the chances of clogging of screen, sand content in water, contamination of water and other failures.
This guide aims to consolidate the available technical information on design, construction, operation and maintenance, chiefly from the wealth of practical, proven ideas contained in various Indian Standards and
other publications from specialised agencies on the subject.
List of relevant and referred Indian Standards is given as Annex A and for the purpose of these guidelines
the definitions, used are given in Annex B.
These guidelines have been compiled at the behest of the Rajiv Gandhi National Drinking Water Mission. BIS wishes to place on record its acknowledgement for the support and guidance received from the Mission from time to time.
Acknowledgements are also due to the following who have provided inputs in compilation of these guidelines in the form of informations and critical comments:
Drs. C.P. Gupta, R.L. Dhar and S/Shri N.S.K. Murthy and S.C. Jain, National Geophysical Research Institute, Hyderabad;
Dr. Inder Sir@, Assistant Director, National Metallurgical Laboratory, Jamshedpur;
Dr. T.P. Halappa Gowda, Co-ordinator, South Zone Regional Centre, NDWM, Mysore;
Prof. K.J. Nath, All India Institute of Hygiene and Public Health, Calcutta;
Chief Engineer, Rural Water Supply, Panachayat Raj Department, Govt. of Andhra Pradesh, Hydera- bad;
Dr. R. Paramasivam, National Environmental
Shri Inderjit Verma, Staff Officer (Tubewell),
Engineering Research
Irrigation Department,
vii
Institute, Nagpur;
Govt of U.P., Lucknow:

Shri S.P. Moudgil, Ground Water Investigation, Public Health Department, Govt. of Haryana;
Chief Engineer, Public Health Engineering Department, Govt of Rajastban, Jaipur;
Tamilnadu Water Supply & Drainage Board, Madras;
Director, Ground Water Survey and Development Agency, Pune;
National Remote Sensing Agency, Hyderabad;
Sbri V.B. Patel, Secretary (WS), Health & Family Welfare Department, Govt of Gujarat;
Sbri Gulam Abmed, Chief Engineer, Public Health Engineering Department, Govt of Kamataka, Bangalore;
Central Electrochemical Research Institute, Karaikudi;
Sbri B.P.C. Sinba, Chief Hydrologist and Member, Central Gmupd Water Board, New Delhi; and
Sbri S. Ramadurai, Senior Hydrogeologist (Retd.)., Cenhal Ground Water Board, Bangalore.
. . . VIII

CONTENTS
Chapter 1
Chapter 2
Chapter 3
Chapter 4
Chapter 5
Chapter 6
Chapter 7
Chapter 8
Chapter 9
Chapter 10
Chapter 11
Chapter 12
Annex A
Annex B
Amrex C
Annex D
Annex E
Annex F
Annex G
Ground Water Exploration .........
Estimation of Aquifer Capacity .........
Water Quality . . . .r.. . . .
Corrosion and Incrustation . . . . . .
Well Siting and Construction . . . . . .
Well Casing . . . . . . . . .
Well Screens . . . . . . . . .
Gravel Packing . . . . . . . . .
Well Completion . . . . . . . . .
Testing of Tubewells.. . . . . . . .
Well Maintenance . . . . . . . . .
. . .
. . .
. . .
. . .
. . .
. . .
Well Rehabilitation and Abandonment . . . . . .
List of Referred and Other Relevant Standards . . . . . .
Glossary . . . . . . . . . . . .
Features of Satellite Imagery for Shallow Sand and Gravel Aquifers. . .
Features of Satellite Imagery Related to Rocky and Other Aquifers. . .
Sequence of Investigations Using Satellite Imagery . . . . . .
Surfacial Features Identified on Aerial Photographs that Aid in Evaluating
Ground Water Conditions . . . . . .
Salient Features of Geoelectric Instruments . . . . . .
Page No.
1
11
18
25
28
40
58
69
72
78
86
90
96
100
102
103
103
104
105

SP ( QAWSM ) 56 : 1994
CHAPTER 1
GROUNDWATER EXPLORATION
1 GENERAL
There is some water under the earth’s surface almost
everywhere. Locating groundwater, however, means determining where the water occurs under condi- tions that permit its sustained withdrawal through
a well fast enough and over long periods to be useful and economical. The appliaction of scien- tific methods and appropriate techniques for locat-
ing sites and drilling wells help accomplish this objective.
Groundwater may serve as a reliable source of water for various purposes. However, if withdrawal of groundwater exceeds its replenishment, it may cause several hazards like exessive decline in ground- water level, land subsidence, seawater intrusion into coastal aquifers, undesired reduction or cessa- tion of spring flow and accumulation of contami-
nants.
Groundwater occurrence in an area is controlled by a number of factors like meteorological fea- tures such as precipitation, evapotranspiration, tem- perature and humidity, hydrogeological set-up, geo- morphology, soil type and drainage. The spatio- temporal diversity in these conditions gives rise to wide variations in groundwater potential in differ-
ent regions. A multidisciplinary approach is, there- fore, imperative for the identification of water- bearing formations and the location of suitable sites for wells.
2 FEATURES TO BE INVESTIGATED
2.0 The following features of an area have a significant bearing on the groundwater potential and should therefore be investigated under a scien- tific programme of groundwater exploration.
8) Physiography
The physiography and drainage of the area have a vital role in the groundwater regimen. Since the ground and surface waters are interrelated, the study of the basin as a whole comprising a) the recharge zone, b) groundwater flow regime and c)
discharge zone is necessary to obtain a reliable estimate of groundwater potential.
b) Climatology
The study of climatological factors is imperative to assess the ground water potential of the are since meteoric precipitation is the source for ground-
water. Other factors like evapo-transpiration, sun- shine, wind velocity etc. govern the water losses to the atmosphere and determine the balance amount which can infiltrate into the aquifers after run off
losses.
c) Geology
The geology of the area as revealed by a geologi- cal map is an indicator of ground water potential of the ares as rock types, structures etc. control the
movement and storage of water in sub-terranean formations. An area underlain by rocks usually has less potential than the semiconsolidated and un- consolidated formations.
d) Water Table
The water table fluctuates with recharge and dis-
charge of ground water regimen of an area at a given time and is an important parameter describ- ing the state of the aquifer.
e) Water Quality
The chemical characteristics of water control its use for various purposes, therefore, an assessment of quality of water based on its anticipated use is necessary.
I) Land and Water Use
The land and water use of an area gives the status of surface and ground water utilization indicating the possibility of further development.
2.1 Information to be Collected
Keeping the above in view, appropriate investiga-
tions should be carried out to collect the following infomtation to evaluate the groundwater potential of the area and plan optimal development of ground- water resources. The time variant data should be collected for as long as possible.
1

SP ( QAWSM ) 56 : 1994
2.1.1 Pllysiography
a) Location of the area,
b) The basin/sub-basin to which it belone,
c) Topographic features, and
d) Drainage : number of rivers, streams, etc.; their flow characteristics; catchments, run- off, width and thickness of stream and river beds, the physical characteristics of the material of beds; nature of incoming and effluent streams.
2.13 Climatology
a)
b)
c)
d)
4
f)
2.13
Rainfall : Annual, monthly, rainy days, storm precipitation and their duration, average rainfall,
Temperature : Daily (Max., Min.), Monthly (Max., Min., Average),
Wind : Speed and direction (monthwise/ seasonwise),
Humidity : Daily (Max., Min.), Monthly (Max., Min., Average),
Atmospheric pressure : Daily (Max., Min.,) Monthly (Max., Min., Average), and
Solar radiation.
NOTE - The average estimates for climatological
factors shall be hased on a minimum of 30 years of
record in view of their wide variations.
Hydrogeology
a) Geology
1)
2)
3)
Nature of rocks: Igneous, metamorphic or sedimentary, Physical characteristics- extent, structure, Sub-surface geological information from the well and borehole logs;
Lithological and water-bearing character- istics of the formations: Hydrologic char- acteristics viz., permeability, transmis- sivity and storage coefficient/specific yield;
Water level data (reduced to mean sea level) in different aquifer zones viz. unconfined, semi-confined and confined
(as may exist); spatial density and fre- quency of measurements to be decided depending upon hydrogeological condi- tions. (This data should be collected on a continuing basis);
4) Delineation of recharge and discharge areas
5) Delineation of surface and groundwater divides;
6) Delineation of spring lines, if existing;
7) Delineation of surface flow losses;
8) Delineation of swampy and high water table area, if any;’ and
9) Geomorphology of the area.
b) Hydrochemical Characteristics
1)
2)
3)
4)
5)
6)
c) Land
I)
2)
3)
4)
5)
6)
7)
Chemical quality of surface waters;
Chemical quality of groundwater;
Any noticeable health hazard due to quality of water;
Suspected cause of deterioration of qual- ity due to increase in mineral constitu- ents;
Possibility of pollution due to sewage, industrial waste, oil well etc; and
Salinity problem including sea water in- trusion.
and Water Use
Soil characteristics (physical & chemi- cal), in-situ or transported soil;
Domestic supply (Present and projected);
Irrigated area (present and projected);
Area under different types of crops, crop pattern and cropwise
Sources of water for
Method’ of irrigation; amount of watering;
water requirement;
irrigation;
number, time and
Type, and number of groundwater ex- traction structures (open wells, tube/bore

8)
9)
10)
11)
12)
wells, dug-cum borewells etc.); their depth, diameter, spacing and yield characteris- tics, number of pumps (electric/diesel)
and pumping period;
Total draft (present and projected);
Status of electrification and further plans;
Surface water reservoirs; data on reser- voir levels, water release etc (for a period
10 years);
Water sources for industrial supply (pres-
ent and projected); and
Status and possibility of conjunctive use
of surface and groundwater.
d) Springs and swamps - Temperature, dis-
charge, quality of water from springs and swamps.
2.1.4 The location of ground water extraction
structuies, surface water reservoirs, climatalogi- cal observation stations, stream and sampling points should be maps @ appropriate scales.
2.2 After processing the data
gauging stations
indicated on the
collected, hydra- geological maps, water table/piezometric contour maps, water depth maps, water quality maps, ground- water potential maps etc. should be prepared.
3 PRELIMINARY INVESTIGATION
The investigations described below will help iden-
tify the most promising areas for economic devel- opment of groundwater:
3.1
a)
Preparatory Study
The following information, if available, is use- ful in giving an idea of water-bearing areas and their potential, and deciding the location of the drilling sites:
i)
ii)
iii)
iv)
v)
Topographical maps (scale 1:50,000)
Geological maps (scale 1:50,000)
Hydrogeological maps (scale 1:50,000)
Aerial photographs
Satellite imageries
(scale l:SO,OOO)
(scale 1:250,000)
SP ( QAWSM ) 56 :, 1994
b) Making an inventory of the existing wells, if any. The main sources of information would be well logs pertaining to the drill-
ing and construction of wells.
c) Making a water-table map in the form of contours joining points of equal elevation of water table and showing the shape of the water table in the same way that topo- graphic map shows the shape of the land surface, gives a clue not only to the depth below which groundwater is stored but
also, from the slope of the water table, to the direction in which water is flowing.
d) Besides, in groundwater investigation involving field work, consideration should
be given to the accessibility to the study area by personnel and equipment. Such
aspects of the area as location, extent, topography, transportation facilities, land ownership patterns and climate should be determined prior to planning field work.
3.2 Remote Sensing
Remote sensing is a means of initial reconnais-
sance which allows areas to be evaluated for fur- ther detailed investigation and represents a vast saving in time and effort where new water supplies
are needed in large, relatively undeveloped areas. The remotely sensed data permits inference of sub- surface hydrological conditions through surficial
expression of the aquifers.
3.2.1 Satellite Imagery
Remote sensing through satellite imagery provides a fast means for reconnaissance of large areas and
delineation of regions where detailed investiga-
tions are to be carried out. Satellite imagery and the multispectrum data derived from them provide useful information on lithology, landforms, land use, soil type and geomorphology for broad deline-
ation of zones having good groundwater potential. Information on lineaments (faults, fractures, fis- sures etc.) is very important for groundwater exploration particularly in hard rock areas. The
intensity of fracturing, jointing or folding can also be derived from satellite imagery. Landforms such as alluvial fans, buried channels, valley fills, etc. which have a significant bearing on the occurrence of groundwater may also be identified. Anne.x C
3

SP ( QAWSM ) 56 : 1994
ano ~mtex L) list the features which may be seen on satellite imagery and help detect potential areas of. groundwater occurrence. The data leads to the preparation of regional groundwater potential maps
on a scale of l:lOO,OOO to 1:250,000 with a reso- lution of lo-30 m. These may be enlarged by in- tetgrating and superimposing on a geological map or a topographical survey sheet in the scale of 1:50,000 which becomes a vitally important base map for further detailed investigations. The accu- racy of intepretation shall be checked by carrying out field traverses before preparing the final hydro-
geomcirphological map. Annex E gives the se- quence of investigation by the use of satellite imagery.
3.2.2 Aerial Photographs
Aerial photographs also provide a rapid means of
identifying groundwater potential.
These photographs provide greater details than satellite imagery and greatly facilitate the prepa- ration of hydrogeomorphological maps. The de- lineation of the most and least promising areas for groundwater studies can be indicated on such maps. These maps aid in selecting test-drilling sites and reducing costs of groundwater investigations.
The use of aerial photographs in groundwater investigation is based on the fact that the oc- curence of groundwater is closely related to the characteristics of the terrain. Vegetation, tone, texture, land form and use, drainage_ pattern, ero-
sion, colour and special ground features are appar- ent on aerial photographs and are direct indicators of subsurface conditions. The surficial features identifiable in aerial photographs that aid in ground-
water evaluation are given in Annex F. In some areas, aerial photographs may serve as a substitute for topographic maps. If the photographs have been taken with sufficient overlap, they may be used with a stereoscope to obtain a three dimen- sional view of the terrain.
It is possible under certain conditions to determine from aerial Photographs the chemical quality of water. A general familiarity with the, terrain and the local plant types may be necessary in order to
interpret aerial photographs with maximum effec- tiveness. Indications of ground water depend upon the correlations between water salinity and plant
species. The hydrobotanic inferences will need subsequent field investigation.
Aerial photographs may be prepared from black
and white, infra red monochrome, true colour or
false colour films.
4 FIELD INVESTIGATION
The purpose of the field investigation is to estab- ,_
lish by surface and subsurface methods, the actual hydrogeology of the the area and to study the occurence, distribution and quality of ground water.
4.1 Hydrogeological Survey
As a first step, a reconnaissance should be carried out with a minimum of time and equipment. The region is criss-crossed in a widely spaced grid pattern and all possible geological and hydrogeol- ogical observations made covering the structure of the land, estimate of the permeable areas, number of springs, state of vegetation, estimates of degree
of ariditv etc. The important SUrfiCial features noted on the topographic maps and aerial photo- graphs are examined in greater detail for evidence of groundwater. The information may be used as a
guide to determine the specific geophysical inves-
tigation to follow.
It is essentiaI to study groundwater occurrence in terms of the lateral and vertical extent of the aquifer recharge and discharge areas and the hy- draulic characteristics of the aquifer. Careful geologic
inspection of an area will often indicate the extent and regularity of water bearing formations, the type of rock to be expected and the regularity of
important aquifers. The availability of sources of natural recharge from streams and discharge to springs can also be delineated from such recon- naissance.
4.1.1 Instruments Required
The main instruments for hydrogeological explo- ration include the following:
a) Water level measuring tapes,
b) Continuous water level recorders without
moving parts (floats etc.), and
c) Electrical conductivity meters, pH me- ters and thermometers.

SP ( QAWSM ) 56 : 1994
4.2 Geophysical Surveys
Essentially, geophysicai methods comprise meas- urement and interpretation of signals from natural or induced physical phenomena generated as a-
result of spatial changes in one or more physical urotxrties of a sub-terranean formation. These signals measured repetltwely at several points of space and time are appropriately interpreted, considering the available geological information, in terms of such sub-surface structures/features as may themselves have good groundwater potential or are indicative of good aquifers. In favourable situations, these methods may even yield useful information, albeit indirectly, on some character- istic parameters which might, in turn, help quan- tify the groundwater potential in the surveyed
area.
4.2.1 Geophysical methods make use of various physical characteristics such as density, elasticity, magnetic susceptibility, electrical resistivity and
radioactivity. Depending upon the scale of opera- tions, geophysical surveys can help delineate re- gional hydrogeologic features or pin-point loca- tions for drilling of boreholes. Geophysical sur- veys, though costlier than hydrogeological inves-
tigations, can appreciably reduce much more costly infructuous drilling, specially in hard rock areas.
4.2.2 A reliable interpretation, of geophysical survey data requires a good knowledge of geology and subsurface controls in the area. Therefore a geo-
physical survey should preferably be started near an outcrop- or a bore hole where subsurface condi- tions may- be better known.
4.2.3 The four basic methods of geophysical sur- veying available are : Gravimetric, magnetic, electrical resistivity and seismic. The first two
methods depend on the measurement of the vari-
ations in the intensity and direction of natural forces of gravity and magnetism. The latter two depend on the electrical or mechanical excitations respectively of shallow regions of the earth’s crust and measurement of the spatially variant response of subsurface materials to these excitations. The gravimetric and magnetic methods, however, have very limited applicability in groundwater investi-
gation since these methods do not directly indicate occurence. In recent years, methods based on ra-
dloactwty measurements such as helium detectors have also come into use, particularly for detection of fractures in hard rocks.
4.2.4 Electrical Resistivity Method
This method is the most commonly used geophysi- cal method and has a direct relevance to the oc-
curence of groundwater and its quality in the subsurface formations.
4.2.4.1 The method is based on the principle that
the magnitude of electrical current that can flow through a formation to which an electrical poten- tial is applied depends on its electrical resistivity. The latter, in turn, is dependent on material as well as porosity and water content of the formation. It has been observed that the electrical resistivity of a dry formation is much more than that of the same
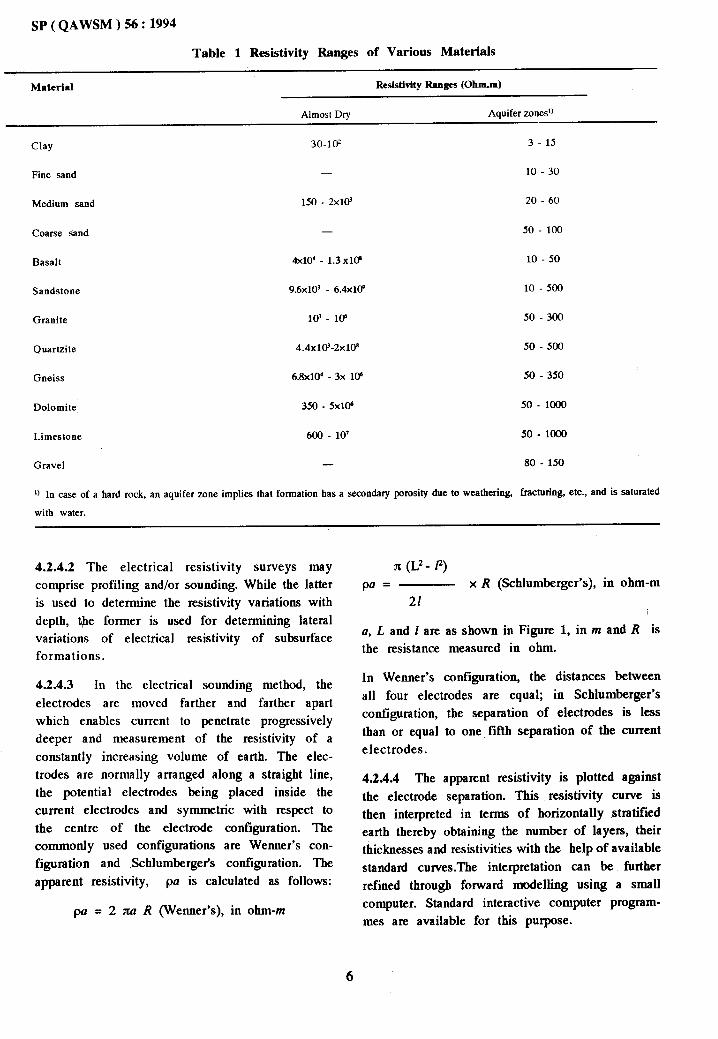
formation when it is saturated with water. Broad values of resistivity for various materials are given in Table 1.
SP ( QAWSM ) 56 : 1994
Table 1 Resistivity Ranges of Various Materials
Material
Almost Dry
Resistivtty Ranges (0hm.m)
Aquifer zones’)
Clay
Fine sand
Medium sand
30-16
-
150 - 2x10³
Coarse sand -
Basalt 4x10’ - 1.3x10³
Sandstone 9.6x10’ - 6.4x1@
Granite 101- 106
Quartzite 4.4x10)-2x10’
Gneiss 6.8x10⁴ - 3x 10⁶
Dolomite 350 - 5x10⁶
Limestone 600 - 10’
3 - 15
10 - 30
20 - 60
50 - 100
10 - 50
10-500
50 - 300
50 - 500
50 - 350
50 - 1000
50 - 1000
Gravel - 80 - 150
‘) In case of a hard rock, an aquifer zone implies that formation has a secondary porosity due to weathering, fracturing, etc., and is saturated
with water.
4.2.4.2 The electrical resistivity surveys may comprise profiling and/or sounding. While the latter is used to determine the resistivity variations with
depth, the former is used for determining lateral variations of electrical resistivity of subsurface formations.
4.2.4.3 In the electrical sounding method, the
electrodes are moved farther and farther apart which enables current to penetrate progressively deeper and measurement of the resistivity of a
constantly increasing volume of earth. The elec- trodes are normally arranged along a straight line, the potential electrodes being placed inside the current electrodes and symmetric with respect to the centre of the electrode configuration. The commonly used configurations are Wemter’s con- figuration and Schlumberger’s configuration. The
apparent resistivity, pa is calculated as follows:
pa = 2 M R (Wemter’s), in ohm-m
II (LZ- P) pa = x R (Schlumberger’s), in ohm-m
21
a, L and 1 are as shown in Figure 1, in m and R is the resistance measured in ohm.
In Wemter’s configuration, the distances between
all four electrodes are equal; in Schlumberger’s configuration, the separation of electrodes is less than or equal to one fifth separation of the current electrodes.
4.2.4.4 The apparent resistivity is plotted against
the electrode separation. This resistivity curve is then interpreted in terms of horizontally stratified earth thereby obtaining the number of layers, their thicknesses and resistivities with the help of available
standard curves.The interpretation can be further refined through forward modelling using a small computer. Standard interactive computer mes are available for this purpose.
6
program-

1 C
I C P P x_--_-*---_-+__----x
I ’
k--+-+--“-+--“+
; Wenner configuration
A M N B
*____-_-- A A ___---__-$(
+LaL-----d
Schlumberger conftgurotion
L FIG. 1 WENNER AND SCHLUMEIERGER E:LFL?IT~ODE CQNFIGURATION FOR
ELEIXKAL RES~~VITY SURVEYS
4.2.4.5 While the electrical method is very useful for groundwater exploration, it has the following
limitations :
a) Any nearby high-tension power lines or
electrical sub-stations etc. give rise to disturbances and the signals from the subterranean structures may get greatly masked/distorted unless special filters are used with the equipment;
b) The strength of the signal progressively
reduces with the -increase in the depth of exploration. The method does not
provide satisfactory quantitative results if the potential aquifers are very thin
compared to their depth of occurrence. Also, if the potential aquifer does not have sufficient resistivity contrast with the overlying and underlying formations, the signal may not be discernible, and
c) In hilly terrains or other areas of undu-
lating topography the data interpreta-
tion is very difficult.
4.2.5 Seismic Method
It is based on the principle that seismic waves follow the same laws of propagation as light rays
and are reflected or refracted at any interface where a seismic velocity change occurs. The waves are induced by a mechanical shock at the earth’s surface or at a certain depth below it either by the impact of a heavy contrivance like sledge hammer or by exploding a small dynamite charge. The time
required by the the resulting shock wave to travel known distances is measured by picking it up by
SP ( QAWSM ) 56 :- j994
means of vibration detectors (geophones) arranged in a pre-designed configuration.
4.251 The velocity of the wave depends on the media through which it travels; it is the least in the
unconsolidated formations, increases with the degree _-of consolidation and is the greatest in solid igne-
ous rocks. The seismic wave velocities in different materials are given in Table 2.
Table 2 Velocity of Seismic W&s in
Different Materials
(Clause 4.251)
Mnterlnl Velocity
m/s
Weathered soil horizon loo - 500
Sand 300 - 800
Alluvium 500 - 2500
Clay 1200 - 2500
Sandstone 1500 - 4ooo
Shale 2700 - 4800
Limestone 2500 - 6500
Granite 4ooo-7ooo
4.2.5.2 The seismic method using explosives as a source of energy is particularly suited for use in
large areas, but the introduction of energy me- chanically by means of a hammer may be prefer- able for environmental reasons more so for explo- ration of shallow depths.
4.2.5.3 This method requires special equipment and trained staff. The field procedure for seismic
investigations has been simplified in recent years with the aid of compact and efficient instruments. The shock waves are detected by geophones and the signal is converted into electrical impulses which are amplified and recorded on an oscillo- graph in an analog fashion or more recently in digital form on magnetic
a depth of a few hundred this type of equipment.
4.2.6 Instruments
Various field instruments
media. Interpretations to metres are possible with
required for geophysical surveys and hydrogeological investigations need to be very carefully selected. Main instruments deployed for groundwater prospecting include the following :
a) d.c. electric instruments;
b) Electromagnetic unit useful in areas where surface resistance is high; and
c) Magnetic instruments to locate hid- den dykes etc.
7

SF (QAWSM ) 56 : 1994
Salient features and specifications of some of the electrical resistivity equipment which may help to select an appropriate instrument for a given cost of
operation are given in Annex G.
5 EXPLORATORY DRILLING
5.1 In order to avoid infructuous expenditure, it
is desirable to drill an exploratory test borehole,
particularly in a virgin area, to define the geome- try of aquifer and its groundwater potential. The
well log, consisting of a plot of depth versus the type of material obtained while drilling, provides valuable basic data and enables clear delineation of aquifer zones. The location for test hole should
be chosen in such a way that if it yields prospects of a good aquifer, it can be converted for opera- tional use by redrilling or reaming to a larger diameter to form a pumping well. The test holes often serve as observation wells for measuring
water levels or for conducting pumping tests. At the same time, water samples collected during drilling reveal water quality information. Any of several types of well logs may be produced. The
common well log is the driller’s description of the geologic character of each stratum, the depth at which changes in character were observed, the thickness of the strata, and the depth of water. The
following procedure is recommended for produc- ing a driller’s log:
a)
b)
cl
d)
The test borehole should be at least 190 mm in diameter,
A complete and accurate log of the borehole, when it is being drilled. should be kept. Samples of soil should be collected at a maximum interval
of 2 m or whenever there is a change in strata,
The total depth drilled should be suf-
ficient to determine the depth and other characteristics of the lowest aquifer as anticipated from other local considerations, and
In case of Percussion drilling, static water level in the borehole should be measured daily in the morning before commencement of drilling operations
and in the evening at the end. A study of this data gives an indication of the behaviour of the aquifers met with during drilling operations.
After the drilling has reached sufficient depth, all the samples of strata colleected should be care- fully examined and analysed. The samples should be dried, stored and preserved carefully. A valu-
able supplement to the driller’s log is the drilling- time log consisting of a record of time taken to drill every two meters of depth or where there is change of strata. The rate of penetration of a
stratum can be correlated with the formation en- countered. The interpretation of the log regarding the nature of the formations (hard, soft, unconsoli- dated etc.) gives an indication of their water yield-
ing capacity.
5.2 Besides the drilling logs, the following logs may also be prepared:
a) Geophysical Logs - These logs are obtained
by lowering an instrument, connected to a surface- mounted recording device, down the borehole to obtain the subsurface record which can be inter-
preted in terms of the formation characteristics and then extrapolated laterally. Whereas properly made geophysical logs are unbiased and thus, may be utilized over wide geographic areas and for
long periods of time, the conventional driller’s logs are not of consistent value.
With the recent advancement in electronics, compact and relatively inexpensive logging units, which
can be operated by one man, are now widely avail- able. Many of the logging instruments provide necessary procedures for interpretation.
The basic deterrent in the widespread use of geophysical logs is that many engineers work- ing on water well drilling projects do not have nec- essary knowledge and experience for detailed in-
terpretation of the logs. Therefore, interpretations are usually provided along with logging units by the suppliers.
b) Electric Logging - This is the most common
borehole geophysical operation and serves to ver-
ify and supplement the descriptive driller’s log. An electric log consists of a record of the apparent resistivities of the subsurface formations and spontaneous potentials generated in the borehole both plotted in terms of depth below the ground surface. These two properties are related indi- rectly to the characteristics of subsurface forma-
tions and the quality of water contained within.
The electrical logs may be single or multiple elec- trode types. The single electrode yields one spon-
8

+ tanous potential (SP) and one resistance curve; the multiple electrode yields one SP curve identical to that of single electrode and two or more resistance curves. The, single point electrode is popular in
groundwater investigation since the equipment required is much less complex and curves obtained can usually be readily interpreted to delineate aquifer boundaries.
Electric logs cannot be run in encased holes. Al- though a fluid-filled hole is more desirable, they
can be run on dry holes using special types of probes.
c) Temperature Logging - Temperature logs are
obtained by measuring the groundwater tempera- ture using resistance thermometers. The tempera- ture would, ordinarily, increase at approximately the rate of the geothermal gradient. Any departure from this nomral gradient would suggest variations which may be interpreted in terms of groundwater condtions. Temperature logs are frequently made
at the same time as electrical logs and contribute to the reliability of interpretation of multiple elec- trode electric logs. They also provide a valuable tool in investigating inter-aquifer migration of water, adequacy of grouting, quality of water, corrosion and other similar studies.
SP (QAWSM ) 56 : 1994
d) Caliper Logging - Caliper logs measure the
diameter of uncased drill hole as a function of depth and are made by running a self-actioned caliper through the borehole. They are valuable in
determining unconsolidated fomrations, identify-
ihg caving zones and estimating quantities of cement required for grouting and gravel required for pack- ing. They are also useful in interpreting electric logs where apparent resistivity is influenced by borehole diameter variations.
e) Radiation Logging - Radiation logs are of
two general types: those which measure the natu-
ral radiation of materials (gamma ray logs), and
those which measure radiation transmitted through, from, or induced in the formation by a neutron
emitting source (neutron log). Gamma ray log is a curve relating depth to intensity of natural radia- tion and is especially valuable in dectecting clays and other materials of high radiation;
These logs are not affected by casing in a borehole and may be used to identify formation boundaries in a cased borehole. These can also be obtained for
dry boreholes whether cased or uncased.
The logging techniques recommended for various purposes are summarised in Table 3.
Table 3 Suggested Logging Techniques for Groundwater Investigations
(clause 5.2)
Information Needed on F’ropertks of Rocks, Fluids, Wells or
Groundwater System (1)
which Might be Utilized
(2)
Formation water quality, determination of aquifer boundaries
and surface geological correlation.
Spintaneous potential, Resistivity. Gamma log
Stratigraphic correlation Gamma log
Determining a&fer boundaries (such as contact between
weathered, fractured fresh granites; contact between massive
and vesicular basalt)
Point resistance
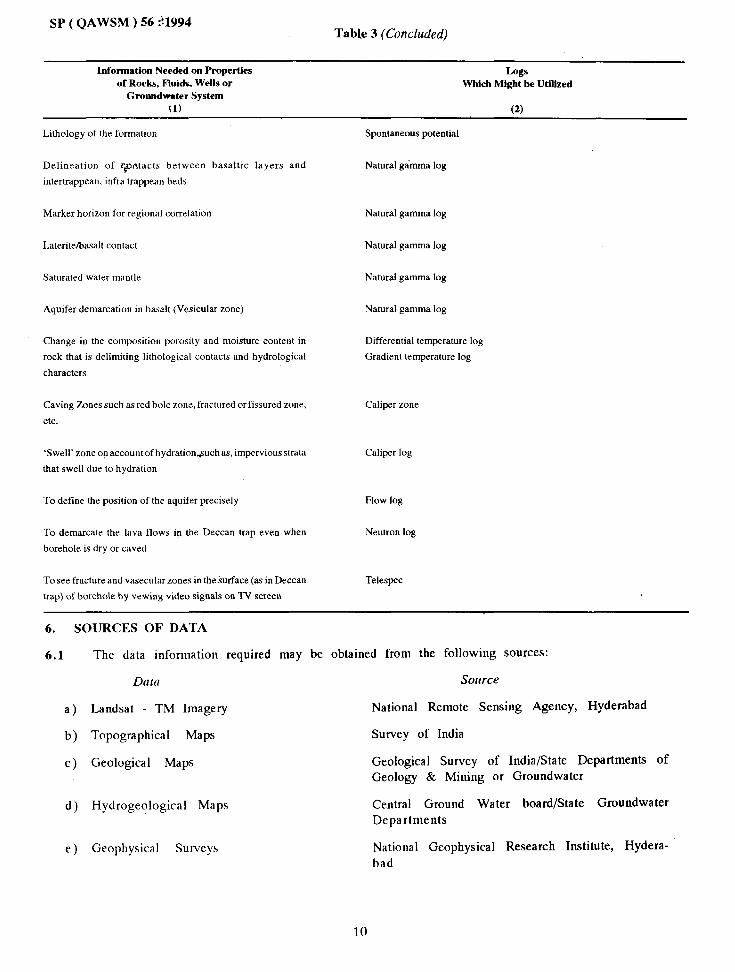
SP ( QAWSM ) 56 :!1994 Table 3 (Concluded)
Information Needed on Properties of Rocks, Fluids, Wells or
Groundwater System (1)
Lithology of the formation
Delineation of ppntacts between basaltic layers and
intertrappean. infra trappean beds
Logs Which Might be Utilized
(2)
Spontaneous potential
Natural gamma log
Marker horizon for regional correlation
Laterite/basalt contact
Saturated water mantle
Aquifer demarcation in basalt (Vesicular zone)
Change in the composition porosity and moisture content in
rock that is delimiting lithological contacts and hydrological
characters
Natural gamma log
Natural gamma log
Natural gamma log
Natural gamma log
Differential temperature log
Gradient temperature log
Caving Zones such as red bole zone, fractured or fissured zone,
etc.
Caliper zone
‘Swell’ zone on accountof hydration&tchas. imperviousstrata
that swell due to hydration
Caliper log
To define the position of the aquifer precisely
To demarcate the lava flows in the Deccan trap even when
borehole is dry or caved
Flow log
Neutron log
To see fracture and vasecular zones in the surface (as in Deccan
trap) of borehole by vewing video signals on TV screen
Telespec
6. SOURCES OF DATA
6.1
a)
b)
c)
d)
e)
The data information required may be obtained from the following sources:
Dam Source
Landsat - TM Imagery National Remote Sensing Agency, Hyderabad
Topographical Maps Survey of India
Geological Maps Geological Survey of India/State Departments of Geology & Mining or Groundwater
Hydrogeological Maps Central Ground Water board/State Groundwater Departments
Geophysical Surveys National Geophysical Research Institute, Hydera- bad
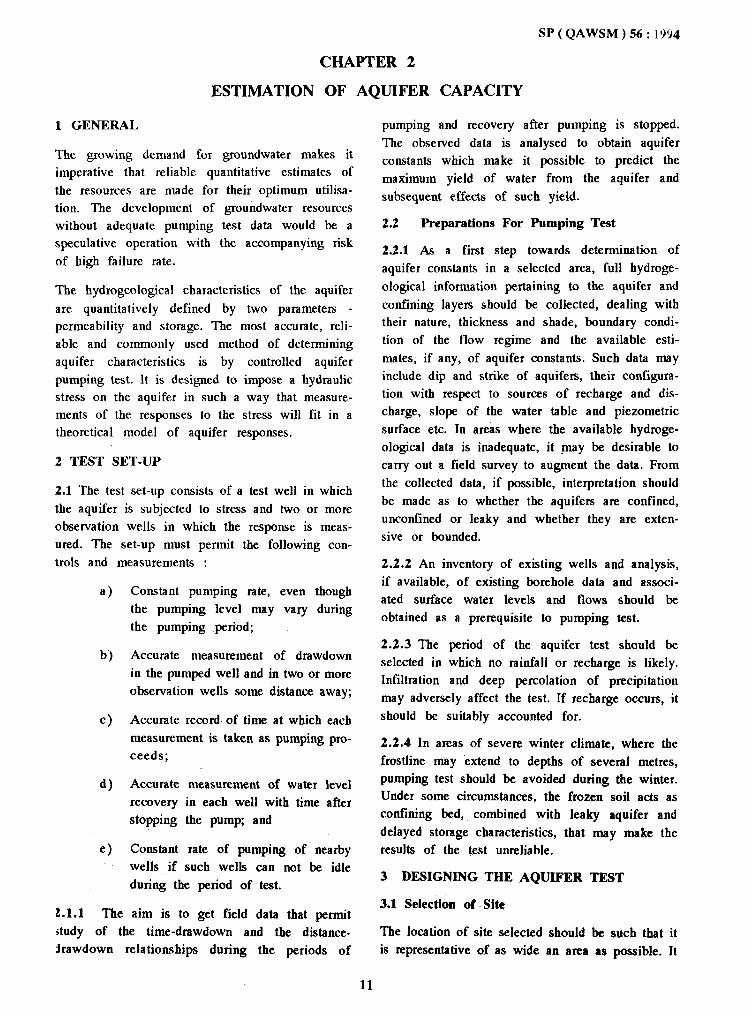
CHAPTER 2
SP ( QAWSM ) 56 : 1994
ESTIMATION OF AQUIFER CAPACITY
1 GENERAL
The growing demand for groundwater makes it imperative that reliable quantitative estimates of
the resources are made for their optimum utilisa- tion. The development of groundwater resources without adequate pumping test data would be a speculative operation with the accompanying risk
of high failure rate.
The hydrogeological characteristics of the aquifer
are quantitatively defined by two parameters - permeability and storage. The most accurate, reli- able and commonly used method of determining aquifer characteristics is by controlled aquifer pumping test. It is designed to impose a hydraulic stress on the aquifer in such a way that measure- ments of the responses to the stress will fit in a theoretical model of aquifer responses.
2 TEST SET-UP
2.1 The test set-up consists of a test well in which
the aquifer is subjected to stress and two or more observation wells in which the response is meas- ured. The set-up must permit the following con- trols and measurements :
a>
b)
Cl
d)
e)
Constant pumping rate, even though the pumping level may vary during the pumping period;
Accurate measurement of drawdown
in the pumped well and in two or more observation wells some distance away;
Accurate record of time at which each
measurement is taken as pumping pro-
ceeds;
Accurate measurement of water level recovery in each well with time after stopping the pump; and
Constant rate of pumping of nearby wells if such wells can not be idle
during the period of test.
2.1.1 The aim is to get field data that permit study of the time-drawdown and the distance- Jrawdown relationships during the periods of
pumping and recovery after pumping is stopped. The observed data is analysed to obtain aquifer constants which make it possible to predict the maximum yield of water from the aquifer and
subsequent effects of such yield.
2.2 Preparations For Pumping Test
2.2.1 As a first step towards determination of
aquifer constants in a selected area, full hydroge- ological information pertaining to the aquifer and
confining layers should be collected, dealing with their nature, thickness and shade, boundary condi- tion of the flow regime and the available esti-
mates, if any, of aquifer constants. Such data may include dip and strike of aquifers, their configura- tion with respect to sources of recharge and dis- charge, slope of the water table and piezometric
surface etc. In areas where the available hydroge- ological data is inadequate, it may be desirable to carry out a field survey to augment the data. From
the collected data, if possible, interpretation should be made as to whether the aquifers are confined, unconfined or leaky and whether they are exten- sive or bounded.
2.2.2 An inventory of existing wells and analysis, if available, of existing borehole data and associ- ated surface water levels and flows should be
obtained as a prerequisite to pumping test.
2.2.3 The period of the aquifer test should be selected in which no rainfall or recharge is likely. Infiltration and deep percolation of precipitation may adversely affect the test. If recharge occurs, it
should be suitably accounted for.
2.2.4 In areas of severe winter climate, where the
frostline may extend to depths of several metres, pumping test should be avoided during the winter. Under some circumstances, the frozen soil acts as confining bed, combined with leaky aquifer and delayed storage characteristics, that may make the results of the test unreliable.
3 DESIGNING THE AQUIFER TEST
3.1 Selection of Site
The location of site selected should be such that it is representative of as wide an area as possible. It
11

SF ( QAWSM ) 56 : I994
should be away from railway line and roads where heavy traffic might produce fluctuations in the piezometric surface o-f a confined aquifer, and from existing wells, unlined distributaries and canals and other sources of recharge and discharge. In any case, distances to all such sources should be measured and their operational schedules recorded. While selecting the site, consideration should be given to the method and place of disposal of dis- charge from the well. The pumped water should be safely discharged sufficiently far off, through pipes or lined chattels, so that no percolation of dis- charged water occurs in the zone overlying the cone of depression created in the unconfined aquifers.
3.2 Construction of Test Well
The test -well should be properly constructed to ensure that the stress in the aquifer immediately outside the casing is reflected in the water level changes in the well.
3.2.1 The diameter of the test well should be as small as practicable so that the water in storage in the well is negligible in comprison to the water produced from the aquifer during the test. The diameter selected should, however, accommodate the test pump, provide sufficient clearance for measurement of the pumping level readily and pump water at the desired rate.
3.2.2 The screen opening and gravel packing should be adequate to allow desired pumping rate without much entrance and other losses. The length of the screen, as compared to the thickness of the aqui- fer, is an important factor. In relatively thin strata, the screen length should be three-fourths of the aquifer thickness or more. In thicker aquifers the wells screen should be as long as practicable and should be set in the most permeable portion of the sand or gravel formation.
3.23 As far as possible test wells should be con- structed separately for confined and unconfined aquifers. Alternatively, a combined well tapping both the aquifers can be constructed with a cement seal in the confining clay outside the well. The wells should tap the full thickness of the aquifer.
3.3 Construction of Observation Wells
An aquifer test which employs one or more obser- vation wells has a higher chance of successfully
12
predicting aquifer characteristics than one which relies entirely on the measurements in the test well even after well losses are estimated.
33.1 While any number of observation wells -may- be used, the recommended minimum number is four - three on a line passing through the centre of the test well and one on a normal line to other three but passing through the test well. ‘IIre obser- vation wells should be of smalI diameters io mini- mise the time lag in drawdown response due to storage in well but large enough to permit rapid and accurate measurement of water level. Obser- vation wells of 50 mm, 100 mm and 150 mm diameters are adequate for shallow, medium and large depths. Larger diameter wells may be used if observations are to be made by automatic record- ers.
3.33 The observation wells should generally tap the same or corresponding depth zone of the aqui- fer tapped by the test well. The observation wells may be screened at a depth corresponding to the centre of the screened portion in the test well. Longer screens are desirable but not absolutely necessary. Proper depth of observation wells is very important especially if short screen is used. At times, the observation wells may be terminated in the strata above or below that tapped by the test well to see if there is any hydraulic interconnec- tion between the formation.
3.33 The distance of observation wells from the test well should be such as to yield good response curves. When observation wells are installed, they may be located at different distances so as to give greatest possible area1 coverage. If the test well is fully penetrating, there is no restriction on dis- tance of the observation wells; however, in case of partially penetrating test well, the nearest obsewa-
tion well may be placed at a distance at least 1.5 times the thickness of the aquifer.
33.4 The placement of the observation wells is governed by two f&tom: one, the aquifer is almost always stratified and not uniform from top to bottom, and, two, the length of the screen in the test well may be considerably leas than the full saturated thickness of the aquifer. These factors distort the distribution -of hydraulic head and dmwdown in the vicinity of the test well during the aquifer test. This distorted pattern is ironed out at considerable
distances from the test well of about 3 to 5 times the aquifer thickness. Setting observation wells at distances of 30 to 100 m from the test well will work out best in most cases. Locating the wells too
far away is not always convenient because the
pumping test must be continued for a longer time in order to produce drawdowns of sufficient amount
at the most distant points.
3.4 Before conducting the aquifer test, the obser- vation wells should be tested for response time by injecting a slug of about 10 1 water. The water
level should return to near static condition in two to ten minutes if the well has adequate response
time.
4 PRE-PUMPING PREPARATION
4.1 Before the aquifer test is undertaken it is necessary to establish the natural conditions of flow and determine any measurable trend in ground- water levels. The water levels in the test and obser-
vation wells should be periodically monitored at an interval of 1 to 2 h for 3 to 5 days prior to the actual test and a curve of change in depth versus time prepared to correct the observed drawdown
during the test. If there is a pumping well in the neighbourhood, the effect of its pumping schedule
on the test and observation wells should be re- corded at specific discharge and taken into ac- count in the aquifer test.
4.2 In confined and unconfined aquifers, water level changes in response to fluctuations in the barometric pressure. These variations in water level and barometric pressure may be measured several times daily for at least 4 days prior to the actual test and a plot made. The slope of the straight line of fit through each set of measurement for each well will give the barometric efficiency of each well. If a relationship is recognized, barometric readings should be made at the same time as water level measurements during the test and required. corrections made to the observed water levels.
4.2.1 Similar observation of water levels should be recorded in response to tides where the test area is close to sea.
4.3 A day or two before the test, the well should be tested for several hours for yield and drawdown,
operation of the discharge measuring equipment, general operating conditions and approximate best
SP ( QAWSM ) 56 : 1994
rates of discharge for the test. At the same time, water levels should be measured in observation wells to assure response.
4.4 The measuring points in the test well and the
observation wells should be selected, marked clearly with paint and elevations determined by levelling,
if required.
4.5 The distance and bearing from the centre of the test well to the centre of all observation wells should be measured as also the distance and bear- ing to the closest point of any nearby boundary such as lake or stream or other discharging wells.
5 RUNNING A PUMPING TEST
5.1 The water level in test and observation wells
should be measured immediately before starting the pumping test to establish static water levels upon which all drawdowns will be based. All water level measurements subsequently should be re- lated to a common datum like general land surface or mean sea level.
5.1.1 For water level measurements, steel tapes
graduated up to one mm interval and coated with chalk provide a reasonably accurate method of
measureme_nts. Continuous records of water level can also be obtained by using automatic water
level recorders especially in wells where change in water level is small and slow. However, care is required to be taken to see that float is free of
friction from the casing. Electrical sounding may also be used if frequency of measurement is high. Air pressure lines are also useful in wells where heavy drawdowns are expected but measurements
are not accurate. Accuracy of field measuring gauge needs to be determined before using the same.
5.2 The method to be adopted for the measurement
of discharge should be decided upon based on the rate of discharge and arrangements made accord- ingly. The usual methods are volumetric, rectan- gular and V notch (see IS 9108 : 1979), manome- ter tube (see IS 9118 : 1979) circular orifice [see
IS 2952 (Part 1) : 196411, weir (see IS 6059 : 1971) and jet (see IS 9119 : 1979) methods.
5.2.1 The circular orifice method is the most
commonly used for measurement of the rate of discharge. The orifice is a perfectly round hole in
the centre of a circular steel plate that is fastened
13

SP ( QAWSM ) 56 ! 1994
to the outer end of a level discharge pipe. A manometer tube is fitted in a 6.35 mm or 8.5 mm hole made in the discharge pipe exactly 61 cm from the orifice plate. The water level in the
manometer tube represents the pressure in the discharge pipe when water is pumped through the orifice. Standard tables (Johnson, 1966) have been published which show the flow rate for various
combinations of orifice and pipe diameter. /
/ 5.3 The watches of all observers should be syn- chronized correct to a second before starting the
test. The instant of starting the pump should be re- corded as the time of the test. The initial discharge
may be somewhat in excess of the continuous discharge and it may be necessary to reduce it by
partially closing the valve on the discharge pipe. The well discharge should be controlled to keep it as constant as possible after the initial excess
discharge has been stabilized.
5.4 The aquifer test consists of pumping out from a test well at constant discharge and shutting off
the pump after an interval of time, and recording
water levels in the test well and observation wells both during pumping and after stoppage of pump.
Immediately after starting or stoppage of pump, the water level falls or rises very rapidly and there- fore the water level measurement should be very rapid during this period in order to define the drawdown or recovery curves precisely. After about
100 minutes of pumping or stoppage, 25 measure- ments during each log cycle of time are adequate
to define the drawdown curve with sufficient accuracy.
5.4.1 The recommended time intervals of measure-
ments are given in Table 1.
Table 1 Recommended Time Interval
(CZause 5.4.1)
Time Since Pumping
Started/Stopped
lFIom
(minute)
Time Interval for Water
Level Measurements
(minute)
No. of
Recordings
Time Interval for
Temperatnrc and
Conductivity Measure-
ments (for Risk
of Saline Water
Encroachment)
(hour)
(1) (2) (3) (4) (5)
0 10 l/2 or 1 10120 2
10 20 2 5 2
20 60 5 8 2
60 100 10 4 2
100 300 20 10 2
300 1000 50 14 4
1000 3ooo 100 20 8
3000 Shutdown 200 - 12
14
5.4.2 However, adherence to the time schedule should not be at the expense of accuracy in the drawdown measurements. If the water level flue-
tuates erratically or sudden changes in trend occur
the schedule may be changed and frequent meas- urements taken to define the trend. The exact time of taking measurement should, however, be re-
corded.
5.5 During the first 60 minutes, the timing of measurement should be accurate to nearest sec- ond. To achieve the desired accuracy, two observ- ers should be posted at each well, during the early part of the test. Later, one observer can do the job.
Stop watches should be used during early measure- ments but later synchronised watches can be used.
5.6 In addition to water level measurements, tem-
perature measurements of the discharged water
should be made periodically. This will be required to effect correction to permeability value if it is to be corrected to a standard temperature. Similarly, water samples should be collected at appropriate intervals and the conductivity noted to observe changes in the quality specially if the aquifers are overlain or underlain by aquifers with different quality of ground water, or if there is lateral change
in the qua’lity. Selected samples may be subjected to complete chemical analysis.
5.7 In general, the greater the pumping rate, the
more responsive is the stress generated in the aqui- fer. While deciding the rate of pumping, the fol-
lowing points should be kept in mind :
a)
b)
Cl
d)
Pumping rate should be large enough
to produce significant drawdown in the observsation wells. The shorter the duration, the larger the pumping rate required to effect significant drawdown in the observation wells;
The maximum rate of pumping should be considerably less than the capac-
ity of the pump ;
The resulting drawdown should be
within the range of pump setting; and
Entrance velocity through the well
screens should not exceed 3 cm/s.
5.7.1 Before deciding about the rate of pumping,
trial runs with varying discharges (step drawdown
SP ( QAWSM ) 56 ; 1994
test) should be conducted and resultant response in the observation wells should be recorded. This
will give a fairly good idea about the rate required for conducting the test. As the stress to the aquifer
has to be applied at a constant rate, the discharge in the pumped well has to be maintained constant.
It is worthwhile to mention here the common causes of fluctuation in discharge so that continuous
monitoring of pumping rate is done to aviod such changes :
a) Pumping rate will tend to decline as pumping lift increase with increased
drawdown;
b) Internal combustion engine will change its rate of operation in response to
the change in temperature; and
c) Electric motor will change the rate of
rotation in response to fluctuation in voltage.
5.7.2 If pumping rate changes by 10 percent or more during the test owing to accidental causes or
negligence, the result of drawdown may contain
sufficient error to vitiate the test. All changes in the’ discharge rate should be promptly recorded so that water level changes may be accounted for. In such cases it may be necessary to rely on recovery
data. Under condition of erratic discharge rate, a reasonable estimate of average pumping rate should be made and only recovery data should be used for
computation.
5.8 If the test well used is a large diameter well, say a dug well, the diameters at various depths in
the zone of water level fluctuation should be re- corded to account for contribution of water from the storage in the well.
6 RECORDING AND PLOTTING OF DATA
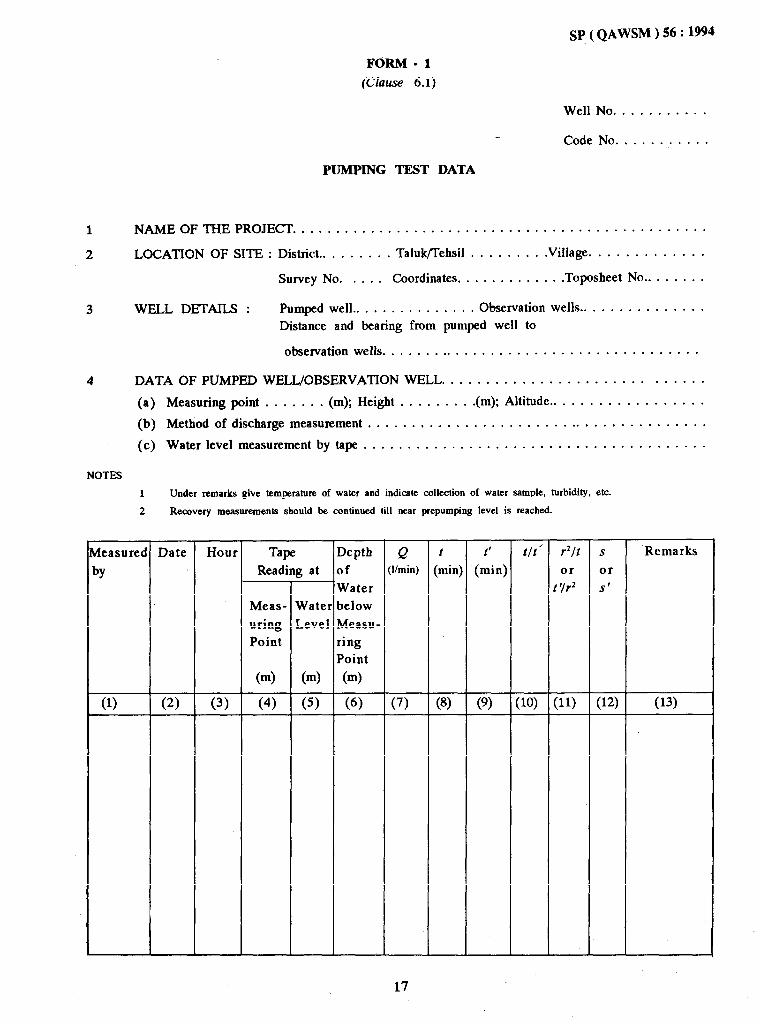
6.1 Data collected during aquifer test should be recorded in the type of From 1. Erratic water level measurements may be due to errors of measure- ment or fluctuations in pumping rate. These need to be corrected by immediate remeasurement. For measurements taken in the test well, errors due to partial penetration, vertical flow and entrance losses need to be corrected. In all the wells involved in the testing, errors in water level due to regional water level trend and barometric. effects should be nullified.
15

‘&J ( QAWSM ) 56 : 1994
6.2 Plots of log t versus s should be prepared as the test proceeds where t is pumping time in min-
utes and s is drawdown in nr (see Fig.1). Such plots ‘will give an indication whether it is a case of non-
leaky artesian aquifer, or leaky confined aquifer.
In unconfined aquifers, such plots will indicate if delayed yield phenomenon is occuring and how
‘long pumping needs to be continued.
6.3 Distanace drawdown plot should also be made and quantity of material dewatered in the cone of
depression for 1000, 2000, 3000 and 5000 minutes of pumping should be calculated and compared with the corresponding amount of water pumped. Recovery data may also be recorded and plots of
residual drawdown, s’ vs log r/t’ should be pre-
pared where t is the pumping time in minutes, t’ is the recovery time in minutes, r is the distance of
observation well from test well in m, S is the
drawdown in m, s’ is the residual and Q, is the discharge in Vmin.
draw down in m
CONE OF DEPRESSION
-a
FIG. 1 PUMPING TEST.
16
SP ( QAWSM ) 56 : 1994
FORM - 1
(Clause 6.1)
Well No. ..........
Code No. ..........
PUMPING TEST DATA
1
2
NAMEOFTHEPROJECT ................................................
LOCATION OF SITE : District ......... Taluk/Tehsil ........ .Village. ............
Survey No. .... Coordinates. ........... .Toposheet No ........
3 WELL DETAILS : Pumped well ............... Observation wells ...............
Distance and bearing from pumped well to
observation wells. ....................................
4 DATA OF PUMPED WELL/OBSERVATION WELL. ............................
(a) @I (c)
NOTES
1
2
Measuring point . . . . . . . (m); Height . . . . . . . . .(m); Altitude.. . . . . . . . . . . . . . . . .
Method of discharge measurement . . . . . . . . . . . . . . . . . . . . . . . . . . . . . . . . . . . . . . .
Water level measurement by tape . . . . . . . . . . . . . . . . . . . . . . . . . . . . . . . . . . . . . . .
Under remarks give temperature of water and indicate collection of water sample, turbidity, etc.
Recovery measurements should be continued till near prepumping level is reached.
r I T
1
I
1epth ,f
Water jelow
Measu- ing ‘oint
(m)
Q l/min) (L, (rZin)
t/t’ r2/t
or t ‘lr2
s
or s’
Remarks tieasured
‘Y
Date Hour Tape Readi
Meas-
uring Point
(m)
B at
Water
Level
(m)
(5)
c
I
rt
I
I
I
(7) (8) (9) :w
17
(11) (12) (13) (6) (1) (2) (3) (4)

SP ( QAWSM ) 56 3 1994
CHAPTER 3
WATER QUALITY
1 GENERAL
1.1 Groundwater is a complex chemical solution in dynamic state the composition of which de- pends on the solution of materials in soils and
rocks by percolating waters and chemical reac- tions between this water and the host medium. The chemical elements present are derived from pre-
cipitation, organic processes in soil and break- down of minerals in the rock through which ground-
water flows.
The major constituents in ground water normally
available are salts of calcium, magnesium and sodium (in the form of bicarbonates, sulpbates, chlorides, carbonates etc.) along with silica. The
other constituents which may be present are iron, potassium, nitrates, fluorides, boron and stron- tium, etc.
Tbe quality of groundwater tapped is important
from the viewpoint of its potability as well as its corrosion effect and incrustation potential. The
groundwater quality is determined on the basis of water quality standards for the anticipated pos- sible uses of the groundwater.
Another water quality variable which may affect
the movement, the chemical composition and the usability of groundwater is its temperature.
2 QUALITY OF DRINKING WATER
2.1 Tbe quality of drinking water-physical, cbemi- cal, bacteriological, virological and biological- has been comprehensively laid down in IS 10500 :
1991 which has drawn information from the stan-
dards prescribed by the World Health Organiza- tion and the Indian Council of Medical Research.
2.1.1 The Indian Standard categorises the cbarac- teristics of water as desirable and essential, pre- scribes the desirable requirements, the relaxation permitted in tbe absence of alternate source, and the adverse effects on health as well as water supply and distribution system if the prescribed desirable liniits are exceeded (see Table 1). The methods of sampling and tests for microbiologi-
cal, physical and chemical properties are prescribed
in IS 1622 : 1981 and IS 3025 : 1964.
2.1.1.1 Ideally, water should be free from coli- form organisms and fortunately groundwater, except
perhaps from very shallow aquifers, is generally free from pathogenic bacteria and viruses. Tbe objective in a drinking water scheme should be to ensure a coliform count of less than 10 per 100 ml but, more importantly to ensure the absence of
faecal coliform organisms. Tbe virus in water can
be inactivated by mixing 0.5 mg/l of free chlorine for one hour. If free chlorine is present in water,
active virus will generally be absent if coliform organisms are absent. If, however, free chlorine
residual is not maintained, the absence of coliform organisms cannot be assumed to imply freedom
from active virus. Tbe drinking water should also be free from microscopic organisms such as algae, zooplanktous, flagillates, parasites and toxin-pro- ducing organisms. An illustrative list of micro-
scopic organisms which may be present in water and their effect is provided in IS 10500 : 1991.
3 CORROSION EFFECT
3.1 The corrosivity of groundwater affects the cas- ing life and pump breakdown rate which ultimately has a bearing on the operating efficiency, reliabil-
ity and life of the well system. On a macro scale, corrosion may be due to the changes in chemical concentration of groundwater with depth, on a micro scale, it may be due to water lodged in small pores, cracks or bidden places like washers, couplings, gaskets etc., having dissolved oxygen. Besides, bacteria may cause metabolic1 corrosion.
3.1.1 In general, corrosion is more severe if :
a) groundwater is acidic or contains dissolved oxygen or salts especially chlorides, sulpbides and calcium;
b) groundwater temperature is high since
all chemical reactions proceed faster at higher temperature; and
18

c) entrance velocity of groundwater in the screen openings is high.
3.1.1.1 The following list of indicators of corro-
sive water can help the well designer recognize po- tentially corrosive conditions :
a)
b)
cl
d)
Low pH - If the water is acidic
(PH ~7.0) corrosive conditions are indicated.
Dissolved oxygen - If dissolved oxy- gen exceeds 2 ppm, corrosive water is indicated. Dissolved oxygen is likely to be found in shallow water-
table wells. It is difficult to deter- mine dissolved oxygen accurately.
Hydrogen sulphide - Presence of hydrogen sulphide can be detected readily from its characteristic rotten
egg odour. Less than 1 ppm can cause severe corrosion and this amount can be detected by odour or taste or lead acetate paper.
Total dissolved solids - If total dis- solved minerals exceed 1000 ppm, electrical conductivity of the water is great enough to cause serious electro-
SP ( QAWSM ) 56 :, 1994
lytic corrosion. To avoid this, well screens made of a single, corrosion- resistant metal are necessary.
e) Carbon dioxide - If free carbon di-
oxide exceeds 50 ppm, corrosive water is indicated.
f ) Chlorides - If chlorides exceed 500
ppm, corrosion can be expected.
4 INCRUSTATION POTENTIAL
4.1 Incrustation is caused by the precipitation of dissolved salts in the groundwater. The main pre-
cipitation products are carbonates of calcium and magnesium. The precipitation occurs with the in-
crease in pH around the screens as the water enters the well. The pH increases due to decrease in dissolved carbon dioxide content of groundwater which in turn is caused by a decrease in pressure head as water moves from aquifer to well. The
precipitation can also occur due to the decomposi- tion of bicarbonates of calcium and magnesium at high temperature prevailing in the ground water.
5 PROTECTION FROM CORROSION AND
INCRUSTATION
5.1 The measures for minimizing corrosion and incrustration are covered in Chapter 4.
19

Sp (QAWSM ) 56 : 1994
Table 1 Test Characteristics for Drinking Water
(Clause 2.1.1 )
SI No. Substance or
Characteristic
Requirement
( Desirable
Limit)
Undersirable Permissibk LJmit Methods of Remarks
Effect Outside in the Absence of Teat ( Ref
the Desirable Altelllstc source tols)
Limit
(1) (2) (3) (4) (5) (6) (7)
Essential Characteristics
9 Colour, Hazen
units, Mar
5 Above 5, consumer
acceptance dec-
reases
25 3025 ( Part 4 ) :
1983
ii) Odour
iii) Taste
iv) Turbidity,
NTU, Max
5
v) pH value 6.5 to 8.5
vi) Total hard-
ness (as CaCOJ
mg/i, Max
vii) Iron ( as Fe )
m@I, Max
Unobjec-
tionable
300
0.3
-
-
-
-
600
3025 ( Part 5 ) :
1983
3025 ( Parts 7
and 8 ) : 1984
3025 ( Part 21 ) :
1983
-
Above 5, consumer
acceptance dec-
*eases
10 3025 ( Part 10 ) :
1984
Beyond this range No relaxation
the water will
affect the mucous
nembrane and/
of water supply
system
3025 ( Part 11) :
1983
-
-
Incrustation in
water supply
structure and ad-
verse effects on
domestic use
Beyond this limit
taste/appearance
are affected, has
adverse effect on
domestic uses
and water supply
structures, and
promotes iron
bacteria
1.0 32 of 3025 : 1964 -
Extended to 25 only
if toxic substances
are not suspected,
in absence of alter-
nate sources
a) Test cold and
when heated
b) Test at several
dilutions
Test to be. conduc-
ted only after
safety has been
estabilshed
20

SP ( QAWSM ) 56 : 1994
Table 1 (Continued)
SI No. Substun or Requirement Undersireble Pemdssible Ihdt Methods of Remarks
Characteristic ( Desireble E&ct Outside intkeAbsenced Test ( Ref
Limit) the DesirebIt Alternate Source tols)
Limit
(1) (2) (3) (4) (5) (6) (7)
viii)
ix)
Chlorides ( as
Cl ) ms/r, Max
250 Beyond this limit, 1OCQ 3025 ( Part 32 ) : -
taste, corrosion 1988
and palatibility
are affected
Residual, free
chlorine,
0.2 - -
mg/l, Min
3025 ( Part 26 ) :
1986
To be applicable
only when water
is chlorinated.
Tested at amsu-
mer end. When
protection against
vital infection is
required, it shot&
be Min 0.5 mg/l.
Desirable Characteristics
Jo Dissolved solids
mgA, Max
xi) Calcium (as Ca)
mUI, Mar
xii) Copper (as Cu)
mti, Max
xiii) tinganese (as
W) meJ1,
Max
500 Beyond this pala- 2000 _ 3025 ( Part 16 ) :
tability decreases 1984
and may cause
gastto-intestinal
irritation
75 Encrustation in
water supply
structure and ad-
verse effects on
domestic use
200
0.05 Astringent taste,
discoloration and
corrosion of
pipes, fitting and
utensils will be
caused beyond
this
1.5
3025 ( Part 40 ) :
1991
36 of 3025 : 1964
0.1 Beyond this limit
taste/appearance
ate affected, has
adverse effect on
domestic uses
and water supply
structures
0.3 35 of 3025 : 1964 -
-
-
21

SP ( QAWSM ) 56 :‘ 1994
Table 1 (Continued)
SI No. Substance or Requirement Undersirable Permissible Ltmit Methods of Remarks
Characteristic ( Desirable Effect Outside la the Abseace of Test ( Ref
Limit) the Desirable Altermate Source toB)
Limtt
(1) (2) (3) (4) (5) (6) (7)
May be extended
up to 400 provided
(as Mg) does not
exceed 30
xiv) Sulphate (as
SO, ) mg/l,
Max
200 Beyond this causes 400
gastro intestinal (see co1 7)
irritation when
magnesium or
sodium are per-
sent
Beyond this metha- 100
3025 ( Part 24 ) :
1986
xv>
xvi)
Nitrate (as
NOJ mg/l,
Max
45 3025 ( Part 34 ) :
1988
1.5 23 of 3025 : 1964
emoglobinemia
takes place
Fluoride may be
kept as low as
possible. High
fluoride may
cause fluofosis
Beyond this, it
may cause ob-
jectionable taste
and odour
Beyond this, the
water becomes
toxic
Beyond this, the
water becomes
toxic
Beyond this, the
water becomes
toxic
Beyond this, the
water becomes
toxic
Beyond this limit,
the water be-
comes toxic
Beyond this limit,
the water be-
comes toxic
1.0 Fluoride (as F)
mg/l, Max
0.001 0.002 54 of 3025 :1964 xvii) Phenolic com-
pounds (as
C,H,OH)
mgil, Max
Mercury (as
Hg) mti,
Max
xviii)
xix)
xx)
xxi)
xxii)
xxiii)
0.001
0.01
0.01
0.05
0.05
0.05
No relaxation (see Note) Mer-
cury ion analyser
No relaxation (see Note)
No relaxation 28 of 3025 : 1964
No relaxation 3025 ( Part 37 ) :
1988
No relaxation 3025 ( Part 27 ) :
1986
No relaxation (see Note)
To be tested when
pollution is suspec-
ted
Cadmium (as
Cd), mg/l.
MU
To be tested when
pollution is suspec-
ted
Selenium (as
Se) mg/l,
Max
To be tested when
pollution is suspeo
ted
Arsenic (as As),
mgil, Max
To be tested when
pollution is sus-
pected i
ji !! Cyanide (as
CN), mg/l,
Ml?*
To be tested when
pollution is sus-
pected
Lead (as Pb),
mgA, Max
To be tested when
pollution/plumbo-
solvency is suspec-
ted
22

SP ( QAWSM ) 56 :,1994
Table 1 (Continued)
SI No. Substance or Requirement Under&able Pemdssible Limit Methods of Remarks
Characteristic ( Desirable Effect Outside in the Absence of Test ( Ref
Limit) the Desirable Alternate Source to IS )
Limit
(1) (2) (3) (4) (5) (‘5) (7)
,
xxiv) Zinc (as Zn), 5 Beyond this limit
mg/l, Max it can cause as-
tringent taste
and an opales-
cence in water
xxv) Anionic deter- 0.2 Beyond this limit
gents (as it can cause a
MBAS ) light froth in
mgil, Max water
xxvi) Chromium (as 0.05 May be carcino-
Ct? mg/l, genic above this
Max limit
15 39 rf 3025 : 1964 To be tested when
pollution is suspected
1.0 Methylene-blue
extraction me-
thod
To be tested when
pollution is sus-
pected
No relaxationn 38 of 3025 : 1964 To be tested when
pollution is sus-
pected
xxvii) Polynuclear aro-
matic hydro-
carbons (as
PAW g/l*
Max
May be carcino-
genic
xxviii) Mineral oil
mg/l, Max
0.01 Beyond this limit
undesirable taste
and odour after
chlorination takes
place
Toxic
0.03
0.001
Gas chromatogra-
phic method
- :
To be tested when
pollution is sus-
petted
xxix) Pesticides mg/l, Absent
Max
-
xxx) Radiactive
materials:
a) Alpha emti-
ters Bq/l,
MllX
b) Beta emit-
ters pci/l,
MlZX
58 of 3025 : 1964
0.1
1
- - -
- - \ -
xxxi) Alkalinity mg/l, 200
MUX
Beyond this limit
taste. becomes
unpleasant
600 13 of 3025 : 1964 -
23

SP(QAWSM)!I6:1994
Table 1 (Concluded)
SI No. Substanoe or
Characteristic
Requirement
( Deslrable
Limit)
Undesirable Permissible Limit Methods of Remarks
Effect Outside in the Absence of Test ( Ret
the Desirable Alternate Source to IS )
Limit
(1) (2) (3) (4) (5) (6) (7)
xxxii) Aluminium (as
AI). wh
Max
0.03 Cumulative effect
is reported to
cause dementia
0.2 31 of 3025 : 1964 -
xxxiii) Boron, mg/l,
Max
1 - 5 29 of 3025 :1964 -
NOTE - Atomic absorption spectrophotometric method may be used.

SP (QAWSM ) 56 : 1994
CHAPTER 4
CORROSION AND INCRUSTATION
1 GENERAL
All natural waters, generally speaking, are either corrosive or incrusting or both. Management of corrosion and incrustation attacks on various well components, therefore, is a major concern in en- suring reasonable life of the well system.
2 CORROSION
2.1 Corrosion is an electrochemical process which causes the destruction of metals. Corrosion of well screens, casing and, pumping equipment installed in wells can, therefore, severely limit the life of the well installation.
2.2 Corrosion may act in the following three ways in the well system :
a) Enlargement of screen openings due to their dissolution in water followed by sand pumping failure;
b) Strength reduction followed by col- lapse of well screen or casing; and
c) Deposition of corroded products, fol- lowed by screen blockage.
2.3 The corrosion in screen is more critical than that of the casing since a small enlargement of the screen opening is required for the entry of sand through the screen, while the full thickness of casing metal must be penetrated for the failure of a well.
2.4 Foms of Corrosion - Over the years, certain well-defined forms of corrosive attack on metals have been observed. The commonly identified fOlmS of corrosion are :
a)
b)
General corrosion or uniform loss of metals such as attack 6n well screens, leaves the slots enlarged and the strength of the screen reduced to withstand the operating conditions;
An assessment of undergroud corrosion may be made in accordance with the procedure laid down in IS 7808 : 1975.
2.6 Rate of Corrosion
De-alloying or loss of one element of The mte at which corrosion takes place depends on
an alloy, leaving the structure in its several environmental factors like acidity of ground-
original shape but in a spongy and water, dissolved oxygen, carbon dioxide, hydio-
weakened condition; it is deceptive gen sulphide, total dissolved solids, velocity of
c)
d)
e)
f)
t3)
in appearance and failure occurs
suddenly in brass screen and other pump components; graphitization of cast iron is frequently associated in the well;
Galvanic corrosion in which a gal- vanic cell near the junction of two different metals immersed in water is set up for the corrosion to occur.
Pitting corrosion in which highly lo- calized attack and perforation with little loss of metal in water takes place;
Stress corrosion in which cracking is induced at highly stressed areas.
Crevice Corrosion which is corro- sion in crevices, sockets, and under gaskets or washers; and
Bacterial corrosion caused by both aerobic and anaerobic bacteria; the sulphate-reducing bacteria utilize sulphate (SO,) as the preliminary energy source; the sulphate-reducing bacteria require anaerobic environ- ment for optimum metabolic activity and are inhibited by the presence of aerobic bacteria; iron bacteria may also cause corrosion; they grow best at low temperatures and in water with 0.3 to 9.0 ppm dissolved oxygen; they are commonly found in wells con- taining soluble iron salts.
25 Assessment of Comosion
25

SP ( QAWSM ) 56 ~1994
ground water over areas being corroded, electro- lytic effect, formation of protective films, tem- perature of groundwater, etc.
2.7 Corrosion Control
In wells, where corrosion is a critical problem, standard effective counter measures are difficult
to suggest. Many of the methods, although suc- cessful in above ground structures, may not be as effective for well structures such as screens, casing, pumping equipment, etc.
2.7.1 The preventive measures that are avail-
able are :
a) The use of corrosion resistant alloys and materials like UPVC screens and
casing pipes;
b) The use of protective coating, non-
metallic coating and/or lining mate- ria 1s;
c). Grouting of the annular space around
the casing. Although recommended
for providing a sanitary seal, grout- ing may be done through the entire
length of casing to protect the metal casing from corrosion attack;
d) The injection of chemicals to condi- tion the corrosive water and to treat the surface of metal - various alka-
line substances for pH control, in- hibitiors and preferential wetting agents; and
e) Cathodic protection, although not normally suitable for protection of internal surfaces, could be more widely used for the irradication of external casing attack [ see IS 8062 (Part 1): 19761.
3 INCRUSTATION
3.1 Incrustation is defined as any clogging, cementation or stoppage of a well screen and water- bearing formation in the vicinity of the well result-
ing from accumulating of extraneous materials in the openings or voids of the well screen and water-
, bearing formation. This may occur regardless of
the material used in the screen or the type of well construction.
3.2 Water quality has much to do with the oc-
curence of incrustation. The kinds and amounts of dissolved minerals and gases in natural waters detemine their tendency to deposit some of the
mineral matters as incrustation. Deposition of
even a minute fraction of the minerals present in water causes serious clogging. Chemical anaysis of water ought to indicate the type of incrustation that might occur and the rate at which it might be
expected to be deposited. The quality of water
tnay change slowly as the well is used depending
on geologic and hydrologic conditions of the area and, therefore, chemical analysis would be useful if done periodically.
3.3 Incrustation is often a hard, brittle, cement- like deposit but under different conditions it may be soft and pasty. The causes of incrustation in the
order of frequency of occurence are :
a) precipitation of minerals carried to
the screen in solution like carbonates
of calcium and magnesium,
b) presence of iron bacteria or other slime-forming organisms, and
c) deposition of soil materials, such as clays, silts etc, carried to the screen in suspension,
Incrustation is usually of the first type and the chief incrustating agent is carbonate-principally of calcium. Other substances such as aluminium silicates and iron compounds may also be en-
trapped in the scale-like carbonates which cement the sand grains together around the screen. Water can dissolve appreciable amounts of calcium car-
bonate and other carbonate salts depending on the amount of dissolved carbon dioxide in the water. The capacity of water to hold carbon dioxide in solution varies with pressure, when water is pumped from a well, the hydrostatic pressure around the well decreases and carbon dioxide is released from water. The water is unable to carry its full load of carbonates, the excess being precipitated adjcent to the well screen.
3.3.1 Just as a change of pressure results in pre-
26

SP ( QAWSM ) 56 : 1994
cipitation of carbonates, a change in pH may result in the formation of iron and manganese hydrox- ides. These hydroxides are jelly like. The hy- drated ferrous oxide is a black sludge where as
ferric oxide is reddish brown like common rust. The insoluble manganese oxide is also a black or dark brown substance.
3.3.2 In case of depression surrounding a pump-
ing well, air may enter the voids and initate the corrosion of well structures. If pumping is started and stopped intermittently, a corrosion product mainly consisting of iron oxide builds up progres- sively reducing the space in this part of the forma-
tion.
3.3.3 The production of slime is a result of the life cycle of the organisms and iron is changed to insoluble oxides by the iron bacteria in particular.
3.3.4 The stoppage resulting from clay and silt is likely to happen where screen openings are too small, well has been improperly developed or fin- ished, or where the aquifer contains an abnormal amount of these fine materials.
3.4 Incrustation Control - No means of entirely preventing the incrustation of well screens have been found. However, the process of incrustation may be delayed and the severity of incrustation may be reduced by adopting the following meas- ures :
a> The well must be developed thor- oughly so as to permit water to enter the well with least possible resis- tance,
b) The well screen should have the maximum possible inlet area to re- duce the entrance velocity to a mini-
mum,
c) The pumping period may be increased. This produces benefits since the
drawdown is decreased and, in any
case, the most economical operation of both pumps and wells is obtained
when pumping is as continous as prac-
ticable,
d)
e)
f 1
The pumping load may be divided among a larger number of wells in- stead of pumping one or few large wells at excessive rates. A group of
slightly smaller wells properly spaced
can develop the full yield of the aquifer more efficiently. Velocities in the formation near each well are materi- ally reduced and the drawdown in
each well is decreased,
Since excessive available oxygen is involved in incrustation, downhole packers or vacuum seals may be used to isolate the aquifer from atmos- pheric oxygen if the pumping level is
considerably above the top of the well intake area. This would be
applicable for water table wells in unconsolidated sediments, and
A periodic maintenance or cleaning procedure should be practised when- ever local experience shows high incrustation. A drilling rig may be used for cleaning a tubewell section by section using a scraping equip- ment such as steel wire brush attached
to the drilling rod which revolves in the portion of slotted pipes or screens.
27

SP (QAWSM ) 56 : 194
CHAPTER 5
WELL SITING AND CONSTRUCTION
1 GENERAL 3 SITING OF INDIVIDUAL WELLS
1.1 The geologic conditions dictate two general
types of well construction. A well that taps an aquifer of consolidated rock consists basically of a cased portion, usually extending through the
loose overburden material, and an open borehole in the below. A well that taps an aquifer of water- bearing sand must necessarily be provided with a casing through the overburden materials and a
well screen in the aquifer proper.
3.1 A well should be so located that it is accessible
for pump repair, cleaning, treatment, testing and
inspection. The top of the well should not be within the basement. When adjacent to a building,
the well should at least be 60 cm outside any
projection.
It is convenient to think of well construction in
terms of four or five distinct operations. These
include drilling, installing the casing and screen, grouting to provide sanitary protection, and devel- oping the well to ensure sand-free operation at
maximum yield.
2 TYPES OF TUBEWELLS
2.1 Cavity Wells
Cavity wells are generally shallow tubewells drilled
in alluvium formations (see Fig. 1A and 1B). These are wells with casings resting in a thick, hard, im- pervious clay layer above the aquifer. It is a pre- requisite that the impervious clay layer, should be of adequate thickness to support the well and should
not disintegrate when water is pumped out.
3.2 The well should be located on the highest
ground practicable. It should certainly be on a ground higher than nearby sources of pollution; the ground surface at the well site should be built
up when necessary so that the surface water will drain away from the well in all directions. hslini- mum distances from a well to possible sources of pollution should be large enough to prevent sub-
surface flow or seepage of contaminated water from reaching the well. Recommended minimum distances from various types of pollution sources are listed below :
2.2 Tubewells
Cesspool receiving raw sewage 30m
Seepage pit or drain field 25m
Septic tank or tightly joined sewer 15m
3.2.1 These distances are meant to be guides to good practice and may be varied as soil and other conditions require. They should be applied only where the soil has a filtering capacity equal to, or better than that’ of sand.
These are wells constructed in unconsolidated for-
mations to tap water bearing formations. These
wells have a casing extending through the overbur- den and an intake section comprising screen pipe,
with or without gravel packing in the water bear- ing formations (see Fig. 2).
4 METHODS OF DRILLING
2.3 Borewells (in Hard Rock Formations)
The overiburden in such a well is encased to elimi- nate the risk of caving in. Drilling is further carried out in rock formations and the bore is usually,, left unsupported open to allow the water to flow from the crevices and fissures into the bore (see Fig. 3).
4.0 There are numerous methods of drilling wells
and each method has advantages related to ease of construction, cost factors, character of formations
to be penetrated; well diameter and depth, sanitary protection and intended use of the well itself. The
basic principles of some of the methods are de- s&bed here which give some ideas of the limits of practical use under various combinations of condi- tions.
4.1 Percussion Drilling
The percussion method, often referred to as cable
tool method, is one of the oldest, most versatile
28

SP ( QAWSM ) 56 : 1994
P UjO LEVEL
F ND LEVEL
NT CONCRETE
BLANK PlPE
WATER
I -
WTY
Fro. 1A CAVITY WELL ( FOR CBNTRIPUOAL PUMP ) FIG. 1B CAVITY WELL ( FOR TURBINB SUBMERSIBLE PUMP )
FlG 1 CAvnY wcu
29

SP (QAWSM-) 56 : 1994
SND EVE1 PP
PIPE
EVEL
- - 5: -z-- c&Y z - -_
-- --- -- -- ‘* -- -a
MEDIUM .: :*.. . . = , . . . .
., z ‘,.,.,.
So;::; =,=:$>.$4;
-- _- --
cLAy_ - _-_- CO/qRcjE
BAIL
s#; ,:
*
: ‘. : : ’ =I= .:y;; l ‘.
-- --
cLpz,-- --* -- --_ ---‘-__.
PLUG
FIG. 2A TUBBWELL ( NATURAL GRAVBL PACK )
m LEVEL *EL FEED PPE
,,,,
CL.
.‘....,
BAIL PLUG i.:.:!,
-y$jg
--- CLAY -
--.
.‘-: . . . ,w WATER LEVEL
CASING -
7 UNCONSOLIDATED
FORMATlON
Fm. 2B TUBBWBLL ( ARTIPICIAL GRAVEL PACK 1
FIG 2. Tusr WELL
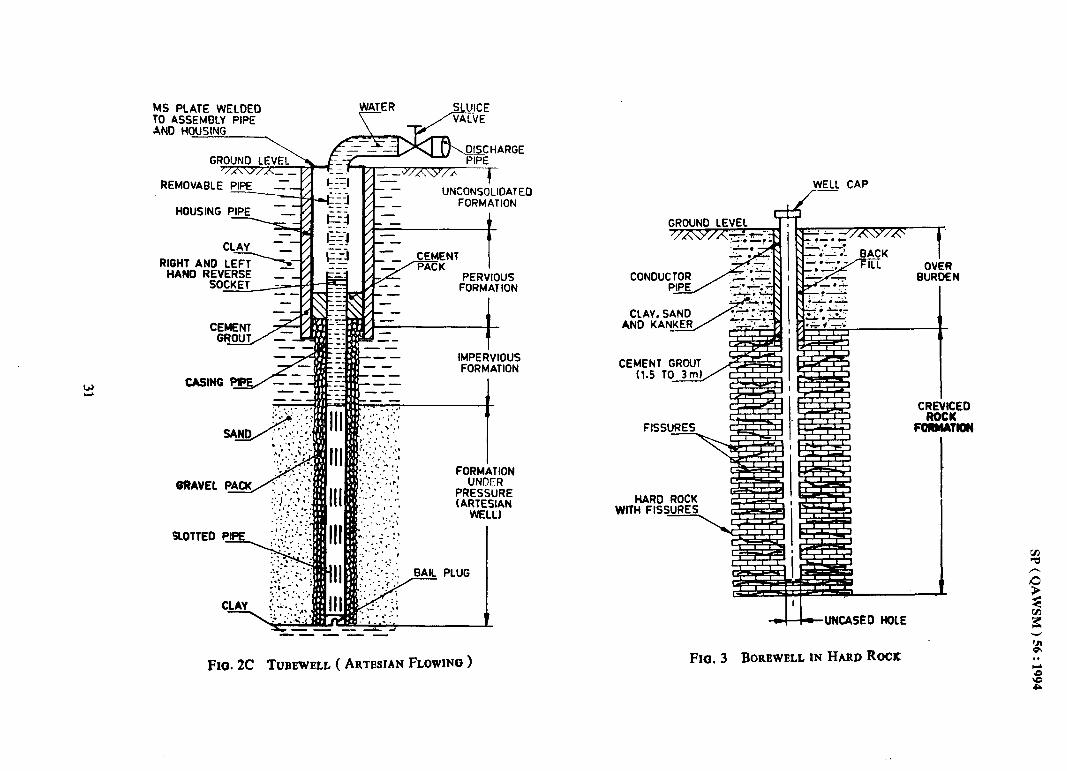
MS PLATE WELDED j”lAJER J&lJCE VALVE TO ASSEbiBLY PIPE
AN0 HOUSING
REMOVABLE PIPE
HOUSING PIPE --
WE CAP
-I/-
-- UNCONSOLIDATEO - -- FORMATION
GROUND LEVEL
I PERVIOUS
-_ FORMATION
CLAY, SAND . .._ .*. . ..*rm
_&_
-- --- m-m -- ,- -
IMPERVIOUS FORMATION
I
ANV KANW
CEMENT GROUT (1.5 TO 3m,/ip; 1
A- w
FISSURES
4
FORMATION UNDER
PRESSURE (ARTESIAN
WELL)
HARD ROCK WITH FISSURES
. . . . . ...\ 7 : . ::
. ..b :
..-:: ,
L-- UNCASED HOLE
FIG. 3 BOREWELL IN HARD ROCK FICL 2C TUBEWELL ( ARTESIAN FLOWINO )

SP (QAWSP) 56 r1994
and simplest drilling methods. A string of tools suspended on a cable is given up and down spud- ding motion either manually of by power. The string of tools, in ascending order, consists of a bit,
a drill stem, drilling jars and a swivel socket which is attached to the cable. The bit strikes the bottom of the hole, crushing, breaking and mixing the cuttings. Above the water table or in otherwise
dry formations, water is added to dissolve the cuttings which are lifted out by means of a bailer.
In consolidated rock, an open hole can be drilled,
but in unconsolidated formations, steel casing pipe with drive shoes is driven down the hole as drill-
ing progresses. The casing must closely follow the drill bit as the well is deepened in order to prevent
caving and keep the borehole open.
4.1.1 This method is most suitable for drilling in
stratum where large boulders are encountered in abundance at different depths. The drilling is started with a large diamter casing and continued as long as it keeps driving smoothly. When the casing does not drive in freely, drilling is continued with the next smaller diameter casing.
4.1.2 In unconsolidated formations, the vibrations, as the casing is driven in, cause the sides of the borehole to collapse against it and get compacted. Frictional forces increase until it is no longer pos- sible to drive the casing. When this occurs, a smaller diamter casing is telescoped inside the casing already in place and drilling continued. In
deep holes, as many as four or five reductions may be required.
4.1.3 The drilling motion must be kept in step with the gravity fall of the tools for good opera- tion. Variable factors interfere with the gravity fall and the motion and speed of the machine must be adjusted with the cycle of the tool travel. Care should be taken not to hammer the casing pipe, if
used, unnecessarily giving rise to the possibility of getting stuck because extraction may be difficult and at times impossible. The casing should be turned frequently to prevent it from getting stuck.
4:1.4. The major drawback of this method is its slower rate of progess and depth limitations. The capacity of the drilling rig depends on the weight of tools which it can handle safely. Tool weight is determined largely by the diameter of the bit and
the diameter and length of drill stem. However, as the hole is deepened, the rig must support more and more cable weight also. The percussion drill- ing can economically drill maximum diameters of
60 to 75 ems and depths upto 600 m.
A further disadvantage of percussion drilling is
that the necessity of driving casing coincident
with drilling in unconsolidated formations pre-
cludes the use of electric logs. The obvious advan- tages of percussion drilling are its suitability in
rugged terrains; the rigs are inexpensive, simple
and compact requiring less accessory equipment
and are more readily moved. They require less skilled operators and their ease of repair is advan- tageous in isolated areas.
Percussion drilling also permits acquisition of quali- tative data on the water bearing characteristics an+ static heads of various formations as casing is
being driven. Water quality data can be obtained by bailer samples as each formation in turn is opened to the bottom of the casing and upper
formations are cased off.
4.2 Rotary Drilling
The rotary drilling method is becoming the most
effective and widely practised of all drilling sys- tems. The two key items in rotary drilling method are the bit and the drilling fluid. Both are indis- pensable in cutting and maintaining the borehole.
All of the components that make up the rotary drilling machine are designed to serve simultane- ously these two functions-operation of the bit and continuous circulation of the drilling fluid.
4.3 Direct Circulation Drilling
The rotary rig drills by mechanical rotation of a
drill bit at the bottom of a string of drill pipe. The typical string consists of a bit which scrapes, grinds, fractures or otherwise breaks the formation drilled; a drill collar of heavy walled pipe to maintain a straight hole; and a drill pipe which extends to the surface and imparts rotation to the bit. As the bit is turned drilling fluid (usually bentonite mixed with other suitable material) is circulated under pressure which lubricates and cools the bit, carries the cuttings in suspension to the surface and plas- ters the wall of the hole to prevent caving in.
32

SP ( QAWSM ) 56 : 1994
4.5 Down-the-Hole (DTH) Hammer Drilling The rotary rig costs more than the percussion rig; larger and much more training and skill are needed. Maintenance and repair are more complex and more water is required for drilling when using
drilling fluids. If the permeability of the aquifer is high, drilling fluid may invade it. Despite these disadvantages, the direct rotary rig offers rela- tively rapid drilling in most fomrations, greater
depth capacities and an open hole which simplifies installation of casing, screen and grout and per- mits the use of most geophysical logging equip- ment.
It is best suited for drilling small diamter deep wells in soft to medium alluvial formations.
4.4 Reverse circulation drilling
The reverse circulation rotary rig operates essen- tially in the same way as a direct rotary rig except that water is pumped up through the drill pipe rather than down through it. A string of drill pipes with a drill bit at the bottom is rotated by mechani-
cal means. Plain water or a drilling fluid, depend- ing on the strata conditions, is allowed to flow into the borehole; the drill cuttings along with water are sucked through the drill pipes by a centrifugal pump and thrown into a settling pit. As the diame- ter of the drill pipe is relatively small the velocity of the drilling fluid in it is high. It is therefore able
to carry even large pieces of broken rock, stones etc. The strong upward flow in the drill pipe has another advantage. There is no need to use a heavy
drilling fluid for bringing the cuttings to the sur- face and clear water can be used. The clogging of aquifer around the well is also avoided.
The reverse circulation drilling rig is probably the most rapid equipment available for unconsolidated formations. The strong suction at the end of the drill pipe is sufficient to loosen the material; a slow rotation of bit is all that is needed to achieve rapid progress. Because of the large hole diame- ters reverse circulation drilled holes are usually gravel packed. Large diameter wells can be drilled in alluviam formations by this method. The hole
remains intact under the hydrostatic pressure of the drilling fluid. It has to be ensured that the head of the drilling fluid in the borehole is sufftciently larger than the head of water in the aquifer.
It is accomplished by a tool called the down-the- hole hammer which is essentially a pneumatic
hammer operated at the lower end of the drill pipe and combining the prcussion and the rotary ac- tions. The method utilizes compressed air for the
rapid impacting action given by the hammer to the bit, thus crushing the formation into small chips which are flushed out through the annular space between the bore and the drill pipes by the up coming compressed air. The machine should,
therefore, be fitted with a compressor capable of
producing return velocity of 915 to 1 220 m/min.
The method is used for fast and economical
drilling of small bore (200 mm max) in medium
hard to hard rock formations.
4.6 Water Jet Boring
A water jet is used for drilling the well which implies that a drill bit with nozzles is attached to the drill pipes at the bottom through which water
is pumped at high pressure. The water on its return flows through the annular space between the bore and the drill pipe and brings out the cuttings along with it to the surface. Casing pipe is simultane-
ously used to avoid caving in. The nozzle can sometimes be used as a drilling bit in harder for- mations. The method is suitable for drilling shal- low wells in loose sandy formations (see Fig. 4).
4.7 Calyx Drilling
A bit made from steel tube with two inclined slots called ‘shot bit’ is connected below another tube (core barrel) which is further connected to the drill rods. These are rotated mechanically. Chilled shots are fed to the bottom of the bit through the drill string alongwith water. These are ground by the shot bit to fomt abrasive materials with sharp edges which cuts into the consolidated formation
forming an annular ring to form a core inside the core barrel, which is then taken out from well by grouting the core with quartz chips, etc. This method is successful for shallow tubewells drill- ing in consolidated formations with large diameter holes.
33

SP ( QAWSM ) 56 : 1994
WEIGHT ROPE TO NG DRUM OR SPOOL
ROD ROPE ISTING DRUM’
ROPE SUPPORTING -I onnc
OR WRENCH FOR
SWIVEL
ROPE HOSE TO
CASING
-! DRILL PIPE DR
DRIVE SHOE
E ORILL
/ POOL TO SUPPLY PUMP
FIG. 4 SIMPLE JETIING RIG
34

SP (QAWSM ) 56 : 1994
5.1 Clnssifxatioa 4.8 Auger Drilling
The drilling is done with a spiral or worm auger connected to square rods turned manually with rod tillers. The cuttings produced as a result of drill- ing are removed with a sand shell. Steel casing pipes with drive shoes at the bottom are lowered as the drilling progesses. This method is employed where very shallow drilling in alluvium formation is involved (see Fig. 5A and 5B).
5 SELECTION OF DRILLING RIGS
5.0 The recommendations for selection of drilling rigs include the suitability aspects of different types of drilling rigs for their proper selection for drilling water wells and bore holes in different geological formations.
Based on diameter of hole, depth of hole and the size of drill rod used, the drilling rigs shall be classified into light. medium and heavy duty as specified in Table 1.
The tool weight at the surface for percussion (cable tool) type of drilling rig of light, medium and heavy classes shall be 1135 kg, 1735 kg and 2 315 kg respectively.
5.2 Selection
Based on the formation to lx encountered during drilling, the diameter and depth of the borehole/ well, the recommended class of drilling equipment and the size of drill rod to be selected for drilling is given in Table $
FIG. SA HAND AUGER FIG. SB SPIRAL AUGER OR RAM’S HORN
35
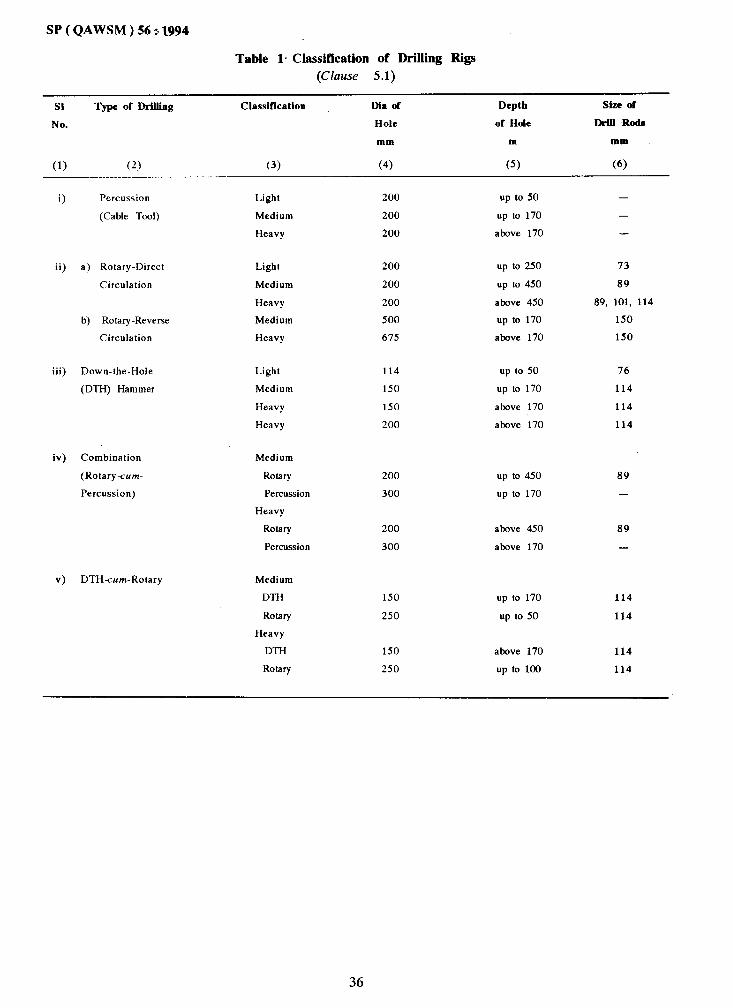
SP ( QAWSM ) 56 :, 1994
Table 1. Classification of Drilling Rigs
(Clause 5.1)
SI
No.
(1)
Type of Drilling Classification
(2) (3)
Ma of Depth she of
Hole of Hole Drill Rod8
mm m mm
(4) (5) (6)
i) Percussion
(Cable Tool)
ii) a) Rotary-Direct
Circulation
b) Rotary-Reverse
Circulation
iii) Down-the-Hole
(DTH) Hammer
iv) Combination
(Rotary-cum-
Percussion)
v> DTHcum-Rotary
Light 200 up to 50 -
Medium 200 up to 170 -
Heavy 200 above 170 -
Light 200 up to 250 73
Medium 200 up to 450 89
Heavy 200 above 450 89, 101, 114
Medium 500 up to 170 150
Heavy 675 above 170 150
Light 114 up to 50 76
Medium 150 up to 170 114
Heavy 150 above 170 114
Heavy 200 above 170 114
Medium
Rotary
Percussion
Heavy
Rotary
Percussion
Medium
DTH
Rotary
Heavy
DTH
Rotary
200
300
200
300
150
250
150
250
up to 450
up to 170
above 450
above 170
up to 170
up to 50
above 170
up to 100
89
-
89
-
114
114
114
114
36

SP ( QAWSM ) 56 : 1994
Table 2 Recommendations for Selection of Drilling Equipments
(Chse 5.2 )
SI
No.
(1)
Formalion size of wet Boreholelwell Type Class Y Size oi
Diameter Depth Drill Rods
mm 111 mm
(2) (3) (4) (5) (6)
9
ii)
iii)
iv)
v)
Consolidated formations 114 up to 50 DTH Light 76
like hard sandstone, lime- 150 up to 170 DTH Medium 114
stone, Trap, Basalt, 150 above 170 DTH Heavy 114
Quartzite, Granite, etc. 200 above 170 DTH Heavy 114
Semi-consolidated
formations :
a) Sandstone, Clay, Shale 200
200
200
200
200
up to 250 Rotary-Direct Circulation
up IO 450 Rotary-Direct Circulation
up to 450 Rotary-Direct Circulation
Light
Medium
Heavy
Medium
Heavy
Heavy
73
89
89,101,114
b) Bouldery
Semiconsolidated and
Bouldery formation
Unconsolidated
formation
Soft alluvial, clay,
gravel small (upto 125
mm size) cobbles formation
150
200
500 up to 170 Rotary-Reverse-Circulation Light 150
675 above 170 Rotary-Reverse-Circulation Medium 150
up to 170
above 170
up to 300
up to 250 Rotary-Direct-Circulation Light 73
up to 450 Rotary-Direct-Circulation Medium 89
above 450 Rotary-Direct-Circulation Heavy 89
Percussion (Cable tool)
Percussion (Cable tool)
Rotary-cum-Percussion
-
-
89
37

SP ( QAWSM ) 56 : 1994
6 INFORMATION TO BE FURNISHED BY THE OWNER OF THE TUBEWELL
The owner shall furnish the following information
to the drilling agency :
a)
b)
cl
e)
f 1
Information regarding tubewells and dug wells, existing near his land. Their depth, formation encountered and discharge, etc. may be furnished as far as possible;
Static water level;
Expected yield;
Purpose for which the water is needed, such as irrigation, industrial or do-
mestic purpose, etc; and
Any other information.
7 INFORMATION TO BE FURNISHED BY DRILLING AGENCY
7.1 When ‘offering to sink a tubewell, the drilling agency shall furnish the owner with the following
information :
a) Suitability of the site proposed by the
owner (if a more suitable site, other
b)
cl
d)
e)
f )
g)
h)
than the one proposed by the owner is available, it should be suggested);
Whether a test bore hole is proposed
and if so, its diameter and depth, and also depth of production tubewell
proposed;
Likelihood of increase or decrease of
the depth given at (b) above;
Method of drilling with size of bore
in different depths;
Types of plain pipe with size, wall
thickness and slotted/strainer pipes openings, may be mentioned;
Guarantee with regard to the verti-
cality of tubewell and sand content (ppm) in the discharge from the well at the time of handing over;
Development methods to be adopted
may be stated; and
Any other infomration and conditions.
7.2 The drilling agency should furnish informa- tion to the owner on completion, as given in
Fomr 1.
38

SP ( QAWSM ) 56 : 1994
3.
4.
5.
6.
7.
8.
9. Lithological data
10.
11.
13.
14.
15.
Form 1
( Clause 7.2 )
INEORMATION TO BE FURNISHED BY DRILLING AGENCY TO OWNER ON COMPLETION OF TUIIEWELL
Agency drilling the tubewell. ...............................................
Location of the tubewell ..................................................
Method of drilling adopted. ................................................
Date of starting. .........................................................
Date of completion. .....................................................
Pilot hole or test hole ........ .Bit size. ........... .Bit type. ....................
Hours.. ............ ..From.................to ........................
Coring done. ............ .Bit size .............. .Bit type. .......... Hours .....
Recovery. .................. .From ......... to. ............................
Reaming. ............. .Bit size. ........... .Bit type ............... Hours .....
Frotll..............................to ..................................
From To Formations
. . . . . . . . . . . . . . . . . . . . . . . . . . . . . . . . . . . . . . . . . . . . . . . . . . . . ..*.......
, ., . . . . . . . . . . . . . . . . . . . . . . . . . . . . . . . . . . . . . . . . . . . . . . . . . . . . ..I....
Assembly of production well ................. Size. .......... Length. ... ..Typ e ....
Perforation per metre. ......................................................
Housingpipe ............................................................
Blind pipe.. ............................................................
Strainer ................................................................
Bailplug.....................................: .........................
Top of tubewell above/below ground level. .......................................
Size of gravel. ...................... Quantity used before development ............
Quantity used during development. .............................................
Method used for development .................................................
Total hours of testing . . . . . . . . . . . . . . . . . . . . . . . . . . . . . . . . . . . . . . . . . . . . .
Further details appeneded :
a) Samples of strata, neatly packed in sPqle bags
b) Chart of pipe assembly lowered c) Results of mechanical analysis of samples of unconsolidated strata.
Remarks :
Owner . . . . - . . . . . . . . . . ., . . . . Driller. . . . . . . . . . . . . . . . . . . . . . .
39
. . . . . . . .
. . . . . . . .
SP ( QAWSM ) 56 : 1994
CHAF’TER 6
WELL
1 GENERAL
Well casing in a pipe is used to prevent caving in of surrounding soil into the well or bore-hole. The
upper portion of the casing, used for housing the pumping equipment, is called housing pipe. The casing may be temporary and removed on comple- tion of the well (drive pipe) or it may be a perma-
nent part of the structure. The length and diameter
of the casing pipe is selected on the basis of static water level, drawdown, discharge expected from the pump and the size of pump to be installed.
2 STEEL TUBES
2.1 Steel tubes most suitable for varied type of
water well drilling operations - either casing or drive - are those made to IS 4270 : 1992. The
tubes are seamless, automatic fusion welded or electric resistance welded or high frequency in- duction welded. They are designated Fe 410 or Fe 450 grades based on the minimum tensile strength.
2.1.1 Dimensions
The dimensions and masses of various types of
tubes are as given in Tables 1, 2, 3 and 4. Unless otherwise agreed to between the supplier and the
CASING
purchaser, the pipes shall be supplied in random lengths of 4 to 7 metres.
2.1.1.1 Tolerances
a) Outside diameter - Permissible tolerance on outside diameter of pipe and socket
shall be 21 percent but not greater than 3 mm in the case of socket.
b) Thickness - The permissible tolerances on tubes thickness shall be as follows :
Seamless tube + 20 percent - 12.5 percent
Welded tube
Up to and including t15 percent
406.4 mm outside -12.5 percent
diameter Over 406.4 mrr\ outside t 15 percent
diameter - 10 percent
c) Mass - No single tube arhttll deviate from
the mass specified in tables 1,2,3 and 4
with a Mlerance of ‘F percent.
40
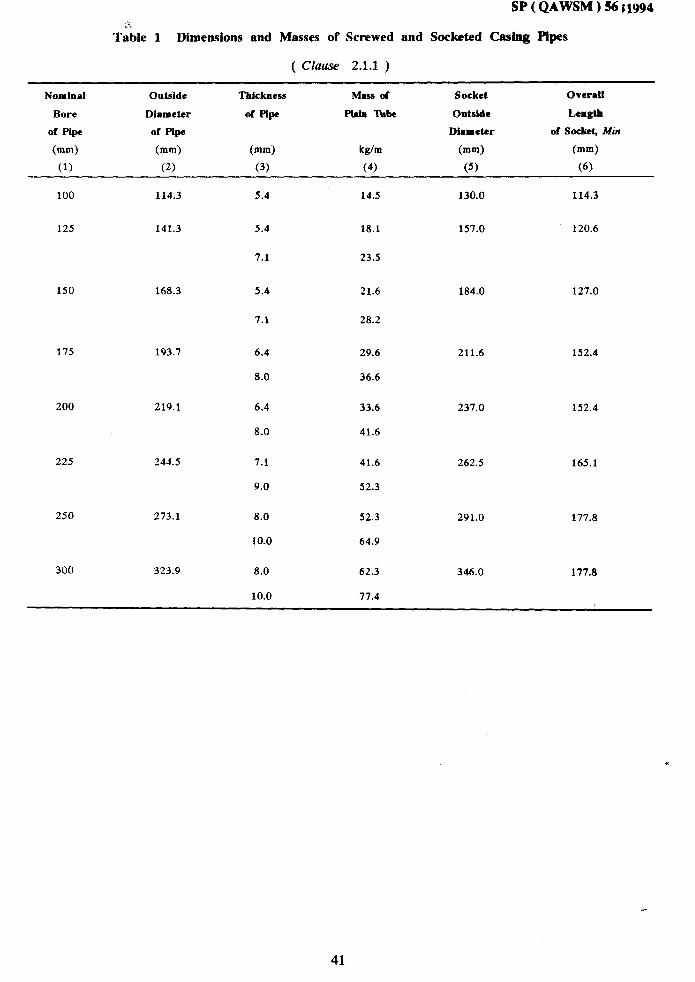
SP ( QAWSM 156 11994
Table 1 Dimensions and Masses of Screwed and Socketed Casing Pipes
( Clause 2.1.1 )
Nominal Outiide
Bore Diameter
of Pipe of Pipe
(mm) (mm>
(1) (2)
TYckncss
of Pipe
(mm)
(3)
MWof
PhiIl Tube
kg/m
(4)
Socket
Outside
Diameter
(mm>
(5)
Overall
Length
of Sockc~ Min
(mm)
(6)
100 114.3 5.4 14.5 130.0 114.3
125 141.3 5.4 18.1 157.0 120.6
7.1 23.5
150 168.3 5.4 21.6 184.0 127.0
7.1 28.2
175 193.7 6.4 29.6 211.6 152.4
8.0 36.6
200 219.1 6.4 33.6 237.0 152.4
8.0 41.6
225 244.5 7.1 41.6 262.5 165.1
9.0 52.3
250 273.1 8.0 52.3
10.0 64.9
291.0 177.8
300 323.9 8.0 62.3 346.0 177.8
10.0 77.4
41

SP ( QAWSM ) 56 : 1994
Table 2 Dimensions and Masses of Plain End Casing Pipes
( Clause 2.1.1 )
Nominal Bore Outside Diameter Thickness
of Pipe of pipe of Pipe
(mm> (mm) (mm>
Mass of Plain Tube
(kg/m)
(1) (2) (3) (4)
100 114.3 5.0 13.48
125 141.3 5.0 16.80
150 168.3 5.0 20.13
175 193.7 5.4 25.10
200 219.1 5.4 28.46
225 244.5 6.0 35.29
250 273.0 7.1 46.57
300 323.9 7.1 55.47
350 355.6 8.0 68.57
350 355.6 10.0 85.22
400 406.4 8.0 78.60
400 406.4 10.0 97.75
450 457.2 10.0 110.28
42

SP ( QAWSM ) 56 : 1994
Table 3 Dimensions and Masses of Drive Pipes for Screwed Flush Butt Joints (Square Threads)
( Chrtse 2.1.1 ) I
Nominal Bore Outside Diameter Thickness Mass of Plain Tube
mm mm mm kg/m
61 J (2) (3) (4)
100 114.3 6.0 16.02
125 141.3 6.0 20.01
150 168.3 8.0 31.62
175 193.7 8.0 35.63
200 219.0
250
300
350
400
450
500
10.0
10.0
10.0
10.0
10.0
12.0
12.0
12.0
51.56
225 244.5 57.82
273.0 64.88
323.9 77.40
355.6 85.22
406.4 116.71
457.2 131.74
508.0 146.77
Table 4 Dimensions and Masses of Plain End Drive Pipes
( Clause 2.1.1 )
Nominal Bore Outside Diameter Thickness Mass Per Metre
OfPhhTUbe
mm mm mm kg/m
(1) (2) (3) (4)
300 323.9 10.0 77.5
350 355.6 10.0 85.2
400 406.4 10.0 97.8
450 457.2 10.0 110.3
500 508.0 10.0 122.8
43

SP (QAWSM) 56 : 1994 ’
d) Thread - The tolerance on V-form and square threads, shall be as follows :
Tolerances on ‘V’ type casing taper threads :
l)Taper per meter on
diameter + 5.208 mm - 2.600 mm
2) Thread Height + 0.05 mm - 0.15 nun
3) Angle + l’YzO
4)Total thread length +- 1% pitch
5) Chamfer on outside end of + 5’
threaded pipe - 0”
Tolerance on Square form parallel threads :
1) Total thread length + 4.50 mm - 1.50 mm
2) Angle 2 1’W
3) Outside end of threaded pipe + 5” - 0”
e) Tolerance on lengfh - Unless otherwise agreed to tolernace on length for plain end pipe shall be 525 mm. For screwed end pipes, the tolerance on
length shall be mutually agreed to between the
supplier and the purchaser.
f) Straightness tolerance 1 Tubes shall not devi- ate from straightness by more than 1 in 600 of any length. Any special requirement shall be agreed to between the supplier and the purchaser.
2.1.2 Joints
2.1.2.1 Screwed and socketed butt joints shall have right-handed V-form threads in accordance with the particulars given in Table 5 (see Fig. 1).
There shall be not more than six incomplete exter-
nal threads. The threads in the socket shall be con- tinuous.
2.1.2.2 Screwed flush butt joints shall have right handed square form threads in accordance with the particulars given in Table 6 (see Fig. 2).
1A POWER MAKE UP (TUBE ENDS TO BUTT IN CENTRE OF SOCKET)
1B HAND TIGHT ASSEMBLY
TAPER 1 IN 64 ON DIAMETER ( SHOWN EXAGGERATED IN DIAGRAM)
1C THRBAD DETAIL
Ro. 1 SCR~VED AND SOCKETED Bun JOINII wm V-THREAD TAPER SCREWING
44

SP (QAWSM ) $6 : 1994
t---j- THE THREAD SHALL BE TURNED OFF THE MALE END FOR A DISTANCE OF APPROXIMATELY ONE
PITCH AND THE FEATHER
EDGE SHALL BE CUT BACK
UNTIL THE WIDTH OF THE
THREAD IS AT LEAST 1*6mm
v-j THE THREAD SHALL BE
TURNED OFF THE FEMALE END FOR A DISTANCE OF
APPROXIMATELY ONE PITCH
AND THE FEATHER EDGE
SHALL BE CUT BACK UNTIL
THE WIDTH OF THE THREAD
IS AT LEAST b6mm
rc
FIG. 2 SCREWIZI FLUSH Bwr JOMS WIIH SQUARI FORM THUPAD PARALLEL Sm
45

SP ( QAWSM ) 56 : 1994
Table 5 Screwed and Socketed Butt Joints with V-Thread Taper Screwing
( Clause 2.1.2.1 and Fig. 1 )
Nominal Outside Thickness Pitch Taper Total End of Diameter Diameter Depth Approx. Approx.
Siie Diameter OIJ Length Pipe to Over Of Of Length Width
Diameter of Hand Threads Recess Recess Of of Flat
Thread Tight Chamfer bd of
Plane Socket
L, L, E e 4 a b
(mm) (mm) (mm) (mm) (mm) (mm) (mm) (mm) (-1 (mm) (mm>
(1) (2) (3) (4) (5) (6) (7) (8) (9) (10) (11) (12)
100 114.3 5.4 2.54 1 in 64 57.18 34.92 111.55 116.59 9.52 13 5
125 141.3 5.4 2.54 1 in 64 60.10 38.10 138.54 141.64 9.52 13 5
150 168.3 5.4 2.54 1 in 64 63.5 41.28 165.52 170.69 9.52 13 5
175 193.7 6.4 3.18 1 in 64 76.2 53.98 190.52 196.69 9.52 13 5
200 219.1 6.4 3.18 1 in 64 76.2 53.98 215.91 211.49 9.52 13 5
225 244.5 7.1 3.18 1 in 64 82.55 60.33 241.30 246.75 9.52 13 6
250 273.0 8.8 3.18 1 in 64 88.9 66.68 269.88 275.14 9.52 13 6
300 323.9 8.8 3.18 1 in 64 88.9 66.68 320.68 326.14 9.52 13 6
Table 6 Screwed Flush Butt Joints Square Form Thread Parallel Screwing
( Clause 2.1.2.2 and Fig. 2 )
All dimensions in millimetres.
Nominal Outside Thickness Pitch Width Width Flank Depth Total Diameter Inside Radial
Size Diameter of of Clear- of Length Over Diameter Clearance
Thread Groove ante Threads of Male of Between
Between Threads Threads Female Threads
Threads Threads
a b c e L E EE n
(1) (2) (3) (4) (5) (6) (7) (8) (9) (10) (11) (12)
100 114.3
150 168.3
175 193.7
200 219.1
225 244.5
250
300
400
500
273.0
323.9
406.4
508.0
6 6.35 3.07 3.28 0.20 1.58
8 6.35 3.07 3.28 0.20 1,98
8 6.35 3.07 3.28 0.20 1.98
10 6,35 3.07 3.38 0.20 1.98
10 6.35 3.07 3.28 0.20 1.98
10 6.35 3.07 3.28 0.20 2.39
10 6.35 3.07 3.28 0.20 2.39
12 6.35 3.05 3.30 0.25 2.39
12 6.35 3.05 3.30 0.25 2.39
63.50
76.20
76.20
76.20
76.20
88.90
88.90
101.6
101.6
107.85 104.90 0.10
160.60 156.90 0.13
186.00 182.30 0.13
211.33 207.77 0.20
236.73 233.17 0.20
264.13 259.77 0.20
314.93 310.57 0.20
395.78 391.62 0.30
497.36 493.22 0.30
46
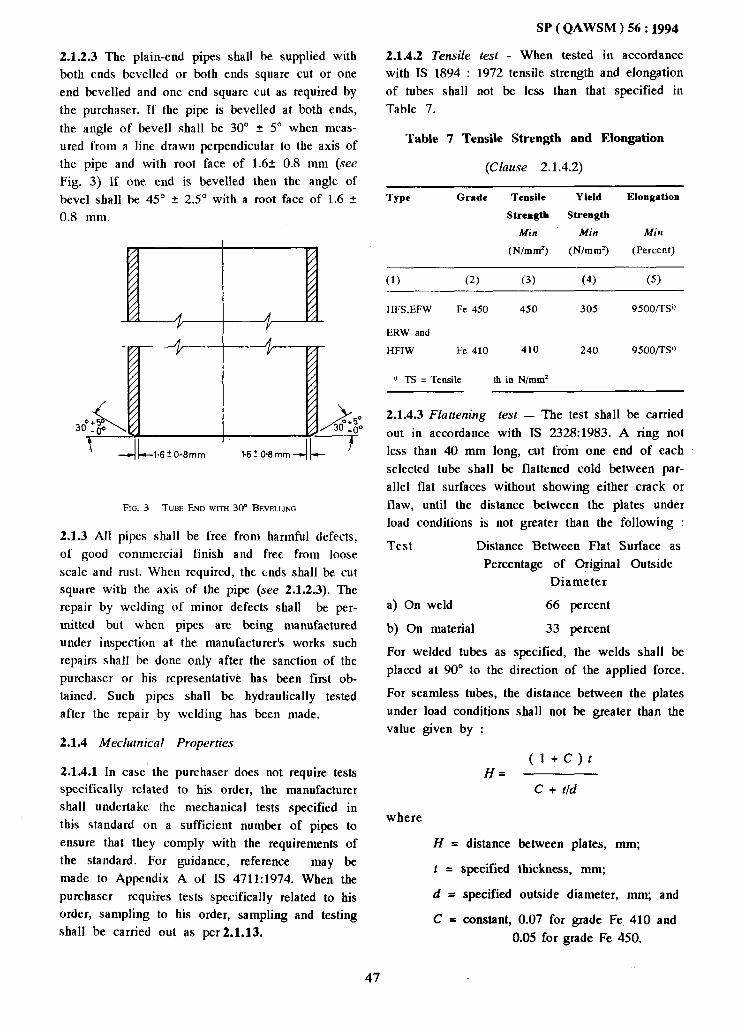
2.1.2.3 The plain-end pipes shall be supplied with both ends bevelled or both ends square cut or one end bevelled and one end square cut as required by
the purchaser. If the pipe is bevelled at both ends,
the angle of bevel1 shall be 30” + 5” when meas- ured from a line drawn perpendicular to the axis of the pipe and with root face of 1.62 0.8 mm (see Fig. 3) If one end is bevelled then the angle of bevel shall be 45” ? 2.5” with a root face of 1.6 2 0.8 mm.
,’ -&-1.6-+0.8mm 1.6~0.8mm&- ’
FIG. 3 TUBE END WITH 30” BEVELLING
2.1.3 All pipes shall be free from harmful defects, of good commercial finish and free from loose
scale and rust. When required, the ends shall be cut square with the axis of the pipe (see 2.1.2.3). The repair by welding of minor defects shall be per-
mitted but when pipes are being manufactured under inspection at the manufacturer’s works such repairs shall be done only after the sanction of the purchaser or his representative has been first ob- tained. Such pipes shall be hydraulically tested after the repair by welding has been made.
2.1.4 Mechnnicnl Properties
2.1.4.1 In case the purchaser does not require tests specifically related to his order, the manufacturer shall undertake the mechanical tests specified in this standard on a sufficient number of pipes to ensure that they comply with the requirements of the standard. For guidance, reference may be made to Appendix A of IS 4711:1974. When the
purchaser requires tests specifically related to his order, sampling to his order, sampling and testing shall be carried out as per2.1.13.
47
SP ( QAWSM ) 56 : 1994
2.1A.2 Tensile test - When tested in accordance with IS 1894 : 1972 tensile strength and elongation
of tubes shall not be less than that specified in
Table 7.
Table 7 Tensile Strength and Elongation
(Clause 2.1.4.2)
TYPO Grade TC?lWile Yield Elongation
Strength Strength
Min _ Min Min
(N/mm*) (N/mm’) (Percent)
(I) (2) (3) (4) (5)
HFS,EFW Fe 450 450 305 9500/-w
ERW and
HFIW Fe. 410 410 240 9500/-w)
0 TS = Tensile th in N/mm2-
2.1.4.3 Flattening test - The test shall be carried
out in accordance with IS 2328:1983. A ring not less than 40 mm long, cut from one end of each
selected tube shall be flattened cold between par- allel flat surfaces without showing either crack or flaw, until the distance between the plates under load conditions is not greater than the following :
Test Distance Between Flat Surface as
Percentage of Original Outside Diameter
a) On weld 66 percent
b) On material 33 percent
For welded tubes as specified, the welds shall be
placed at 90” to the direction of the applied force.
For seamless tubes, the distance between the plates
under load conditions shall not be greater than the value given by :
(l+C)t H=
C + tld
where
H= distance between plates, mm;
I = specified thickness, mm;
d = specified outside diameter, mm; and
C = constant, 0.07 for grade Fe 410 and
0.05 for grade Fe 450.

SP ( QAiVSM ) 56 : 1994
2.1.4.4 Retests of Samples - Should any one of the test pieces first selected fail to pass any of the tests specified, two further samples shall be selected for
testing in respect of each failure from the same lot.
Should the test pieces from both these additional samples pass, the material represented by the test samples, shall be deemed to comply with the re- quirement of the particular test. Should the test
pieces from either of the additional samples fail
the material represented by the test samples shall be rejected.
2.1.5 Alignment
2.1.5.1 For this test any two tubes may be screwed together till they butt and their axes shall not then be out of line by more than 100 mm in each 6 metre length as indicated in Fig. 4.
NOTE - This test is not applicable to the plain end
pipes.
There is a possibility of a cumulative effect of
alignment error which may amount to 100 mm in each 6 m length and is the maximum error permit- ted. The actual error of alignment of any one joint
will vary from zero to 20 mm the former value being more probable than the latter. The direction of the aligmnent errors in a series of consecutive joints will be quite haphazardly distributed, with the result that it would be most unlikely that all the errors would be additive, in general some will tend to compensate others.
lt_--.----6m--4
FIG. 4 ALIGNMEKT TEST
2.1.6 Hydraulic Pressure Test
2.1.6.1 Each tube shall be subjected to hydraulic pressure test at the manufacturer’s works and, if
required, in presence of the purchaser or his repre- sentative. Every pipe shall withstand the test pres- sure as calculated by the following formula:
Grade Test Pressure N/m&
Fe 410 280 t/d
Fe 450 350 tld
where
t = thickness of pipe in mm, and
d = Outside diameter of pipe in mm.
Unless otherwise agreed to between the purchaser
and the manufacturer the maximum pressure
applied shall be 7 MPa.
2.1.6.2 The pressure shall be steadily applied by approved means and maintained for a short period
for proof and inspection. The pipe conveying the pressure shall be fitted with an accurate pressure gauge and be provided with means for attaching the purchaser’s gauge. Welded tubes under test
shall be hammered at the either ends of each length with a hammer weight approximately 1 kg.
2.1.7 Condition of Pipes
2.1.7.1 All pipe shall be of good commercial finish and free from harmful defects, loose scare and rust. When required the ends shall be cut
square with the axis of the pipe.
2.1.7.2 The repair by welding of minor defects shall be permitted but when pipes are being manu- factured under inspection at the manufacturer’s
. works, such repairs shall be done only after the
sanction of the purchaser or his representative has first been obtained. Such pipe shall be hydrauli- cally tested after the repair by welding has been made.
2.1.8 Coating of Tubes
2.1.8.1 Unless otherwise specified by the pur-
chaser, the tubes shall be externally coated with a bituminous solution or any other protective anti- corrosion coatine. The bitumenous solution shall
48

SP ( Q&WSM ) 56 : 1934
2.1.12 Information to be Supplied by the Pur-
chaser
be of a quality such as to produce a coating which, when dry, shall be smooth, tough and tenacious and sufficiently hard not to flow on exposure to a temperature of 63°C and shall not be brittle at 0°C.
It shall not be such as will impart a taste to the water.
2.1~3.2 Where tubes are required to be galvanized the zinc coating on the tubes shall be in accordance
with IS 4736 : 1986.
2.1.9 Protection of Ends
2.1.9.1 All threads shall be coated with a petro-
leum jelly or other suitable NSt preventing com- pound.
2.1.9.2 V-form threads
All tubes with V-form threads shall have the threads protected with plastic rings or sleeves, unless oth- erwise specified.
2.1.9.3 Square form threads
All tubes with square form threads shall have the exposed male threads protected with steel rings or sleeves and the female threads protected with steel nipples or bushes.
Except where otherwise agreed, this form of pro-
tection shall be applied to all orders.
2.1.9.4 Tubes for butt welding
No protection of the ends shall be provided unless specially called for by the purchaser.
2.1.10 Manufacturer’s Certificate
2.1.10.1 When required by the purchaser, manu- facturer shall supply a certificate stating that the tube complies with the requirements of IS 4270~1992.
2.1.11 Marking
2.1.11.1 Each pipe shall be marked with the fol- lowing details:
a) Nominal size,
b) Length of tube, and
c) Manufacturer’s trade-mark.
2.1.12.1 The purchaser shall state in his enquiry or order :
8)
b)
cl
d)
e)
f)
I31
h)
0
k)
The nominal size, thickness and the total effective length of the tubes re-
quired;
the type and grade of tube required;
the form of joint;
the length in which individual tubes
are to be supplied;
whether he wishes to have tests made
specially related to his order and, if so, whether or not he wishes himself or his representative to witness them;
Whether he desires to receive test
certificate;
special requirements of surface coat-
ing if desired;
any special welding technique de-
sired;
any special marking; and
whether any protection of pipes for transit is required.
2.1.13 Sampling and Criteria for Conformity
2.1.13.1 Visual dimensional,
requirements
The sampling and testing
these requirement shall be IS 4711 : 1974.
alignment and mass
of steel tubes for
in accordance with
2.1.13.2 Mechunical requirement
The number of tubes to be sampled and tested for mechanical properties are given below. The samples
shall be taken at random by using random number tables.
Nominal Size
up to loo mm Samples Size
One for every 400 pipes or part thereof One for every 200 pipes or part thereof One for every 100 pipes or part thereof Two
Above 100 mm and up to 300 mm Above 300 mm
Minimum number of samples per lot
49

SP ( QAWSM ) 56 : 1994
2.1.13.3 Retest of samples
Should any one of the test pieces first se-
lected fail to pass any of the test specified, two
further samples shall be selected for testing in
respect of each failure from the same lot, should
the test pieces from the both these additional samples pass, the material represented by the test samples shall be deemed to comply with the requirement of that particular test. Should either of the additional
samples fail, the material represented by the test samples shall be rejected.
2.1.13.4 Hydraulic pressure test
All the tubes shall be subjected to hydraulic pres-
sure test as per. 2.1.6. Those tubes failing in the test shall be rejected.
2.1.13.5 Coating test
One tube for every 1 000 tubes in the lot shall be subjected to coating test as per 2.1.8. The samples should pass if the lot is to be accepted under this
clause.
3 PVC ,PIPES
3.1 In order to overcome the problem of corrosion
of casing pipes associated with metal casing pipes, UPVC casing pipes have been developed as an
alternative material. UPVC casing pipes also have the advantage of having light weight compared to metal pipes. However they suffer from the disad- vantage of having low tensile and impact strength.
The requirements for UPVC casing pipes have been covered in IS 12818: 1992 which provides for
two classes of UPVC casing pipes, namely, CS pipes & CM pipes, suitable for shallow and me- dium depth wells as follows:
CS Pipe: Casing pipe suitable for well with depth
up to 80 m, and
CM Pipe: Casing pipe suitable for wells with depth above 80 m and up to 250 m.
3.2 Coinposition of UPVC Casing Pipes
3.2.1 The pipe shall be produced from material
consisting substantially polyvinyl chloride con- forming toIS 10151: 1982 to which may be added only those additives as are needed to facilitate
manufacture of sound pipe with good surface fin- ish, mechanical strength and opacity under the conditions of use. None of these additives shall be used separately or together in quantities sufficient
to constitute a toxic hazard or materially to impair the fabrication, chemical and physical properties of the pipes.
3.2.2 Up to 10 percent additon of the manufac- turer’s own rework material produced during the
manufacture and testing of pipes complying to this standard is permissible.
3.3 Colour
The pipe shall be of regular blue colour through-
out slight colour deviation is permissible.
3.4 Designation
Pipe shall be designated by its type (CS or CM) followed by its nominal diameter DN, and length of this pipe.
3.5 Dimensions
3.5.1 The diameters and wall thickness for ‘CM’
casing pipes shall be as given in Table 8, read with Fig. 5.
35.2 The diameters and wall thickness for ‘CS’
casing pipes for sizes DN 150 to DN 400 shall be
as given in Table 9, read with Fig. 5.
3.5.3 Effective and segmental lengths of casing pipes shall be as given in Table 10, read with Fig. 5.
3.5.4 Tolerances on overall length and segmental
lengths of pipes shall be as follows:
i) Overall length 1, _‘F mm
ii) Segmental length 1,
(Threaded portion)
a) for DN up to and including 200
-Spigot end r”, mm
-Socket end I”, mm
b) for DN above 200
-Spigot end _‘“, mm
-Socket end _*“, mm
50

SP ( QAWSM ) 56 : 1994
DETAIL x
* 11 * 12. Lj
SA RIBBED SCREEN
DETAIL X
58 PLAIN SCREEN
FIG. 5 SCREEN AND CASING PIPE
51

’ SP ( QAWSM ) 56 : 1994
Table 8 Dimensions of ‘CM’ Casing Pipes
(Clause 3.51)
All dimensions .in millimelres.
Nominal Outer Diameter, Outer Diameter, ds wall lllicklless, s
Diameter
DN Min
d ofPipe Over Connection
Max Max Min Max
(1) (2) (3) (4) (5) (6)
40
50
48.0 48.2 52 3.5 4.0
60.0 60.2 64 4.0 4.6
80 88.0 88.3 94 4.0 4.6
100
125
150
175
200
113.0 113.3 120 5.0 5.7
140.0 140.4
165.0 165.4
150 6.5 7.3
177 7.5 8.5
250
300
350
400
200.0
225.0
280.0
330.0
400.0
450.0
200.5
225.5
215 8.8 9.8
243 10.0 11.2
280.5 298 12.5 14.0
330.6 351
400.7 428
14.5
17.5
19.5
16.2
19.5
450.8 478 21.7
Table 9 Dimensions of ‘CS’ Casing Pipes
(Clause 3.5.2)
All dimensions in millimetres.
Nominal Outer Diameter, Outer Mameter, ds Wall l%ickness, s
Diameter d of pipe Over Ccmnection
DN Mirt Ml7.X Max Milr Ma.%-
(1) (2) (3) (4) (5) (6‘)
150 165.0 165.4 173 5.7 6.5
175 200.0 200.5 212 7.0 7.8
200 225.0 225.5 238 7.6 8.8
250 280.0 280.5 292 9.6 11.0
300 330.0 330.6 346 11.2 13.3
350 400.0 400.7 420 14.0 15.5
400 450.0 450.5 470 16.0 17.5
52

Nominal
Diameter
DN
(1)
40
50
80
100
125
150
175
200
Table 10 Effective and
Lengths of Casing
(Clause 3.5.3)
Segmental
Pipes
All dimensions in miilimebes.
Effective Segmental
Length Length
(2) (3)
2000 25
3000 25
4000 25
2000 30
3000 30
4000 30
2000 40
3000 40
4000 40
2000 45
3000 45
4000 45
2000 60
3000 60
4000 60
2000 60
3000 60
4000 60
2000 60
3000 60
4000 60
2000 IO
3000 70
4000 70
250
300
350
400
3.6 Threading
SP ( QAWSM ) 56 : 1994
2000 85
3000 85
4000 85
2000 85
3000 85
4000 85
2000 85
3000 85
4000 85
2000 95
3000 95
4000 95
3.6.1 The Casing pipes shall have male threads at
spigot end and female threads at the socket end.
3.6.2 Casing pipe of nominal diameter from 40 to 80 mm shall have threads in accordance with
IS 554 : 1985.
3.6.3 Casing pipes of nominal diameters of 100 to 400 mm shall have threads in accordance with basic profile for metric trapezoidal threads. Seal- ing rings to be used with the trapezoidal threads
shall be of natural rubber conforming to IS 5382 :
1986, having hardness 65 t5 sh.
3.6.4 Pipes of nominal diameter 100 to 200 shall have the thread dimensions as given in Table 11, read with Fig. 6A. Dimensions of sealing element
shall be as given in Fig. 6B.
3.6.5 Pipes of nominal diameter 250 to 400 shall
have the thread dimension as given in Table 12. read with Fig 7A Dimensions of sealing element shall be as given in Table 13, read with Fig. 7B.
6A THREAD PROFILE +t PROOUC Eb AS AN- UNDERCUT WITH TH IREAD PROFILE
--F” SEALING
iLEMENT
FIG. 6 Mnuc TRMEZOIDAL THREAD P~ome (DN 100 TO 200)
53

SP ( QAWSM ) 56 : 1994
7A THREAD PROFILE at PRODUCED AS AN UNDERCUT WITH THREAD PROFlLE
FIG. 7 METRIC TRAPEZOIDAL THREAD PROFILE (FOR DN 250 TO 400)
Table 11 Trapezoidal Threads; DN 100 to 200
(Clause 3.6.4)
All dimensions in millimetres
Nominal
Size, DN
d d +O ’ -0.2 4 4
L) to.2 ’ -0. D, D3 D,
100 113 112.5 109.75 107.3 108.3 111.05 113.5 115.9
125 140 139.5 136.75 134.3 135.3 138.05 140.5 142.9
150 165 164.5 161.75 159.3 160.3 163.05 165.5 167.9
175 200 199.5 196.75 194.3 195.3 198.05 200.5 202.9
200 225 224.5 221.75 219.3 220.3 223.05 225.5 227.9
54
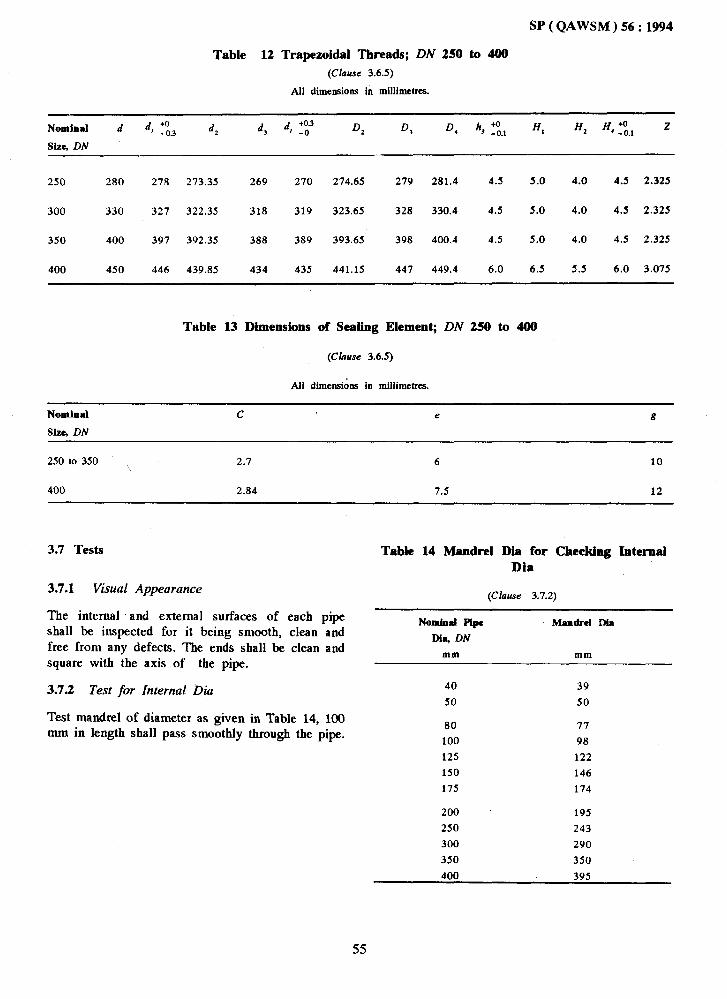
SP ( QAWSM ) 56 : 1994
Table 12 Trapezoidal Threads; DN 250 to 400
(Clause 3.6.5)
All dimensions in millimetres.
Nominal d
Size, DN
d +o ’ -0.3 4
d +0.3 ’ -0 D* D, D, /I +0
’ -0.1 H, Hz H +0 ’ -0.1
Z
250 280 278 273.35 269 270 274.65 279 281.4 4.5 s.0 4.0 4.5 2.325
300 330 327 322.35 318 319 323.65 328 330.4 4.5 5.0 4.0 4.5 2.325
350 400 397 392.35 388 389 393.65 398 400.4 4.5 5.0 4.0 4.5 2.325
400 450 446 439.85 434 435 441.15 447 449.4 6.0 6.5 5.5 6.0 3.075
Table 13 Dimensions of Sealing Element; DN 250 to 400
(Clause 3.6.5)
All dimensibs in millimetres.
Nominal C e g
Size, DN
250 to 350 2.7 , 6 10
400 2.84 7.5 12
3.7 Tests
3.7.1 Visual Appearance
The internal ‘and external surfaces of each pipe shall be inspected for it being smooth, clean and free from any defects. The ends shall be clean and square with the axis of the pipe.
3.7.2 Test for Internal Dia
Test mandrel of diameter as given in Table 14, 100 mm in length shall pass smoothly through the pipe.
Table 14 Mandrel Dia for Checking Internal Dia
(Clause 3.7.2)
Nombl Prpc Mandrel Din
Dh, DN
mm mm
40 39
50 50
80 77
100 98
125 122
150 146
175 174
200 195
250 243
300 290
350 350
400 395
55

SP ( QAWSM ) 56 : 1994
3.73 Specific Gravity
Specific gravity of the material of the pipe shall be within 1.40 g/cm’ when determined in accordance with IS 8543 (Part l/Set 2): 1979.
3.7.4 Impact Strength at 0°C
When tested by the method described in IS 12235 (Part 9): 1986, read with A-l.7 of IS 4985: 1988 the pipe sample shall not fracture or crack through its complete wall thickness. The total mass of the striker and height of free fall shall correspond to the values given in Table 15.
Table 15 Mass of Striker and Height of Free Fall
(Clause 3.7.4)
Nominal Total Mass
Size, DN of Striker
mm kg
40 0.25
50 0.25
80 and 100 0.50
125 and above 1.00
Height of Free Fall
mm
10002 10
2OOOr 10
2cKlO+ 10
2000? 10
NOTE-The test shall be carried out on the plain/ ribbed portion taken at least 1OOmm away from the
root of the socket.
3.7.5 Elastic h4oahlus and Tensile Strength
Elastic modulus and tensile strength at break shall be as given below when determined in accordance with the test procedure laid down in IS 8543 (Part 4/Set 1) : 1984:
i) Elastic modulus 2800 2 200 MPa
ii) Tensile strength 50 -+ 5 MPa
NOTE - The specimen for the test shall be prepared from a
section of the pipe heated lo a temperature of 125 ‘C to 130°C
and subsequently flattened and machined.
3.7.6 Vicat Sojiening Temperature
The vicat softening temperature shall not be less than 76°C when measured in accordance with the procedure given is IS 6307: 1985.
NOTE - The test may be done on specimen cut from the
pipe, of dimensions as specified in IS 6307 : 1985 . The
specimen shall be supported on a suitable concave surface
of radius equal lo that of the sample pipe ensuring support
on all ends.
3.7.7 Eflect on Water
The pipes shall not have any detrimental effect on the composition of water flowing through them. The pipes shall meet the requirements/tests speci- fied in 6.3 of IS 4985 : 1988.
Table 16 Scale of Sampling and Criteria for Conformity
(Claux 3.8.1)
Number of Pipes
intheLot
For Tests Under 3.5, 3.6, 3.7.1 and 3.7.2 For Tests Under 3.7.3 and 3.7.4
Sample Cumu- Accept- Rejection Sub-sample Cumu- Accept- Rejection
lative ante No. - lative ante No.
DN No. Size Sample No. No. Size Size No.
mm Size
(1) (2) (3) (4) (5) (6) (7) (8) (9) (10) (11) (12)
up to
! 100
First 13 13 0 2 First 3 3 0 2
up lo loo0 Second 13 26 1 2 Second 3 6 1 2
Above First 5 5 0 2 First 1 1 0 2
100 Second 5 10 1 2 Second 1 2 1 2
First 20 20 0 2 First 5 5 0 2
1001 to Second 20 40 1 2 Second 5 10 1 2
3000
First 8 8 0 2 First 2 2 0 2
Second 8 16 1 2 Second 2 4 1 2
56

SP ( QAWSM ) 56 : 1994
3.8.1.5 The lot having satisfied the requirements under 3.8.1.4 shall be tested for 3.7.3 and 3.7.4.
3.8 Sampling and Criteria for Conformity
3.8.1 Routine Tests
The scale of sampling and criteria for conformity of a lot for routine tests specified under sub- clauses of 3.5, 3.6, 3.7.1 to 3.7.4 shall be as given in Table 16.
3.8.1.1 All pipes, in a single consignment, of the same type (screen or casing ) same size and manu- factured under essentilly similar conditions shall constitute a lot.
3.8.1.2 For ascertaining conformity of the lot to the requirements of specification, samples shall be tested from each lot separately.
3.8.1.3 The pipes shall be selected at random from the lot and in order to ensure the randomness of selection, a random number table shall be used. For guidance and use of random number tables, IS 4905: 1968 may be referred to. In the absence of a random number table, the following procedure may be adopted:
Starting from any pipe in the lot, count them as 1, 2, 3, etc, up to r and so on, where r is the integral part of N/n, N being the number of pipes in the lot and n the number of pipes in the sample. Every rth pipe so counted shall be withdrawn so as to consti- tute the required sample size.
3.8.1.4 The number of pipes given for the first sample of co1 4 of Table 16 shall be taken from the lot and examined for requirements given under 3.5, 3.6, 3.7.1 and 3.7.2. A pipe failing to satisfy any of these requirements shall be considered as defective. The lot shall be deemed to have stais- fied these requirements, if the number of defec- tives found in the first sample is less than or equal to the corresponding acceptance number given in co1 6 of Table 16. The lot shall be deemed not to have met these requirements, if the number of defectives found in the first sample is greater than or equal to the corresponding rejection number given in co1 7. If, however, the number of defec- tives found in the first sample lies between the corresponding acceptance and rejection numbers given in co1 6 and 7, a second sample of the size given in co1 4 shall be taken and examined for these requirements. The lot shall be considered to have satisfied these requirements if the number of defective found in the cumulative sample is less than or equal to the corresponding acceptance number given in co1 6 otherwise not.
For this purpose a sub-sample from those tested under 3.8.1.4 shall be drawn as given in co1 9 for the first/second sample size. The lot shall be deemed to have met the requirements given in the specifi- cation, if the number of defectives found in the first samples is less than or equal to the corre- sponding acceptance number given in co1 11. The lot shall be deemed not to have met these require- ments, if the number of defectives found in the first sample is greater than or equal to the corre- sponding rejection number given in co1 12. If however, the number of defective found in the first sample lies between the corresponding acceptance and rejection numbers given in co1 11 and 12, a second smple of size given in co1 8 shall be taken and considered for the requirement. The lot shall be considered to have satisfied the requirements, if the number of defectives found in the cumulative sample is less than or equal to corresponding ac- ceptance number given in co1 11, otherwise not.
3.8.2 Type Tests
Type tests are intended to prove the suitability and performance of pipes whenever there is a change in the composition, size and type of pipe as well as in the method/technique in the manufacturing process. Tests specified in 3.7.5 to 3.7.7 shall be taken as type tests.
3.8.2.1 However, even if no change is envisaged, at least one sample from each size and type pro- duced during the period shall be subjected to type test once in six months.
3.9 Marking
Each pipe shall be clearly and indelibly marked in red colour with the following information:
a) Indication of source of manufacture,
b) Letter CM or CS to denote medium well casing pipe or shallow well casing pipe as applicable,
c) Nominal diameter in mm, and
d) Overall length of pipe in mm.
3.9.2 Pipe may also be marked with the Standard Mark.
57

SP ( QAWSM ) 56 : 1994
CHAPTER 7
WELL SCREENS
1 GENERAL
Well screens serve as intake section of a well that allows water to flow freely into the well, prevents sand from entering with water and acts as a stmc-
tural retainer to support the borehole in unconsoli- dated material. To accomplish fully its intended purposes, the well screen must be of efficient design i.e. it should let ample quantity of sand-free water to flow into the well with minimum loss of
head. The screens may range from pipes perforated in place to carefully fabricated cage-type wire- wound screens with accurately sized slot open-
ings.
2 TYPES
2.1 The following are the various types of well
screens and slotted pipes :
a) Plain Slotted Pipes - These are pipes with slots cut by milling.
b) Bridge Slotted Pipes - The slots here
are not cut but pressed out.
c) Mesh Wrapped Screens - These are made
by wrapping copper mesh over perfo- rated steel pipe using spacers about 3 mm thick in between the copper mesh and the perforated pipe.
d ) Cage Type Wire-wound Screens - These
are special type of screens wherein a con-
tinuous trapezodial or circular wire is spirally wound around a fabricated cage. The screen consists of wedge profile wire of various dimensions, resistance welded
to a cylindrical body made of various members and cross sections of longitudi- nally arranged metal rods, which are in turn welded into cylindrical ring cou- plings at either end.
e) Pre-Packed Resin Bonded Gravel Screens
- Gravel is pasted on the perforated
pipe with the help of resin type adhesive material. The thickness of gravel bond varies between 10 to 15 mm depending upon the diameter of the base pipe used.
f) Brass Screens -4 Brass screens are made
from brass sheet in which slots of re-
quired sizes are cut before rolling.
3 MATERIAL
3.1 The well screens and slotted pipes shall be
made of either corrosion resistant material or steel pipes having sufficient thickness to guard against the effect of corrosion and to ensure reasonable life of tubewell. The following are the recom-
mended materials for various type of well screens and slotted pipes :
a) Low carbon steel or mild steel;
b) Leaded brass sheet (see IS 5494 :
1969);
c) Fibre glass reinforced thermosetting
plastics;
d) Unplasticised polyvinyl chloride
(UPVC); and
e) Copper Wire, galvanized steel wire
and stainless steel wire.
4 DESIGN FEATURES
4.1 Length of Screen
The length of screen shall be governed by the thickness of acquifer and shall be sufficient to
obtain the specified yield from tubewell. How- ever, the minimum total length shall be such that the entrance velocity is less than the permissible entrance velocity of 0.03 m/s to ensure longer life
of the well. The lengths of individual pipes shall
be such as to afford easy handling for transport and lowering into wells, and removal in case of recov- ery, etc. ‘The lengths of individual pipes shall be
such that there is minimum wastage in using com- binations of various lengths inside the wells, and to ensure that the. combinations form the nearest requirement to obtain the estimated specific yield of the well. They may be in random length speci- fied by the use in consultation with the manufac- turer. To account for possibility of inaccuracy in logging, screen shall not be placed in at least 0.3
metre on both sides of the stratum.
4.2 Diameter of the Screen
The criteria for determining the diameter of the

well screen shall depend on the design yield of the tubewell. It shall be ensured that the area of open- ing available in the screen for flow of water, after giving allowance for possible coverage of gravel,
clogging, incrustation, etc, produces a screen entrance velocity of not more than 0.03 m/s. The screen diameter shall be so selected that the percentage of slot area to screen surface area is generally be- tween 15 to 22 percent..
4.2.1 Screen diameters for various discharges to be pumped from the well, are given in Table 1 for general guidance.
Table 1 Screen Diameter
(Clause 4.2.1)
Discharge Screen DIP (mm)
I/minute Minimum Recommended
up to 415 100 100
475 1125 150 150
1300 .3000 200 250
3000 5250 250 300
5200 9500 300 350
9500 13300 350 400
13300 19000 400 450
19000 26500 450 500
26500 34000 500 550
4.3 Slot Size
The shape and size of the slots shall be such that the gravel or acquifer material is not allowed to block the open spaces. Based on the sieve analysis
of the acquifer material, the size of the slot open- ings shall be determined in such a way that finer fractions remain outside the slots. the slots shall not be too wide to cause entry of the gravel and resulting in plugging. Sharp edges on the periph- ery of the pipe may offer resistance to flow and hence .jit isI preferable to have smooth rounded edges.
4.3.1 The slot size for gravel pack shall be so selected as to retain at least 90 percent of the pack material. However, in case the well is not provided
with gravel pack, slot size shall be such that it allows 40 to 60 percent of the aquifer material to pass through. The normal slot sizes shall be 1.0,
SP ( QAWSM ) 56 :I 1994
1.6 and 3.2 mm. For fibre reinforced plastic (FRP) pipes, the slot width shdi not be less than 1.6 mm. For PVC pipes, these shall be as given in 5.1.3.3.
4.3.2 Percentage Openings
The percentage slot openings shall be such that the’
screen length provides sufficient inlet area to limit the entrance velocity to 0.03 m/s.
4.3.3 Distribution of Slots
The slots shall be cut in a pattern designed to get
even distribution of flow all over the priphery of the pipe.The slots shall be distributed in rows as
closely and evenly as possible, staggering the slots between each row.
4.3.3.1 The slot size, design and distribution should
be such as to maintain sufficient collapse strength of the screen.
5 SPECIFIC DESIGN FEATURES
5.1 Plain Slotted Pipes
5.1.1 Low Carbon or Mild Steel Slotted Pipes
The slots shall. be cut by milling or by slitting saw.
The recommended thicknesses for different di- ameters for various depths of tubewell under nor- mal conditions are given in Table 2.
Table 2 Thickness of Pipes
( Clause 5.1.1 )
Depth of well ‘Ibidawss for pipe Size (OD) in mm
m 166.61 219.1 273.00 323.80 355.00
168.3
50 4.85 7.04 7.09 8.38 9.52
100 5.4 7.04 7.09 8.38 9.52
125 5.4 7.04 7.8 8.38 9.52
150 5.4 7.04 7.8 8.38 9.52
175 5.4 7.04 7.8 8.38 9.52
200 5.4 7.04 7.8 8.38 9.52
250 7.11 8.18 9.27 9.52 9.52
275 7.11 8.18 9.27 9.52 9.52
300 7.11 8.18 9.27 9.52 9.52
Typical slot pattern Fig. 1 and 2.
of well screens is shown in
59
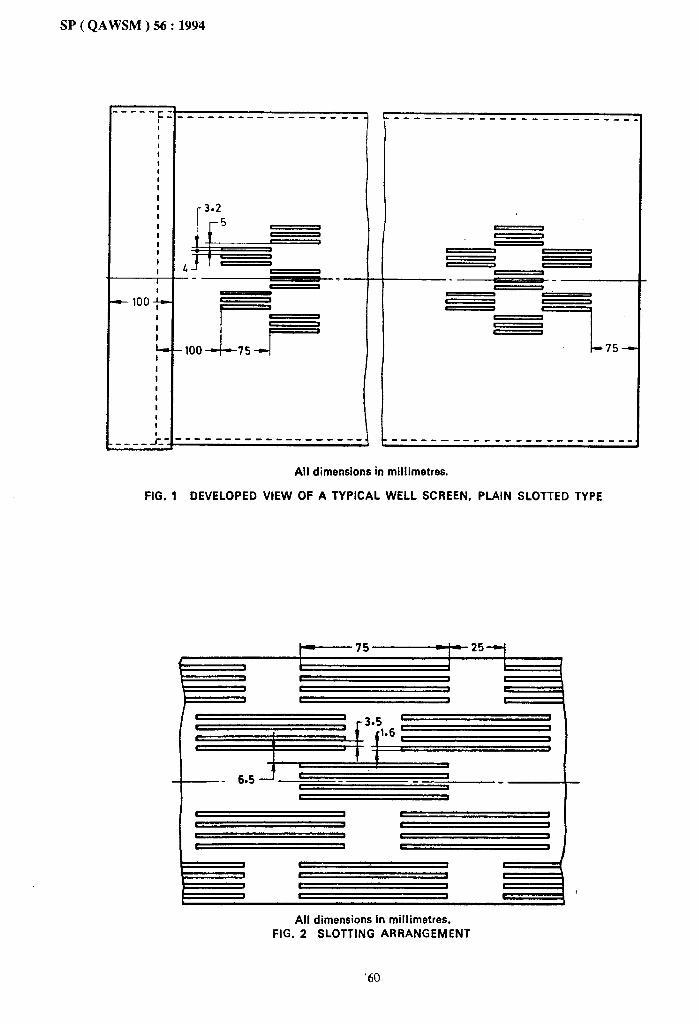
SP ( QAWSM ) 56 : 1994
I I
c L All dimensions in millimetres.
FIG. 1 DEVELOPED VIEW OF A TYPICAL WELL SCREEN, PLAIN SLOTTED TYPE
All dimensions in millimetres. FIG. 2 SLOTTING ARRANGEMENT
‘60

The slots shall not be cut within 12 mm on either side of the longitudinal welded joints of the pipes.
The plain space after thread cutting over the larger
diameter pipes shall not be less than 150 mm so
that wrenches could easily be used on plain space only.
5.1.2 FRP Pipes
The FRP slotted pipes shall be cut by milling. The
slotting pattern shall be such as to ensure the minimum cutting of the glass fibre in the pipe and thereby maintaining maximum strength.
The recommended thicknesses of FRP pipes are given in Table 3.
Table 3 Thickness of FRP Pipe
(Clause 5.1.2)
Depth of Wd
In
‘fhidcness of Pipe for Given Din (mm)
150 200 250 300 350
1.50 5.00 6.00 6.50 8.25 8.50
300 6.00 6.75 8.00 9.00 9.50
The FRP based material shall fulfil the require- ments as given below :
Mechanical Strength
1) Axial tension - The pipe shall be able to with-
stand an axial load (at break) of not less than 102 KN or ten times the weight of a hypotheti- cal well string comprising of 18 m of upper well casing, 4 m of screen and 6 m of lower
well casing, whichever is greater.
2) Axial compression - The pipe shall be able to
withstand an axial compressive load of not less than 102 kN.
3) Internal hydrostatic pressure - The pipe shall
withstand a hydraulic pressure of 210 N/cm2 continuously.
4) External collapse pressure - The slotted pipes
shall withstand the external pressures given in Table 4.
SP ( QAWSM ) 56’: 1994
Table 4 External Collapse Pressure
(Clause 5.1.2)
WeU Depth Collapse Pressure
In (N/cm’)
up to loo 28
100-150 49
150-225 70
225-300 84
300-400 98
5) Water absorption and retention of strength
- water absorption in boiling water for 72 hours shall be less than one percent. Strength retention after boil test shall be at least 50 percent of original strength.
NOTES
1 Axial tension and axial compression values given are based
on required handling strength, chiefly from previous expe-
rience. Further the axial tensile value includes a safety fac-
tor, and the load required to withdraw the well string after
gravel packing but before full development.
2 Internal hydrostatic pressure strength is based on the ability
of slotted pipea to withstand cleaning by explosive of
masked string of cordtex.
3 External collapse pressure is based on estimated maximum
pressure likely to be experienced during development.
5.1.3 PVC Screen Pipes - PVC screen pipes have come to be recognized as suitable in tubewell con- struction owing to their desirable preformance char-
acteristics such as corrosion resistance. These are of two types, namely, Ribbed Screen Pipes and Plain Screen Pipes which are defined and desig- nated as follows :
a) Ribbed Screen Pipe
Pipe with external longitudinal ribs and transverse (horizontal to pipe axis) slots. This shall be desig- nated as ‘RS’ pipe.
b) Plain Screen P@e
Plain surface pipe with transverse slots. This shall be designated as ‘PS’ pipe.
61

SP ( QAWSM ) 56~3994
5.1.3.1 Composition - The composition of mate- b) Screen pipes for DN above 200 mm may be
rial of PVC screen pipes shall be same as given for plain (without ribs). The diameters and wall thick-
PVC casing pipes (see 3.2 of Chapter 6). ness of these pipes shall be as given in Table 6,
5.1.3.2 Dimensions read with Fig. 5B of Chapter 6.
a) The diameters and wall thickness of screen
pipes with ribs shall be as given in Table 5, read
with Fig. 5A of Chapter 6.
Table 5 Dimensions of Screen Pipes with Ribs .
[Clowe 5.1.3.2 (a)]
All dimensiolrs in millimetres.
Nonhal
Diameter
DN
outu Diameter,
dofFipe
Min Max
Outes Dlamstar, ds
Over Connectiom
Max
wall’-* s
(IJder Ribs)
Min Max
(1) (2) (3) (4) (5) (6)
40
50
80
100
125
150
175
52.0 52.2 56 3.5 4.0
64.0 64.2 68 4.0 4.6
92.0 92.3 98 4.0 4.6
117.0 117.3 125 5.0 5.7
144.0 144.4 154 6.5 7.3
169.6 169.4 183 7.5 8.5
204.0 204.5 221 8.8 9.8
229.0 229.5 247 10.0 11.2
284.0 284.5 301 12.5 14.0
334.0 334.6 354 14.5 16.2
404.0 404.7 434 17.5 19.5
454.0 454.8 489 19.5 21.7
Nominal
Diameter
DN
(1)
Table 6 Dimensions of Plain Semen Pipes
[C/awe 5.1.3.2 (b)]
All dimensions in millimetres.
outa Diameter, outer Diameter, dr wall lllldulq s doll’@ Over Conwctigm
Min Max Max Min Max
(2) (3) (4) (5) (6)
250 280.0 280.5 297 12.5 14.0
300 330.0 330.6 350 14.5 16.2
350 400.0 400.7 430 17.5 19.5
400 450.0 450.8 485 19.5 21.7
62

Table 7 Effective and Segmental Lengths of Screen pipes
[Claur.? 5.1.3.2(c)]
Nominal
Diameter
DN
mm
(1)
Effective
L3@, mm
‘2
(2)
segmental Lengths, mm
‘3 1, ‘5
(3) (4) (5)
40
50
80
100
125
150
175
200
250
300
350
400
loo0
2000
3000
1000
2000
3000
1000
2000
3000
1000
2ccm
3000
2000
3ooo
2Om
3000
2000
3000
2000
3000
2000
3000
2000
3000
2cQo
3000
2000
3000
25 880 60
25 1 880 60
25 2 880 60
30 870 70
30 1 870 70
30 2 870 70
40 860 80
40 1 860 80
40 2 860 80
45 850 90
45 1 850 90
45 2 850 90
60 1800 160
60 2800 160
60 1 770 170
60 2 770 170
60 1 770 170
60 2 770 170
70 1 760 180
70 2 760 180
85 1 720 220
85 2 720 220
85 1 720 220
85 2 720 220
85
85
95
95
1700
2 700
1700
2 700
240
240
240
240
SP ( QAWSM ) 56 : 199!
c) Effective and segmental length of screen shall
be as given in Table 7 read with Fig. 5 of
Chapter 6.
d) Tolerances on overall length and segmental
lengths of pipes shall be as follows :
i) Overall length, I, ‘7 mm
ii) Segmental length, 1,
(Threaded portion)
a) for DN up to and including 200
- spigot end ri mm
- socket end ri mm
b) for IN above 200
- spigot end ‘z mm
- socket end r”, mm
iii) Segmental length, 1, 525 mm
(screen portion)
iv) Segmental length, Is rz mm
63


SP ( QAWSM ) 56 : 1994
Table 8 Dimensions and Layout of Slots on Screen Pipe
(Cloure 5.1.3.3)
Nolainnl Diameter n ZUiS% Free Passage Area in 8 (Mean Value) for Width ol Slot (w), mm d
DN. mm mm
0.2 0.3 0.5 0.75 1.0 1.5 2.0 3.0
40
50
80
100
125
150
175
200
250
300
3so
400
Width of material between slots ( b) zO.5
(see Note 3)
3 85 3.5
3 108 3.5
3 168 3.5
5 216 3.5
5 240 -
5 285 -
5 335 -
6 390 -
6 450 -
6 530 -
a 640 -
a 720 -
4.0
5.0
5.0
5.0
5.0
4.5
-
-
6.0
6.0
6.0
6.0
5.5
5.5
5.5
-
-
-
4.0
-
5.5
8.5
8.5
a.5
8.5
7.5
7.5
7.5
7.5
7.0
7.0
-
-
5.5
9.0 9.5 12.0
9.0 9.5 12.0
9.0 9.5 12.0
9.0 9.5 12.0
8.0 a.5 11.0
8.0 8.5 11.0
8.0 a.5 11.0
8.0 8.5 11.0
7.5 8.0 10.0
7.5 8.0 10.0
7.5 8.0 10.0
7.5 8.0 10.0
6.5 9.5 9.5
-
-
13.5
13.5
13.5
11.5
12.5
12.5
5 __ 3
NOTES, 1 ): CI is the summa!ion of slot lengths over the internal circumference of the cross section.
2 n is the minimum number of slots on the circumfe~ce of the cross section.
3 In each metre of screen IO wider pieces between sliu up to 2 mm in width are permitted.
4 Percentages of opening g&n in the table are baxd on internal surface area vetsus internal open area of pipe.
b) Tolerance on width of slot (w), given in Table 8 shall be as under: Slot width
in mm 0.2 0.3 0.5 0.75 1.0 1.5 2.0 3.0
Tolerance, + 0.06 + 0.06 +o. 10 + 0.20 + 0.20 + 0.20 + 0.20 +0.30 mm - 0.0 - 0.0 - 0.0 -- 0.0 - 0.0 - 0.0 - 0.0 - 0.0
5.13A Threading of screen pipes - The require- ments on threads shall be same as given under 3.6 of Chapter 6 for casing pipes.
5.1.3.5 Tests - All tests as given in 3.7 of Chapter 6 shall be applicable to PVC screen pipes also. For screen pipes, however, these test shall be carried out on pipes before cutting slots. Likewise criteria for conformity and method of sampling shall be same as given in 38 of Chapter 6.
5.2 Mesh Wrapped Screens
between 25 to 40 mm depending upon the diameter
and the thickness of the pipes used. The pipe
thickness shall be the same as given in Table 2.
The spacers shall be of mild steel and shall he of
thickness 3 mm minimum and shall be 6 mm wide.
The distance between the two adjacent spacers
shall be 75 mm minimum.
The copper mesh shall be made of cqpper wire
according to IS 4412:1981 and shall not be less
The pipes used in mesh ivrapped screens shall be of than 0.710 mm in thickness.
mild steel or low carbon steel. T’he diameter of
perforations shall not be less than 12 mm and the 5.3 Cage Type Wire-Wound Screens
distance between the t\vo adjacent holes shall be The wrapping wire having a \vedge profile :vith
65

SP ( QAWSM ) 56 ; 1994
flat surface on the outside and producing expand- ing slots on the inside should be used. This shape facilitates setting and back washing operation and also avoids the screens being clogged by fine particles.
For obtaining a minimum of 15 percent open area, the screen aperture shall not be less than 0.375 mm. The number and cross-section of the vertical support rods and the profile of the wrapping wire shall be such as to give sufficient axial and col- lapse strength (see Fig. 4).
00 RAF9
SPECIAL HIGH TENSILE
PROVIDE SMOOTH, NRESTRICTED BORE
&RT SLOT
AREA
‘URE
/ SPECIAL WEDGE SECTION WRAPPING WIRE HELICALLY WRAPPED TO FORM CONTI- NUOUS NON-CLOGGING APERTURE
yNOBSTRUCTEDti FLOW DURING a DEVELOPMENT
a
fJ~J;MC:MOGGED
a
PRODUCTION aa
FLOW POINT CONTACT OF PARTICLE ONLY
SUPPORT ROD FULLY WELDED
INTERSECTION
\ SUPPORT ROD
SECTION THROUGH SCREEN
FIG. 4 CAGE TYPE WIRE-WOUND SCREENS
66

5.4 Brass Screens
The screens shall be manufactured from brass sheets
conforming to IS 5494:1969 unless otherwise
specified. The minimum thickness of the sheet shall be as given in Table 9.
Table 9 Thickness of Screen
(Ckluse 5.4)
Distance between each slot shall not be less than
3.2 mm and each row shall not be less than 18 mm (see Fig. 5).
6 GENERAL REQUIREMENTS
6.1 The screens shall possess adequate resistance
to corrosion and incrustation due to chemical content of soil and water. Where water is of highly incrus- tating nature, the screen shall be such as to permit the water to enter the well with minimum resis- tance. Also, wherever incrustation commonly occurs,
it is desirable to choose such material for the screen that can withstand subsequent acid treat- ment for removing incrustation.
SP ( QAWSM ) 56 :- 1994
6.2 The screen shall be as far as possible of single metal construction to avoid galvanic corrosion.
6.3 Well screens shall be threaded and socketed,
plain bevel ended, collared or male and female types so that convenient lengths could be added. The slotted pipe screens shall have adequate strength
to withstand axial, collapse and hydrostatic loads to be experienced during development and use.
NOTE - PVC screen pipes shall have male threads at spigot end
and female threads at the socket end in accordance with 5.1.3.4.
7 GUIDELINES FOR SELECTION OF SLOT
SIZE
7.1
ent
the
Determination of Slot Size
The size of slot openings suitable for differ- formations shall be based on sieve analysis of
aquifer material. Following procedure and design criterion is laid down for general guidance:
A weighed quantity of the thoroughly mixed sample is passed through a set of Indian Standard sieves from No. 75 onwards. The sieves are ar- ranged such that the coarsest sieve is placed at the
top and the finest at the bottom. After proper shaking, the sieve set is opened and material re- tained on each sieve is correctly weighed. The cumulative weight passing through each sieve is
plotted on semilogarithmic graph paper having percentage weight as ordinate on arithmatic scale and size of the sieve opening as abscissa on loga-
rithmic scale. A smooth graph is then drawn through the points based on which selection of slot size shall be done.
67

SP ( QAWSM ) 56 : 3994
V GROOVE SECTION XX
NBof ODof Sizes of Slots No. of Total Area of Water Way B Distance Distance Pipe Pipe r_-h-_ Rows Slots Slots per Area, Between Between
w 1 per per Metre in percent Metre Metre mm’ Y’ Yws
-- --
152 162 0’793 40 16 2128 67500.160 13’25 2’778 3’627 19’050
-- --
152 162 1’587 40 16 1216 77191’680 15.18 4.762 6.350 19’050
--- -___
204 213 0’793 40 16 2800 88816’000 13.28 2’778 3’627 19’060
-----_
204 213 1’587 40 16 1600 101568’00 15.17 4’762 6’350 19’050
_’ Metal - Brass sheets according to IS : 5494-l 969 ‘Leaded brass sheets and strips for use in the manufacture of
tubewell strainers’. All dimensions in millimetres.
FIG. 5A BRASS SCREENS WITH VERTICAL SLOTS
-
V GROOVE SECTION XX
NBof ODof Sizes of Slots No. of Total Area of Pipe Pipe Rows
Water Way C--h--~ Slots
w L Area,
in Dia per pe:epien’
Percent Metre mm’
152 1, 162 1 0.793 1 30 ( 12 1 3300 ( 78507’000 1 15’41
-i_ I-: -k----- I- I I 152 ( 162 1 1’587 / 30 1 12 1 1884 1 89697’240 1 17.79
--I---l----l---l-----I---l I
204 1 213 1 0’793 1 30 1 16 1 4400 ~104676~000 I 15.63
__I-“_-_ I I- I I
204 ) 213 ( 1’507 1 30 1 18 1 2512 1119596.320 1 17’86
__.. - . . .- _.~. ___
B Distance Distance Between Between
S’f?s Rows
D -_-
2’778 3’627 9’525
4’762 6’350 19’525
2’770 - 3’627 11’303
4.762 6’350 , 11’303
tvtexai - Brass sheets according to IS : 5494-l 969 ‘Leaded brass sheets and strips for use in the manufacture of tubewell strainers’.
All dimensions in millimetres.
FIG. 58 BRASS SCREENS WITH HORIZONTAL SLOTS

SP ( QAWSM ) 56 : 1994
2.1 The four common reasons for gravel packing
are:
a) to increase the specific capacity of
the well,
b) to minimize sand flow through the
screen in fine formations,
c)
d)
to aid in the construction of well, and
to minimize the rate of incrustation by using a larger screen slot opening where the formation is relatively thin
but very permeable and the chemical
characteristics of the groundwater indicate potential for significant incrustation.
GRAVEL
1 GENERAL
The wells, if need be, may be gravel-packed by providing an envelope of specially graded sand and gravel around the well screen in a predeter-
mined thickness. This takes the place of the zone of permeable material which is produced around the well by the conventional 1 development. Both types ‘of wells, naturally packed or gravel packed, when properly constructed, are efficient and stable. The decision as to which to use must be based upon
considerations of the conditions and economics of each situation.
2 NEED FOR GRAVEL PACKING
3 CRITERION FOR GRAVEL PACKING
3.1 The desirability of gravel packing decreases as the water bearing formation becomes coarser. Generally, formation with an effective grain size, D,, that is that size, than which only 10 percent of the formation is finer, of more than 0.30 mm and a uniformity co-efficient of 5 or more can be safely developed without gravel packing.
3.2 In case gravel pack has to be provided in a well
where more than one formation is to be tapped, the gravel pack designed for the finest formation should be provided for all the formations, provided the average grain size of the material in the corsest aquifer is less than 4 times the 50 percent size of the materials in the finest aquifer.
CHAPTER 8
PACKING
4 CHARACTERISTICS OF GRAVEL PACK
4.1 The Gravel for use as pack shall be free from impurities, such as shale, mica, feldspar, clay, sand, dirt, loam, haematite and organic materials.
4.2 The gravel selected for packing tubewells shall
consist of hard quartz (about 96 percent SiO, or other suitable material) with an average specific gravity of not less than 2.5. Not more than 10 per cent by weight of the material shall have a specific
gravity of less than 2.25. The .gravel shall contain
not more than two percent by weight of thin, flat or elongated pieces. In case of such pieces, the larger dimensions shall not be more than 3 times the smallest dimensions. The quartz shall be of sub-rounded to rounded with minimum angular
features.
4.3 Porosity
The porosity of the gravel when laid as a pack shall
not be less than 25 per cent.
4.4 Gravel Sizes
The gravel sizes ‘shall be as given in Table. 1.
Table 1 Gravel Sizes
\ (Clause 4.4)
SI Grade Pack Particle Size IS Sieves
NO. Range [see IS 460
(mm> (Part 2) : 19853
1. A Fine gravel Over 2.0 to 3.35 2.0, 3.35
2. B Fine gravel Over 3.35 to 4.75 3.35, 4.75
3. c Medium gravel Over 4.75 to 6.3 4.75, 6.3
4. D Medium gravel Over 6.3 to 8.0 6.3, 8.0
5. E Coarse gravel Over 8.0 to 12.5 8.0. 12.,5
To avoid trouble in placing and irrespective
of gradation, packs should not contain particles greater than 13 mm.
For determination of the particle size the cor- responding sieves, selected from IS 460 (Part 2) :
1985 shall be used.
69

SP ( QAWSM ) 56 : 1994
4.5 Particle Size Distribution
The particle size distribution of gravel shall be determined by screening through standard sieves
in accordance with IS 460 (Part 2): 1985. The per- centage distribution of the sizes shall be deter- mined from a graph in which the percentage of material passing through each sieve is plotted against
the standard aperture of that sieve. Any size, say D,, will thus indicate that the cumulative weight of all the grains smaller than this size is 20 percent of the total weight of the test sample.
4.5.1The uniformity coefficient of the gravel, that
is, the ratio of its D,, to D,, sizes shall not exceed 2. A material with uniformity coefficient
less than 2 shall be classified as uniform and if greater than 2 it shall be taken as non-uniform.
4.5.2 The limiting sizes given in 4.4 are the max-
ima and minima, and the stacks containing smaller or bigger sizes as shown by sieve analysis shall be rejected.
4.6 Hardness
The gravel shall have a hardness of not less than 5 in Moh’s scale.
4.7 Pack Aquifer Ratio
The pack aquifer ratio (P/A ratio) is defined as the ratio of 50 percent size D,, of the gravel pack to the
50 percent size of the aquifer. The size of gravel when used as pack in tubewells shall be decided in accordance with the size of the aquifer material
proposed to be tapped. The gravel size, based on minimum head loss through gravel pack and mini- mum sand movement, shall be limited as below :
a) Uniform aquifer with uniform gravel pack:
Pack aquifer ratio shall be 9 to 12.5
b) Non-uniform aquifer with uniform gravel pack :
Pack aquifer ratio shall be 11 to 15.5
4.8 Thickness
The thickness of gravel pack shall be limited to 13 to 18 cm.
5 INSTALLATION
5.1 In percussion method of drilling, gravel is fed
into the annular space between the casing pipe and
the assembly pipe up to 3 m above the bottom of the slotted pipe. The well is developed using com- pressed air or by bailers. As the water becomes clear, surging or backwashing is done to make the development more perfect. More gravel is fed, if
necessary, and when the water becomes free from sand, the casing pipe is jacked up and the process repeated until1 all the aquifers are gravel packed. Care should be taken to ensure that the pack of
gravel above the bottom of the casing pipe is never
move than 3m in length as otherwise, casing pipe is likely to be locked up with the well assembly due to the friction of’ the gravel pack in between.
5.2 In rotary method, the pipe assembly is lowered
into position and gravel packing done to a suitable depth below the bottom of the housing pipe in the first instance. Thereafter, the gravel packing upto the required depth is completed after keeping the
housing pipe vertical within limits. To achieve uniform packing around the pipe assembly, in- verted cones should be used.
6 SLOT SIZE
The size of the screen slot opening is governed,
among other factors, by the size of the gravel or aquifer material which it has to retain. The slot
size for gravel packed wells should be such that it retains about 90 percent of the gravel.
7 STERILIZATION OF GRAVEL PACK
7.1 When wells are constructed using a gravel pack, sterilization of the pack at the time it is installed is recommended. It may be achieved either
by mixing calcium hypochlorite in gravel or by pouring one of the chlorine compound solutions down the tremie pipes with the gravel.
7.1.1 Gravel-Pack Design
In the naturally developed well, it has been shown that the width of the slot openin@ of the screen is chosen to retain about 40 percent of the natural formation and to permit 60 percent to pass through the openings during the development process. In the gravel-packed well, an artificially-graded gravel is chosen that will retain essentially all of the
70

SP ( QAWSM ) 561,1994
formation material;, a well screen opening is then selected of a size that will retain the gravel.
Some geologic conditions favour artificially gravel- packed wells and this design should be considered
in those situations. Some of these are discussed in the following paragraphs.
a)
b)
Fine Uniform Sand: In this type of formation,
gravel packing should be considered because larger slot openings in the screen may be
used. The open area of the screen is, accord-
ingly, greater. Low percentage of open area is characteristic of screens with small slot open-
ing. If the slot opening selected on the basis
of a naturally developed well is smaller than 0.2 mm, the gravel pack alternate should be considered.
Artesian Aquifers: In this type of aquifer
where a long screen is required and where the
pump is to be set above the screened section of the well, a smaller diameter screen can be centered in the borehole and the annular space filled with gravel. This is preferable to using a shorter screen of a diameter about the same
as that of the borehole.
c) Loosely Cemented Sandstone: Many excel- lent sandstone aquifers are poorly cemented. If a well is finished as an open hole in such aquifers, some sand particles slough from the walls of the hole and this results in a sand- pumping well.
Another reason for gravel packing of a sand- stone aquifer is that the formation material
usually provides little or no lateral support for the screen. The fomiation does not readily slump or cave against the screen during de- velopment as do unconsolidated sands. Some void spaces may remain between the screen and the wall of the hole. This leaves the
possiblity that a section of the sandstone could break off and fall against the screen and damage
d)
it at any time. Loose granular material in- serted between the screen and the wall of the
hole accomodates itself to all the irregulari- ties of the bcirehole. It supports the wall of the
hole and at the same time gives lateral support to the screen.
Extensively Laminated Formations: Some aqui-
fers consist of thin alternating fine, medium, and coarse layers. Pt is often difficult to deter- mine precisely the position and thickness of
each individual stratum and to choose the proper length of each section of a multiple slot screen corresponding to the stratifica-
tion It is usually more desirable in such a case to reduce the chances of error by design-
ing the well for artificial gravel packing.
The grading of the gravel pack should be
based on the layer of fines material in the water-bearing section. A gravel pack selected in this manner does not restrict the flow from the layers of coarsest material because the permability of the pack would still be several times that of the permeability of corsest stra- tum.
7.12 Gravel Pack Gradation--The following are logical steps in designing an artificial gravel pack:
Plot sieve analysis curves for all strata comprising the aquifer. Determine the stratum composed of the finest sand and select the grading of the gravel
pack on the basis of the sieve analysis of this material.
Gravel-pack material consisting mostly of sili-
ceous rather than calcareous particles is preferred. Up to 5 percent calcereous material is a common allowable limit.
Under most conditions, the thickness of the gravel pack should not exceed about 20 mm. Too thick a gravel pack can make final development of the
well more difficult.
71

SP ( QAWSM j 56 : 1994
GHAPTER 9
WELL COMPLETION
1 WELL DEVELOPMENT
The development of a well is its treatment for the
purpose of establishing the maximum rate of us- able water by cleaning the produced water of tur- bidity, sand, sediment or other impurities intro-
duced during drilling. All methods of drilling cause compaction of unconsolidated material around the bore hole. In addition, fines are driven into the formation and drilling mud. may invade some of
the area. Similar compaction and mud cake forma- tion takes place in consolidated materials also. These factors reduce the permeability of the for- mation adjacent to the well and act to reduce the
yield. Proper well development considerably im- proves the long term performance of the drilled well. Extensive sand pumping, before the well is brought into commission, boosts the water flow
into the’ well, avoids clogging later by removing fines from around the screen and reduces the amount of sand which might otherwise be working its way towards the pumping elements. Development cre-
ates a stable zone around the screen and contri- butes to a more efficient well, longer well life and reduced operation and maintenance costs.
2 METHODS OF DEVELOPMENT
2.1 There are numerous methods of development
and an important factor in all these is that the development work be started slowly and gently and increased in vigour as the well is developed.
The development should be started as far as pos- sible from the bottom of the screen because with
this compaction takes place as the work progresses upwards and the overlying material can move down- wards. The known methods of development are described below.
2.1.1 Overpumping
Overpumping means pumping the well at a higher rate than it will be pumped when it is put in service. It may be simpler to overpump in small wells or poor aquifers by employing the pumping equipment intended for regular use in the well. However, where large quantity of water has to be
pumped, the required high capacity pumping equip- ment may not always be conveniently available.
72
There is an objection to overpumping with a per- manent pump when considerable sand is to be pumped. The pump is subjected to excessive wear,
its efficiency is reduced and under severe condi- tions, sand-locking of pump may occur which means
the pump must be pulled, disassembled and cleaned before being put back into service. Overpumping
may also leave some of the sand grains bridged in the formation and thus only partially stabilized.
a) Continuous overpumping - The simplest and the most common method of removing fines is by pumping the well at generally 50% above the designed discharge. When water is pumped from the well, sand tends to move in the direction of the well. In addi- tion, the finer sand particles wedge against each other and form bridges across openings or voids between coarser grains. This is pre- vented by resorting to backwashing. The pump is operated at maximum capacity until maxi- mum draw-down is produced. It is then stopped and water allowed to recede rapidly and return
to its normal static level. This procedure is repeated many times until the well is sand free.
b) Interrupted overpumping -The pumping is
done with a pump capable of pumping at rates upto twice the designed discharge. The pumping is carried out in at least five steps of 0.25, 0.5, 1.0. 1.5 and 2 times the design
ed discharge without using any check or foot valve. The pumping is conducted in five
minute cycles for at least two hours or until acceptable development is achieved.
2.1.2 Compressed Air
Another popular way of development is by using compressed air but it requires considerable equip-
ment and skill on the part of the operator. The two methods generally used are :
a) Back washing (closed well methud) - It is
based on the principle of alternately forcing water
out of the well through the screen and into the aquifer by means of compressed air and pumping

from the well by airlift. A 3-way valve is turned to deliver air down the air-line which pumps water out of the well through the discharge pipe whose bottom is usually set 30 to 60 cm above the top of
the screen. When the discharged water becomes clear, the supply of air is cut off and the water in the well allowed to return to the static level which can be checked by listening to the escape of air through the air cock as the water casing.
rises in the
The air cock is then closed and the 3-way valve
turned to direct air down the by pass into the well above the static water level. This forces water into
the aquifer through the screen breaking down the bridges of sand grains. When the water level reaches
the bottom of the drop pipe, air escapes from the discharge pipe and the pressure stops increasing. At this point, the supply of air is cut off and the air cock opened to allow the water to return to its static level.
This procedure is repeated until the well is thor- oughly developed. The well, if necessary, should be bailed to remove any sand accumulated at the bottom before installing the pump.
The hook-up of the equipment for back-washing is shown in Fig. 1. The diameter of the drop pipe is usually kept about 5 cm less than that of the well pipe and that of air line usually varies from 2 to 6 cm.
b) Surging open well method - The development
is achieved by a combination of surging and pumping. Surging within the well is produced by sudden re- lease of large volume of air and pumping is accom- plished as with an ordinary airlift pump. The best
efficiency is achieved when 60% of the total length of the air-line is beneath the water surface during pumping. The efficiency reduces rapidly if sub- mergence is less than 60%. If the airline is sub- merged too deeply in proportion to the net height of the lift, an uneconomically high pressure will be required to force the air out.
The drop pipe, in this method, is kept inside the screen and lowered to within about 60 cm of the bottom of the screen. The airline is placed inside
the drop pipe about 30 cm from its bottom. The air is t&med into the airline and the well is pumped until the water appears free of sand. The air tank is pumped to maximum pressure while the airline
SP ( QAWSM ) 56 : 1994
is lowered about 30 cm below the bottom of the drop pipe. When the air tank is full the quick- opening valve is thrown open allowing the air to
rush into the well and produce a brief but forceful
surge of water. The airline is immediately pulled back to about 30 cm above the bottom of the drop pipe. Pumping by airlift is then resumed until the water is free of sand and the cycle is repeated until little or no sand is evident on pumping immedi- ately after surging.
GLOBE OR NEEDLE VALVE
THREE -WAY VALVE
/- Jt& LINE
ITH PACKING Gl
NION FLANGE
WELL CASING
DROP PIPE
DRIVE SHOE
WELL SCREEN
FIG. 1 CLOSED WELL Dewumw WITH AIR COMPRESSOR
AND
73

SP (QAWSM) 56 :1994’
The drop pipe is then raised and the cycle of pumping and surging repeated at convenient points along the screen until the entire length of the screen has been develobd. The sand which may
have accumulated at the bottom of the screen may be pumped out by lowering the drop pipe and the airline to the bottom of the well.
The ‘hook-up of the equipment for surging is shown
in Fig. 2. The compressor should be capable of developing sufficient pressure to overcome initial head of water in the airline. The recommended sizes of pumping pipe and airline are given in
Table 1.
Table 1 Recommended Size of Pumping Pipe
and Airline
Pumping Iwe size of Pumping Size of Airlhc
I/min Pipe. mm mm
450 - 700 100 30
700 - 900 125 40
1 125 : 1 800 150 50
1800 - 3 200 200 65
The air-lift is operated slowly for some time be- fore starting the development to ensure that the
screen is sufficiently open and water flows freely into the well; otherwise the screen may get dam- aged. When surging and pumping with air, the discharge should be directed into a fairly large
tank in which the sand discharged can be collected so that the degree of effectiveness and progress of development can be determined.
The method has its own limitations where the yield
is weak, draw-down rapid or submergence low.
2.1.3 High Velocity Jetting
Jetting with water at high velocity is a recent and generally the most effective method of well de- velpment. It offers the following advantages:
a)
b)
Cl
The energy is concentrated over a small area with correspondingly higher effectiveness,
It is relatively simple to apply and is
not likely to cause trouble from over- application, and
Every part of the screen can be cov-
ered selectively and if well screen
74
openings are closely spaced and cor- rectly shaped to direct the jet stream
out into the surrounding formation material so that complete develop
ment is achieved.
Pi----- PUMPING OR EOUCTOR PIPE
WELL SCREEN
Trl-H/ AIR PIPE IN POSITION TO
u-J-# BACK-BLOW
FIG. 2 OPE!N WELL ~M~OPME!NT WIni AIR ~MPIIESSOR
.
2.1.3.1 In this method the high velocity jets, work- ing through the screen openings, agitate and loosen the fine sand, silt and clay and wash them out of the water-bearing formation. These materials move
into the well through the screen openings due to the turbulence created by the jets and are removed by pumping or bailing. For this method to be most effective, it is desirable to pump or air lift the
turbid water from the well at a rate higher than at which water is being jetted into the formation. This causes a net movement of water through the screen and into the well, speeding the ‘cleaning’ process further. The simultaneous pumping makes
it possible to continuously monitor the effect of
jetting by inspecting the pumped water. The water so pumped can be reused for jet development after
pumping it into a settling tank. The equipment required for this method is a jetting tool together with high-pressure pump and necessary hose and piping. The jetting tool consists of an attachment
fitted with two or more evenly spaced horizontal nozzles having 6.2, 9.5 or 12.7 mm orifices. The diameter of the jetting tool shall be about 25 mm less than the inside diameter of the screen. The
size of the pipe for feeding water to the nozzles should be large enough to keep friction losses to the minimum. It generally ranges from 4.0 to 7.5 cm depending on the length of the pipe and dis-
charge it has to carry.
2.1.4 Surge Blocks
The fundamental intent of the development opera- tion is to reverse the flow through screen openings which rearranges the formation particles and breaks
down bridging of group of particles. This is effec- tively accomplished by surging, the outflow por-
tion of the surge cycle breaking down the bridges and the inflow portion moving the fines towards the screen and into the well.
2.1.4.1 An effective means’ of surging for develop-
ing the well is by rapid up and down motion of a plunger, called surge block or surge plunger, operated in the casing pipe and above the screen portion of the well.
Where the aquifer contains clay, the action of the plunger can cause it to plaster over the screen sur-
face thereby reducing the yield. It may also pro- duce high differential pressures which may cause collapse of the screen if it is partly or wholly plugged by clay or mud.
SP ( QAWSM ‘) 56. : 1994
The surge plunger should be operated after the well has been bailed, sufficient free flow of water into the well established and any sand that may
have settled in the screen removed.
2.1.4.2 The total time for developing a well by
surging may range from four hours for a small well
to 3-4 days for a large well with longer screens.
2.15 Explosives
These are sometimes employed in wells drilled in rocks. The blasting enlarges the hole and removes the fine materials deposited on the well face dur-
ing drilling. Charges of 14 to 230 kg are generally used, the size varying with the hardness of the rock to be broken and the depth at which the charge is to be denoted. Since the water pressure increases
with depth, heavier charges must be used at greater depths to overcome the confining effect of the greater water pressure.
2.2 Criteria for Proper Development of Tube-
wells - Development work is an essential opera- tion in the completion of drilling job. It consists of
stkps to remove the finer material and opening up the passage in the formation so that water can enter
the well through the screen more freely. Proper development is said to have been satisfactorily
done when :
a> The stabilization of the sand forma-
tion has taken place, that is, there is no further sinking of gravel and the discharge is sand free; and
b) Permeability of the formation is in-
creased by removing fines utilising proper development method.
2.3 Recommended Methods of Development
Information pertaining to various methods of de-
velopment of tubewells is given in Table 2.
2.4 Well Stimulation
Stimulation may be undertaken in addition to de- velopment, to increase the yield of the wells. It is
the treatment of the well by mechanical, chemical or other means for the purpose of reducing or re- moving an underground resistance to flow and is distinct from development which is essentially an
operation for clearing the water of impurities in- troduced during drilling.
75

SP (QAWSM 156 : 1994
2.4.1 Stimulation may be accomplished by setting off explosives in borehole in ‘consolidated stratum. This would enlarge well diametek loosen deposits of fine particles on hole wall, shatter rock around
it and achieve lo-20% yield gain.
2.4.2 Acid treatment of formation, especially in carbonate rocks, dissolves particles blocking the
flow and permits higher rate of flow into the well.
2.4.3 The most advanced technique of stimulation,
however, is hydraulic fracturing. It consists of in- jecting liquid in the well at high pressure so that the fomation is actually fracturted. The fracture occurs at 60% of overburden pressure and fmc-
tures are mostly vertical extending as radial planes from boreholes. The increase in yield of the well
is due to increased vertical communication be- tween various layers in aquifer which increases lateral flow in more permeable layers.
2.4.4 The stimulation techniques have been de-
vised for oil industry but are finding increasing application for improving ground water produc- tion both from technical performance as well as economic view point. Extensive research and ap- plication of water well stimulation techniques can potentially result in a greater and more efficient utilization of ground water resources.
3 WELL STERILIZATION/DISINCTION
3.1 Theoretically, any water introduced into the
well as a drilling fluid or for well development should be of drinking water quality. The need for sterilization arises because disease-producing bac- teria and virus enter the well through drilling equipment and fluids, soil and other material fall- ing in during construction and surface water run- ning into the hole. The well water needs to be freed not only of pathogenic becteria but of corro-
sion and incrustation fastering organisms which may reduce the life of the well. All newly con- structed wells or existing wells subjected to any repair work, etc, should be disinfected before being
placed into service. The well should be cleaned as
thoroughly as possible of foreign substances such
as soil, grease, oil etc, which may harbour bacte-
ria.
3.1.1 Chlorine solution is the simplest and most effective agent for disinfecting a well, pump, stor- age tank or piping system. A stock solution of
chlorine may be prepared by dissolving fresh chlo- rinated lime. Calcium hypochlorite and sodium
hypochlorite are other readily available disinfec-
tants for field operation.
All the exterior parts of the pump coming in con- tact with water shall be thoroughly cleaned and
dusted with powdered chlorine compound. Since any disinfecting agent can only destroy bacteria with which it comes in contact, the disinfectant should be thoroughly mixed in the well water.
Effective disinfection depends on the time of contact, therefore, the disinfectant, after being agitated
shall be left in the well for at least 4 hours, pref- erably longer. Apart from the dilution that takes place in the well, the well may also contain or- ganic materials which may combine and neutralize the effectiveness of the chlorine. Therefore, to as- sure an adequate concentration of chlorine in the
well the volume of water in the screen and casing
should be estimated. A stock solution of chlorine
may be prepared by dissolving free chlorinated lime in water, for obtaining an applied standard
concentration of 50 ppm. One litre of stock solu-
tion should be used to treat 300 litres of water.
3.1.2 The success of the chlorine treatment may be evaluated by determining the number of coliform bacteria in water after the well has been pumped for few hours. Sterlization of well, except possibly
for some pathogens is seldom 100% effective. Organisms may remain lodged in crevices or cov- ered by incrustation products and not readily pene- trated by the sterlizing solution. These continue to
multiply and sterilization at periodic intervals may
be required to control them.
76

SP (QAWSM) 56 :tlm
Table 2 Summary of Recommendations for Developments of Various Types of Wells (Clause 2.3)
SI No.
Method of Develop7
ment
Tubewell Up to and IndudIng
150min Alluvium
Tubewell Above 300upto
and Iududing 8OOmin
AllUVilUll
Hard Rock WfW
Remarks Tubewell Above 150 up to
and In&ding 300min Alhwium
loulders and
‘ebbles
(9)
Most effective
Artificial Gravel Pack
Natural Pack
4rtificial Gravel Pack
Artificial Gravel Pack
Natural Pack
Natural Pack
(6) (1) (3) (4) (5) (7) (8) (10) (11) (2)
i) effective effective Satis- factory
Satis factory
Most effective
In case of hard rock areas only pumping at normal discharge should be carried out
her pum- Cng
- - -I-
ii) Compressed lir
Satis- factory
Satis- factory
Satis- factory
Satis- factory
Over pumping should follow the develop- ment with air com- pressor wherever needed
Not every Not every effective effective
Satis- factory
Very Very Not effec- effective effective tive
Satis- Satis- factory factory m - -
-
iii) tigh velo- :ity jotting
Satis- factory
Satis- factory
Very effective
Very effectiv
Not effec- tive
Simultaneous pump- ing ofsand clay with air compressor is recommended
Satis- factory
iv) ;urge block Satis- factory
satis- factory
Satis- factory
This is not recom- mended where streaks of clay and fine sand formation are encountered
v) ixplosives Effective This usually increases the capacity of water veins and fractures
- - - -
77

SP ( QAWSM ) 56 : 1994
CHAPTER 10
TESTING OF TUBEWELLS
1 GENERAL 3 MEASUREMENT OF WATER LEVEL
Every well upon completion should be tested for and results recorded of sand content of the dis-
charge, drawdown, plumbness and alignment, depth, and chemical and biological suitability of water. These data, together with diagram of the con- structed well, formation log, mechanical analy- ses of aquifer and gravel pack, if used, and a copy of the pump and well specifications, constitute and basic data to which the results of the subse- quent tests of entire installation will be compared so that pump and well performance may be evalu- ated and the need for rehabilitation or other main-
tenance determined.
3.1 Direct Measurement
This is carried out by a steel tape or cable with a
suitable sinker attached at the end. The steel tape or cable is wound round a rotating drum. Measure- ments shall be made by measuring the length of tape or cable. Depth of immersion of sinker shall be
taken into account in the measurement. A set of
three readings shall be taken and effective will be their average. Any measurement which deviates from the average by more than 2 0.3 percent shall be discarded and new measurements taken. Accuracy
of measurement shall be as agreed between the
drilling agency and owner.
2 MEASUREMENT OF TUREWELL DEPTH
2.1. Measurement by Cables or Rods
3.2 Electric Measurement (Double-Pole Contact)
This method is suitable for measurement of depth
of tubewells for a consolidated formation. The bottom of tubewell shall first be cleaned and the depth measured by :
a> twisted metallic cable strained by a
plumb-bob, or
b) rigid rods.
With any of the above methods, three distinct
measurements shall be taken and effective one will be the average reading of the three.
For double-pole contact (see Fig. 1) a sufficiently rated battery, a reel with a length of twin electric
cable and an electrical indicating instrument as a high resistance voltmeter or a milli-ammeter are re- quired. The items should be adjusted as shown in Fig. 1. One end of the cable shall be permanently
connected to voltmeter/ammeter and the other end
connected through battery. As the cable is lowered into the tubewell, the circuit is completed as the two electrodes strike the water which is indicated by the
instrument. The depth of water levels is obtained by measuring the twin-cable length from the electrodes to the top of tubewell.
2.1.1 If the depth of tubewell does not exceed 100 m, the accuracy of measurement is + 0.5 percent. If. <the depth exceeds 100 m, the accuracy of measurement shall be agreed to between the drill- ing agency and the owner.
‘.A Measurement by Casing - .l‘hls method
applies to unconsolidated formation ana IS useu for any tubewell with casing. The depth of tubewell shall be deemed to be equal to the length of pipe lowered after the deduction of screwed ends.
Each pipe should be measured to an accuracy of 20.1 percent. The accuracy of overall measure- ment is ? 0.3 percent.
Wherever electric power is more easily available, battery may be replaced with the power supply mains. In this case, single pole method may be used. For single-pole contact, the apparatus similar
to that for two-pole contact with the difference that the contact casing is fitted with one electrode and a single cable. The circuit is completed through the
rising main as soon as the electrode touches the water. Measurement is similar to two-pole contact method. This method shall be employed only when;
the casing extends from the top of the borehole to below the water surface to be measured.
78

SP ( QAWSM ) 56 : 1994
PUMP COLUMN
\
CASING
\
INDICATING INSTRUMENT , SAMPLE V;T;CT,oNs
6 VOLT -BATTERY
GROUND \-
u CABLE
MARKERS AT
t
1.5m INTERVALS
CONTACT
/--
WATER LEVEL
TWIN CABLE
lo.df--
I CONTACT CASING
-ELECTRODES
ENLARGED VIEW t I
?=fJ OF CONTACT
OFFSET TO PREVENT AIR BUBBLE FROM
LEVEL
FIG. 1 ELEQIIUCXL APPAU?IJS wm DXJBLEI-POLE CONTACI POR DETERMINING THE WATER LEVEL IN A TUBEWELL
3.3 Air Pressure Line Method - This consists The complete air tube will be filled with air and of : the pressure reading corresponds to ‘A’. At the
a) a tube positioned between casing and the outlet pipe and extending to below
the depth of water,
b) a calibrated pressure gauge, and
c) an air pump and non-return air valve.
All the above items should be adjusted as shown in Fig. 2. For example, if water level ‘L’ is to be de-
termined, air is pumped into the air tube, until maximum reading is obtained on the pressure gauge.
time of setting, distance ‘B’ should be noted. The
required depth ‘C’ will be the difference of ‘B’ and ‘A’ readings.
4 VERTICALITY AND ALIGNMENT
4.1 If a turbine well pump is to be installed in a
well, the well should be true to line from its top to a point just below the maximum depth at which it
is proposed to set the pump. A tubewell out of alignment and containing kinks and bends or cork- screws should be rejected because such deviations
79

SP ( QAWSM) 56 : 1994
cause severe wear on the pump shaft bearings and discharge casing and in a severe cast, might make it inipossiblr to get a pump in or out. If an air-lift
or a suction pump is used for pumping. alignment
is not so important and the same is applicable IO
the submersible type of pump.
FIGS AIRPRFSSURE L~NEAPFXJIATL~FORL~XRMINSGC WATER Is%% N A TUBEWELL
4.1.1 The conditions that cause wells to be out of plumb are :
a) the character of the sub-surface material
penetrated during drilling,
b) the trueness of the pipe used as well cas-
ing, and
c) the pull-down force on the drill pipe dur-
ing rotary drilling.
While drilling, gravity tends to make the drilling
bit cut a vertical drill hole. Varying hardness of the materials being penetrated, however, deflects the
bit from a truly vertical course;
4.1.2 The measurements made are of the plumb-
ness and straightness of the cased hole. Thus, an oversized hole may be out of plumb but the casing
may fall within specified limits. The casing should not be permitted to excessively encroach 011 the
annulus and hinder placement of grout or gravel
pack.
4.13 In case of gravel-shrouded tubewells, if the
pipe assembly is found inclined in a slant position
before completing the gravel pack, the assembly should be pulled in a desired direction by suitable
methods with a view to rectify slantncss and bring-
ing the pipe assembly within the permissible limits
of verticality. The gravel pack should be com-
pleted immediately after the verticality has been
tested and rectified.
4.14 The verticality of the tubewell shall be tested
by using plumb or plunger E (see Fig. 3) 6 mm
smaller in diameter within the inside diameter of
the well casing. The plumb may be made from a piece of sheet steel or a short piece of pipe. Which-.
ever is used, it shall be heavy enough to keep the
plumb line taut. The hub of the ring shall not be
solid as the water shall pass through it as it is
lowered in the well. The hole F from which the
plumb line A passes shall be in the exact centre of
the ring. Knots or marks shall bc made every 3 m
on the plumb line to indicate the depth to which the
ring has been lowered in the well. The plumb shall
be suspended from the guide pulley where it shall
be at least 3 m above the top of the well. The guide pulley is fixed on a tripod or frame B as. shown in
the tigure. The vertical centre of the pulley shall
be so located that the plumb line A comes off its
outer edge exactly over the centrc D of the well casing. The results shall be recorded in Form A.
4.15 For tubewells encased with pipes up to 3.50
mm diameter, the verticality of the tubewell shall
be measured in terms of clear cylindrical space available within the housing pipe after the con-
struction of the tubewell.
4.15.1 Verticality of the tubewell mayr have a de-
viation so as to provide clear cylindrical space not
less than the clear cylindrical space available in a
hypothetical tubewell of the same size but having deviation of 10 cm per 30 m in one direction and
in one plane only.
4.152 The verticality of tubewell is to be tested
as gvien in 4.1.4 After the necessary computation
is made, cross sections of housing pipes at differ-
80

SP ( QAWSM ) 56 ; 19e(
ent depths are drawn on a graph and clear cylindrical space is determined. The cylindrical
space of the actually constructed tubewell shall be
referred to as ‘G’ in the following paragraphs.
3m
GUIDE PULLY C
PLUMB LINE A
TRIPOD B
EXACT WELL
>
KNOTS EVERY 3m
HOLE F
PLUMB RiNG E
FIG. 3 ME~ODOFPLLMBING AWw
4.1.5.3 Cross ‘sections of hypothetical tubewell iden- tical in .dimensions to the actual tubewell but ~_ __~ having deviation of 10 cm per 30 m in one direc- tion and in one plane are drawn on the graph sheet and the minimum allowable cylindrical space ‘H’ is determined.
4.1.5.4 If cylindrical space ‘G’ of the actually con- structed tubewell is equal or more than the cylin- drical space ‘H’ of the hypothetical tubewell (having deviation 10 cm in 30 m in one direction and one plane), the tubewell actually constructed shall be considered within the permissible limits of verti- cality.
4.1.5.5 As an example, cross sections of two tu- bewells Gl and G2 having 300 mm diameter of housing pipe have been drawn after computation of verticality results in Fig. 4 and Fig. 5 while Fig. 6 shows the cylindrical space H of hypothetical
tubewell having deviation of 10 cm per 30 m depth of the tubewell. It will be noticed that space GI is more than space ‘H’, while space G2 is less than the space ‘H’. Therefore, tubewell Gl shall be con-
sidered within the limits of verticality while G2 is not within the limits of verticality.

SP ( QAWSM ) 56 : 1994
5 TESTING FOR YIELD AND DRAWDOWN
5.1 The drawing off of water through a tubewell
results in lowering of water level. This drawdown creates a hydraulic gradient in the water-bearing material with the result that underground flow into the tubewell takes place. The rate of inflow de- pends upon the hydraulic gradient, permeability and saturated thickness of the water bearing mate- rial and tube well construction.
5.2 After the well has been completely constructed and cleaned out and the depth of the well accurately measured, this test should be carried out.
5.3 This test is conducted by installing a test pump
in the tubewell temporarily and pumping out water. At each rate of discharge,pumping is carried out at least for 30 minutes. If the water level and dis-
FIG. 6 H
charge are found to be fluctuating, development is carried out for some more hours, until the dis- charge becomes steady and sand content is within tolerable limits. The specific capacities of the well for various pumping rates is computed based on drawdown test data. Discharge may be measured by any method detailed in IS 5120 : 1977.
5.4 Since the yield is influenced by a number of factors such as geological formation, rainfall, neigh- bouring tubewell, etc, the pumping rate shall, in general, not exceed 60 percent of the yield deter- mined by test. It is recommended, however, that geological advice should’ be obtained on the per- centage to be adopted for each location.
6 QUALITY OF WATER
6.1 In the construction of the well, due precautions shall be taken by the drilling agency to maintain
82

the premises in a sanitary condition and to avoid as much as practical, the entrance of contaminated water into the water-bearing formations. Any water or materials, used shall be free of contamination
and, if their nature permits, adequately disinfected with chlorine before use. A slush pit should be constructed so that no material enters the well, except mud reused when the construction is by
rotary method. In such cases the slush pit and mud return channels should be protected against con- tamination from surface water or any othr sources.
6.2 Water shall be collected during aquifer per-
formance test and analysed chemically as desired
by the owner, for different constituents depending on the ultimate use to which water will be put.
SP ( QAWSM) 56 : 1994
7 HANDING OVER OF TUBEWELL
7.1 The following information should be furnished
by the testing agency to the owner on completion
of testing of the tubewell :
a)
b)
cl
7.2
Results of the tubewell depth and water level
measurements,
Report on the chemical and bacteriological
analysis of water, and
Results of development and drawdown test as given in Table 1.
A typical proforma to furnish the details in accordance with 7.1 is given in Form B.
83

SP ( QAWSM ) 56 :‘I994 .
Table 1 Test Results
(Clause 7.1)
A. Normal Test
SI.
No.
(1)
Rated
Discharge
(m’/s)
(2)
Depression
at Rated
Discharge
(ml
(3)
Specific
Yield
(4)
Total
Hours
RIUI
(JO
(5)
Sand in
ppm at Jbd
of Test
(6)
static P-Pk!J
Wmter W8ter
Level Level
(ml (ml
(7) (8)
B. Discharge at 1.2 times normal yield or 1.5 times normal depression
SpecJJJc Yield Total Hours
Run
(h)
Sand Jo ppm
at End of
Test
static water
Level
(ml
Pumping
Water
Level
(ml
(1) (2) (3) (4) (5)
84

SP ( QAWSM ) 563 I994
FORM A (Clause 4.1.4)
VERTICALITY TEST REPORT
Nameofkork:. ................
Pump Serial No:. ................
Conducted by:. .................
In the presence of: ...............
Date:. t ........................ L
I.D. of well: . . . . . . . . mm
-1 ~~~~~~~~~“l.‘;:::.‘....‘::;...~::.’.’.’;.::~~ Point of suspension: ....... . m above top of well
Static water level:. ................... .m Depth of well housing:. ................ m
Signature of Customer.. . . . . . Signature of Tester. . . . . . . . . . . . . . .
FORM B (Clause 7.2)
INFORMATION TO BE FURNISHED BY TESTING AGENCY TO OWNER ON COMPLETION OF THE
1.
2.
3.
4.
5.
6.
7.
8.
i 9.
TESTING OF TUBEWELL
Agencyconductingthetests .................................................................
Locationoftubewell ......................................................................
Dateofstartillg ..........................................................................
Dateofconlpletion .......................................................................
Totaldepthoftubewell ...................................................................
Method adopted .........................................................................
Depthofwaterlevel ......................................................................
Methodadopted .........................................................................
Results of verticality and alighment test. ....................................... .' ..............
Drawdown test: Time of test. ...............................................................
Speed rev/min. ..................... .Discharge. ................ .Period ‘run. ..................
Rateddischargeinl/min ..................................................................
lO.Depression head of the production well. . . . . . . . . . . . . . . . . . . . . . . . . . . . . . . . . . . . . . . , . . . . . . . . . . . . .
11. Sand contents in ppm at the rated discharge after 20 minutes of the start of the pump or 20 percent in excess of
the rated discharge if 50 percent extra depression cannot be arranged. . . . . . . . . . . . . . . . . . . . . .
12.Recommendation with regard to a suitable pump. . . . . . . . . . . . . . . . . . . . . . . . . . . . . . . . . . . . . . . . . . . . . . . . .
13. Further details appended:
Chemical and bacteriological analysis of tubewell water
14. Remarks:
Owner . . . . . . . . . . . . . . . . . . . . . . . . . . . . . . . . . . ..Tester . . . . . . . . . . . . . . . . . . . . . . . . . . . .
85

SP (QAWSM) 56 : 1994
CHAPTER 11
WELL MAINTENANCE
1 GENERAL
Wells, like all other engineering structures, need regular, routine maintenance in the interest of a continuous high level of performance and a maxi- mum useful life. The maintenance of wells and pumps is often neglected, since the greater portion of both the well and the pump are located beneath the ground surface. The nature of deterioration which occurs in a well may not be readily discern-
ible during operation and may not be recognized until the well fails. The deterioration usually de- velops slowly to a critical point and then acceler- ates rapidly to failure. Therefore, any neglect of well maintenance often results in the complete loss of the well.
2 FACTORS AFFECTING WELL PERFORM- ANCE
2.1 Several factors initiate well losses in ineffi-
cient wells. Care should be taken to differentiate between those factors associated with the normal wearing of pump parts and those directly associ- ated with changing conditions in and around well. A well may show a reduced yield becuase of reduc- tion in the capacity of the pump due to excessively
worn parts. On the other hand, the excessive wearing of pump parts may be due to the pumping of sand entering the well through a corroded screen. It is also possible for corrosion to affect only the pump, reducing its capacity but to have little or no effect
on a properly designed well.
2.2 The common reasons of decrease in yield of a well include: (a) losses caused by reduction in permeability from mud invasion or by compaction and shearing of the formation face during drilling, and (b) losses from the turbulent flow of water ad- jacent to the well through the screen or well and inside the casing to the pump intake.
3 PREVENTIVE DESIGN FEATURES
3.1 High well losses are unnecessary since can be minimized by a good well design and struction. Therefore water well maintenance
face
they con- pro-
cedures begin with the techniques implemented during the drilling of the original well and con-
tinue with the type of materials used and with the
extent of care, or the lack of it, that the well is given over the months and years of operation.
3.2 A critical well design feature is the entrance
velocity through the screen. An ideal entrance ve- locity is 1.5 to 3.8 cm/s depending upon the aver- age permeability. Maintaining low entrance veloc- ity results in high efficiency, minimizing sand
pumping and reducing the rate of corrosion and in-
crustation in well. The distribution and shape of slot openings is as important as the entrance veloc- ity in influencing well efficiency.
3.3 A comprehensive design of the well system includes certain features in the discharge and dis- tribution facilities to permit proper monitoring
and maintenance of the well and pump. The more important of these features are :
a)
b)
C>
d)
e)
provision of an outlet in the discharge
system to permit diversion from the system during future test pumping and water sample collection,
a permanent throttling valve on the discharge,
a permanent airline with valve and
gauge for water level reading,
access into the pump chamber casing which can also be used to measure
water levels to permit back up water level reading by tape or electric probe, and
ready access to the well to pull the
pump and maintain the well.
4 MAINTENANCE PLANNING
4.1 The planning of well maintenance procedures should be based on a system of good record-keep- ing. The problems that result in reduced well yield
occur at and around the well screen and are very much out of sight. The analysis of good records must, therefore, be relied upon for detection of problems in the well.
86

SP ( QAWSM ) 56 ::1994
4.2 Among the records kept should be pumping rates, draw-down, total hours of operation, power consumption and water quality analysis. Pumping rates and drawdown are particularly useful in de-
temining the specific yield which is the best indi- cator of existing problems in a well. The specific yields of wells should be checked periodically and compared with previous values to determine if any
significant reduction has taken place. Such a re- duction is often due to clogging of well screen and formation around it by incrustation.
4.3 Power consumption records also provide valu-
able evidence of existence of problems in wells.
An increase in power consumption, not accompa- nied by a corresponding increase in the quantity of
water pumped, indicates problem in either the pump or the well. If an investigatiion shows no problems in the pump nor appreciable increase in
the dynamic head against which the pump is oper-
ating, then it is most likely that a problem exists in the well and the problem is causing an increased drawdown. A check on drawdown should then be undertaken and the well checked for incrustation.
4.4 Regular chemical analyses of water will indi-
cate the type of incrustation that might occur and the expected rate of deposition in the well and its vicinity. The quality of water in some wells changes slowly with time and only a regular analysis would detect such changes.
4.5 In wells, the waters of which have a high in-
crustation potential, the frequency of observations of all types should be as high as possible and consistent with the use to which water is being put. Observations should be much more frequent in wells serving a community.
5 INTERPRETATION OF OBSERVED OR MEASURED CHANGES IN WELL PERFORM- ANCE OR CONDITIONS
5.1 A decrease in specific yield without a propor- tional decline in the static water level may indi-
cate blockage of the screen by accumulated sedi- ment in the bottom of the well, blockage of the
screen or gravel pack by incrustation, or collapse of casing or screen.
Should the specific yield during a test for yield and draw-down show a decline of 10 percent or more
from the original test (see 5 of Chapter 10) at a
given discharge, the well should be surveyed to determine the location and extent of possible con- tributing conditions. If collapse appears to be the problem, the well should be surveyed to determine
the location and nature of the collapse. If collapse is not the problem, the inside of the well should be scraped and the sediment that was subsequently bailed from the bottom should be examined to determine the chemical composition, nature and
extent of the encrusting material as a basis for a plan of rehabilitation.
5.2 An increase in the sand content of the dis-
charge, particularly if it is associated with a
measurable accumulation of sand in the bottom of the well, may indicate enlargement of slot sizes by
corrosion; settlement of gravel pack beneath a bridge leaving an unpacked zone opposite a screened section; a break in the casing or screen, usually at a joint; or failure of a packer seal. Mechanical and
mineralogical examination of a sample bailed from
the bottom of the hole and comparison with the original description of the aquifer and gravel pack materials made during construction of the well
may give some indication of the nature of the
difficulty. If the material is noticeably smaller in grain size than the grain size of any aquifer screened in the well, or if the material contains the full range of sizes of the gravel pack, there is probably a break in the casing or screen. If all the material is smaller than the screen slot sizes, it is probably
a bridge. If the above interpretations of grain size
and distribution are not applicable, the problem may be due to enlargement of a slot size by corro- sion. If the problem is apparently due to bridging, it can frequently be corrected by redevelopment
while pouring water down the gravel refill tremies and the addition of gravel pack material. The other problems usually require a photographic survey to be made of the well to more clearly assess the problem. Decisions can then be made concerning the practicability of rehabilitation and the proce- dures to be followed.
5.3 Settlement of the land surface around a well,
the development on the ground surface of small drainage channels towards the well, and cracking
and settlement of pump pads and foundations are all indicative of settlement of the well structure. In some areas, the problem may be associated with land subsidence due to excessive pumping of the
87
SP ( QAWSM ) 56 : 1994
aquifers. Usually, however, the problem is related to poor well design, construction, or development, and results from excessive pumping of sand. In many instances, the sand pumping is complicated
by collapse of casing or screen, bridging of grave1 packs, and similar deterioration. When such con- ditions are encountered, the well should be taken out of service, sounded for depth, and surveyed photographically to determine whether any struc- tural damage has ocurred. If the well cannot be shut down because of the need for water, the
casing should be temporarily supported by weld- ing heavy I-beams to it.
5.4 Decline in pump discharge and head may be due to deterioration of pump or simultaneous dete-
rioration of both the well and the pump. A common occurrence is a decrease in shut-in head and sig- nificant decrease in discharge without a corre- sponding decline in static water level and specific
yield. Such an occurrence is usually due to one of the following conditions : (1) improper adjustment of the impeller due to wear or other causes, (2) a hole in the column pipe, or (3) erosion of the impeller or bowls.
A condition which is usually associated with con-
siderable vibration when the pump is running. If the condition cannot be corrected by adjusting the impellers, the pump shouli‘ be pulled and repaired or replaced. The cause of the problem should be
thoroughly investigated and made a part of the per- manent well and pump record.
5.5 Excessive vibration of the pump may result
from imbalance of the impeller or from the pump being installed in a crooked well. A pump which makes a crackling noise similar to gravel being
thrown on a tin roof is probably experiencing cavi- tation at the impellers. This is particularly true if the discharge is surging and irregular and contains considerable air. The condition usually results from a decline in the static water level or reduced well
capacity because of incrustation or accumulation of sand in the screen. Either of these conditions results in excessive drawdown for pump and a
decline below that required in the available net positive suction head. If the condition is due to a decline in the static water level, it can usually be
corrected by lowering the bowls. In severe cases, it may be necessary to add additional stages and a
larger motor in addition to lowering the bowls. The well should also be checked for possible in- crustation of the screen or other causes of reduced
efficiency.
5.6 Excessive heating of the motor is occssionally encountered and is usually associated with an over- load condition and the consumption of excessive
electrical energy. Such heating may be caused by a poorly adjusted impeller which is dragging on
the bowls, too tight a packing gland, improper or unbalanced voltage, poor electrical connections,
or improper sizing of motor.
Occasionally, an inadequate discharge will be as-
sociated with trash that has lodged in the bowls or blockage of the impellers or bowl chamtels by products of corrosion and incrustation. Correction entails pulling the pump for repair. These condi- tions may also be reflected in overheating of the motor. Where overheating is encountered, the installation should be first checked by an electri- cian to determine whether the trouble is in the
power system or in the pump, rather than in the well.
5.7 Occasionally, a noticeable increase in oil con-
sumption is encountered in oil-lubricated pumps. The excessive consumption may be due to a hole in the wall of the oil tubing or excessive wear on a packing gland in the tubing. These conditions can result in a decrease in differential pressure in the oil tubing and loss of oil into the well. The first
condition can result in inflow of water into the tubing and formation of an emulsion of water and oil. The emulsion lacks adequate qualities and can result in excessive wear or burning out of the bear- ings. The escape of oil into the well can result in
the accumulation of oil floating on the water sur- face in the casing. With adequate pump submer- gence, this latter condition may not cause serious trouble but if draw-down increases due to a decline in water table or deterioration of the well, oil may
be drawn into the pump, causing impairment of water quality. In addition, the presence of oil may contaminate the groundwater and preclude accu- rate measurement of static water and pumping water levels.
5.8 Small capacity wells usually have discharges of less than 500 Vmin. Casing and screen used for such wells commonly are 15 cm in diameter or

SP(QAWSM)56:1%
smaller, and materials used in their construction are relatively light in weight. While the observa-
tions and measurements outlined above are equally applicable for large capacity pumps and wells
they are usually difficult to justify economically.
6 CHLORINATION
6.1 Chlorination shall be done at least twice a year before and after monsoons and whenever there is a possibility of pollution having occurred due to
natural calamities like floods or damage to plat- form.
6.2 In case of the hand pump installation, following procedure shall be followed :
a> Put 300 g of bleaching powder in a bucket of water;
b) Mix it thoroughly;
cl Remove the four bolts from the lower part of the hand pump’s water tank.
Lift water tank and clamp riser pipe
to the raised position;
d) Pour chlorine solution into open end of pedestal;
e) Lower water tank and bolt it back to
pedestal. Tighten fully;
f > Stop pumping when the water smells strongly of chlorine;
g) The handpump must not be used for at least one hour. But it is better if the handpump is not used for 6 hours or
more. So, ask the villagers not to use it until the next day;
h) The next day, pump until the taste of chlorine is just noticeable in the water;
j) Collect a sample of the water. Use a sterile bottle. Seal the bottle and label it; and
k) Send the sample for bacteriological
examination.
89

SP ( QAWSM ) 56 i 1994
CHAPTER 12
WELL REHABILITATION AND ABANDONMENT
1 WELL REHABILITATION d)
1.1 The rehabilitation of well means repair of
wells which have failed because of collapse, bro- ken casing and screen or other similar damage, and the treatment of wells which have begun to pump sand, have experienced a change of water quality or have shown a marked decrease in discharge and efficiency because of incrustation, or other factors
whit_: tend to reduce the intake area of the screen and permeability of the adjacent aquifer. It shall be undertaken when the specific yield falls to about 80 percent of the initial value.
e)
f)
g)
1.1.1 The cause and extent of well sickness must be diagnosed before the rehabilitation programme is undertaken.
1.1.1.1 ‘If the decrease in yield is due to the lower-
ing of water table in the aquifer as a result of over pumping or interference from other wells, then nothing can be done.
j)
1.1.1.2 However the failures due to incrustation,
corrosion, improper design, gravel placement and faulty construction may be remedied by a suitable rehabilitation programme.
k)
m) 1.1.2 The major problem in rehabilitation is esti-
mating the exact nature of the deterioration since
the screen and other components most likely to de- teriorate are not open to usual inspection or test-
ing. This may be overcome to an extent by ade- quate investigation and planning prior to undertak- ing the work as given below.
n>
1.1.2.2 Investigations to be carried out by the
contractor
1.1.2.1 Information to be given by user The following data shall be determined for
reference when starting rehabilitation of any well: The following information shall be made available by the owner:
a) Initial and present well yield, depres- sion, and water level as observed periodically during the well’s serv- ice life;
b) Sand content in ppm, if any;
c) Grain size distribution of the strata
tapped as a result of sieve analysis;
a)
b)
4
4
e)
0
d
Location of screen, its opening size, percentage of screen surface area to
the total open area, screen material, length and diamter of screen and well
pipes, etc, and data of acceptance of the well;
Size and quantity of pea-gravel used initially and during its service life;
Method used and details of develop- ment with results;
Method of drilling adopted, name of
drilling agency, original pump and well test results and results of subse- quent tests, if available;
Results of the initial and present chemi-
cal analysis of the well water;
Details of any chemical treatment, if
ever given to the well and results achieved therefrom;
Sounding of the well observed every
year;
Details of repairs to the pumping equip- ment carried out every year; and
Number of electricity units consumed per kilowatt ratings every year dur- ing service life of the well.
Date of acceptance of well;
Name of contractor;
Method of drilling;
Method of formation sampling;
Formation log;
Mechanical analyses of aquifer samples;
Mechanical analyses of pack material;
90

Sp ( QAWSM ) 56 : 1994
carried out and location of any evi- dence of incrustation, organic growth or accumulation on the casing and screen recorded. Also, any filamen-
tous algae, iron bacteria or similar organisms floating in the water shall be noted. Any evidence of mechani-
cal damage to the casing and screen shall be carefully inspected with the camera and recorded with regared to its description and depth;
d) The present specific yield at design
discharge rate and draw down, low
enough to permit continuous pump- ing for 4 hours, without breaking suc- tion, shall be determined. This will give a qualitative measure of the degree
of deterioration and by comparison with the later tests, the success of rehabilitation programme;
e) The pump shall be pulled out and
various parts examined immediately as they are removed from the well. The column pipe, drive shaft, bear- ing spiders and bowl shall be in-
spected for evidence of excessive ac- cumulations or deposits of ferric or ferrous hydroxides. If the deposits are present, sufficient samples shall be collected to fully fill a bottle capable
of being sealed airtight. This shall be done as rapidly as possible and the samples sent to the laboratory imme- diately, so as to avoid generation of
heat in the sample. The samples shall be sent to the chemical and biologi- cal laboratories for identification of
chemical compounds present and iden-
tification, if possible, of organism involved;
h)
j)
k)
m)
n>
P)
4)
r )
Screen materials, slot sizes, diame- ters and depth of setting;
present open area of screen, design
inflow velocity;
Depth, diameter and material of pump chamber;
Method and completeness of devel-
opment;
Original pump and well test results
and results of subsequent tests with dates;
1) Static Water level
2) Measured depth of bottom of hole
3) Discharge
4) Draw down
5) Specific yield
6) Step tests
7) Production tests
Ground water hydrographs of the area;
Quality of water analyses of well with
dates; and
Resume of maintenance, rehabilita-
tion and performance.
1.1.2.3 The following investigations shall be carried out and data determined before starting rehabilitation on any well :
a) Chemical and bacteriological analy-
sis of the well water shall be carried out and compared with the original one, with regard to its original and the present apparent incrustation po-
tential. If it is high or has increased with time, treatment may be required;
b) If the well is yielding sand, the dis- charged sand sample shall be col- lected and compared with the origi- nal formation log so as to locate
precisely the position of the possible rupture or loose connection, etc;
c) If equipment is available, an under-
water photographic survey shall be
f 1 The pump parts shall be examined for evidence of pitting, tubercula-
tions, graphitization, cavitation and wear. Pump bowls and impellers shall
be inspected for evidence for graphi- tization in areas where sulphate-bac- teria are known or suspected to be present; and
91

SP ( QAWSM) 56 : 1994
h) The static water level and depth of the bottom of the well assembly shall be checked when the pump is taken
out of the well.
1.1.3 Acid Treatment
Acid treatment using hydrochloric (muriatic) or sulfamic (I-IrNSO,H) acid is commonly employed for rehabilitation. It efficiently eliminates incrus- tation due to calcium, magnesium and iron carbon- ates, or iron hydroxides which can be detected by examining the scrapings from the inside of the
screen for chemical composition.
The strongest grade of muriatic acid, designated the ‘27.92 percent hydrochloric acid, is used in full
strength for acidizing. The amount of acid added for a single treatment is 1.5 to 2 times the volume of water in the casing, screen and gravel pack between the bottom of the well and 3 m above the topmost screen slot. It is poured through a black iron or plastic pipe 38 to 50 mm in diameter and long enough to reach the bottom of the well. Acid to fill 1.5 to 3 m of screen is poured first; the
conductor pipe raised about 1.5 to 3 m to pour more acid and the process is continued till all the acid has been added to the well. The acid, being heavier than water, displaces it as it is poured.
Iron and manganese hydroxides and oxides, al- though soluble in hydrochloric acid, precipitate out if pH is above 3. To keep iron in solution, regardless of pH so that it can be pumped from the well with spent acid, a chelating agent like Roch- elle salt, citric acid, tartaric acid, phosphoric acid or glycolic acid may be added to the acid. About 900 g of chelating agent may be used for 4.5 1 of hydrochloric acid.
To curb the tendency of the acid to attack metallic
casing and screen, either inhibited acid or an in- hibitor such as knox gelatine should be used. 2.3 to 2.7 kg gelatine dissolved in warm water and added to 450 1 of acid serves the purpose. The acid is left in the well for about 4 to 6 hours. At the end of about 3 h, sufficient water is added to displace the
acid from 3 m above the topmost slot to the bottom of the well. While the acid is in the well, it is surged by air or with surge block for 15-20 minutes
each hour. The acid is bailed out at the end of about 6 hours.
Hydrochloric acid is dangerous to use unless handled by experienced personnel and suitable equipment. It gives off poisonous fumes and its reaction with
carbonates is some times violent spraying around
the well. The transport of liquid hydrochloric acid
to the field is also not easy.
Hydrochloric acid of adequate strength is readily
available at a relatively low price. It has been used observing safety precautions and no injuries or casualties have resulted. Under the circumstances,
it appears that hydrochloric acid, despite the dan- ger and difficulties associated with its use, will continue to be used. However, if trained and expe-
rienced crew are not available to carry on the acidizing work, consideration shall be given to employing the less dangerous sulfamic acid.
It is for these reasons that sulfamic acid is being,
increasingly used for well rehabilitation. it is more expensive than hydrochloric acid but less aggres- sive and safer to use and easily shipped and stored
as dry crystal or powder. Its corrosive effect on well screens and pumping equipment is markedly less. It, however, requires about twice as long to treat a well as does hydrochloric acid.
When using sulfamic acid in a well, the same es-
timates are made regarding the column of water in the well to be displaced and 1.5 to 2 times that volume is poured into the well through a black iron or plastic pipe as described earlier. It is avail-
able in granular form and may be poured into the well from the top.
Because sulfamic acid is a milder and less aggres-
sive acid, it is mixed in a black iron or wooden tank at the surface. A tank about 1.2 x 1.5 x 3 m is
usually adequate and holds about 5360 1. The tank shall have a bottom valve through which the acid
solution is drawn into the well. 41 kg sulfamic acid, 450 g of pluronic F68 and 2.7 kg chelating agent such as Rochelle salt, citric acid, tartaric acid, etc, are added and dissolved in each 450 1 of water to be poured into the well. If well is screened with metal, an inhibitor such as knox gelatine shall be used at thl.: rate of 1.8 to 2.3 kg per 450 litre of solution. The acid shall remain in the well for at
least 12 hours during which it shall be surged by air or surge block about 15 to 20 minutes every hour . Then it is bailed or pumped to waste.
92,

The spent acid is bailed or pumped out of the well using a corrosion-resistant pump for the purpose. In many wells, pumping with a centrifugal pump is possible. Close observation of the bailing or pumping
discharge and the draw-downs du_ring removal of the acid shall give an indication of the success of
the treatment.
During acid treatment of a well the crew shall wear protective clothing and respirators. One or two 250 1 drums of concentrated sodium bicrabonate shall be available for quick neutralization of acid
with which crew members may come in contact during the operation.
During treatment, incrustation is dissolved and the
fines incorporated in the agent remain in the pack and base meterial. On completion of acidizing the well shall be redeveloped using polyphqsphate, sufficient chlorine for a shock treatment and one
of the methods of surging or jetting.
1.1.4 Glossy Phosphate Treatment
Glossy phosphates (polyphosphates) act by dis-
persing clays and salts and loosening their adhe- sion to sand and gravel so that they may be readily pumped out of the well. Treatment with one of the
polyphosphates, coupled with vigorous agitation,
effectively breaks up the incrusting material and cleans the well. An important advantage is that polyphosphates are safe to handle.
The polyphosphates are usually used in conjunc- tion with a wetting agent, sodium carbonate and chlorine compound. The wetting agent facilitates
the penetration of the polyphosphate solution into the fine-grained material and hastens the opera- tion. Sodium carbonate has a cleaning action on rust on iron screens and pipes and also serVes to
neutralize the effects of oil and other organic compounds that might interfere with thr, action of chlorine. chlorine acts as a catalyst and apparently improves the action of the polyphosphates besides sterilizing the well and the adjacent formations.
NOTE - Under some circumstances, the wetting agents
cause too rapid a breakdown of the fabric. Therefore, until
more is known of the fabric and composition of the aqui-
fer, it is recommended that wetting agents be omitted from
the solutions.
SP (QAWSM ) 56 : 1994
In wells screened with fibreglass-reinforced ep- oxy, sodium carbonate may be left out of the solution without any loss of efficiency.
1.1.4.1 The following procedure may be adopted
for rehabilitation:
Estimate the volume of water in the pack and
screen between the water table and the bottom of the hole to the nearest 450 1. On the basis of the following amount of reagents per 450 1 of water in the well, estimate the amount of various chemicals
required :
4 For fibreglass-reinforced epoxy screens - Sodium hexametaphosphate
3.6 kg;
b) For metal screens-In addition to the
above 900 g sodium carbonate; and
c) Should experience show use of a wetting agent is helpful, 450 g pluronic F 68 or equivalent.
Most wells contain between 10,900 to 15,900 1 of water. A wooden or black iron tank 1.2 x 1.5 x 3 m is a convenient size for transportation, etc, and holds in excess of 5 360 1 of water. Therefore, two or three batches of solution mixed in the tank shall be required for each well. A convenient but not
necessary arrangement that speeds up the opera- tion is to use two tanks in order that the next batch of solution may be mixed while the previous one is
being placed in the well.
The solution is poured or pumped into the well
through a 38 or 50 mm plastic or black iron pipe that initially is installed from the surface to about 1.5 m above the bottom of the well. Sufficient solution is put in the well to displace an estimated 1.5 or 3 m’of the water in the casing and pack. The pipe is then raised 1.5 or 3 m and the procedure repeated until all water in the well and pack are
displaced by the solution. The solution has higher specific gravity than the water and displaces it upward and outward from the well. When all the solution is installed in the well, a volume of water
equal to about one-half that contained in the cas- ing and screen in poured is_ at the top to displace the solution from the screen and force it out into
the formation (see Table 1). A 200mm casing con- tains about 11 1 and 200 mm screen about 18 1 of
93

SP ( QAWSM ) 56 : 1994
water per metre of length. A surge block bail or similar tool is then run from the bottom of the well to above the water table two or three times of the inductor pipe for air surging may be replaced to
near the bottom of the well and air bubbled up through the well to thoroughly mix the solution remaining in the casing screen.
1.1.5 Chlorine Treatment
Chlorine has been found effective in loosening clogging of the intake section of the well and water-bearing formation caused by deposition of iron oxide. Chlorine, when added to water ,forms hypochlorous and hypochloric acids, which kill
the bacteria and produce an effect of ‘burning up’ the organic slime.
Sufficient amount of calcium or sodium hypochlorite
to give a concentration of 100 to 200 ppm of free chlorine is added to the well either directly or in water solutions. Alternatively, chlorine gas may
be used but it is dangerous and requires experi- enced personnel and equipment which may not always be available. It must be put into the well in a water solution as it is both corrosive and toxic
when inhaled. Hypochlorite solutions are cheaper, more convenient and safer to use than gas but generally less effective.
Table 1 Contents of Casing and Screen
(Clause 1.1.4.1)
Contents of Casing and Screen
Nominal Pipe Size Litre per 300 mm
(mm) of Lxgth
100 3.0
125 I
4.6
150 6.8
200 12.0
250 19.0
300 26.4
350 32.2
400 43.0
450 54.0
500 67.0
550 at.8
600 98.0
The chlorine solution is introduced in the well through a small diameter plastic pipe. A quantity of 14 to 18 kg added slowly over a period of 12
hours shall suffice for a large well. The pipe car-
rying chlorine must be positioned so that the solu- tion does not impinge directly upon any part of the pump, well casing, or well screen. After introduc- tion,’ the chlorine solution is forced into the water- bearing formation by adding about 50 to 100 times
the volume of water standing in the well.
The well shall be surged or the solution agitated vigorously as in acid treatment.
Repeated chlorine treatment will have more chance
of flushing the clogged formation around the well. Alternate acid and chlorine treatments are found to be even more effective.
1.1.6 Dry Ice Treatment
The use of dry ice, that is, solid carbon dioxide is still in the experimental stage. Dry ice changes from solid to gaseous state rapidly with consider- able pressure, when put into well water. The rap- idly expanding gas is confined within the well casing and is forced through the screen openings
to loosen the clogged material. On account of high
pressure developed, provision shall be made for the control and relief of pressure to guard against any damage. As dry ice may cause severe burns, if
handled with bare hands, heavy gloves or tongs shall be used in handling the ice.
1.1.7 Explosives
These are sometimes employed to develop and enlarge crevices and fissures in tubewells drilled in hard rocks. Charges of 30 to 500 kg are used
according to the hardness of the rock and the depth at which the charge is to be detonated.
1.1.8 Criteria for Acceptance
1.1.8.1 An increase in yield of the well by 30 percent of the pre-rehabilitated yield of the well or attainment of 75 percent of the initial yield, which- ever is more, shall be the basis of acceptance. Alternatively, it may be agreed to between the contractor and the owner.
1.1.9 Information to be Supplied by the Contractor
to Owner for Fuhtre Use
The contractor shall supply the following in-
formation to the owner for future use :
94

a)
b)
C)
d)
4
f 1
g)
h)
I
Results of the investigations carried out before taking up rehabilitation;
Result of chemical tests carried out
before and after rehabilitation work;
Methods used along with name and quantity of chemicals used and num- ber of treatments given;
Results of rehabilitation, that is, dis-
charge, depression and sand content
in ppm at start and after 20 minutes;
Sounding of the well after treatment;
Condition of the pumping unit before rehabilitation and details of repairs
carried out to it;
Suggestions, based on investigations,
for future upkeep and maintenance of the well including recommended limit
to continuous discharge and depres-
sion, that is, rate of pumping in order to avoid harmful overpumping and thereby limiting the ties; and
Any other relevant sired by the owner.
2 WELL ABANDONMENT
2.1 Proper plugging of abandoned wells is a fimda-
entrance veloci-
information de-
SP ( QAWSM ) 56 :‘I994
mental practice in the preservation of high ground- water quality. Permanent sealing of abandoned wells is important because serious groundwater pollution can occur from either contaminated sur-
face water or interaquifer transfer of ground water
from a contaminated aquifer.
2.2 The basic concept in the proper sealing of an abandoned well is the restoration as far as possible
of the geologic conditions that existed before the well was drilled. The local geologic conditions must be assessed in detail to determine the most ef- fective method of well sealing. Sealing is usually achieved by grouting; when grouting below the
water table, the cementing material should be placed from the bottom up, by methods that would avoid segregation or excessive dilution of the material.
The upper portion of the casing should be removed to ensure intimate contact of the grout with the wall of the hole to form a water-tight plug in the
upper 5 to 7 m.
2.3 To seal an abandoned well properly, the type of groundwater occurence must be considered. Under water table conditions, the objective is to prevent percolation of the surface water through the well or along the periphery of the casing to the water table. Under artesian conditions, the sealing op-
erations must confine the water to the aquifer in which it occurs.
95

SP ( QAWSM ) 56 : 1994
ANNEX A
LIST OF REFERRED AND OTHER RELEVANT INDIAN STANDARDS
A-l INDIAN STANDARDS ON WATER WELLS
A-l.1 Glossary of Terms
IS 9439 : 1980 Glossary of terms used in waterwell drilling technology
A-l.2 Codes of Practice and Test Methods
IS 2800 Code of practice for construction and testing of tubewells :
Part 1 : 1991 Construction (second revision)
Part 2 : 1979 Testing (first revision)
IS 6935 : 1973 Method of determination of water level in borehole
IS 11189 : 1985 Methods for tubewell development
IS 11632 : 1986 Code of practice for rehabilitation of tubewell
A-l.3 Well Components
IS 4097 : 1967 Gravel for use as pack in tubewells
IS 4270 : 1992 Steel tubes used for water wells (second revision)
IS 5494 : 1969 Leaded brass sheets and strips for use in the manufacture of tubewell strainer
IS 8110 : 1985 Well screens and slotted pipes (first revision)
IS 12584 : 1989 Bentonite for grouting in civil engineering works
IS 12818 : 1992 Specification for UPVC ribbed screen casing and plain casing pipes for bore/tube
wells (first revision)
A-l.4 Drilling Equipment, Accessories and Methods
IS 7156 : 1974 General requirements for reverse circulation drilling rigs
IS 7206 (Part 1) : 1986 General requirements for direct circulation rotary drilling rigs : Part 1 With
rotary table (first revision)
IS 8986 : 1978 Dimensions for
IS 9026 : 1978 Rope threaded
drill steels in bar form for percussive drilling
percussive long hole drilling equipment
IS 10208 : 1982 Diamond core drilling
IS 11180 : 1985 Square and hexagonal
IS 11312 (Part 1) : 1985 External upset
Screwed on joints drill pipe
equipment
kelleys for direct rotary drilling
drill pipe assemblies for use in water well drilling : Part 1
IS 11672 : 1986 Tungsten carbide buttons and inserts for use in down the hole (DTH) bits
IS 11710 : 1986 Code of practice for selection and design of diamond core drills
96

SP ( QAWSM ) 56 : 1994
IS 11830 General requirements for down-the-hole hammer rigs for water wells :
Part 1 : 1992 Hydraulic rigs (with or without rotary mode) Cfirst revision)
Part 2 : 1989 Pneumatic rigs
IS 12090 : 1987 Dimension of rotary tables for direct rotary drilling equipment
IS 12097 : 1987 Classification and selection of drilling rigs for water well drilling
IS 12194 : 1987 Dimensions for rock roller bits and blade drag bits for rock drilling equipment
IS 12214 : 1987 General requirements for rotary hose for water well drilling equipment
IS 12629 : 1989 Water well drilling - Rotary hose for rotary drilling - Recommended practice for
care and use
IS 12635 : 1989 Water well drilling - Rock roller bit with non-sealed ball and roller bearing
arrangement - Technical supply conditions
IS 12682 : 1989 Waterwell drilling - Percussion drilling rigs - Genera1 requirements
A-2 OTHER REFERRED STANDARDS
IS 460 (Part 2) : 1985 Specification for test sieves : Part 2 Perforated plate test sieves (third revision)
IS 554 : 1985 Dimensions for pipe threads where pressure tight joints are required on the threads (third revision)
IS 1622 : 1981 Methods of sampling and microbiological examination of water (first revision)
IS 1894 : 1972 Method for tensile testing of steel tubes (first revision)
IS 2328 : 1983 Method for flattening test on metallic tubes (first revision)
IS 2952 Recommendation for methods of measurement of liquid flow by means of orifice plates and nozzles :
Part 1 : 1964 Incompressible fluids
Part 2 : 1975 Compressible fluids
IS 3025 : 1964 Methods of sampling and test (physical and chemical) for water used in industry
IS 3025 Methods of sampling and test (Physical and chemical) for water and wastewater
Part 1 : 1986 Sampling (jirst revision)
Part 3 : 1987 Precision and accuracy (first revision)
Part 4 : 1983 Colour (first revision)
Part 5 : 1983 Odour (first revision)
Part 6 : 1983 Odour threshold (first revision)
Part 7 : 1984 Taste threshold (first revision)
Part 8 : 1984 Taste rating (first revision)
Part 9 : 1984 Temperature (first revision)
97

SP ( QAWSM ) 56 :‘1994
Part 10 : 1984 Turbidity (first revision)
Part 11 : 1983 pH value (first revision)
Part 12 : 1983 Density (first revision)
Part 13 : 1983 Saturation index (with respect to calcium carbonate) (first revision)
Part 14 : 1984 Specific conductance (wheat-stone bridge, conductance cell) (first revision)
Part 15 : 1984 Total residue (total solids-dissolved and suspended) (first revision)
Part 16 : 1984 Filterable residue (total dissolved solids) (first revision)
Part 17 : 1984 Non-filtrable residue (total suspended solids) (first revision)
Part 18 : 1984 Volatile and fixed residue (total filtrable and non-filtrable) (first revision)
Part 19 : 1984 Settleable matter (first revision)
Part 20 : 1984 Dispersion characteristics (flow patterns) (first revision)
Part 21 : 1983 Total hardness (first revision)
Part 22 : 1986 Acidity (first revision)
Part 23 : 1986 Alkalinity (first revision)
Part 24 : 1986 Sulphates (first revision)
Part 25 : 1986 Chlorine, demand (first revision)
Part 26 : 1986 Chlorine, residual (first revision)
Part 27 : 1986 Cyanide (first revision)
Part 28 : 1986 Sulphite (first revision)
Part 29 : 1986 Sulphide (first revision)
Part 30 : 1988 Bromide (first revision)
Part 31 : 1988 Phosphorus (first revision)
Part 32 : 1988 Chloride (first revision)
Part 33 : 1988 Iodide (first revision)
Part 34 : 1988 Nitrogen (first revision)
Part 35 : 1988 Silica (jirst revision)
Part 36 : 1988 Ozone residual (first revision)
Part 37 : 1988 Arsenic (first revision)
Part 38 : 1989 Dissolved (first revision) oxygen
Part 39 : 1989 Oil and grease
Part 40 : 1991 Calcium
98
SP ( QAWSM ) 56 : 1994
IS 4412 : 1981 Copper wires for general engineering purposes (first rev&&r)
IS 4711 : 1974 Methods for sampling of steel pipes, tubes and fittings (first revision)
I IS 4736 : 1986 Hot-dip zinc coatings on mild steel tubes @rst revision)
IS 4905 : 1968 Methods for random sampling
IS 4985 : 1988 Specification for unplasticised PVC pipes for potable water supplies
(second revision)
IS 5120 : 1977 Technical requirements for rotodynamic special purpose pumps
(first revision)
IS 5382 : 1985, Rubber sealing rings for gas mains, water mains and sewers @first revision)
IS 5494 : 1969 Leaded brass sheets and strips for use in manufacture of tubewell strainers
IS 6059 : 1971 Recommendations for liquid flow measurement in open channels by weirs
and flume weirs of finite crest width for free discharge
IS 6307 : 1985 Rigid PVC sheets yirsf revision)
IS 7808 : 1975 Code of procedure for conducting studies on underground corrosion of metals
IS 8062 (Part 1) : 1976 Code of practice for cathodic protection of steel structures : Part 1
General principles
IS 8543 Methods of testing plastics :
Part l/Set 2 : 1979 Characterization of polymer structure and size, Section 2 Determination
of density of solid plastics
Part 4/Set 1
properties
IS 9108 : 1979
IS 9118 : 1979
IS 9119 : 1979
IS 10151 : 1982
: 1984 Short term mechanical properties, Section 1 Determination of tensile
Liquid flow measurement in open channels using thin plate weirs
Method for measurement of pressure by means of manometer
Method for flow estimation by jet characteristics (approximate method)
Polyvinyl chloride PVC and its copolymers for its safe use in contact with foodstuffs, pharmacenticals and drinking water
IS 10500 : 1991 Drinking water (first revision)
IS 12235 (Part 1 to 11) : 1986 Methods of test for unplasticised PVC pipes for potable water
supplies
99

Si’ ( QAWSM ) 56 : 1994
ANNEX B
GLOSSARY
B-l ALLUVIUM
A general term for all detrital deposits resulting from the operation of rivers, thus including the sediments laid down in river beds, flood plains, lakes, fans at the foot oi mountain slopes and
estuaries.
B-2 AQUIFER
An aquifer is a formation, group of formations, or part of a formation that contains sufficient satu-
rated permeable material to yield significant quan- &ties of water to wells and springs.
B-3 ARTESIAN
Artessian is synonymous with confined artesian water and artesian water body which are equiva-
lent respectively to confined ground water and confined water body.
B-4 ARTESIAN WELL
A well tapping from a confined or artesian aquifer
in which the static water level stands above the water table. The term is sometimes used to include all wells tapping confined water, in which case those wells with water level above the water table
are said to have positive artesian head (pressure) and those with water level below the water table, negative artesian head.
B-5 BLANK/BLIND PIPE
The section of pipeline formation not yielding as casing pipe.
B-6 BRIDGE
intake section placed against water for the same purpose
An obstruction to circulation in the annular space of the well.
B-7 DRAWDOWN
Lowering of water level caused by pumping. It is
measured for a given quantity of water pumped during a specified period, or after the pumping
level has stabilized.
B-8 DRIVE PIPE
Drive pipe is a type of casing pipe made of seamless or welded mild steel pipes designed to withstand the driving force and to penetrate into the ground
so as to protect the collapse or mover;&znt of loose forma- \
tion which taken olace during the drilling operations.
B-9 EFFECTIVE SIZE,D,,
Particle diameter corresponding to 10 percent finer
on the grain size curve.
B-10 FINES
Portion of soil finer than 75-micron IS sieve.
B-11 FLUID, DRILLING
The medium, liquid or gas used for flushing cut-
tings from the hole being drilled, for cooling the bit and for lubricating the bit.
B-12 HOUSING PIPE
Housing pipe is the upper portion of the casing section of the well which serves as a housing .for pumping equipment and is a vertical conduit through which water flows from the aquifer to the pump. It is water-tight and extends downwards from ground surface to a safe depth below the anticipated pumping
water level.
B-13 RESIDUAL DRAWDOWN
If a well is pumped for a given period of time and
then shut down, the residual drawdown can be approximated as the numerical difference between the drawdown in the well if the discharge had continued and the recovery of the well in response to an imaginary well of the same discharge super-
imposed on discharging well at the time it is shut down.
B-14 SPECIFIC YIELD
Specific yield of a well’ is the ratio of its discharge
to’ drawdown.
B-15 UNIFORMITY COEFFICIENT
The ratio Dfl,,,, where De0 is the particle diame- ter corresponding to 60 percent finer on the grain
100

size curve, and D,, is the particle diameter corre- sponding to 10 percent finer on the grain size curve.
B-16 WATER TABLE
,
That surface in an unconfined water body at which the pressure is atmospheric. It is defined by the levels at which water stands in wells that pene- trate the water body just far enough to hold stand-
SP (QAWSM ) 56 : 1994
ing water. In wells which penetrate to gk%ter depths, the water level will stand above or below the water table, if an upward or downward component of ground water flow exists.
B-17 YIELD
The quantity of water, expressed as rate of flow, that can be collected for a given use or uses from groundwater.
101
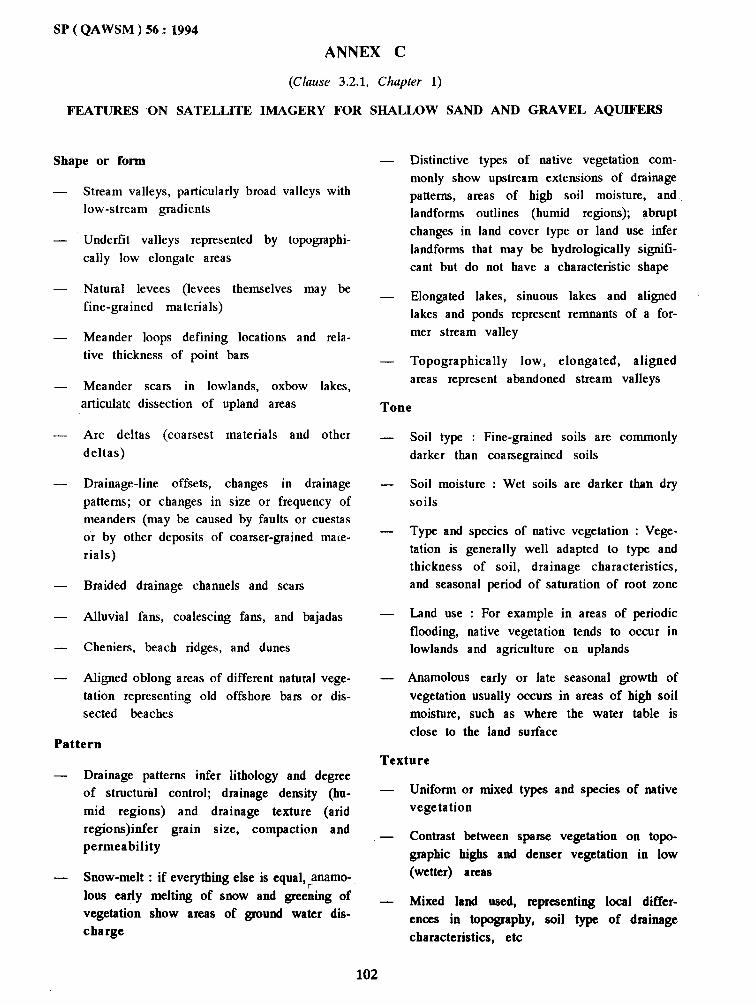
SP ( QAWSM ) 56 : 1994
ANNEX C
(Clause 3.2.1, Chapter 1)
FEATURES ON SATELLITE IMAGERY FOR SHALLOW SAND AND GRAVEL AQUIFERS
Shape or form
Stream valleys, particularly broad valleys with low-stream gradients
Underfit valleys represented by topographi- cally low elongate areas
Natural levees (levees themselves may be
fine-grained materials)
Meander loops defining locations and rela- tive thickness of point bars
Meander scars in lowlands, oxbow lakes, articulate dissection of upland areas
Arc deltas (coarsest deltas)
materials and other
Drainage-line offsets, changes in drainage
patterns; or changes in size or frequency of meanders (may be caused by faults or cuestas or by other deposits of coarser-grained mate- rials)
Braided drainage channels and scars
Alluvial fans, coalescing fans, and bajadas
Cheniers, beach ridges, and dunes
Aligned oblong areas of different natural vege- tation representing old offshore bars or dis- sected beaches
Pattern
- Drainage patterns infer lithology and degree of structural control; drainage density (hu-
mid regions) and drainage texture (arid regions)infer grain size, compaction and permeability
- Snow-melt : if everything else is equal,rmamo-
lous early melting of snow and greening of vegetation show areas of ground water dis-
charge
- Distinctive types of native vegetation com-
monly show upstream extensions of drainage patterns, areas of high soil moisture, and landforms outlines (humid regions); abrupt changes in land cover type or land use infer
landforms that may be hydrologically signifi- cant but do not have a characteristic shape
- Elongated lakes, sinuous lakes and aligned lakes and ponds represent remnants of a for- mer stream valley
- Topographically low, elongated, aligned areas represent abandoned stream valleys
,
Tone
- Soil type : Fine-grained soils are commonly
darker than coarsegrained soils
- Soil moisture : Wet soils are darker than dry
soils
- Type and species of native vegetation : Vege- tation is generally well adapted to type and thickness of soil, drainage characteristics, and seasonal period of saturation of root zone
- Land use : For example in areas of periodic
flooding, native vegetation tends to occur in lowlands and agriculture on uplands
- Anamolous early or late seasonal growth of vegetation usually occurs in areas of high soil moisture, such as where the water table is
close to the land surface
Texture
- Uniform or mixed types and species of native
vegetation
- Contrast between sparse vegetation on topo-
graphic highs and denser vegetation in low
(wetter) areas
- Mixed land used, representing local differ-
ences in topography, soil type of drainage
characteristics, etc
102

SF’ ( QAWSM ) 56 : 199J
ANNEX D
(Clause 3.2.1, Chapter 1)
FEATURES OF SATELLITE IMAGERY RELATED TO ROCKY AND OTHER AQUIFERS
Outcropping rock type
- landforms : topographic relief
- Outcrop patterns; banded patterns for sedi- mentary rocks (outlined by vegetation in humid
regions), plateau or homocline for basalt flows,
or curving patterns for folded beds
- Shape of drainage basins
- Drainage patterns, density and texture
- Fracture types and symmetry (as inferred by lineaments)
- Relative abundance, shape and distribution
of lakes
- Tones and textures: difficult to describe; best
determined by study of known examples
- Types of native land cover
Lineaments
- Continuous and linear stream channels, val- leys and ridges, discontinuous but straight
and aligned valleys, draws, swags and gaps
- Elongated or aligned lakes, large sinkholes and volcanoes
- Identical or opposite deflections (such as doglegs) in adjacent stream channels, valleys or ridges; alignment of tributary junctions
- Elongate or aligned patterns of native vegeta- tion, thin strips of relatively open (may’ be rights-of-way), or dense vegetation
- Alignment of dark or light soil tones
ANNEX E
(Clause 3.2.1, Chapter
SEQUENCE OF INVESTIGATIONS USING
1)
SATELLITE IMAGERY
Remote Sensing Studies
Acquisition of Satellite Data
(1:250 000 scale)
Preliminary Interpretation
Base Map Preparation
(enlarged image of data on
150 000 scale)
Ground checks
Final Interpretation
Final Hydrogeomorphological Maps
103

SP ( QAWSM ) 56 : 1993
ANNEX F
(Clause 3.2.2, Chapter
SURFICAL FEATURJZS IDENTIFIED ON AERIAL
EVALUATING GROUNDWATER
Topography
- Appraisal of regional relief setting
- Appraisal of local relief setting
Vegetation
- Phreatophytes and aquatic plants
Geological landforms likely to contain relatively
permeable strata
Modern alluvial terraces and flood plains
Stratified valley-fill deposits in abandoned meltwater and spillway channel
Glacial outwash and glacial deltas
Eskerine-kame complexes
Alluvial fans
Beach ridges
Partly drift-filled valleys marked by a chain of elongated closed depressions
Largely masked bedrock valleys cutting across modem valleys, indicated by local nonslump- ing of weak shale strata in valley sides
Local drift-filled valleys in extensive bed- rock-exposed terrains
Sand dunes asumed to overlie sandy gla- ciofluvial sediments
Lakes and streams
- Drainage density of stream network
- Localized gain or loss of streamflow
- Nearby small perennial and intermittent lakes (e.g., lakes in outwash, elongated saline lakes in inactive drainage systems)
- Perennial rivers and larger creeks in valleys having inactive flood plains
1)
PHOTOGRAPHS THAT AID IN
CONDITIONS
-
-
Moist
-
-
-
Small intermittent drainages (including misfit creeks in abandoned glacial spillways and meltwater channels)
No defined drainage channel in former gla-
cial spillways and meltwater channels
depressions and seepages
Moist depressions, marshy environments and seepages (significance depends on interpre- tation of associated phenomena)
String of alkali-salt flats or brackish and
salty lakes along inactive drainage systems
Salt precipitates (e.g., salt crusts), localized anamolousf-looking ‘bum-out’ patches in the soil and vegetation associated with salt migration and accumulation
Springs (Types tentatively .inferred from aerial
photographs)
-
-
-
-
Depression springs (where land surface locally cuts the water table or the upper surface of the zone of saturation)
Contact springs (permeable water bearing strata overlying relatively impermeable strata usually along the sides of valleys that cut across the interface between different strata)
Artesian springs occurring on or near the
base of hillsides, valley slopes and local
sea rps
Springs where the type could not be reasona- bly inferred from aerial photographs
Artificial water features
-
-
-
-
Land
-
-
Wells
Developed springs
Reservoirs
Canals
use
Farming practices
Water filled dugouts in surficial alluvial and glaciofluvial deposits
104

SP ( QAWSM ) 56 : 1994 ”
ANNEX G
(Clause 4.2.6, Chapter 1)
SALIENT FEATURES OF GEOELECTRIC INSTRUMENTS
G-l ENERGISATION CURRENT : d.c. vs a.c.
G-l.1 d.c. Resistivity Meter
Merits:
a) Low cost
b) More compact and portable
c) Does not suffer from limitations of depth
penetration caused by skin effect which is
encountered in ac methods
Constraints:
a) Requires SP (spontaneous potential) bal- ancing
b) Needs non-polarising electrodes for po-
tential pick up
Good enough for most of groundwater exploration
work up to a depth of about 300 m depending upon subsurface resistivity distribution (geological forma- tions)
G-l.2 ac Resistivity Meter
Merits:
a) No need for non-polarising electrodes
b) Generally does not require SP balancing
c) Lends more easily to sophisticated signal/ noise ratio improvement techniques.
Constraints:
a) More Expensive for the same volt-ampere input capacity; ac instruments cost 6 to 8 times more than d.c. instruments.
b) Unless very low frequencies are used (like 0.25 Hz) skin effect problems arise.
c) EM (Electra Magnetic) coupling may cause
some problems if sufficient care is not taken during laying out of the wires on the ground.
Remarks :
Signal enhancement type is recommended for work in critical areas where bV signal is small.
G-2 ANALOG vs DIGITAL RESISTIVITY
METERS
G-2.1 Analog Instrument
Merits:
a) Low cost
b) Simplicity
Constraints:
a) Fragile
b) Lower sensitivity and accuracy
c) Bulky size
G-2.2 Digital Instruments
Merits:
a) Compact
b) Greater accuracy and sensitivity
c) Sophisticated
Constraint:
Higher cost
G-3 AV AND I TYPE VERSUS DIRECT
RESISTANCE READING TYPE
G-3.1 AV and I Type
Merits:
a) Simplicity .
b) Low cost
Constraint:
A little more tedious field calculation
105

. SP ( QAWSM ) 56 : 1994
G-3.2 Direct Reading Type:
Merits:
a) Faster field calculation
b) Ready amenability to some empirical meth-
ods of layer parameter estimation
Constraint:
More expensive
Remarks:
In both AV-I and resistance type of instruments,
one should prefer the non-balancing type with least number of scale ntultipliers and with reading hold facility. This type of instrument will ensure faster field operation and bring about lesser field costs by doing away with an assistant operator who is usually employed solely for noting down read-
ings.
G-4 DEEP RESISTIVITY METER
Remarks:
Suitable to dilineate deeper aquifer (more than 300 metres) and in desert areas where contact resis-
tance is high.
G-5 SALIENT SPECIFICATIONS OF
GEOELECTRIC INSTRUMENTS
G-5.1 d.c. Resistivity Meters
AV and I Type:
Voltage measuring range : 0 to 2 1 999 mV
Sensitivity/ resolution : 0.1 mV up to 180 mV and 1.0 mV beyond it
Accuracy : + 1 digit + 1%
Current measuring range : 0 to 1 999 mA
Sensitivity/resolution : 0.1 mA up to 180 mA and 1.0 mA beyond it
Accuracy : 21 digit ~1%
SP balance range : 1 000 mV approximately
Upper limit to contact : 1 MQ
Resistance for
energisation
Ground energising source
Maximum engergising
Source
Source voltage current
G-S.2 Direct Resistance
Same as in (G-5.1) except of voltage.
Resistance measuring
range
Sensitivity
G-5.3 Analog Type
Voltage measuring range
External by 5 x 90 dry battery packs or d.c-d.c electronic convertor
450 V d.c.
2 A d.c.
Measuring Type
that there is no display
: 0.000 1 to 20 OOOQ
: ~0.000 1 s2
: 0 to 1 018 mV
Accuracy of measurement : + 1%
Read out : Potential off two dials and current off a meter
Null indication : Centre zero, transistorised
micro voltnteter
Maximum energising current : 2 A d.c.
Ground enegrising source : 90 V dry battery
packs for d.c. excitation
G-5.4 a.c. Resistivity Meters
a) Non Stacked Type
Operational -frequency : 2.5 Hz square
wave generated by a highly stable crystal controlled oscillator
Voltage output : 10 to 400 volts in ten steps
Resistance measuring : 0.000 2 to 20 ooon
range in twelve steps
Indicator : Digital display
106

Accuracy : 1% + 1 digit
50 Hz noise rejection : 90 dB
b) Stacked Type Resistivity Meter
Selectable current : 5 to 250 mA in 7
, settings ranges
Voltage setting : 400 v (800 v pp)
Frequency : 0.5 Hz
Input impedance : 2MQ
Resistance range : 0.0001 to 1999Q
Accuracy : 21%
Data averaging : 1,4,8,16 cycles
stacking
SP (QAWSM) 56 : 1994
G-S.5 Deep Resitivity Meters (not yet Indigenously
Manufactured)
a)
b)
Transmitter
Output power
Output voltage
Output current Output current stability
Current reading resolution Time domain cycle
Pulse duration in s
Receiver Voltage Measuring
Display Averaging time
10 kW maximum
5OOto33OOVin 10 steps
20 A maximum 2 0.1 %
1 mA on fine range
T:T:T:-i- on:off :
0n:off automatic T=1,2,4,8,16 or 32
30 pv to 30 v
3% digit display 3 cycles
107