Localization of lipids in freeze-dried mouse brain …20Sj%F6vall%20… · lateral distributions of...
12
1 Localization of lipids in freeze-dried mouse brain sections by imaging TOF-SIMS Peter Sjövall 1 , Björn Johansson 2 and Jukka Lausmaa 1 1 SP Swedish National Testing and Research Institute, P.O. Box 857, SE-50115 Borås, Sweden 2 Department of Clinical Neuroscience, Karolinska Institutet, SE-17176 Stockholm, Sweden Abstract Imaging time-of-flight secondary ion mass spectrometry (TOF-SIMS) was used to analyse the lateral distributions of lipids on the surface of freeze-dried mouse brain sections. Tissue sections (14 μm thick) were prepared by cryosectioning, placed on glass or Si substrates, and desalinated by submersion in NH 3 HCOO solution. Immediately prior to analysis, the samples were freeze dried by thawing the sample in vacuum. TOF-SIMS analysis was carried out using 25 keV Au 3 + or Bi 3 + primary ions, always keeping the accumulated ion dose below 4 x 10 12 ions/cm 2 . Positive and negative ion images over the entire mouse brain section and of analysis areas down to 100 x 100 μm 2 show characteristic distributions of various lipids. The signals from cholesterol and sulfatides are primarily located to white matter regions, while the phosphocholine and phosphatidylinositol signals are strongest in grey matter regions. By using two different staining methods, structures observed in the TOF-SIMS images could be identified as ribosome-rich regions and cell nuclei, respectively. Analysis of freeze-dried mouse brain sections at varying sample temperatures between -130 and 60 ºC showed an abrupt increase in the cholesterol signal at T > 0 ºC, indicating extensive migration of cholesterol to the tissue surface under vacuum conditions. Keywords: TOF-SIMS, lipids, tissue, brain, imaging 1. Introduction Time-of-flight secondary ion mass spectrometry (TOF-SIMS) provides a number of advantages over any other single method used for chemical analysis of biological samples, such as parallel identification and localization of unlabelled substances at high spatial resolution[1]. Local chemical information about cells and tissues is typically obtained either by mass spectrometric analysis of whole-tissue samples, isolated membranes or cultured cells[2, 3] or by fluorescence imaging of labelled substances[4-6]. Using imaging MALDI, spatially resolved mass spectrometric detection of biomolecules up to 100,000 u (including proteins) can be obtained, however with a lateral resolution typically around 50 μm[7, 8]. Imaging of elements, isotopically labelled compounds and certain organic fragments can be obtained with high sensitivity and lateral resolution below 100 nm by dynamic SIMS[9-11]. The potential advantage of TOF-SIMS in the analysis of biological cells and tissues, as compared to other methods, is to provide unambiguous identification, localization and co-localization of organic molecules in the mass range ~200-2000 u, which is the mass range that includes many of the most common lipids, peptides, metabolites, and drug substances. The possibilities to develop TOF-SIMS into a powerful method in this respect have recently improved dramatically due to the development of new cluster primary ion sources, which provide superior useful secondary ion yields for organic compounds in this mass range, as compared to the previous standard sources[12, 13].
Transcript of Localization of lipids in freeze-dried mouse brain …20Sj%F6vall%20… · lateral distributions of...
1
Localization of lipids in freeze-dried mouse brain sections by imaging TOF-SIMS
Peter Sjövall1, Björn Johansson2 and Jukka Lausmaa1
1SP Swedish National Testing and Research Institute, P.O. Box 857, SE-50115 Borås, Sweden 2Department of Clinical Neuroscience, Karolinska Institutet, SE-17176 Stockholm, Sweden
Abstract Imaging time-of-flight secondary ion mass spectrometry (TOF-SIMS) was used to analyse the lateral distributions of lipids on the surface of freeze-dried mouse brain sections. Tissue sections (14 µm thick) were prepared by cryosectioning, placed on glass or Si substrates, and desalinated by submersion in NH3HCOO solution. Immediately prior to analysis, the samples were freeze dried by thawing the sample in vacuum. TOF-SIMS analysis was carried out using 25 keV Au3
+ or Bi3+
primary ions, always keeping the accumulated ion dose below 4 x 10¹² ions/cm2. Positive and negative ion images over the entire mouse brain section and of analysis areas down to 100 x 100 µm2 show characteristic distributions of various lipids. The signals from cholesterol and sulfatides are primarily located to white matter regions, while the phosphocholine and phosphatidylinositol signals are strongest in grey matter regions. By using two different staining methods, structures observed in the TOF-SIMS images could be identified as ribosome-rich regions and cell nuclei, respectively. Analysis of freeze-dried mouse brain sections at varying sample temperatures between -130 and 60 ºC showed an abrupt increase in the cholesterol signal at T > 0 ºC, indicating extensive migration of cholesterol to the tissue surface under vacuum conditions.
Keywords: TOF-SIMS, lipids, tissue, brain, imaging
1. Introduction
Time-of-flight secondary ion mass spectrometry (TOF-SIMS) provides a number of advantages over any other single method used for chemical analysis of biological samples, such as parallel identification and localization of unlabelled substances at high spatial resolution[1]. Local chemical information about cells and tissues is typically obtained either by mass spectrometric analysis of whole-tissue samples, isolated membranes or cultured cells[2, 3] or by fluorescence imaging of labelled substances[4-6]. Using imaging MALDI, spatially resolved mass spectrometric detection of biomolecules up to 100,000 u (including proteins) can be obtained, however with a lateral resolution typically around 50 µm[7, 8]. Imaging of elements, isotopically labelled compounds and certain organic fragments can be obtained with high sensitivity and lateral resolution below 100 nm by dynamic SIMS[9-11]. The potential advantage of TOF-SIMS in the analysis of biological cells and tissues, as compared to other methods, is to provide unambiguous identification, localization and co-localization of organic molecules in the mass range ~200-2000 u, which is the mass range that includes many of the most common lipids, peptides, metabolites, and drug substances. The possibilities to develop TOF-SIMS into a powerful method in this respect have recently improved dramatically due to the development of new cluster primary ion sources, which provide superior useful secondary ion yields for organic compounds in this mass range, as compared to the previous standard sources[12, 13].
2
The fact that the TOF-SIMS analysis is made in vacuum and that classical fixation schemes are often inappropriate to use since they alter the chemistry of the sample, means that sample preparation for TOF-SIMS analysis requires careful consideration. The two main strategies that have been used so far are to study the cell or tissue sample in the frozen hydrated state[14, 15], or to freeze dry the sample prior to analysis[12, 13, 16]. The former method requires careful temperature control and the analysis is made difficult by the presence of water in the sample. For freeze-dried samples, the analysis is significantly easier to carry out, but one must consider that the drying process changes the environment of the cellular and subcellular structures, most likely resulting in, e.g., considerable alterations of the membrane structure[10]. In order to obtain relevant biological information from TOF-SIMS images, it is therefore important to determine the effects of the drying procedure on the spatial distributions of the investigated biomolecules.
An additional consideration in imaging TOF-SIMS analysis of cells and tissues is the interpretation of ion images measured by TOF-SIMS in terms of known biological structures. Fortunately, extensive knowledge about biological structures, from the subcellular to organized tissue level, is available from histological and electron microscopy studies. If TOF-SIMS is to contribute to the bioscience research field by providing new significant information of biological relevance, it is required that the structures studied by TOF-SIMS are conclusively identified in terms of structures studied by histology or other methods established in the field.
In previous work, we have shown that imaging TOF-SIMS may provide information about the spatial distributions of a variety of specific lipids in mouse brain sections, including cholesterol, phosphatidylcholine, sulfatide and phosphatidylinositol[12]. The obtained images showed a pronounced complementary localization of cholesterol and phosphatidylcholine (PC), in which the cholesterol signal was high in the white matter regions and PC was high in the grey matter regions. Furthermore, the sulfatide images showed distributions with low signal in the regions with high cholesterol signal (white matter), which is surprising since previous studies with other techniques have shown that the sulfatide concentration is higher in white matter than in grey[17].
In the present work, results from mouse brain sections prepared using a slightly modified freeze-drying procedure as compared to the one used in the previous work, show high signal intensity from sulfatide in white matter regions, suggesting higher sulfatide concentration in white matter as compared to in grey matter. Furthermore, it is shown that migration of cholesterol in vacuum may occur at sample temperatures close to room temperature, which could explain the previous contradictory results. Finally, the present study also shows that different structures observed in the TOF-SIMS images could be identified by combining the analysis with two different staining techniques.
2. Experimental
2.1. Sample preparation
The mouse brains were frozen to -80 ºC immediately after dissection. Thin (14 µm) tissue sections were prepared using a cryosectioning device and placed on pre-cooled substrates (glass slides except in the temperature studies, see below). In order to attach the tissue section to the substrate, the back side of the substrate was gently warmed up using finger contact until the tissue section just started to thaw, and then the sample was quickly refrozen to -80 ºC. In order to reduce the salt content in the tissue sections, the samples were immersed in 0.15 M NH3HCOO solution (room temperature) for approximately 30 s and then immediately refrozen, placed in plastic or glass containers and stored at -78 ºC (dry ice) until freeze drying and subsequent analysis. The analysis was normally carried out within less than 5 days after dissection of the mouse brain.
Freeze drying was normally done by placing the cold sample on precooled glass plates inside a vacuum chamber, immediately evacuating the system and slowly allowing the sample to warm up to room temperature during constant pumping (< 10-3 mbar). After approximately 30 – 40 minutes,
3
the sample had reached room temperature but pumping was normally continued for another 20 – 30 minutes. After freeze drying, the samples were immediately introduced into the TOF-SIMS instrument for analysis.
2.2. TOF-SIMS analysis
The analysis was done in a TOF-SIMS IV instrument (ION-TOF GmbH) equipped with a liquid metal cluster primary ion source. Positive and negative ion spectra and images were recorded using Au3
+ or Bi3+ primary ions at 25 keV energy and electron flooding for charge neutralization. High
mass resolution data was recorded from analysis areas between 200 x 200 µm2 and 11 x 11 mm2 (bunched mode, 0.06 pA for Au3
+ and 0.18 pA for Bi3+). High image resolution data was recorded
at areas between 35 x 35 µm2 and 200 x 200 µm2 (burst alignment mode, 0.03 pA, Au3+ only). The
primary ions were Bi3+ in the studies using different temperatures (see below) while all other results
were obtained using Au3+. The accumulated primary ion dose was always kept below 4 x 10¹²
ions/cm2.
2.3. Temperature-controlled analysis
For the analysis at varying sample temperatures, the tissue sections were deposited on Si wafers in order to obtain good thermal contact with the sample holder, and the immersion in NH3HCOO was omitted in order to keep the sample cold until analysis. Experiments using two different freeze-drying procedures were carried out. In the first experiment, freeze drying was done in the separate vacuum chamber as described above, with the exception that the chamber was vented after approximately 20 minutes of pumping (with the sample temperature still slightly below room temperature). The sample was then immediately mounted on a pre-cooled sample holder and introduced into the TOF-SIMS instrument. Positive and negative ion images and spectra were recorded at the same area of the mouse brain section (anterior commissure in the horizontal section) after successively increasing temperatures between -130 and 60 ºC. The sample temperature was increased at a rate of 0.5 K/s and kept constant at the stated temperature for 4 minutes before start of the data acquisition. The accumulated ion dose was < 4x10¹⁰ ions/cm2 per spectrum which means that the total accumulated primary ion dose for the whole experiment (10 positive and 10 negative spectra) was less than 1012 ions/cm2. In the second experiment, freeze drying was carried out inside the vacuum chamber of the TOF-SIMS instrument. For this, the cold sample was directly mounted on the precooled TOF-SIMS sample holder, followed by immediate insertion into the load lock vacuum chamber and pump down. The sample temperature during freeze drying was estimated to be initially around -50 ºC, then quickly (< 2 minutes) lowered to approximately -100 ºC and then gradually decreasing to -120 ºC. The analysis was started approximately 2 hours after start of the freeze-drying procedure. By using this procedure, the sample was prevented from being warmed up or exposed to air between freeze drying and analysis.
2.4. Staining procedures
For staining of the sample with eosin Y, the samples were immersed in phosphate-buffered saline (PBS) containing 1 % eosin Y and then destained in PBS only, prior to submersion in NH3HCOO solution. Eosin Y is a Br-containing organic molecule that provides staining to the cytoplasm.
Cresyl violet staining was applied after TOF-SIMS analysis to the same sagittal tissue sample that was used for recording of the data presented in figs. 1-4 (stored in exsiccator for 94 days between TOF-SIMS analysis and staining). Cresyl Violet staining is considered to stain ribosomes but also to some extent cell nuclei. For the cresyl violet staining, the sample was delipidated (xylene 2 x 5 min), fixed (99.5% ethanol for 2 x 5 min), hydrated (95% ethanol for 5 min; 70% 5 min; dipped in H2O), and then stained in Cresyl Violet acetate (Sigma) with 0.4 M acetate buffer (pH 3.9) for 30 min. After staining, the sample was differentiated in H2O for 2 min and dehydrated (70% ethanol 5 min; 95% 5 min; 100% 5 min; 100% 5 min; xylene 2 x 5 min). Finally, a coverslip was immediately mounted on the sample slide with Pertex (Histolab, Göteborg, Sweden) and allowed to
4
settle overnight. The optical image of the stained tissue was photographed with a Hamamatsu C3077 CCD camera with a Micro-NIKKOR objective.
3. Results and discussion
3.1. TOF-SIMS analysis of sagittal mouse brain section
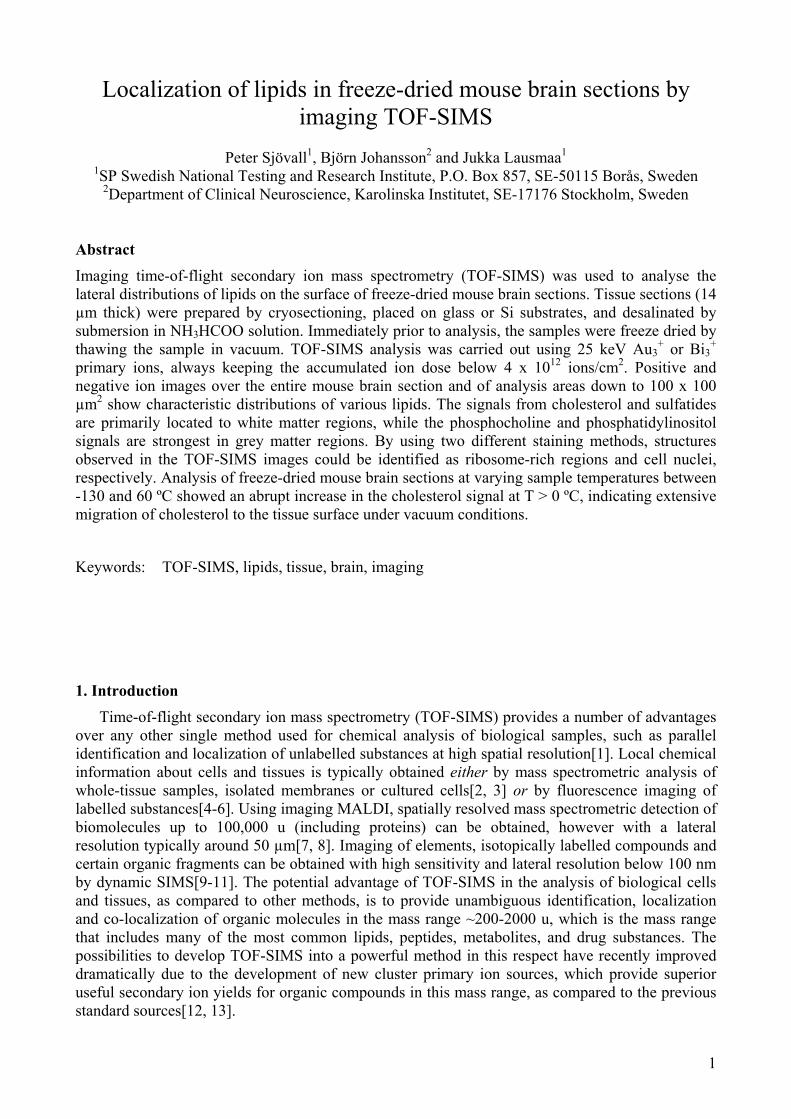
Figure 1 shows TOF-SIMS images from an entire mouse brain section in the sagittal plane. Different structures, such as the cortex, caudate putamen, hippocampus, thalamus, and the cerebellum, can be easily localized in the images (see fig. 1(g)). The thalamus region is specifically highlighted in fig. 2, which shows ion images from a separate measurement of this region.
Fig. 1. TOF-SIMS images from a freeze-dried mouse brain section in the sagittal plane. The images
show the signal intensity distributions of (a) phosphocholine+ (184 u), (b) cholesterol- (385 u), (c) CN- (26 u) + CNO- (42 u), (d) phosphatidylinositol- PI 38:4, and (e) sulfatide- 24:1 + 24:0 + h24:1 + h24:0. All images have been normalized to the total ion image. Figure (f) shows an optical microscopy image of the same tissue section after cresyl violet staining and (g) shows the phosphocholine image with some major brain structures indicated (co-cortex, cp-caudate putamen, th-thalamus, hi-hippocampus, ce-cerebellum). Field of view 11 x 11 mm2.
The cholesterol images in figs. 1 and 2 show high intensity in the white matter regions while the phosphocholine signal displays a higher signal in the grey matter regions. This is an expected result since the white matter regions consist primarily of nerve cell fibers, axons, surrounded by myelin, which are rich in cholesterol. Grey matter, in contrast, consists of nerve cell bodies and glial cells, whose plasma membranes also contain cholesterol, but in lower concentrations than myelin.
The sulfatide images show generally higher signal intensity in the white matter regions, also in agreement with what can be expected from previous studies[17], but the signal is “smeared out” into the grey matter regions to a larger extent than the cholesterol signal is. The bright area in the lower left part of the sulfatide image in fig. 1 is outside the tissue section and is most likely caused by deposition of sulfatide from the tissue during placement of the sample onto the substrate surface. The phosphatidylinositol image (fig. 1(d)) shows a homogeneous intensity distribution in the grey matter regions and a slightly reduced signal in the white matter regions.
As discussed in section 3.3 below, the strong cholesterol signal in figs. 1 and 2 is most likely partly due to migration of cholesterol to the surface from the sample interior, which is shown to occur in vacuum at temperatures > 0 ºC (see section 3.3). Although the cholesterol signal thus
(a) (b) (c)
(d) (e) (f) (g) co
co
co
cp
ce
th hi
co
co
5
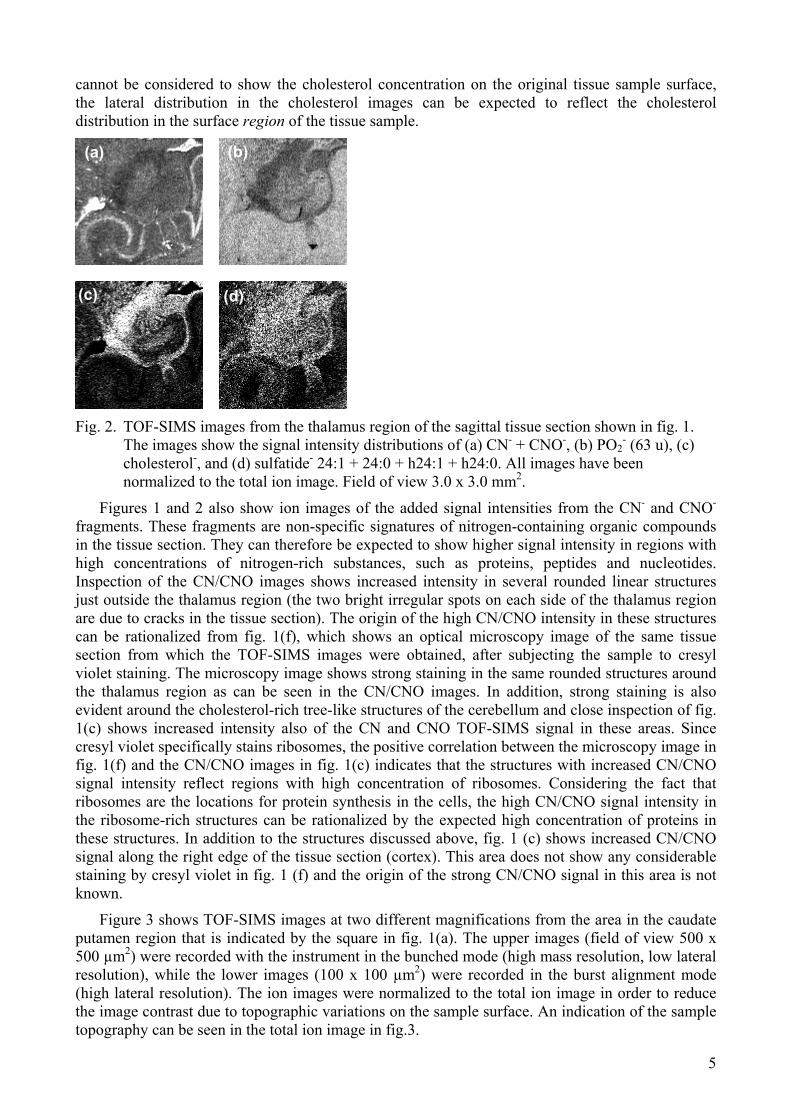
cannot be considered to show the cholesterol concentration on the original tissue sample surface, the lateral distribution in the cholesterol images can be expected to reflect the cholesterol distribution in the surface region of the tissue sample.
Fig. 2. TOF-SIMS images from the thalamus region of the sagittal tissue section shown in fig. 1.
The images show the signal intensity distributions of (a) CN- + CNO-, (b) PO2- (63 u), (c)
cholesterol-, and (d) sulfatide- 24:1 + 24:0 + h24:1 + h24:0. All images have been normalized to the total ion image. Field of view 3.0 x 3.0 mm2.
Figures 1 and 2 also show ion images of the added signal intensities from the CN- and CNO- fragments. These fragments are non-specific signatures of nitrogen-containing organic compounds in the tissue section. They can therefore be expected to show higher signal intensity in regions with high concentrations of nitrogen-rich substances, such as proteins, peptides and nucleotides. Inspection of the CN/CNO images shows increased intensity in several rounded linear structures just outside the thalamus region (the two bright irregular spots on each side of the thalamus region are due to cracks in the tissue section). The origin of the high CN/CNO intensity in these structures can be rationalized from fig. 1(f), which shows an optical microscopy image of the same tissue section from which the TOF-SIMS images were obtained, after subjecting the sample to cresyl violet staining. The microscopy image shows strong staining in the same rounded structures around the thalamus region as can be seen in the CN/CNO images. In addition, strong staining is also evident around the cholesterol-rich tree-like structures of the cerebellum and close inspection of fig. 1(c) shows increased intensity also of the CN and CNO TOF-SIMS signal in these areas. Since cresyl violet specifically stains ribosomes, the positive correlation between the microscopy image in fig. 1(f) and the CN/CNO images in fig. 1(c) indicates that the structures with increased CN/CNO signal intensity reflect regions with high concentration of ribosomes. Considering the fact that ribosomes are the locations for protein synthesis in the cells, the high CN/CNO signal intensity in the ribosome-rich structures can be rationalized by the expected high concentration of proteins in these structures. In addition to the structures discussed above, fig. 1 (c) shows increased CN/CNO signal along the right edge of the tissue section (cortex). This area does not show any considerable staining by cresyl violet in fig. 1 (f) and the origin of the strong CN/CNO signal in this area is not known.
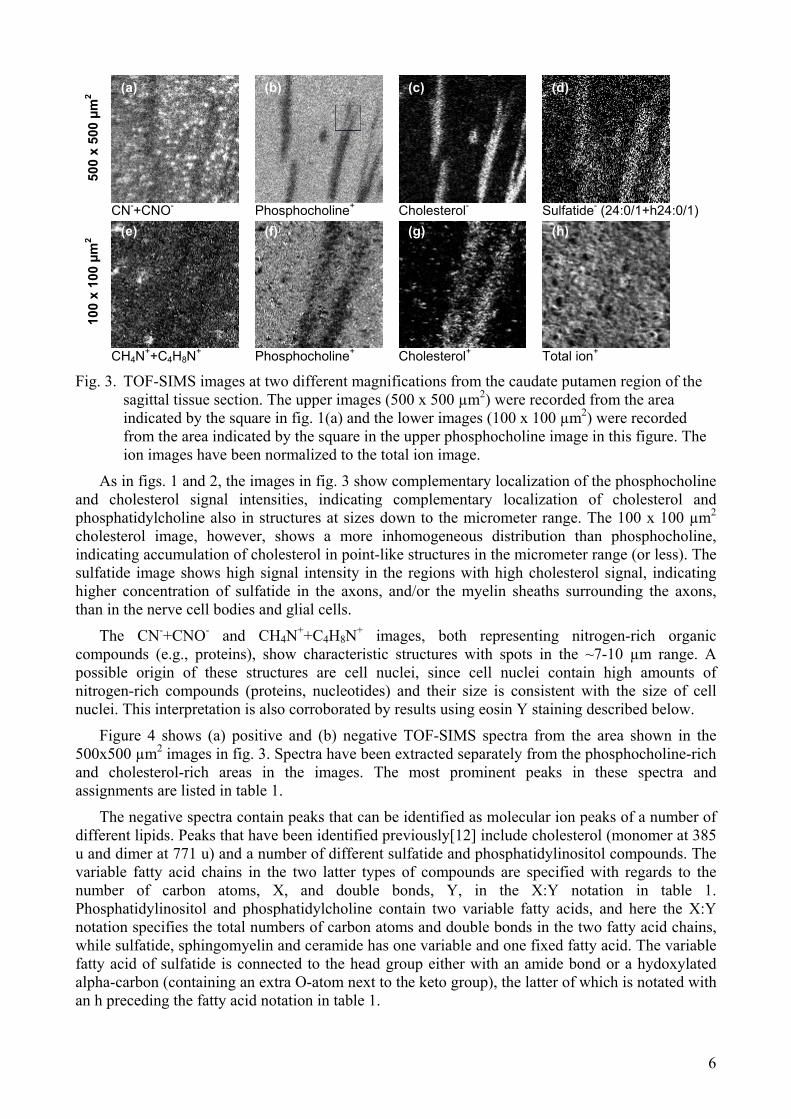
Figure 3 shows TOF-SIMS images at two different magnifications from the area in the caudate putamen region that is indicated by the square in fig. 1(a). The upper images (field of view 500 x 500 µm2) were recorded with the instrument in the bunched mode (high mass resolution, low lateral resolution), while the lower images (100 x 100 µm2) were recorded in the burst alignment mode (high lateral resolution). The ion images were normalized to the total ion image in order to reduce the image contrast due to topographic variations on the sample surface. An indication of the sample topography can be seen in the total ion image in fig.3.
(a) (b)
(c) (d)
6
CN-+CNO- Phosphocholine+ Cholesterol- Sulfatide- (24:0/1+h24:0/1)
CH4N++C4H8N+ Phosphocholine+ Cholesterol+ Total ion+
Fig. 3. TOF-SIMS images at two different magnifications from the caudate putamen region of the sagittal tissue section. The upper images (500 x 500 µm2) were recorded from the area indicated by the square in fig. 1(a) and the lower images (100 x 100 µm2) were recorded from the area indicated by the square in the upper phosphocholine image in this figure. The ion images have been normalized to the total ion image.
As in figs. 1 and 2, the images in fig. 3 show complementary localization of the phosphocholine and cholesterol signal intensities, indicating complementary localization of cholesterol and phosphatidylcholine also in structures at sizes down to the micrometer range. The 100 x 100 µm2 cholesterol image, however, shows a more inhomogeneous distribution than phosphocholine, indicating accumulation of cholesterol in point-like structures in the micrometer range (or less). The sulfatide image shows high signal intensity in the regions with high cholesterol signal, indicating higher concentration of sulfatide in the axons, and/or the myelin sheaths surrounding the axons, than in the nerve cell bodies and glial cells.
The CN-+CNO- and CH4N++C4H8N+ images, both representing nitrogen-rich organic compounds (e.g., proteins), show characteristic structures with spots in the ~7-10 µm range. A possible origin of these structures are cell nuclei, since cell nuclei contain high amounts of nitrogen-rich compounds (proteins, nucleotides) and their size is consistent with the size of cell nuclei. This interpretation is also corroborated by results using eosin Y staining described below.
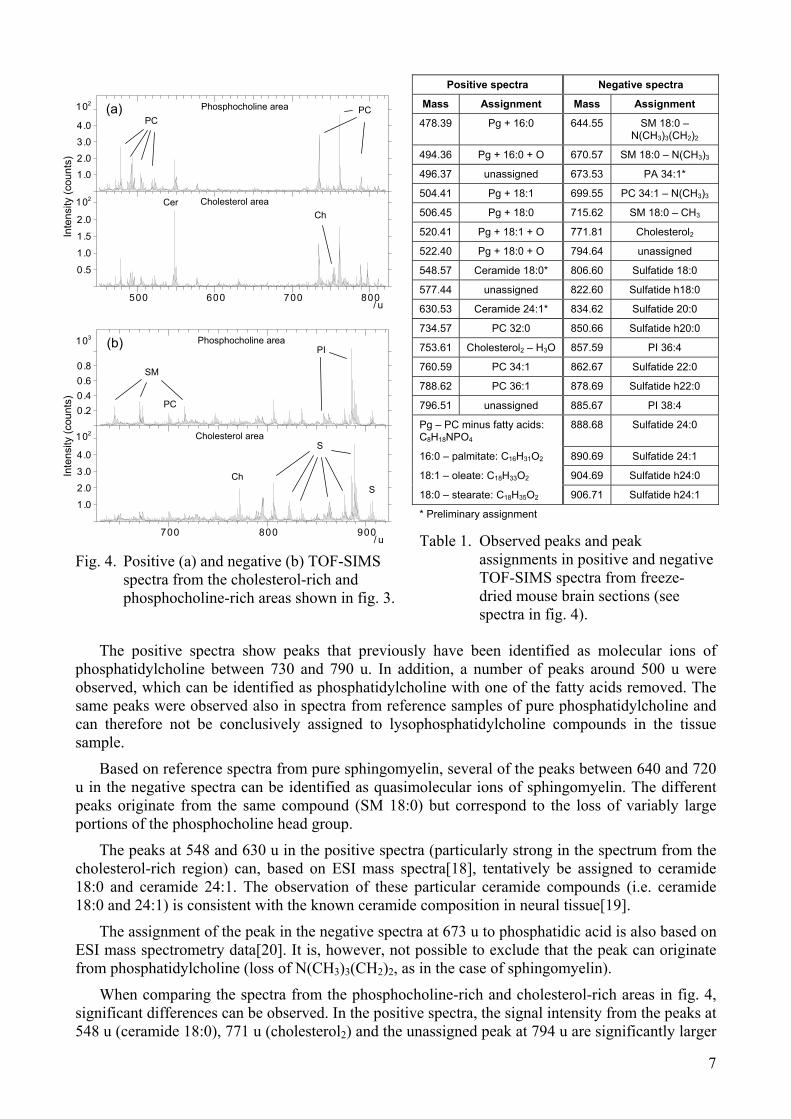
Figure 4 shows (a) positive and (b) negative TOF-SIMS spectra from the area shown in the 500x500 µm2 images in fig. 3. Spectra have been extracted separately from the phosphocholine-rich and cholesterol-rich areas in the images. The most prominent peaks in these spectra and assignments are listed in table 1.
The negative spectra contain peaks that can be identified as molecular ion peaks of a number of different lipids. Peaks that have been identified previously[12] include cholesterol (monomer at 385 u and dimer at 771 u) and a number of different sulfatide and phosphatidylinositol compounds. The variable fatty acid chains in the two latter types of compounds are specified with regards to the number of carbon atoms, X, and double bonds, Y, in the X:Y notation in table 1. Phosphatidylinositol and phosphatidylcholine contain two variable fatty acids, and here the X:Y notation specifies the total numbers of carbon atoms and double bonds in the two fatty acid chains, while sulfatide, sphingomyelin and ceramide has one variable and one fixed fatty acid. The variable fatty acid of sulfatide is connected to the head group either with an amide bond or a hydoxylated alpha-carbon (containing an extra O-atom next to the keto group), the latter of which is notated with an h preceding the fatty acid notation in table 1.
500
x 50
0 µm
2 10
0 x
100
µm2
(a) (b) (c) (d)
(e) (f) (g) (h)
7
/ u500 600 700 800
210
0.5
1.0
1.5
2.0
210
1.02.03.0
4.0
/ u700 800 900
210
1.0
2.0
3.0
4.0
310
0.20.40.60.8
Fig. 4. Positive (a) and negative (b) TOF-SIMS
spectra from the cholesterol-rich and phosphocholine-rich areas shown in fig. 3.
Positive spectra Negative spectra
Mass Assignment Mass Assignment
478.39 Pg + 16:0 644.55 SM 18:0 – N(CH3)3(CH2)2
494.36 Pg + 16:0 + O 670.57 SM 18:0 – N(CH3)3
496.37 unassigned 673.53 PA 34:1*
504.41 Pg + 18:1 699.55 PC 34:1 – N(CH3)3
506.45 Pg + 18:0 715.62 SM 18:0 – CH3
520.41 Pg + 18:1 + O 771.81 Cholesterol2
522.40 Pg + 18:0 + O 794.64 unassigned
548.57 Ceramide 18:0* 806.60 Sulfatide 18:0
577.44 unassigned 822.60 Sulfatide h18:0
630.53 Ceramide 24:1* 834.62 Sulfatide 20:0
734.57 PC 32:0 850.66 Sulfatide h20:0
753.61 Cholesterol2 – H3O 857.59 PI 36:4
760.59 PC 34:1 862.67 Sulfatide 22:0
788.62 PC 36:1 878.69 Sulfatide h22:0
796.51 unassigned 885.67 PI 38:4
Pg – PC minus fatty acids: C8H18NPO4
888.68 Sulfatide 24:0
16:0 – palmitate: C16H31O2 890.69 Sulfatide 24:1
18:1 – oleate: C18H33O2 904.69 Sulfatide h24:0
18:0 – stearate: C18H35O2 906.71 Sulfatide h24:1
* Preliminary assignment
Table 1. Observed peaks and peak assignments in positive and negative TOF-SIMS spectra from freeze-dried mouse brain sections (see spectra in fig. 4).
The positive spectra show peaks that previously have been identified as molecular ions of phosphatidylcholine between 730 and 790 u. In addition, a number of peaks around 500 u were observed, which can be identified as phosphatidylcholine with one of the fatty acids removed. The same peaks were observed also in spectra from reference samples of pure phosphatidylcholine and can therefore not be conclusively assigned to lysophosphatidylcholine compounds in the tissue sample.
Based on reference spectra from pure sphingomyelin, several of the peaks between 640 and 720 u in the negative spectra can be identified as quasimolecular ions of sphingomyelin. The different peaks originate from the same compound (SM 18:0) but correspond to the loss of variably large portions of the phosphocholine head group.
The peaks at 548 and 630 u in the positive spectra (particularly strong in the spectrum from the cholesterol-rich region) can, based on ESI mass spectra[18], tentatively be assigned to ceramide 18:0 and ceramide 24:1. The observation of these particular ceramide compounds (i.e. ceramide 18:0 and 24:1) is consistent with the known ceramide composition in neural tissue[19].
The assignment of the peak in the negative spectra at 673 u to phosphatidic acid is also based on ESI mass spectrometry data[20]. It is, however, not possible to exclude that the peak can originate from phosphatidylcholine (loss of N(CH3)3(CH2)2, as in the case of sphingomyelin).
When comparing the spectra from the phosphocholine-rich and cholesterol-rich areas in fig. 4, significant differences can be observed. In the positive spectra, the signal intensity from the peaks at 548 u (ceramide 18:0), 771 u (cholesterol2) and the unassigned peak at 794 u are significantly larger
Cholesterol area
Phosphocholine area
Phosphocholine area
Cholesterol area
(a)
(b)
PC PC
Cer Ch
PC
SM
PI
S
S Ch In
tens
ity (c
ount
s)
Inte
nsity
(cou
nts)
8
in the cholesterol-rich area, as compared to the phosphatidylcholine peaks. In the negative spectrum, the signal intensity from phosphatidylinositol (857 and 885 u) and sphingomyelin (644, 670 and 715 u) are significantly stronger in the phosphocholine-rich area, as compared to the sulfatide signal.
3.2. TOF-SIMS analysis of eosin Y stained mouse brain section
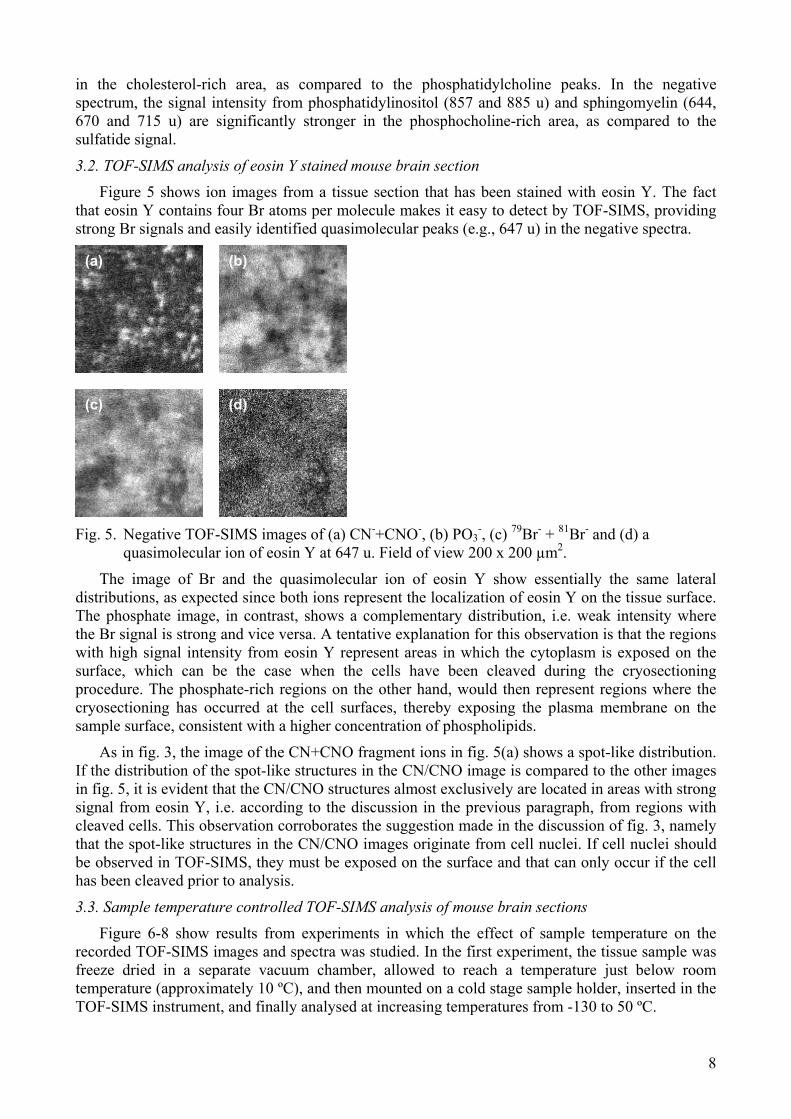
Figure 5 shows ion images from a tissue section that has been stained with eosin Y. The fact that eosin Y contains four Br atoms per molecule makes it easy to detect by TOF-SIMS, providing strong Br signals and easily identified quasimolecular peaks (e.g., 647 u) in the negative spectra.
Fig. 5. Negative TOF-SIMS images of (a) CN-+CNO-, (b) PO3
-, (c) 79Br- + 81Br- and (d) a quasimolecular ion of eosin Y at 647 u. Field of view 200 x 200 µm2.
The image of Br and the quasimolecular ion of eosin Y show essentially the same lateral distributions, as expected since both ions represent the localization of eosin Y on the tissue surface. The phosphate image, in contrast, shows a complementary distribution, i.e. weak intensity where the Br signal is strong and vice versa. A tentative explanation for this observation is that the regions with high signal intensity from eosin Y represent areas in which the cytoplasm is exposed on the surface, which can be the case when the cells have been cleaved during the cryosectioning procedure. The phosphate-rich regions on the other hand, would then represent regions where the cryosectioning has occurred at the cell surfaces, thereby exposing the plasma membrane on the sample surface, consistent with a higher concentration of phospholipids.
As in fig. 3, the image of the CN+CNO fragment ions in fig. 5(a) shows a spot-like distribution. If the distribution of the spot-like structures in the CN/CNO image is compared to the other images in fig. 5, it is evident that the CN/CNO structures almost exclusively are located in areas with strong signal from eosin Y, i.e. according to the discussion in the previous paragraph, from regions with cleaved cells. This observation corroborates the suggestion made in the discussion of fig. 3, namely that the spot-like structures in the CN/CNO images originate from cell nuclei. If cell nuclei should be observed in TOF-SIMS, they must be exposed on the surface and that can only occur if the cell has been cleaved prior to analysis.
3.3. Sample temperature controlled TOF-SIMS analysis of mouse brain sections
Figure 6-8 show results from experiments in which the effect of sample temperature on the recorded TOF-SIMS images and spectra was studied. In the first experiment, the tissue sample was freeze dried in a separate vacuum chamber, allowed to reach a temperature just below room temperature (approximately 10 ºC), and then mounted on a cold stage sample holder, inserted in the TOF-SIMS instrument, and finally analysed at increasing temperatures from -130 to 50 ºC.
(a) (b)
(c) (d)
9
CNO- Phosphocholine+ Cholesterol- Sulfatide-
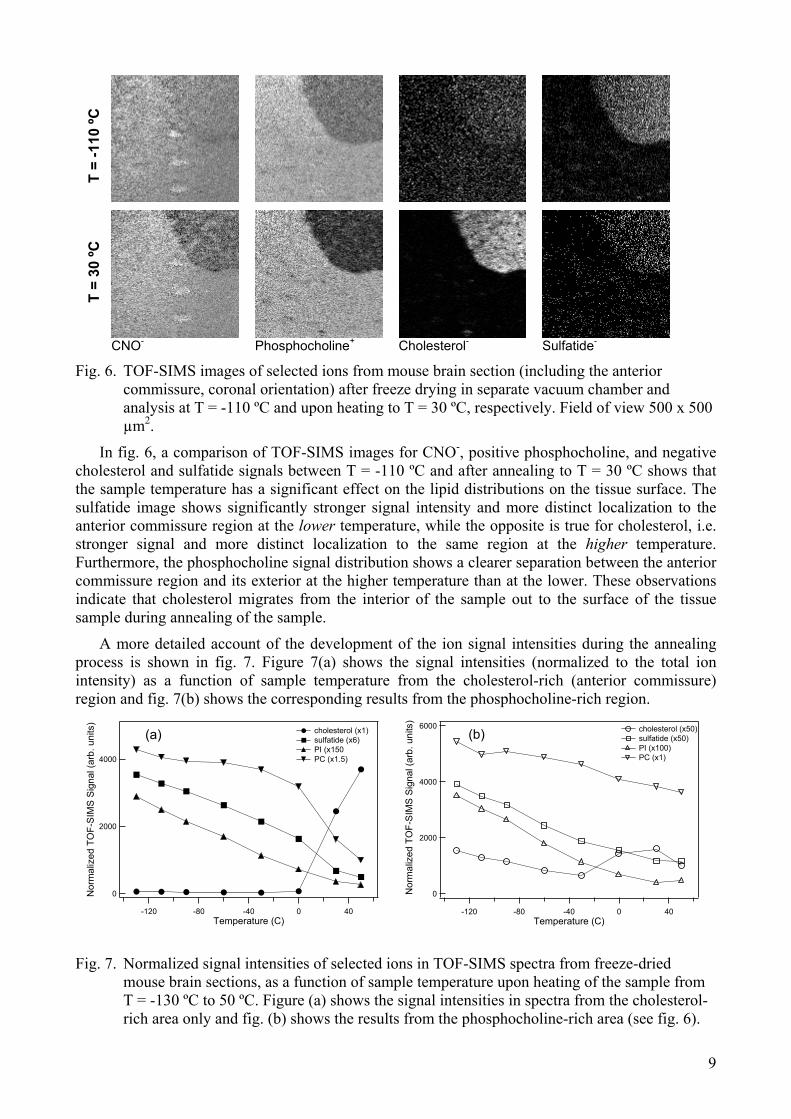
Fig. 6. TOF-SIMS images of selected ions from mouse brain section (including the anterior commissure, coronal orientation) after freeze drying in separate vacuum chamber and analysis at T = -110 ºC and upon heating to T = 30 ºC, respectively. Field of view 500 x 500 µm2.
In fig. 6, a comparison of TOF-SIMS images for CNO-, positive phosphocholine, and negative cholesterol and sulfatide signals between T = -110 ºC and after annealing to T = 30 ºC shows that the sample temperature has a significant effect on the lipid distributions on the tissue surface. The sulfatide image shows significantly stronger signal intensity and more distinct localization to the anterior commissure region at the lower temperature, while the opposite is true for cholesterol, i.e. stronger signal and more distinct localization to the same region at the higher temperature. Furthermore, the phosphocholine signal distribution shows a clearer separation between the anterior commissure region and its exterior at the higher temperature than at the lower. These observations indicate that cholesterol migrates from the interior of the sample out to the surface of the tissue sample during annealing of the sample.
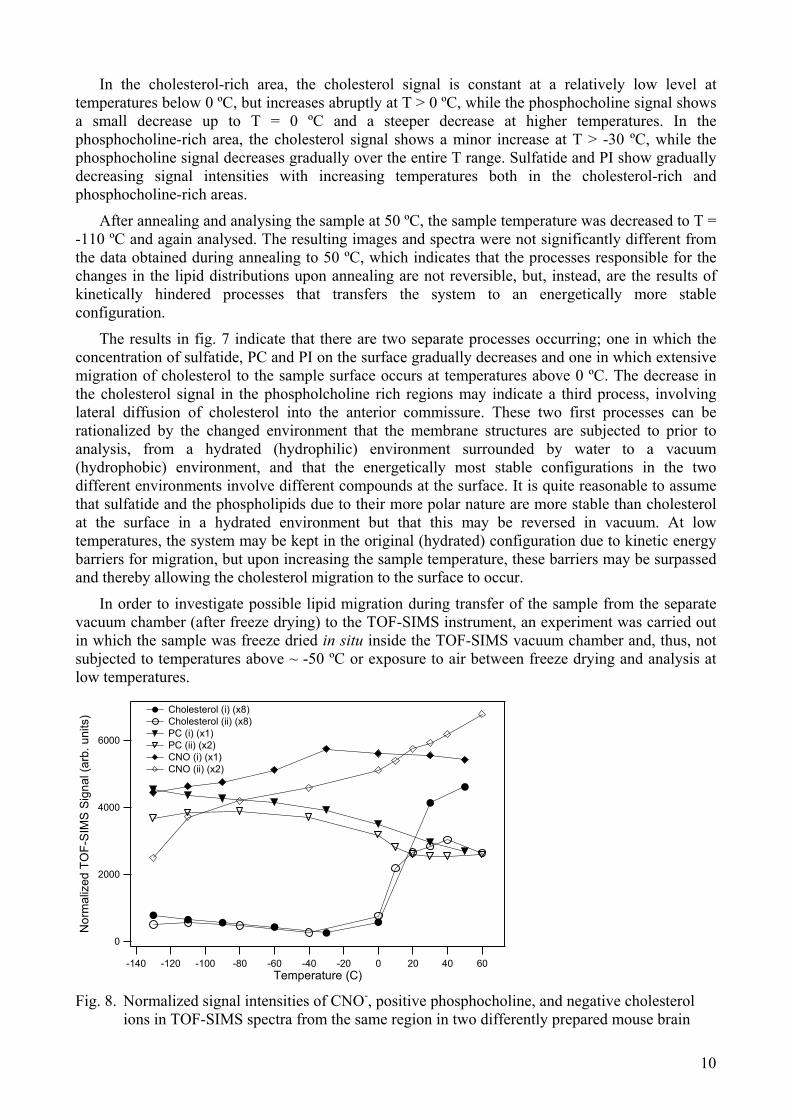
A more detailed account of the development of the ion signal intensities during the annealing process is shown in fig. 7. Figure 7(a) shows the signal intensities (normalized to the total ion intensity) as a function of sample temperature from the cholesterol-rich (anterior commissure) region and fig. 7(b) shows the corresponding results from the phosphocholine-rich region.
4000
2000
0Nor
mal
ized
TO
F-S
IMS
Sig
nal (
arb.
uni
ts)
-120 -80 -40 0 40Temperature (C)
cholesterol (x1) sulfatide (x6) PI (x150 PC (x1.5)
6000
4000
2000
0Nor
mal
ized
TO
F-S
IMS
Sig
nal (
arb.
uni
ts)
-120 -80 -40 0 40Temperature (C)
cholesterol (x50) sulfatide (x50) PI (x100) PC (x1)
Fig. 7. Normalized signal intensities of selected ions in TOF-SIMS spectra from freeze-dried mouse brain sections, as a function of sample temperature upon heating of the sample from T = -130 ºC to 50 ºC. Figure (a) shows the signal intensities in spectra from the cholesterol-rich area only and fig. (b) shows the results from the phosphocholine-rich area (see fig. 6).
T =
-110
ºC
T =
30 ºC
(a) (b)
10
In the cholesterol-rich area, the cholesterol signal is constant at a relatively low level at temperatures below 0 ºC, but increases abruptly at T > 0 ºC, while the phosphocholine signal shows a small decrease up to T = 0 ºC and a steeper decrease at higher temperatures. In the phosphocholine-rich area, the cholesterol signal shows a minor increase at T > -30 ºC, while the phosphocholine signal decreases gradually over the entire T range. Sulfatide and PI show gradually decreasing signal intensities with increasing temperatures both in the cholesterol-rich and phosphocholine-rich areas.
After annealing and analysing the sample at 50 ºC, the sample temperature was decreased to T = -110 ºC and again analysed. The resulting images and spectra were not significantly different from the data obtained during annealing to 50 ºC, which indicates that the processes responsible for the changes in the lipid distributions upon annealing are not reversible, but, instead, are the results of kinetically hindered processes that transfers the system to an energetically more stable configuration.
The results in fig. 7 indicate that there are two separate processes occurring; one in which the concentration of sulfatide, PC and PI on the surface gradually decreases and one in which extensive migration of cholesterol to the sample surface occurs at temperatures above 0 ºC. The decrease in the cholesterol signal in the phospholcholine rich regions may indicate a third process, involving lateral diffusion of cholesterol into the anterior commissure. These two first processes can be rationalized by the changed environment that the membrane structures are subjected to prior to analysis, from a hydrated (hydrophilic) environment surrounded by water to a vacuum (hydrophobic) environment, and that the energetically most stable configurations in the two different environments involve different compounds at the surface. It is quite reasonable to assume that sulfatide and the phospholipids due to their more polar nature are more stable than cholesterol at the surface in a hydrated environment but that this may be reversed in vacuum. At low temperatures, the system may be kept in the original (hydrated) configuration due to kinetic energy barriers for migration, but upon increasing the sample temperature, these barriers may be surpassed and thereby allowing the cholesterol migration to the surface to occur.
In order to investigate possible lipid migration during transfer of the sample from the separate vacuum chamber (after freeze drying) to the TOF-SIMS instrument, an experiment was carried out in which the sample was freeze dried in situ inside the TOF-SIMS vacuum chamber and, thus, not subjected to temperatures above ~ -50 ºC or exposure to air between freeze drying and analysis at low temperatures.
6000
4000
2000
0
Nor
mal
ized
TO
F-S
IMS
Sig
nal (
arb.
uni
ts)
-140 -120 -100 -80 -60 -40 -20 0 20 40 60Temperature (C)
Cholesterol (i) (x8) Cholesterol (ii) (x8) PC (i) (x1) PC (ii) (x2) CNO (i) (x1) CNO (ii) (x2)
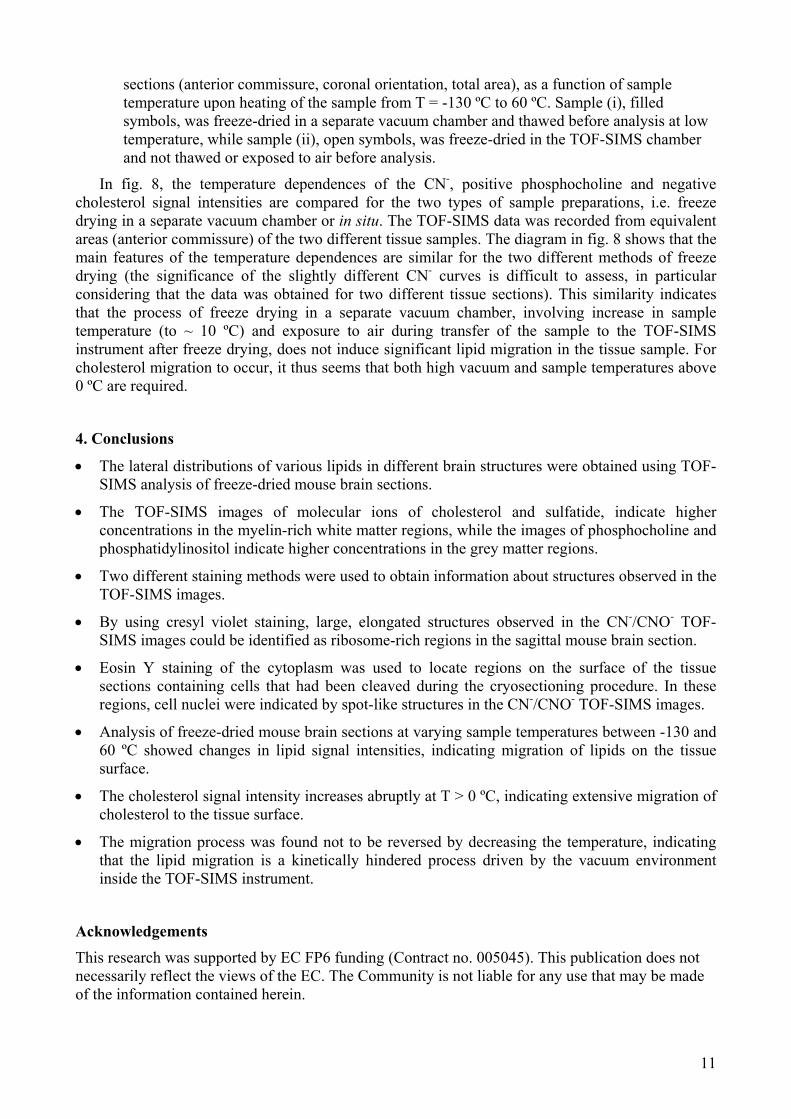
Fig. 8. Normalized signal intensities of CNO-, positive phosphocholine, and negative cholesterol
ions in TOF-SIMS spectra from the same region in two differently prepared mouse brain
11
sections (anterior commissure, coronal orientation, total area), as a function of sample temperature upon heating of the sample from T = -130 ºC to 60 ºC. Sample (i), filled symbols, was freeze-dried in a separate vacuum chamber and thawed before analysis at low temperature, while sample (ii), open symbols, was freeze-dried in the TOF-SIMS chamber and not thawed or exposed to air before analysis.
In fig. 8, the temperature dependences of the CN-, positive phosphocholine and negative cholesterol signal intensities are compared for the two types of sample preparations, i.e. freeze drying in a separate vacuum chamber or in situ. The TOF-SIMS data was recorded from equivalent areas (anterior commissure) of the two different tissue samples. The diagram in fig. 8 shows that the main features of the temperature dependences are similar for the two different methods of freeze drying (the significance of the slightly different CN- curves is difficult to assess, in particular considering that the data was obtained for two different tissue sections). This similarity indicates that the process of freeze drying in a separate vacuum chamber, involving increase in sample temperature (to ~ 10 ºC) and exposure to air during transfer of the sample to the TOF-SIMS instrument after freeze drying, does not induce significant lipid migration in the tissue sample. For cholesterol migration to occur, it thus seems that both high vacuum and sample temperatures above 0 ºC are required.
4. Conclusions
• The lateral distributions of various lipids in different brain structures were obtained using TOF-SIMS analysis of freeze-dried mouse brain sections.
• The TOF-SIMS images of molecular ions of cholesterol and sulfatide, indicate higher concentrations in the myelin-rich white matter regions, while the images of phosphocholine and phosphatidylinositol indicate higher concentrations in the grey matter regions.
• Two different staining methods were used to obtain information about structures observed in the TOF-SIMS images.
• By using cresyl violet staining, large, elongated structures observed in the CN-/CNO- TOF-SIMS images could be identified as ribosome-rich regions in the sagittal mouse brain section.
• Eosin Y staining of the cytoplasm was used to locate regions on the surface of the tissue sections containing cells that had been cleaved during the cryosectioning procedure. In these regions, cell nuclei were indicated by spot-like structures in the CN-/CNO- TOF-SIMS images.
• Analysis of freeze-dried mouse brain sections at varying sample temperatures between -130 and 60 ºC showed changes in lipid signal intensities, indicating migration of lipids on the tissue surface.
• The cholesterol signal intensity increases abruptly at T > 0 ºC, indicating extensive migration of cholesterol to the tissue surface.
• The migration process was found not to be reversed by decreasing the temperature, indicating that the lipid migration is a kinetically hindered process driven by the vacuum environment inside the TOF-SIMS instrument.
Acknowledgements This research was supported by EC FP6 funding (Contract no. 005045). This publication does not necessarily reflect the views of the EC. The Community is not liable for any use that may be made of the information contained herein.
12
References [1] M.L. Pacholski, N. Winograd, Chem. Rev. 99 (1999) 2977. [2] R.G. Cutler, J. Kelly, K. Storie, W.A. Pedersen, A. Tammara, K. Hatanpaa, J.C. Troncoso,
M.P. Mattson, Proc. Natl. Acad. Sci. U.S.A. 101 (2004) 2070. [3] M.R. Wenk, L. Lucast, G.D. Paulo, A.J. Romanelli, S.F. Suchy, R.L. Nussbaum, G.W.
Cline, G.I. Shulman, W. McMurray, P.D. Camillo, Nat. Biotechnol. 21 (2003) 813. [4] K. Gaus, E. Gratton, E.P. Kable, A.S. Jones, I. Gelissen, L. Kritharides, W. Jessup, Proc
Natl Acad Sci U S A 100 (2003) 15554. [5] N. Gupta, A.L. DeFranco, Mol. Biol. Cell 14 (2003) 432. [6] H.F.G. Heijnen, M.v. Lier, S. Waaijenborg, Y. Ohno-Iwashita, A.A. Waheed, M.M.
Inomata, G. Gorter, W. Möbius, J.W.N. Akkerman, J.W.Slot, J. Thromb. Haemost. 1 (2002) 1161.
[7] P. Chaurand, S.A. Schwartz, R.M. Caprioli, Curr. Opin. Chem. Biol. 6 (2002) 676. [8] M. Stoeckli, P. Chaurand, D.E. Hallahan, R.M. Caprioli, Nat. Med. 7 (2001) 493. [9] S. Chandra, D.R. Smith, G.H. Morrison, Anal Chem 72 (2000) 104A. [10] C.G. Marxer, M.L. Kraft, P.K. Weber, I.D. Hutcheon, S.G. Boxer, Biophysical Journal 88
(2005) 2965. [11] R. Strick, P.L. Strissel, K. Gavrilov, R. Levi-Setti, J Cell Biol 155 (2001) 899. [12] P. Sjovall, J. Lausmaa, B. Johansson, Anal Chem 76 (2004) 4271. [13] D. Touboul, F. Halgand, A. Brunelle, R. Kersting, E. Tallarek, B. Hagenhoff, O.
Laprévote, Anal. Chem. 76 (2004) 1550. [14] B. Cliff, N. Lockyer, H. Jungnickel, G. Stephens, J.C. Vickerman, Rapid Commun Mass
Spectrom 17 (2003) 2163. [15] T.P. Roddy, J. Donald M. Cannon, S.G. Ostrowski, N. Winograd, A.G. Ewing, Anal.
Chem. 74 (2002) 4020. [16] M. Fartmann, S. Dambach, C. Kriegeskotte, D. Lipinsky, H.P. Wiesmann, A. Wittig, W.
Sauerwein, H.F. Arlinghaus, Applied Surface Science 203-204 (2003) 726. [17] B.W. Agranoff, J.A. Benjamins, A.K. Hajra, in: G.J. Siegel, e. al. (Eds.), Basic
Neurochemistry: Molecular, Cellular and Medical Aspects, Philadelphia, 1999, pp. 48-67. [18] M. Gu, J.L. Kerwin, J.D. Watts, R. Aebersold, Anal Biochem 244 (1997) 347. [19] P.S. Sastry, Prog. Lipid Res. 24 (1985) 69. [20] M. Pulfer, R.C. Murphy, Mass Spectrom Rev 22 (2003) 332.