Localisation and Identification of Matrix Cracking and
23
This is an Open Access document downloaded from ORCA, Cardiff University's institutional repository: https://orca.cardiff.ac.uk/70271/ This is the author’s version of a work that was submitted to / accepted for publication. Citation for final published version: Crivelli, Davide, Guagliano, Mario, Eaton, Mark, Pearson, Matthew, Al-Jumaili, Safaa, Holford, Karen and Pullin, Rhys 2015. Localisation and identification of fatigue matrix cracking and delamination in a carbon fibre panel by acoustic emission. Composites Part B: Engineering 74 , pp. 1-12. 10.1016/j.compositesb.2014.12.032 file Publishers page: http://dx.doi.org/10.1016/j.compositesb.2014.12.03... <http://dx.doi.org/10.1016/j.compositesb.2014.12.032> Please note: Changes made as a result of publishing processes such as copy-editing, formatting and page numbers may not be reflected in this version. For the definitive version of this publication, please refer to the published source. You are advised to consult the publisher’s version if you wish to cite this paper. This version is being made available in accordance with publisher policies. See http://orca.cf.ac.uk/policies.html for usage policies. Copyright and moral rights for publications made available in ORCA are retained by the copyright holders.
Transcript of Localisation and Identification of Matrix Cracking and

This is a n Op e n Acces s doc u m e n t dow nloa d e d fro m ORCA, Ca r diff U nive r si ty 's
ins ti t u tion al r e posi to ry: h t t p s://o rc a.c a r diff.ac.uk/702 7 1/
This is t h e a u t ho r’s ve r sion of a wo rk t h a t w as s u b mi t t e d to / a c c e p t e d for
p u blica tion.
Cit a tion for final p u blish e d ve r sion:
Crivelli, Davide, Gu a gliano, M a rio, E a ton, M a rk, Pe a r son, M a t t h ew, Al-Jum aili,
S afa a , H olfo rd, Kar e n a n d P ullin, Rhys 2 0 1 5. Loc alisa tion a n d ide n tifica tion of
fa tig u e m a t rix c r a cking a n d d el a min a tion in a c a r bo n fib r e p a n el by a co us tic
e mission. Co m posi t e s Pa r t B: E n gin e e ring 7 4 , p p. 1-1 2.
1 0.1 0 1 6/j.co m posit e s b.20 1 4.12.03 2 file
P u blish e r s p a g e: h t t p://dx.doi.o rg/10.10 1 6/j.co m posi t e s b.20 1 4.12.03...
< h t t p://dx.doi.o rg/10.10 1 6/j.co m posi t e s b.20 1 4.1 2.03 2 >
Ple a s e no t e:
Ch a n g e s m a d e a s a r e s ul t of p u blishing p roc e s s e s s uc h a s copy-e di ting,
for m a t ting a n d p a g e n u m b e r s m ay no t b e r eflec t e d in t his ve r sion. For t h e
d efini tive ve r sion of t his p u blica tion, ple a s e r ef e r to t h e p u blish e d sou rc e. You
a r e a dvise d to cons ul t t h e p u blish e r’s ve r sion if you wish to ci t e t his p a p er.
This ve r sion is b ein g m a d e av ailable in a cco r d a n c e wit h p u blish e r policie s.
S e e
h t t p://o rc a .cf.ac.uk/policies.h t ml for u s a g e policies. Copyrigh t a n d m o r al r i gh t s
for p u blica tions m a d e available in ORCA a r e r e t ain e d by t h e copyrig h t
hold e r s .
Localisation and Identification of Matrix Cracking and Delamination in a Carbon Fibre Panel under Fatigue Loading
using Acoustic Emission
Davide Crivellia, Mario Guaglianoa, Mark Eatonb, Matthew Pearsonb, Safaa Al-Jumailib, Karen Holfordb,
Rhys Pullinb
aPolitecnico di Milano, Department of Mechanical Engineering, via La Masa 1, 20156 Milano, Italy
bCardiff School of Engineering, Cardiff University, Queen’s Building, The Parade, Cardiff CF24 3AA,
Wales, UK
Abstract
The use of Acoustic Emission (AE) as a Structural Health Monitoring (SHM) technique is very attractive due
to its ability to detect not only damage sources in real-time but also to locate them. To demonstrate the AE
capabilities on known damage modes, a carbon fibre panel was manufactured with cut fibres in a central
location, and subjected to fatigue loading to promote matrix cracking. AE signals were located within the
crack area; next, a delamination within the panel using an impact was created. Again, AE signals detected
under fatigue loading from this area were located and used for further analysis. The application of an
unsupervised neural network based classification technique successfully separated the two damage
mechanisms. The results obtained allowed a more detailed understanding of matrix cracking and
delamination sources of AE in carbon fibre laminates.
Keywords: A. Carbon fibre, A. Laminates, C. Damage mechanics, D. Acoustic emission, Artificial damage
1. Introduction
The increasing use of composite materials in those sectors that require a particular attention on weight
reduction, while keeping the same safety and reliability levels of metallic structures, will require these
structures to be equipped with an on-board sensing method capable of detecting damage. This family of
techniques goes under the name of Structural Health Monitoring (SHM), comprising all those systems, that
monitor, either continuously or at specific moments, the health status of a material, giving indication to the
user about damage developing, damage severity and eventually damage location [1].

Such SHM systems, if appropriately designed, will also allow a reduction in the downtime of assets and
planned, inspection-interval based maintenance will no longer be required in favour of an on-demand
maintenance programme. Safety critical structures, such as off-shore wind turbines or aircrafts, will receive
the most benefit from this approach to monitoring, since their maintenance downtime represents a large part
of their operative cost.
Among the SHM techniques being investigated at the moment, Acoustic Emission (AE) is considered a good
candidate [2]. AE is based on the observation that materials, when undergoing some type of damage, release
energy in the form of short, transient elastic waves in the ultrasound band (100 kHz – 1000 kHz). These
waves propagate in the structure through the material's bulk and surface, and eventually dissipate due to
various phenomena. These waves can be recorded by means of appropriate sensors, usually of the
piezoelectric type [3].
AE is considered a passive Non Destructive Technique (NDT): it does not require signals to be emitted (i.e.
to introduce energy in the structure) to detect damage; instead it waits for signals to be recorded by the
system due to some specific process in the material. This is a major advantage of AE as it does not require to
continuously scan the structure or record data in search of a potential damage. This is however also a
downside, because it does not provide information about a structure when it is not loaded, unlike other NDTs
(like radiography or ultrasound). In other words, the source must be active to be detected; unstressed flaws
will not generate AE.
There are several causes for AE. In metallic structures, AE can arise from crack propagation and plastic
deformation [4], as well as from non-detrimental phenomena such as friction and bonding relative
movement, together with spurious noise sources from parts that are acoustically connected. In composite
structures, AE sources are associated with the main composite failure modes; fibre breakage, matrix
cracking, fibre pull-out and delamination [5]. An in-depth analysis of this activity can lead to source type
identification based on waveform characteristics; this is the subject of current extensive research [6].
Especially in composite materials, AE has proved to offer interesting indications to researchers about the
development of damage. Static tests, but also fatigue tests [7,8], crack propagation, bond strength tests [9],
residual strength tests [10] and many others have benefitted from AE monitoring.
For all these applications, the necessity to identify different AE sources emerges. The main concern is to
learn how to assess whether and when a specific failure mode occurs in a material; such research is usually
aimed to increase the knowledge on failure modes of materials or structures and is directed towards the
development of better damage models.
One of the advantages of AE is its ability to localise damage sources by using multiple sensors (equal or
more than three for planar localisation [11]). Common planar location algorithms usually consider a uniform
velocity in the whole plane; then, based on the time of arrival (ToA) of the waveforms, they compute the
position by intersection of hyperbolae between sensor pairs. This algorithm is robust for homogeneous
materials, provided that the waveforms ToA is computed correctly and the velocity is known with an
adequate precision. However, in anisotropic materials, such as Carbon Fiber Reinforced Polymes (CFRP),
the wave velocity depends on the orientation of the wavepath with respect to the ply orientation. This makes
the ToA technique prone to errors. Additionally, local features (such as holes and material local
inhomogeneities) add uncertainty to the problem. To overcome this issue, a technique called Delta-T was
developed [12,13]. Delta-T utilises user generated maps of ToA differences between sensors, not by defining
a velocity but with a calibration grid. A HSU-Nielsen source [14] is generated at each grid point;
subsequently, for each sensor pair, a ToA difference map is determined. The location algorithm then, when
receiving a waveform (or, more specifically, the sensor pairs ToA differences) employs a reverse lookup on
each Delta-T map and identifies the source location. This technique proved more precise than the ToA in an
investigation of a metallic structure [15].
Commercial AE systems already provide some sort of data compression, by encoding the information
contained in each waveform into different parameters, such as peak amplitude, frequency content, duration,
energy and some others. Moreover, these parameters are thought to be linked to the kind of damage source
that originated the signal. This feature would benefit a user of AE as a SHM, by providing information not
only on the AE activity of a certain area of a structure, but also on the activity of specific damage modes.
In composite materials, AE can be generated in a number of ways; the main failure modes include matrix
cracking, fibre-matrix debonding, fibre fracture and delaminations. There are differences in the nature of the
AE signals due to the source type; this is mainly due to the in-plane or out-of-plane energy content. It is
known that matrix cracking and fibre breakage initiate mostly in-plane phenomena and generate extensional
waves of higher frequency, while delaminations are dominated by flexural waves of lower frequency [16].
In a delamination, the laminate separates at the interface between two layers, in some cases without
indications on the surface (for example, some impacts, although not visible from the impacted surface, may
hide large delaminations). Some authors suggest delaminations give rise to high amplitude signals [17],
while others point out medium amplitude signals for a ±45° laminate [18]; authors generally agree on
delamination signals having in general a long duration [19], but tend to include debonding within the same
classification.
Matrix cracking generally occurs between fibres at the fibre-matrix interface, or as shear failures between
plies. These types of matrix failures usually cause hackles, which are visible on the surface. Results have
been found to be dependent on material and testing procedure, with some agreement on defining matrix
cracking AE as mid-to-high amplitude and low frequency [20], but some studies report low amplitude
[17,18,21] and medium frequency [22] fast decay [23] but also slow decay [24].
Finally during loading, some fibres eventually fail in tension. The expected AE signature is an abrupt energy
release mechanisms, with high amplitude and fast risetime [18], as it would happen in a brittle crack
phenomenon.
As discussed, early approaches based the classification of damage mechanisms on a single AE parameter,
typically peak amplitude or frequency content. When trying to overcome some issues, mainly related to
signal attenuation as a function of distance, multiple parameters at once have been considered [21,25]. Due
to the high amount of data to be processed and difficulties in identifying patterns with traditional statistical
techniques, machine learning algorithms, especially Artificial Neural Networks (ANN) have been
increasingly used in this field [26–29]. Among these techniques, a previous paper by the authors [30]
presented an unsupervised technique for the classification of AE signals, based on the Self Organizing Map
(SOM) and the k-means clustering algorithm. The technique, for brevity referred to as k-SOM, also employs
a number of clustering indexes to determine which is the optimal number of natural classes found in a
dataset. In this way, no user input or tuning is required.
The aim of this experimental work is to obtain, analyse and identify AE signals from different damage
sources. These sources should be generated in a way that they could be easily isolated from boundary effects
(like edge reflections), while at the same time being in a known and distinct location. The positive
identification of different damage sources by the K-SOM classification technique is key to separating the
different contributions of the various AE modes in a real structure; for this reason, a further validation of the
technique is meant to be provided by this work.
2. Experimental plan
2.1 Panel
A 500mm×500mm CFRP panel was manufactured from unidirectional pre-preg T800S carbon fibre (56.6%
in volume) in epoxy resin (M21/35%/UD268/T800S, Hexcel Corporation). The final laminate consisted of
eight layers, laid up as [0/90]2s, giving a total thickness of 2.2mm, this was in line with the indications of the
manufacturer (a 2.1mm thickness was expected).
To promote matrix cracking in the innermost 0° layers (3rd and 6th) a 25mm crack was introduced by cutting
the fibres with a knife. Particular attention was paid when manufacturing the final lay-up to ensure that the
two cracked layers were aligned (Figure 1). This would ensure matrix cracks are more likely to happen in
this area as these plies are no longer supported by longitudinal fibres in the direct loading path.

(a) the entire panel
(b) detail of the cut
(c) cut plies schematic
Figure 1: CFRP panel during layup of the inner plies
The panel was then cured as per manufacturer specifications in an autoclave. The panel was subsequently C-
scanned to make sure that no macroscopic defects or curing failures were present.
To allow the panel to be loaded in tension, two holes were drilled and reinforced with aluminium square
tabs. This prevented crushing of the composite under tensile loading.
The tabs were bonded before cutting the holes with araldite glue; the holes were then drilled through both
aluminium and the material. Another C-scan was then performed to compare with the original scan to make
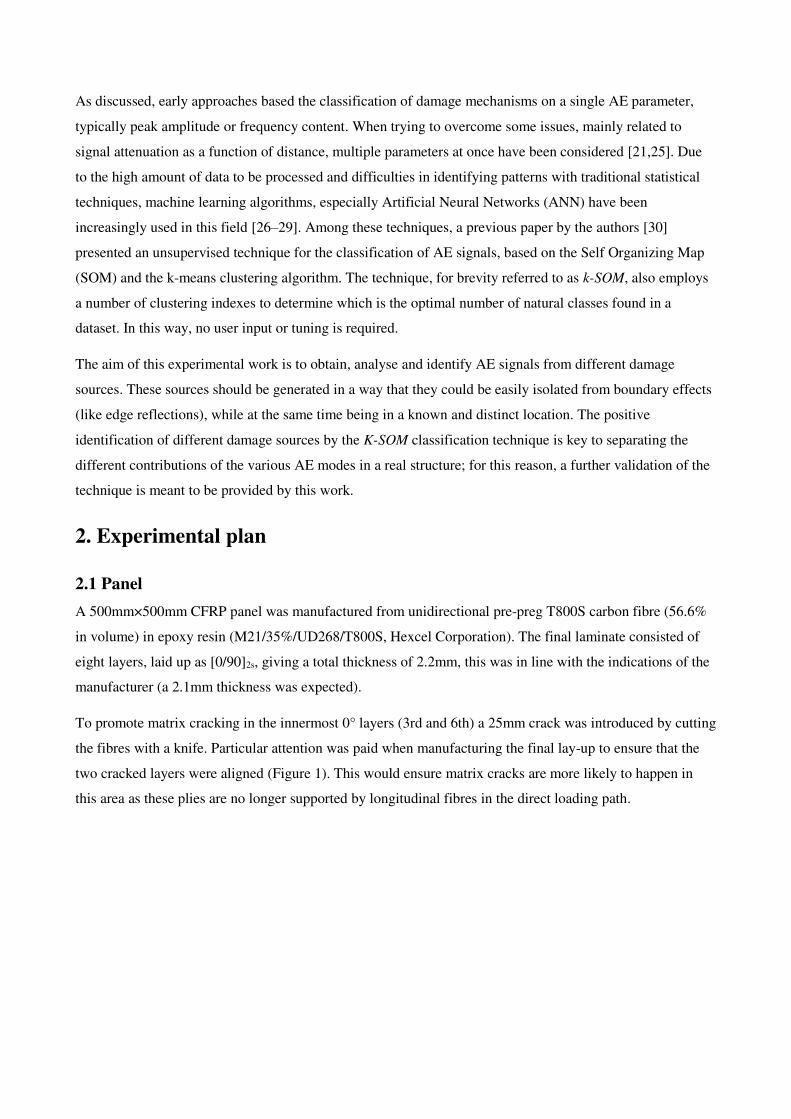
sure that it was not damaged during this process. The final panel geometry is shown in Figure 2.
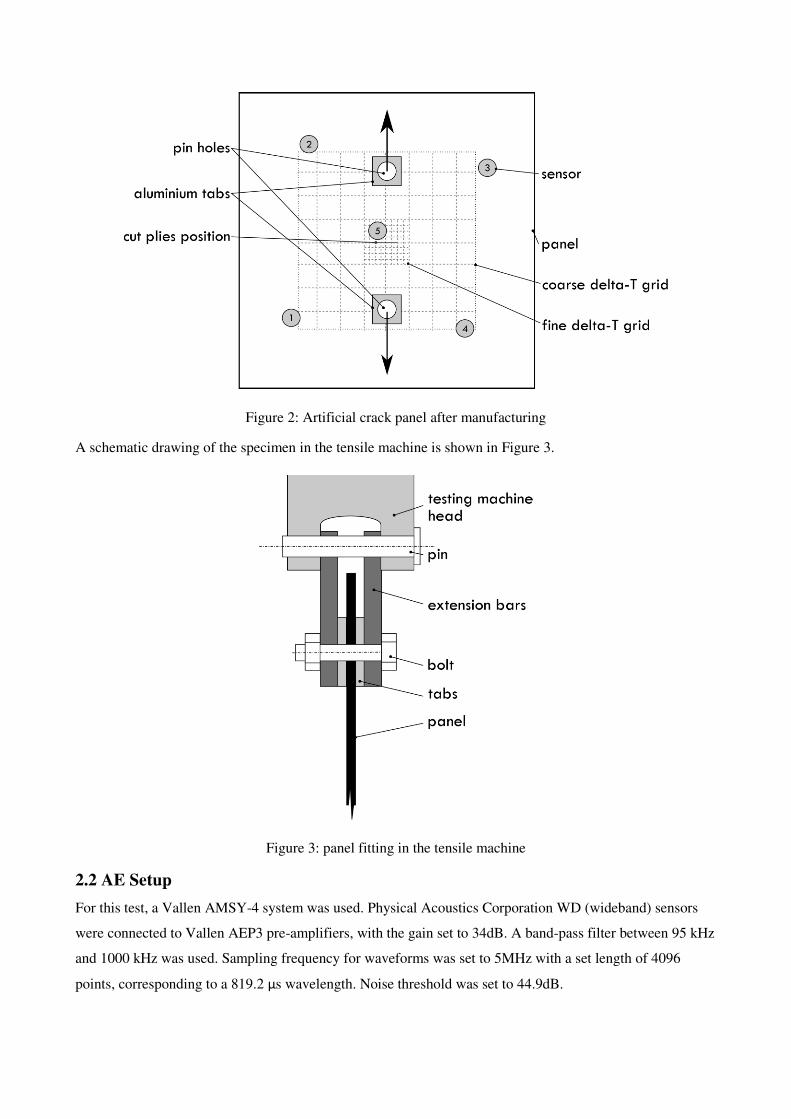
Figure 2: Artificial crack panel after manufacturing
A schematic drawing of the specimen in the tensile machine is shown in Figure 3.
Figure 3: panel fitting in the tensile machine
2.2 AE Setup
For this test, a Vallen AMSY-4 system was used. Physical Acoustics Corporation WD (wideband) sensors
were connected to Vallen AEP3 pre-amplifiers, with the gain set to 34dB. A band-pass filter between 95 kHz
and 1000 kHz was used. Sampling frequency for waveforms was set to 5MHz with a set length of 4096
points, corresponding to a 819.2 μs wavelength. Noise threshold was set to 44.9dB.
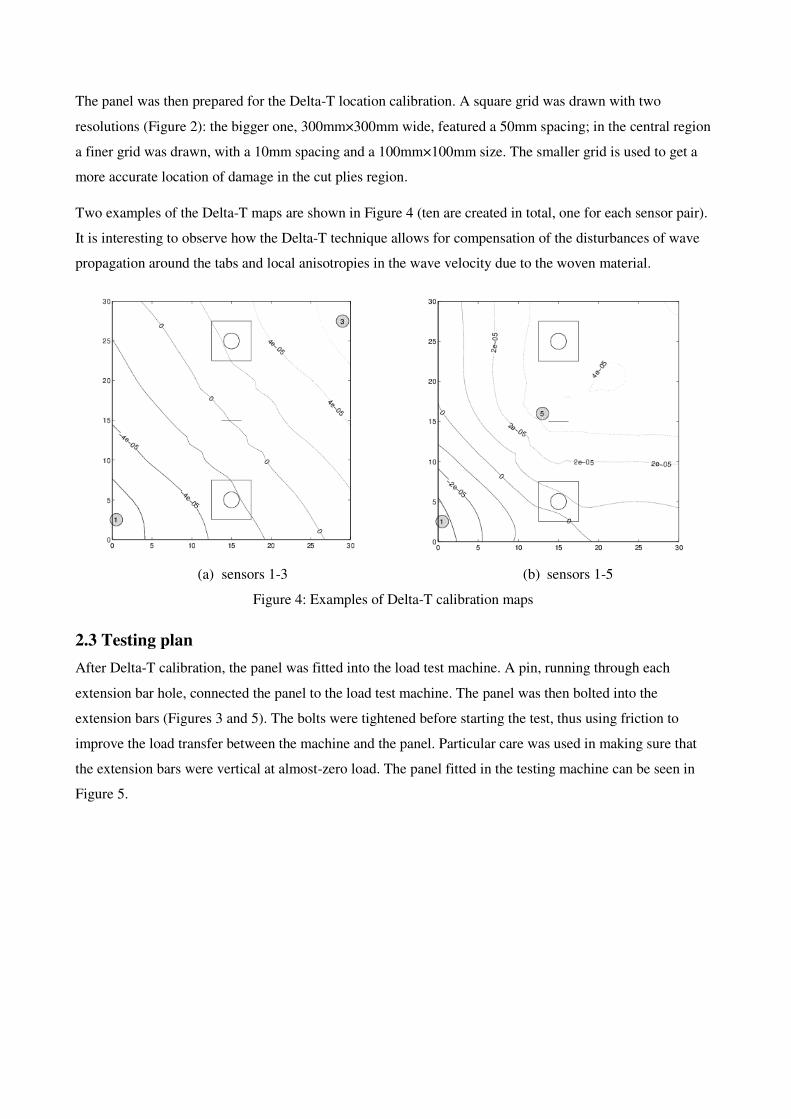
The panel was then prepared for the Delta-T location calibration. A square grid was drawn with two
resolutions (Figure 2): the bigger one, 300mm×300mm wide, featured a 50mm spacing; in the central region
a finer grid was drawn, with a 10mm spacing and a 100mm×100mm size. The smaller grid is used to get a
more accurate location of damage in the cut plies region.
Two examples of the Delta-T maps are shown in Figure 4 (ten are created in total, one for each sensor pair).
It is interesting to observe how the Delta-T technique allows for compensation of the disturbances of wave
propagation around the tabs and local anisotropies in the wave velocity due to the woven material.
(a) sensors 1-3 (b) sensors 1-5
Figure 4: Examples of Delta-T calibration maps
2.3 Testing plan
After Delta-T calibration, the panel was fitted into the load test machine. A pin, running through each
extension bar hole, connected the panel to the load test machine. The panel was then bolted into the
extension bars (Figures 3 and 5). The bolts were tightened before starting the test, thus using friction to
improve the load transfer between the machine and the panel. Particular care was used in making sure that
the extension bars were vertical at almost-zero load. The panel fitted in the testing machine can be seen in
Figure 5.
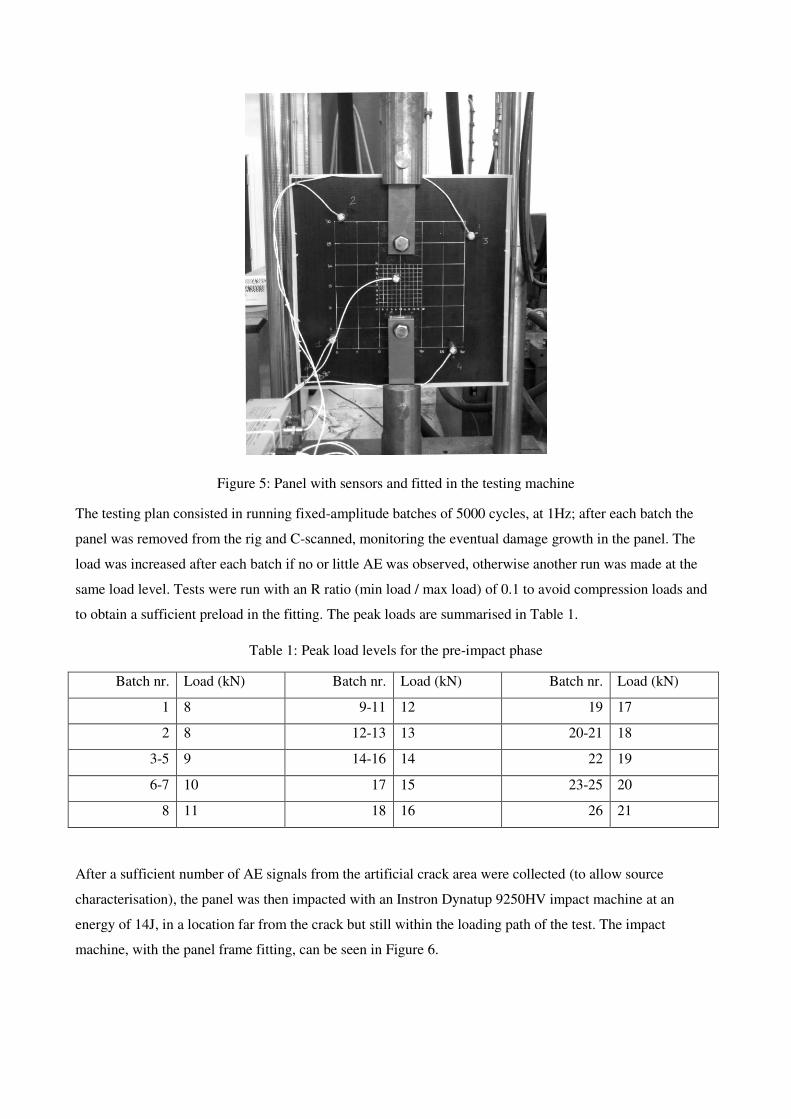
Figure 5: Panel with sensors and fitted in the testing machine
The testing plan consisted in running fixed-amplitude batches of 5000 cycles, at 1Hz; after each batch the
panel was removed from the rig and C-scanned, monitoring the eventual damage growth in the panel. The
load was increased after each batch if no or little AE was observed, otherwise another run was made at the
same load level. Tests were run with an R ratio (min load / max load) of 0.1 to avoid compression loads and
to obtain a sufficient preload in the fitting. The peak loads are summarised in Table 1.
Table 1: Peak load levels for the pre-impact phase
Batch nr. Load (kN) Batch nr. Load (kN) Batch nr. Load (kN)
1 8 9-11 12 19 17
2 8 12-13 13 20-21 18
3-5 9 14-16 14 22 19
6-7 10 17 15 23-25 20
8 11 18 16 26 21
After a sufficient number of AE signals from the artificial crack area were collected (to allow source
characterisation), the panel was then impacted with an Instron Dynatup 9250HV impact machine at an
energy of 14J, in a location far from the crack but still within the loading path of the test. The impact
machine, with the panel frame fitting, can be seen in Figure 6.
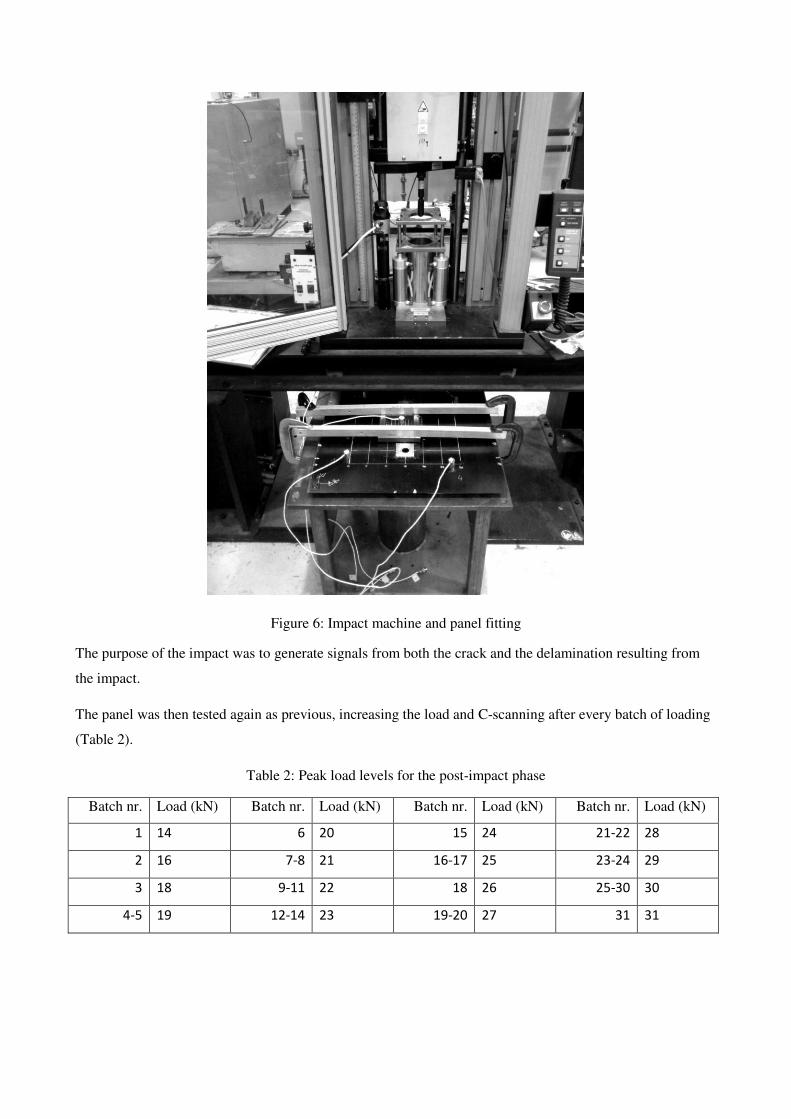
Figure 6: Impact machine and panel fitting
The purpose of the impact was to generate signals from both the crack and the delamination resulting from
the impact.
The panel was then tested again as previous, increasing the load and C-scanning after every batch of loading
(Table 2).
Table 2: Peak load levels for the post-impact phase
Batch nr. Load (kN) Batch nr. Load (kN) Batch nr. Load (kN) Batch nr. Load (kN)
1 14 6 20 15 24 21-22 28
2 16 7-8 21 16-17 25 23-24 29
3 18 9-11 22 18 26 25-30 30
4-5 19 12-14 23 19-20 27 31 31
3. Results
3.1 Pre impact
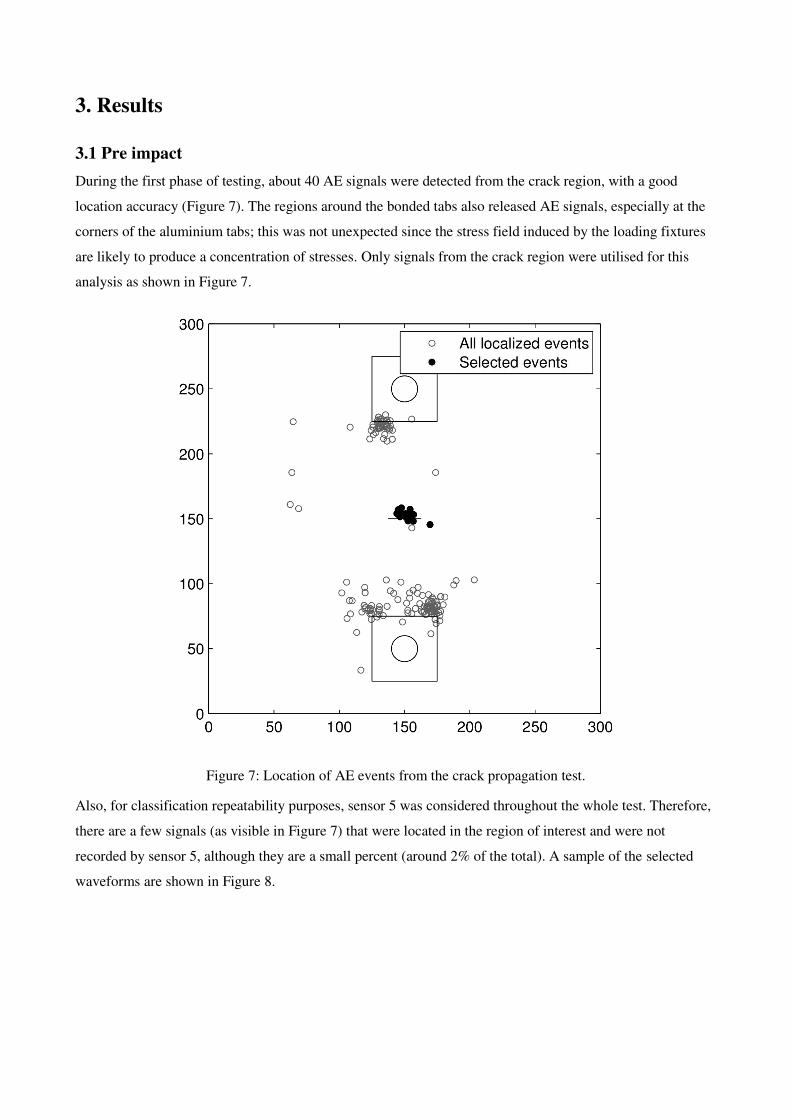
During the first phase of testing, about 40 AE signals were detected from the crack region, with a good
location accuracy (Figure 7). The regions around the bonded tabs also released AE signals, especially at the
corners of the aluminium tabs; this was not unexpected since the stress field induced by the loading fixtures
are likely to produce a concentration of stresses. Only signals from the crack region were utilised for this
analysis as shown in Figure 7.
Figure 7: Location of AE events from the crack propagation test.
Also, for classification repeatability purposes, sensor 5 was considered throughout the whole test. Therefore,
there are a few signals (as visible in Figure 7) that were located in the region of interest and were not
recorded by sensor 5, although they are a small percent (around 2% of the total). A sample of the selected
waveforms are shown in Figure 8.
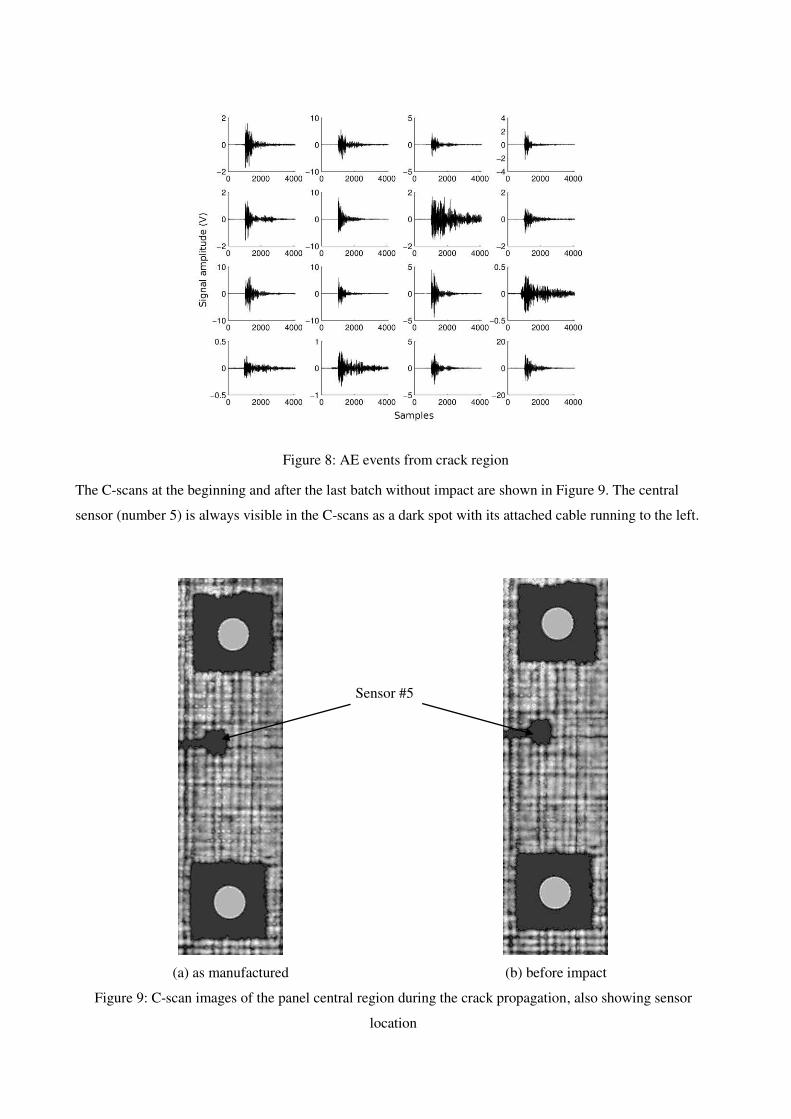
Figure 8: AE events from crack region
The C-scans at the beginning and after the last batch without impact are shown in Figure 9. The central
sensor (number 5) is always visible in the C-scans as a dark spot with its attached cable running to the left.
(a) as manufactured (b) before impact
Figure 9: C-scan images of the panel central region during the crack propagation, also showing sensor
location
Sensor #5

C-scans confirm that no additional damage has been introduced during the test. No high attenuation (dark)
areas are found; this confirms the absence of in-plane discontinuities, like delaminations. The crack region,
below the sensor visible in the centre, appears to darken slightly, but no evidence of growth can be observed.
3.2 Post impact
After the impact, the AE activity of the panel increased significantly. Figure 10 shows AE localised events
for the last batch after impact (batch 31). The test was then interrupted since it showed significant sources
from the impact region. The figure also shows the selected events from this set.
Figure 10: AE events during the selected after impact batch
The location accuracy appears reduced, mainly due to the presence of the impact area which alters wave
propagation path, while the undamaged calibration was retained. Nevertheless, it has to be noted that signals
from the crack area have decreased in number, and moved towards the crack tips. This is a consequence of
the fact that the crack region has reduced its stiffness, the stress field has been modified to increase at the
sides of the crack and zones of stress concentration exist around the crack tips. Therefore, those signals may
indicate some damage mechanisms happening at or near the crack tip regions. A sample of the signals
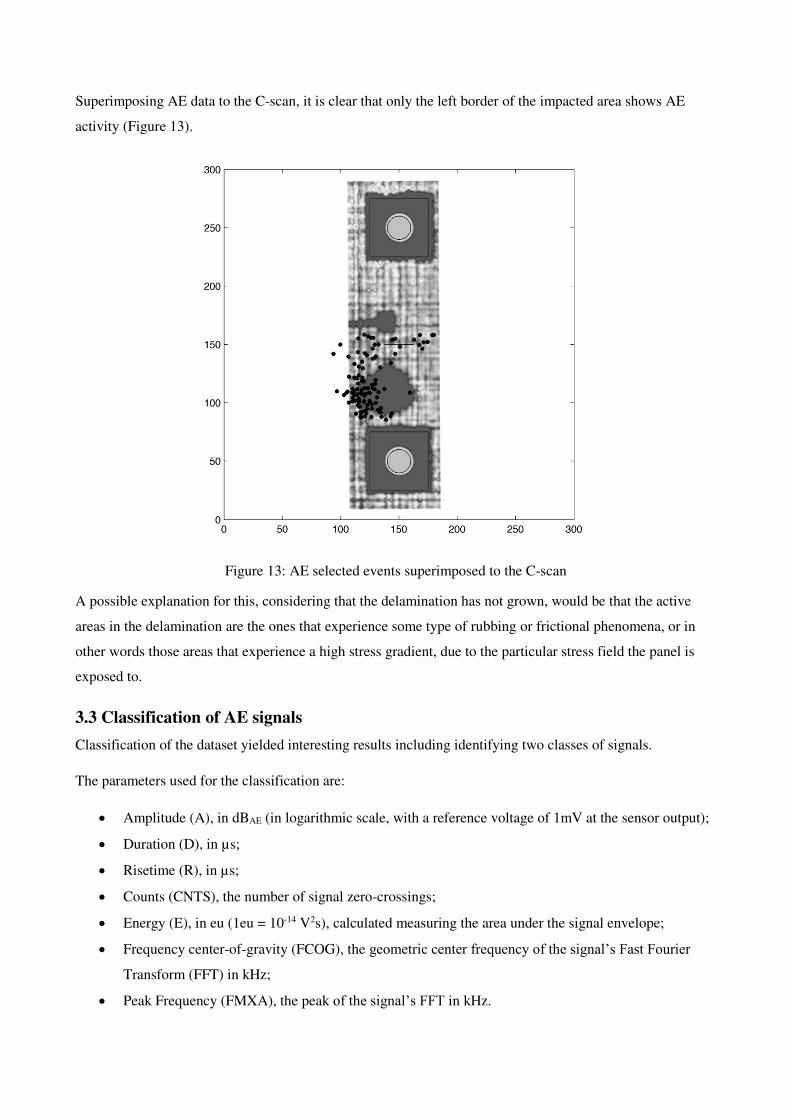
coming from the delamination region is shown in Figure 11.
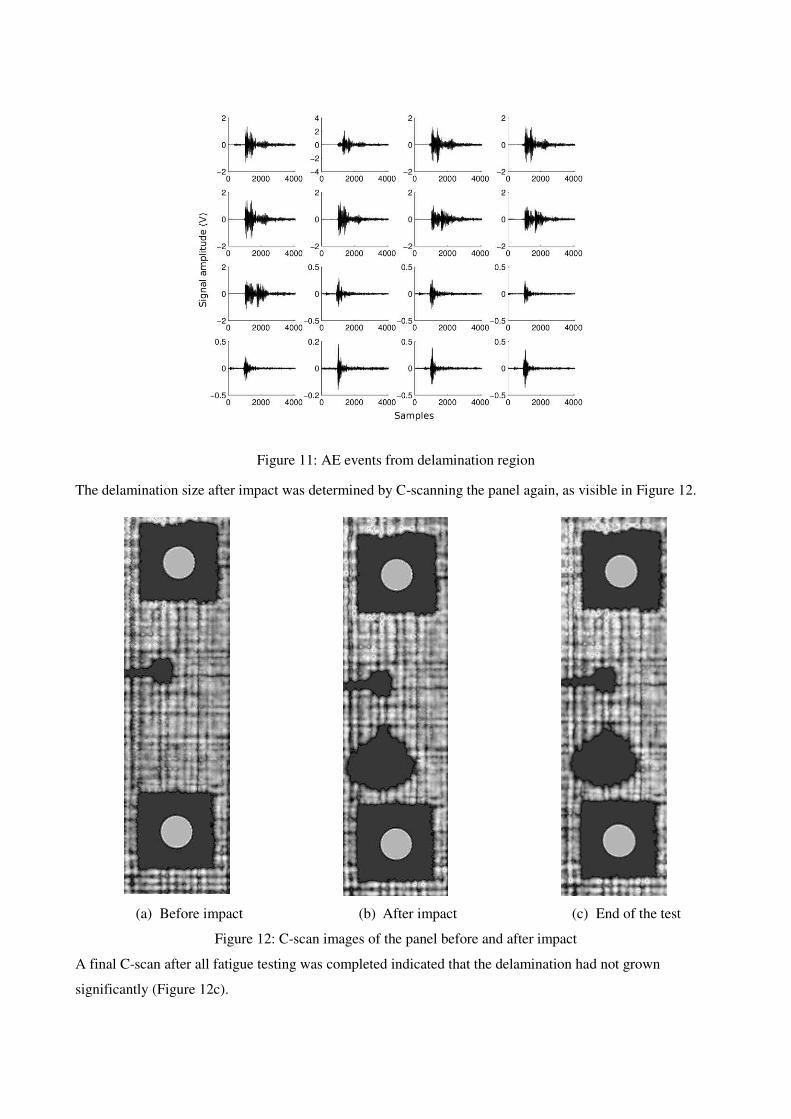
Figure 11: AE events from delamination region
The delamination size after impact was determined by C-scanning the panel again, as visible in Figure 12.
(a) Before impact (b) After impact (c) End of the test
Figure 12: C-scan images of the panel before and after impact
A final C-scan after all fatigue testing was completed indicated that the delamination had not grown
significantly (Figure 12c).
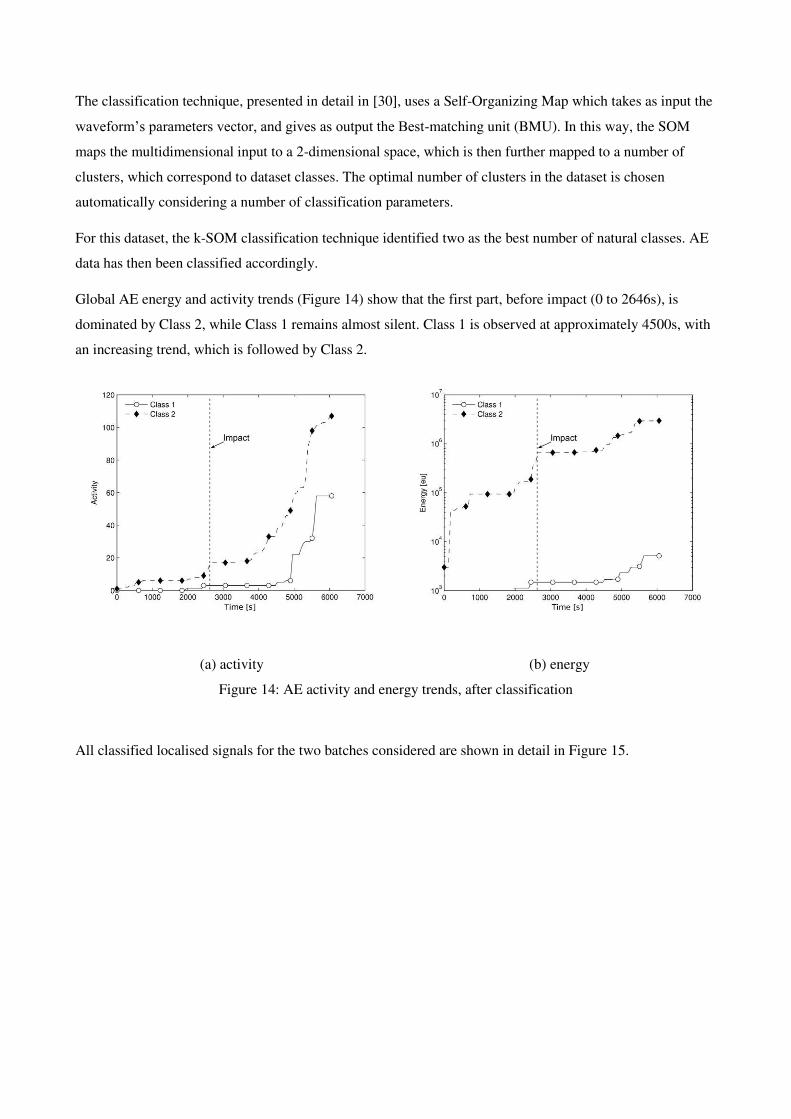
Superimposing AE data to the C-scan, it is clear that only the left border of the impacted area shows AE
activity (Figure 13).
Figure 13: AE selected events superimposed to the C-scan
A possible explanation for this, considering that the delamination has not grown, would be that the active
areas in the delamination are the ones that experience some type of rubbing or frictional phenomena, or in
other words those areas that experience a high stress gradient, due to the particular stress field the panel is
exposed to.
3.3 Classification of AE signals
Classification of the dataset yielded interesting results including identifying two classes of signals.
The parameters used for the classification are:
Amplitude (A), in dBAE (in logarithmic scale, with a reference voltage of 1mV at the sensor output);
Duration (D), in µs;
Risetime (R), in µs;
Counts (CNTS), the number of signal zero-crossings;
Energy (E), in eu (1eu = 10-14 V2s), calculated measuring the area under the signal envelope;
Frequency center-of-gravity (FCOG), the geometric center frequency of the signal’s Fast Fourier
Transform (FFT) in kHz;
Peak Frequency (FMXA), the peak of the signal’s FFT in kHz.
The classification technique, presented in detail in [30], uses a Self-Organizing Map which takes as input the
waveform’s parameters vector, and gives as output the Best-matching unit (BMU). In this way, the SOM
maps the multidimensional input to a 2-dimensional space, which is then further mapped to a number of
clusters, which correspond to dataset classes. The optimal number of clusters in the dataset is chosen
automatically considering a number of classification parameters.
For this dataset, the k-SOM classification technique identified two as the best number of natural classes. AE
data has then been classified accordingly.
Global AE energy and activity trends (Figure 14) show that the first part, before impact (0 to 2646s), is
dominated by Class 2, while Class 1 remains almost silent. Class 1 is observed at approximately 4500s, with
an increasing trend, which is followed by Class 2.
(a) activity (b) energy
Figure 14: AE activity and energy trends, after classification
All classified localised signals for the two batches considered are shown in detail in Figure 15.
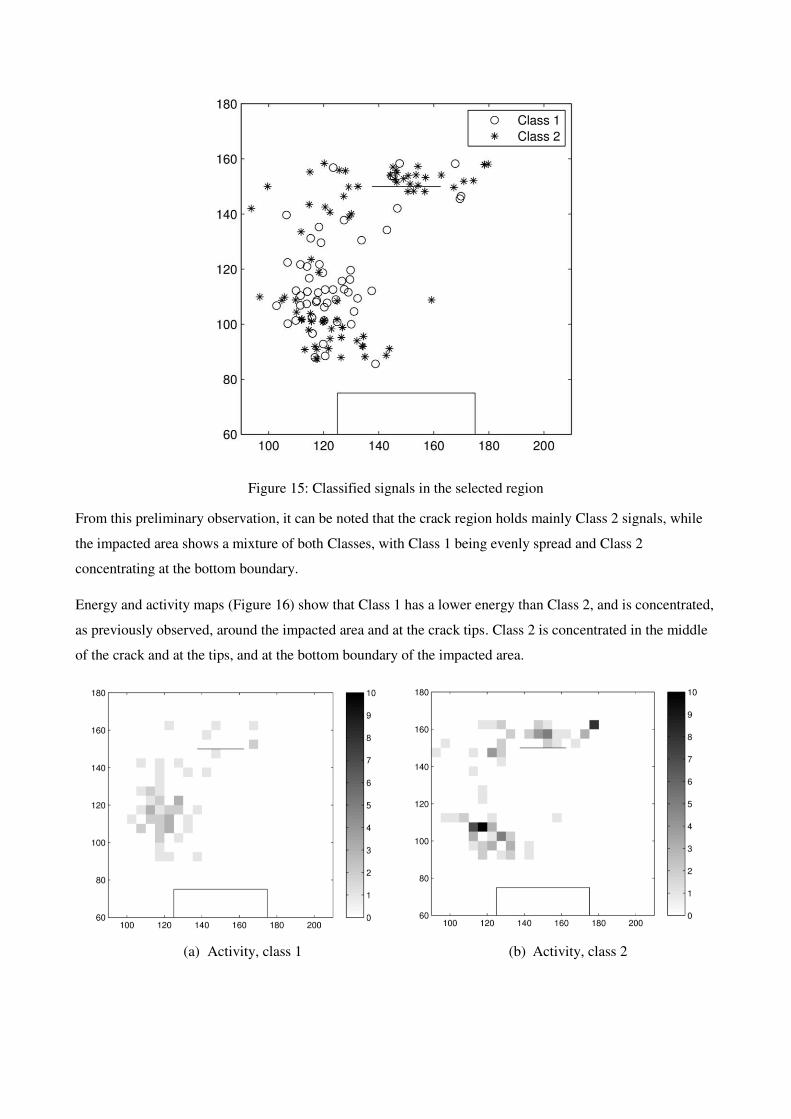
Figure 15: Classified signals in the selected region
From this preliminary observation, it can be noted that the crack region holds mainly Class 2 signals, while
the impacted area shows a mixture of both Classes, with Class 1 being evenly spread and Class 2
concentrating at the bottom boundary.
Energy and activity maps (Figure 16) show that Class 1 has a lower energy than Class 2, and is concentrated,
as previously observed, around the impacted area and at the crack tips. Class 2 is concentrated in the middle
of the crack and at the tips, and at the bottom boundary of the impacted area.
(a) Activity, class 1 (b) Activity, class 2
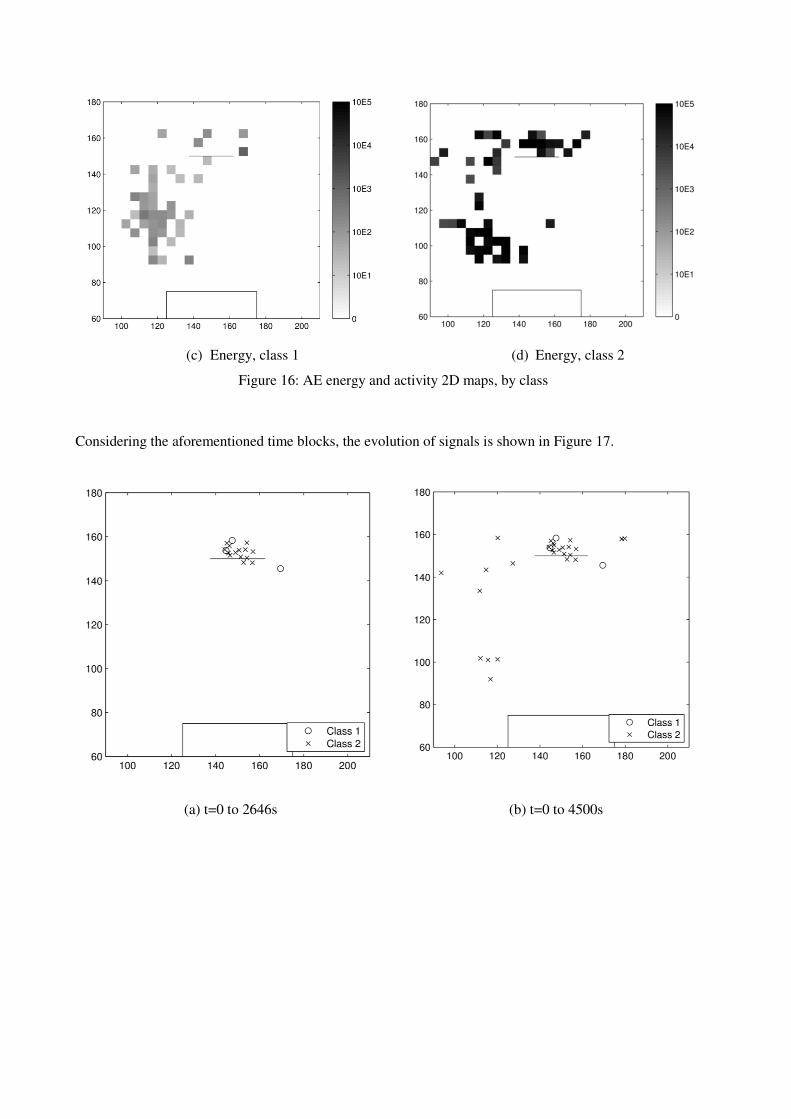
(c) Energy, class 1 (d) Energy, class 2
Figure 16: AE energy and activity 2D maps, by class
Considering the aforementioned time blocks, the evolution of signals is shown in Figure 17.
(a) t=0 to 2646s (b) t=0 to 4500s
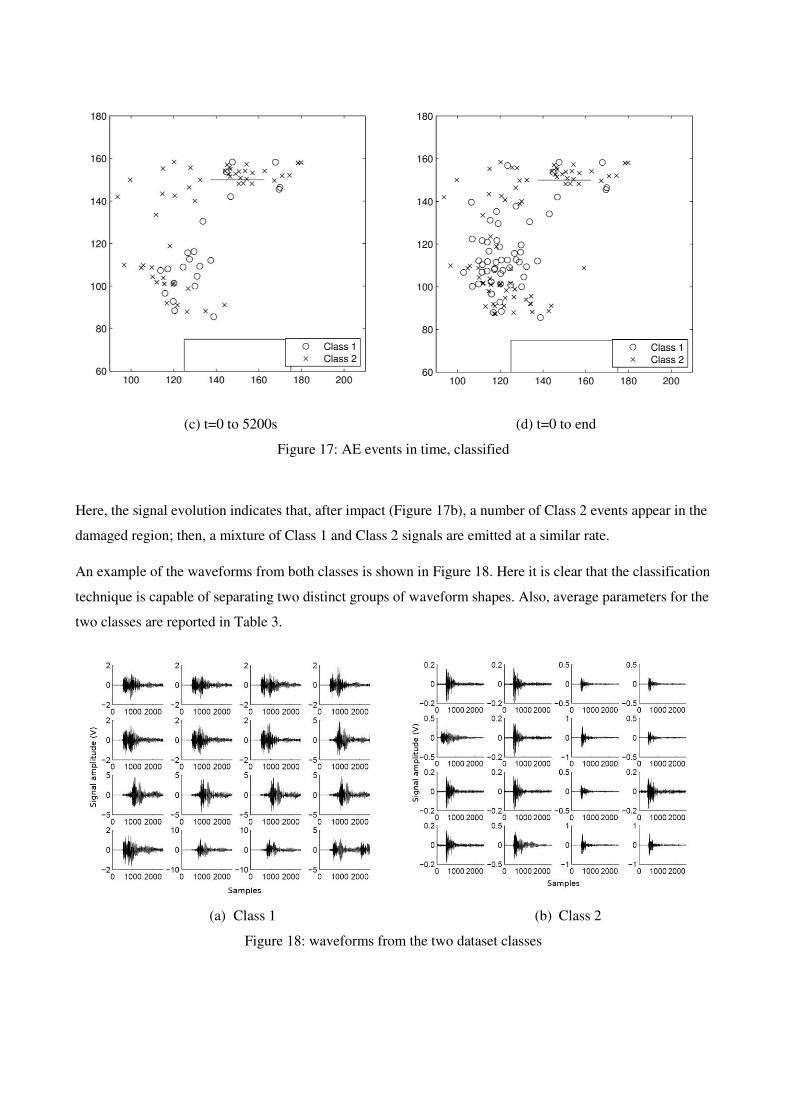
(c) t=0 to 5200s (d) t=0 to end
Figure 17: AE events in time, classified
Here, the signal evolution indicates that, after impact (Figure 17b), a number of Class 2 events appear in the
damaged region; then, a mixture of Class 1 and Class 2 signals are emitted at a similar rate.
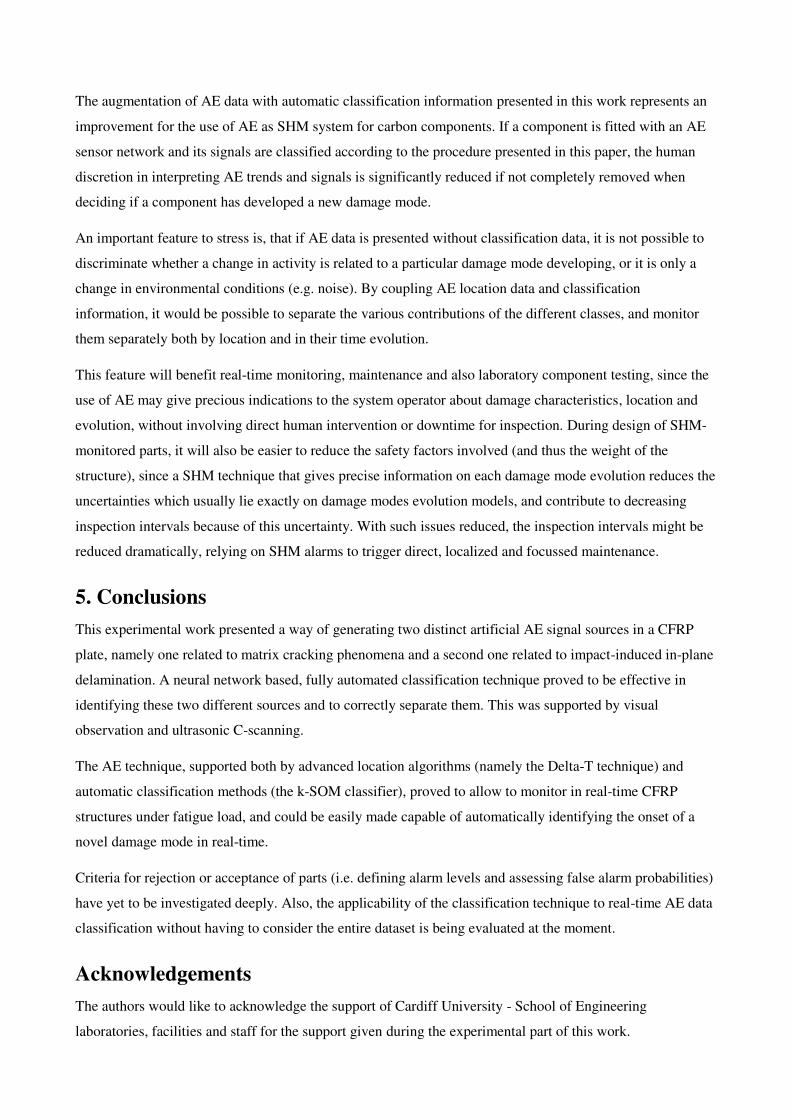
An example of the waveforms from both classes is shown in Figure 18. Here it is clear that the classification
technique is capable of separating two distinct groups of waveform shapes. Also, average parameters for the
two classes are reported in Table 3.
(a) Class 1 (b) Class 2
Figure 18: waveforms from the two dataset classes

Table 3: average parameters for the two classes
Class 1 Class 2
Average Std. deviation Average Std. deviation
CNTS 3 4 85 41
A (dB) 49 3 69 6
E (eu) 89 151 27680 28732
R (µs) 8 20 94 126
D (µs) 25 33 810 504
FCOG (kHz) 263 38 266 59
FMXA (kHz) 224 57 174 77
4. Discussion
The AE results presented in Section 3 provided some key information regarding AE and damage detection in
composites:
Cutting the inner plies allowed the generation of an artificial flaw that favoured matrix cracking;
The artificial crack area showed repeatable sources, as visible from the waveforms;
A delamination induced by an impact becomes an active source of AE;
The delamination source of this experiment contains two distinguishable classes of AE signals;
The delamination source is active from the AE point of view even if the delamination does not grow.
When supported by ANN classification, the failure modes are correctly identified: the pre-impact phase
shows only a single class of signals; when the panel is impacted, a second class appears. It is observed that in
the impact region both delamination and crack signals are found.
The crack class signals seem to be more related to the region normal to the load path (matrix failing in tensile
load); this is supported by the AE signals position relative to the delamination area observed in the C-scan
and by the observation of almost only crack class signals in the cut ply region.
On the other hand, the delamination class signals are distributed in the delamination region, probably
representing delaminated layer friction sources. Although this doesn’t imply delamination growth, it
provides a way to identify the delamination region, which may cause a significant reduction in compressive
strength.
It was also observed that the two classes show repeatable sources, with distinct waveforms and AE
parameters. In particular, matrix cracking sources show higher amplitude and with a relatively quicker decay,
while delamination sources appear more continuous.
The augmentation of AE data with automatic classification information presented in this work represents an
improvement for the use of AE as SHM system for carbon components. If a component is fitted with an AE
sensor network and its signals are classified according to the procedure presented in this paper, the human
discretion in interpreting AE trends and signals is significantly reduced if not completely removed when
deciding if a component has developed a new damage mode.
An important feature to stress is, that if AE data is presented without classification data, it is not possible to
discriminate whether a change in activity is related to a particular damage mode developing, or it is only a
change in environmental conditions (e.g. noise). By coupling AE location data and classification
information, it would be possible to separate the various contributions of the different classes, and monitor
them separately both by location and in their time evolution.
This feature will benefit real-time monitoring, maintenance and also laboratory component testing, since the
use of AE may give precious indications to the system operator about damage characteristics, location and
evolution, without involving direct human intervention or downtime for inspection. During design of SHM-
monitored parts, it will also be easier to reduce the safety factors involved (and thus the weight of the
structure), since a SHM technique that gives precise information on each damage mode evolution reduces the
uncertainties which usually lie exactly on damage modes evolution models, and contribute to decreasing
inspection intervals because of this uncertainty. With such issues reduced, the inspection intervals might be
reduced dramatically, relying on SHM alarms to trigger direct, localized and focussed maintenance.
5. Conclusions
This experimental work presented a way of generating two distinct artificial AE signal sources in a CFRP
plate, namely one related to matrix cracking phenomena and a second one related to impact-induced in-plane
delamination. A neural network based, fully automated classification technique proved to be effective in
identifying these two different sources and to correctly separate them. This was supported by visual
observation and ultrasonic C-scanning.
The AE technique, supported both by advanced location algorithms (namely the Delta-T technique) and
automatic classification methods (the k-SOM classifier), proved to allow to monitor in real-time CFRP
structures under fatigue load, and could be easily made capable of automatically identifying the onset of a
novel damage mode in real-time.
Criteria for rejection or acceptance of parts (i.e. defining alarm levels and assessing false alarm probabilities)
have yet to be investigated deeply. Also, the applicability of the classification technique to real-time AE data
classification without having to consider the entire dataset is being evaluated at the moment.
Acknowledgements
The authors would like to acknowledge the support of Cardiff University - School of Engineering
laboratories, facilities and staff for the support given during the experimental part of this work.
References
[1] Worden K, Farrar CR, Manson G, Park G. The fundamental axioms of structural health monitoring.
Proc R Soc A Math Phys Eng Sci 2007;463:1639–64.
[2] Miller RK, McIntire P. NDT Handbook vol. 5, American Society for Nondestructive Testing; 1987, p.
652.
[3] Finleyson RD. Handbook of Nondestructive Evaluation, McGraw-Hill Companies; 2003, p. 10.1–10.39.
[4] Huang M, Jiang L, Liaw PK, Brooks CR, Seeley R, Klarstrom DL. Using Acoustic Emission in Fatigue and
Fracture Materials Research. JOM 1998;50.
[5] Hamstad MA. Thirty Years of Advances and Some Remaining Challenges in the Application of
Acoustic Emission to Composite Materials. In: Kishi T, Ohtsu M, Yuyama S, editors. Acoust. Emiss.
Beyond Millenn., Elsevier, Oxford, UK; 2000, p. 77–91.
[6] Wang X, Zhang H-P, Yan X. Classification and identification of damage mechanisms in polyethylene
self-reinforced laminates by acoustic emission technique. Polym Compos 2011;32:945–59.
[7] Caruso C, Lonetti P, Manna A. Dynamic Crack Propagation in Fiber Reinforced Composites. Proc.
COMSOL Conf. 2009 Milan, 2009.
[8] Jessen SM, Plumtree A. Fatigue damage accumulation in pultruded glass/polyester rods. Composites
1999;20:559–67.
[9] Ireman T, Ranvik T, Eriksson I. On damage development in mechanically fastened composite
laminates. Compos Struct 2000;49:151–71.
[10] Caprino G, R.Teti, de Iorio I. Predicting residual strength of pre-fatigued glass fibre-reinforced plastic
laminates through acoustic emission monitoring. Compos Part B 2005;36:365–71.
[11] Finleyson RD. Acoustic Emission Testing. Handb. Nondestruct. Eval., McGraw-Hill Companies; 2003.
[12] Baxter MG, Pullin R, Holford KM, Evans SL. Delta T source location for acoustic emission. Mech Syst
Signal Process 2007;21:1512–20.
[13] Eaton MJ, Pullin R, Holford KM. Acoustic emission source location in composite materials using Delta
T Mapping. Compos Part A Appl Sci Manuf 2012;43:856–63.
[14] HSU NN. A mechanical AE simulator for system calibration and waveform analysis. 16th Meet. U.S.
Acoust. Emiss. Work. Gr., Williamsburg, Va, United States: 1976.
[15] Holford KM, Pullin R, Baxter MG. Modal Analysis of Acoustic Emission Signals from Artificial and
Fatigue Crack Sources in Aerospace Grade Steel. Key Eng Mater 2005;293:217–24.
[16] Mal A. Elastic waves from localized sources in composite laminates. Int J Solids Struct 2002;39:5481–94.
[17] Huguet S, Godin N, Gaertner R, Salmon L, Villard D. Use of acoustic emission to identify damage
modes in glass fibre reinforced polyester. Compos Sci Technol 2002;62:1433–44.
[18] Zhuang X, Yan X. Investigation of damage mechanisms in self-reinforced polyethylene composites by
acoustic emission. Compos Sci Technol 2006;66:444–9.
[19] Ramirez-Jimenez CR, Papadakis N, Reynolds N, Gan TH, Purnell P, Pharaoh M. Identification of
failure modes in glass/polypropylene composites by means of the primary frequency content of the
acoustic emission event. Compos Sci Technol 2004;64:1819–27.
[20] Groot PJ De, Wijnen PAM, Janssen RBF. Real-time frequency determination of acoustic emission for
different fracture mechanisms in carbon/epoxy composites. Compos Sci Technol 1995;55:405–12.
[21] Godin N, Gaertner SHR, Salmon L. Clustering of acoustic emission signals collected during tensile
tests on unidirectional glass/polyester composite using supervised and unsupervised classifiers. NDT
E Int 2004;37:253–64.
[22] Refahi Oskouei A, Ahmadi M. Acoustic Emission Characteristics of Mode I Delamination in
Glass/Polyester Composites. J Compos Mater 2010;44:793–807.
[23] Laksimi A, Benmedakhene S, Bounouas L. Monitoring acoustic emission during tensile loading of
thermoplastic composites materials. Proc. ICCM 12 Eur., 1999.
[24] Godin N, Huguet S, Gaertner R. Influence of hydrolytic ageing on the acoustic emission signatures of
damage mechanisms occurring during tensile tests on a polyester composite : Application of a Kohonen’s map. Compos Struct 2006;72:79–85.
[25] Grosse C, Reinhardt H, Dahm T. Localization and classification of fracture types in concrete with
quantitative acoustic emission measurement techniques. NDT E Int 1997;30:223–30.
[26] Leone C, Caprino G, de Iorio I. Interpreting acoustic emission signals by artificial neural networks to
predict the residual strength of pre-fatigued GFRP laminates. Compos Sci Technol 2006;66:233–9.
[27] De Oliveira R, Marques AT. Health monitoring of FRP using acoustic emission and artificial neural
networks. Comput Struct 2008;86:367–73.
[28] Bhat C, Bhat MR, Murthy CRL. Acoustic emission characterization of failure modes in composites
with ANN. Compos Struct 2003;61:213–20.
[29] Sause MGR, Gribov A, Unwin AR, Horn S. Pattern recognition approach to identify natural clusters of
acoustic emission signals. Pattern Recognit Lett 2012;33:17–23.
[30] Crivelli D, Guagliano M, Monici A. Development of an artificial neural network processing technique
for the analysis of damage evolution in pultruded composites with acoustic emission. Compos Part B
2014;56:948–59.