Local Transport Plan Review Proposed Monitoring Indicators
35
Local Transport Plan Review Proposed Monitoring Indicators Version 1.0 Last Revised March 2016 Review Date Category Strategic Planning Owner Ben Watts Target Audience Anyone wishing to know more about the proposals for monitoring the impacts of the LTP
Transcript of Local Transport Plan Review Proposed Monitoring Indicators
Local Transport Plan Review
Proposed Monitoring Indicators
Version 1.0
Last Revised March 2016
Review Date
Category Strategic Planning
Owner Ben Watts
Target Audience Anyone wishing to know more about the proposals for monitoring the impacts of the LTP

GLOUCESTERSHIRE COUNTY COUNCIL
Local Transport Plan Review
Proposed Monitoring Indicators
Contents Amendment Record
This report has been issued as a working document as follows:
Issue Revision Description Date Signed
0.1 1 Initial draft Feb 2016 SW
1.0 1 Final draft Mar 2016 SW

Contents
Introduction ............................................................................................................................................ 1
LTP PI-1 - Journey time reliability on strategic important routes during the AM peak .......................... 2
LTP PI-2 - Number of peak hour vehicle journeys ................................................................................... 5
LTP PI-3 - Reduction in inappropriate freight travel ............................................................................... 7
LTP PI-4 - Principal road network condition ......................................................................................... 10
LTP PI-5 - Non-Principal road network condition ................................................................................. 12
LTP PI-6 - Unclassified road network condition .................................................................................... 14
LTP PI-7 - Increase use of rail ................................................................................................................ 16
LTP PI-8 - Increase use of cycling .......................................................................................................... 18
LTP PI-9 - Increase use of bus................................................................................................................ 20
LTP PI-10 - Maintain bus passenger access ........................................................................................... 22
LTP PI-11 - Reduce the number of highway casualties ......................................................................... 24
LTP PI-12 - Reduce the number of child highway casualties ................................................................ 26
LTP PI-13 - Reduce levels of traffic derived Nitrogen Dioxide .............................................................. 28
LTP PI-14 - Reduce per capita transport carbon emissions .................................................................. 30
Indicator Summary Table ...................................................................................................................... 32

LTP Monitoring Report 2016 v1 Page 1
Introduction
This document identifies the 14 voluntary performance indicators and targets which will be used to assess the impact of Gloucestershire’s Local Transport Plan. The review identifies the policies influenced by each indicator; it outlines what the data is for and why it is important.
The policy document owner and the monitoring officer are also identified for each indicator with a methodology of how data is collected and collated to ensure consistent results. Historic trend data has been used to inform a target for each indicator, the LTP outcomes it will help to assess are also listed.
LTP Implementation Reports will be produced annually to document performance against the LTP monitoring indicators, scheme delivery and any changes in policies. All documents will be published on the GCC website and a document management system used.
A mix of quantitative and qualitative data will be used from existing data sets to minimise cost, while ensuring reliability. Data is collected via a variety of sources and these are identified with each data set.

LTP Monitoring Report 2016 v1 Page 2
LTP PI-1 - Journey time reliability on strategic important routes during the AM peak
Links to monitor impacts of:
LTP Policy Document 3 - Freight
LTP Policy Document 4 – Highways
Policy Document Owner:
Scott Tomkins, Lead Commissioner Highways Authority
Monitoring Officer:
Andy Tonkinson – Senior Asset Data Officer – Highway Assets
What will this indicator show / Why is it important?
Gloucestershire’s Link and Place spectrum characterises the highway network within county depending on its role and function. National and primary links have been identified as being strategically critical for the local economy and therefore journey time reliability is an important factor.
Methodology for collecting the data
The average week day total journey time during the AM peak (08:00-09:00hrs) will be captured for 13 strategic trips within the 8 corridors across the county:
Annual average data will be captured using Trafficmaster data accessed via the web tool Highway Analyst. Trafficmaster is a GPS sourced dataset that is centrally purchased by the Department for Transport and contains millions of GPS links. This data is collated from various sources and linked to

LTP Monitoring Report 2016 v1 Page 3
Ordnance Survey’s ITN (Integrated Transport Network). Trafficmaster data gives an indication towards congestion by using the GPS speeds to work out the speed of traffic on different days and times.
GCC Strategic trips include:
LTP PI 1.1 - Charlton Kings (using A40) to M5 junction 11 LTP PI 1.2 - Churchdown to Kings ditch Retail park (using B4063) LTP PI 1.3 - Coombe Hill to Charlton Kings (using A419 / A46 / A435 / A40) LTP PI 1.4 - Bishop’s Cleeve to Shurdington (using A435 / A46) LTP PI 1.5 - Highnam Court roundabout to Barnwood Business Park (using A40 A417) LTP PI 1.6 - Highnam Court roundabout to M5 junction 12 (using A430 / A38) LTP PI 1.7 - M5 junction 12 to Barnwood Business Park (using A38) LTP PI 1.8 - Gloucester Railway Station to Cheltenham Railway Station (using B4063 / A40 / B44633) LTP PI 1.9 - Teddington Hands roundabout to M5 junction 9 LTP PI 1.10 - A38 Odessa PH junction to M5 junction 9 (using A38 / A438) LTP PI 1.11 - Brimscombe to M5 junction 13 LTP PI 1.12 - Stratton to South Cerney junction on A417 (using A435 / A429 / A419) LTP PI 1.13 -Tetbury to Moreton-Marsh using A433 and A429
Historic trend data
Average weekday journey time 08:00-09:00 M-F (excl. school holidays) in minutes
It is important to maintain journey time reliability. The total journey times will be considered across the 13 routes to provide an average annual journey time variance. This variance will fluctuate across the different routes, but for the purposes of this indicator the average variance across all routes will be recorded.
0.0
10.0
20.0
30.0
40.0
50.0
60.0
PI1.1 PI1.2 PI1.3 PI1.4 PI1.5 PI1.6 PI1.7 PI1.8 PI1.9 PI1.10 PI1.11 PI1.12 PI1.13
Min
ute
s
Route
2012/13 2013/14 2014/15
LTP Monitoring Report 2016 v1 Page 4
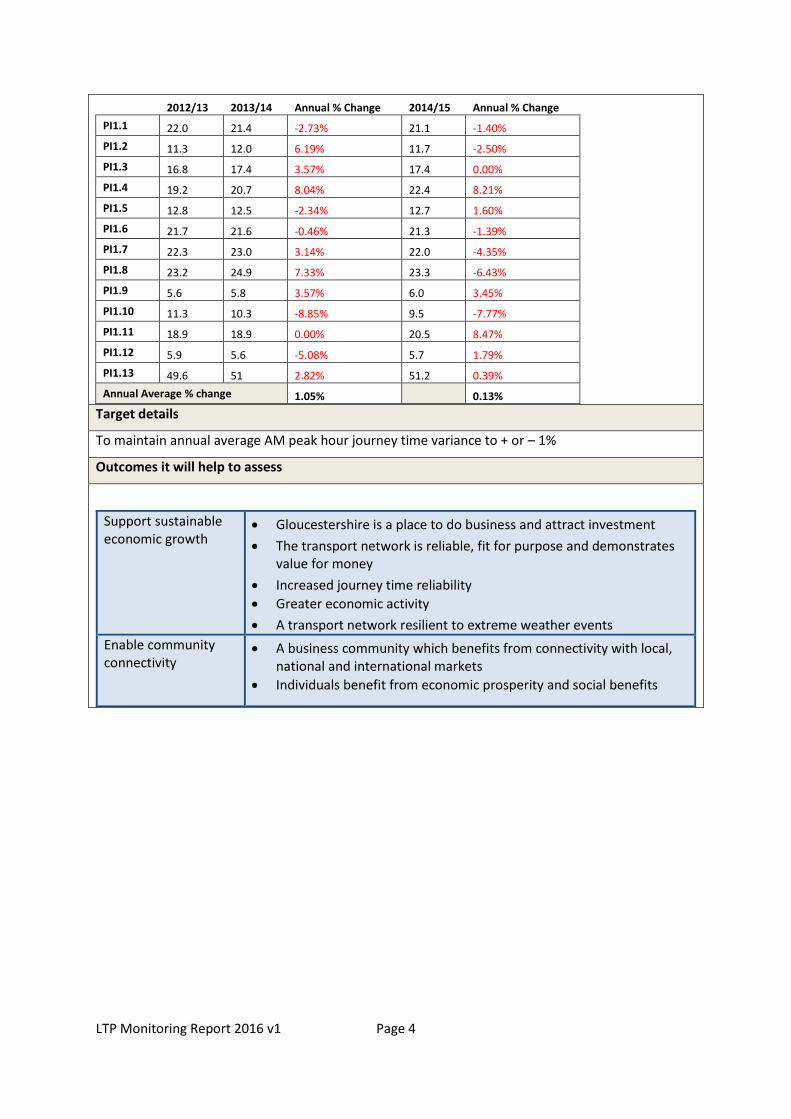
2012/13 2013/14 Annual % Change 2014/15 Annual % Change
PI1.1 22.0 21.4 -2.73% 21.1 -1.40%
PI1.2 11.3 12.0 6.19% 11.7 -2.50%
PI1.3 16.8 17.4 3.57% 17.4 0.00%
PI1.4 19.2 20.7 8.04% 22.4 8.21%
PI1.5 12.8 12.5 -2.34% 12.7 1.60%
PI1.6 21.7 21.6 -0.46% 21.3 -1.39%
PI1.7 22.3 23.0 3.14% 22.0 -4.35%
PI1.8 23.2 24.9 7.33% 23.3 -6.43%
PI1.9 5.6 5.8 3.57% 6.0 3.45%
PI1.10 11.3 10.3 -8.85% 9.5 -7.77%
PI1.11 18.9 18.9 0.00% 20.5 8.47%
PI1.12 5.9 5.6 -5.08% 5.7 1.79%
PI1.13 49.6 51 2.82% 51.2 0.39%
Annual Average % change 1.05% 0.13%
Target details
To maintain annual average AM peak hour journey time variance to + or – 1%
Outcomes it will help to assess
Support sustainable economic growth
Gloucestershire is a place to do business and attract investment
The transport network is reliable, fit for purpose and demonstrates value for money
Increased journey time reliability
Greater economic activity
A transport network resilient to extreme weather events
Enable community connectivity
A business community which benefits from connectivity with local, national and international markets
Individuals benefit from economic prosperity and social benefits

LTP Monitoring Report 2016 v1 Page 5
LTP PI-2 - Number of peak hour vehicle journeys
Links to monitor impacts of:
Outputs from this indicator will assist in understanding the impacts of policies outlined across all policy documents.
Policy Document Owner:
Scott Tomkins, Lead Commissioner Highways Authority
Monitoring Officer:
Andy Tonkinson – Senior Asset Data Officer – Highway Assets
What will this indicator show / Why is it important?
Between 2015 and 2031 Gloucestershire will see unprecedented change in terms of population growth, housing development, its economy and technological advancement. This will result in an increase in travel demand, which will impact the operation of the highway network.
Some of this increase will be mitigated, but not all. Traditionally peak travel periods are between 08:00 and 09:00 and 17:00 and 18:00, but these peak travel periods are likely to change as people alter their journey times to avoid journey delays.
The policies outlined in the LTP seek to manage the transport network to maximise its capacity and it is important to understand how these policies may need to alter during the plan period to maintain a functioning transport network during this time of increased demand.
Methodology for collecting the data
For the purposes of this indicator two-way unclassified vehicle annual average daily traffic (AADT)

LTP Monitoring Report 2016 v1 Page 6
flow data will be captured from 46 sites, which have been selected on strategic routes across the county.
The total number of vehicles recorded between 07:00 to 10:00 and 16:00 to 19:00 will be recorded as a total to represent a single countywide figure.
Historic trend data
2011 2012 2013 2014 2015
AM peak -07:00 to 10:00
123,781 123,847 123,147 126,358 129,241
% Annual change 0.05% -0.57% 2.61% 2.28%
% Change from 2011 0.05% -0.51% 2.08% 4.41%
2011 2012 2013 2014 2015
PM peak – 16:00 to 19:00
125,801 125,555 125,567 128,285 130,546
% Annual change 2.95% 0.40% 2.69% 1.68%
% Change from 2011 2.95% 3.36% 6.13% 7.92%
Target details
To restrict annual growth in the number peak demand vehicle journeys to 1% per annum
Outcomes it will help to assess
Support sustainable economic growth
The transport network is reliable, fit for purpose and demonstrates value for money
Increased journey time reliability
Greater economic activity
Enable community connectivity
A business community which benefits from connectivity with local, national and international markets
Individuals benefit from economic prosperity and social benefits
Conserve the environment
A reduction in solo car use, and an increased uptake of sustainable transport modes (walking, cycling and public transport)
Improve community health and well being
Less car trips resulting in fewer journey delays
Increased number of walking and cycling trips
Improved air quality
A healthy more active population (addressing obesity and associated conditions)
Better safety, security and health by reducing the risk of death, injury or illness arising from transport
LTP Monitoring Report 2016 v1 Page 7
LTP PI-3 - Reduction in inappropriate freight travel
Links to monitor impacts of:
LTP Policy Document 3 - Freight
LTP Policy Document 4 – Highways
Policy Document Owner:
Scott Tomkins, Lead Commissioner Highways Authority
Monitoring Officer:
Andy Tonkinson – Senior Asset Data Officer – Highway Assets
What will this indicator show / Why is it important?
Goods need to transported on time and at the most efficient cost, but managed in a ‘place-sensitive’ manner. The efficient movement of highway freight is a key component of a healthy economy, but this needs to be balanced against community concerns regarding inappropriate or unsuitable route choices made by hauliers.
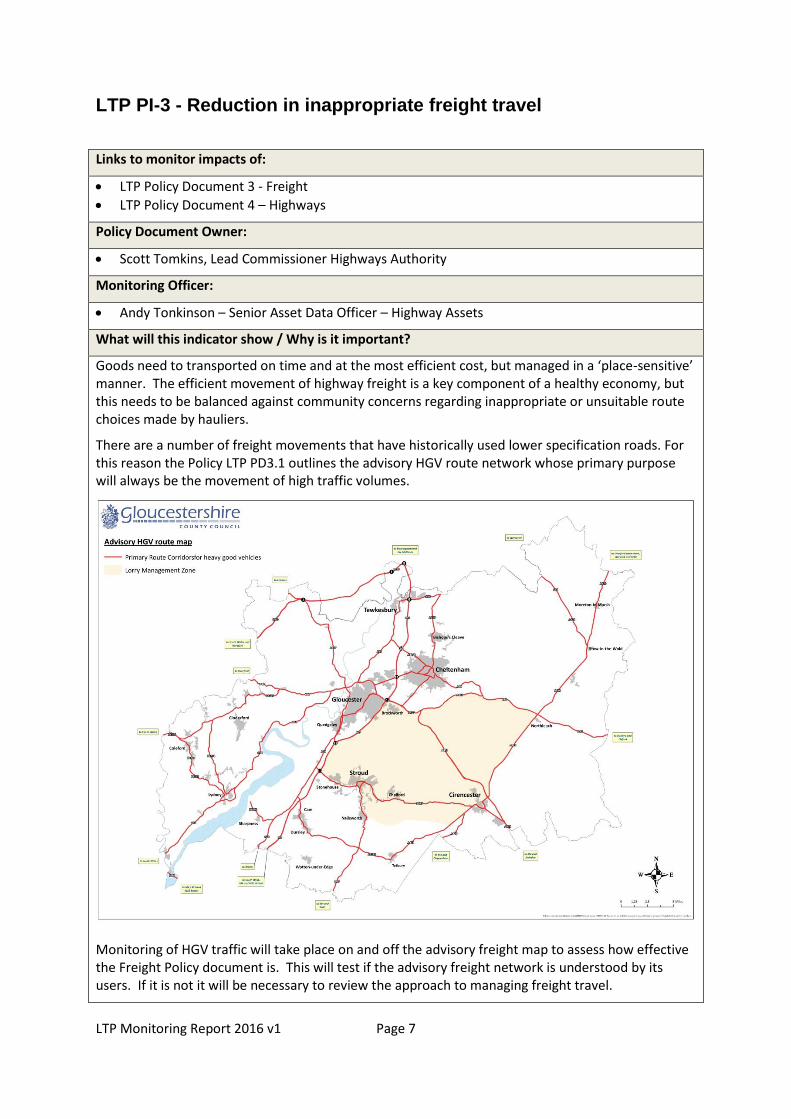
There are a number of freight movements that have historically used lower specification roads. For this reason the Policy LTP PD3.1 outlines the advisory HGV route network whose primary purpose will always be the movement of high traffic volumes.
Monitoring of HGV traffic will take place on and off the advisory freight map to assess how effective the Freight Policy document is. This will test if the advisory freight network is understood by its users. If it is not it will be necessary to review the approach to managing freight travel.

LTP Monitoring Report 2016 v1 Page 8
Methodology for collecting the data
Annual average daily classified vehicle flow data will be collected at 31 sites across the county. The map provided identifies the location of these monitoring sites. 24 of the sites are classified as being ‘appropriate’ (red sites) as they are located on the advisory GHV network and 7 sites are classified as being ‘non appropriate’ (blue sites) as they do not feature on the advisory route map and are known to have issues with HGV traffic.
Historic trend data
Data from the individual sites will be provided within our Annual Implementation Plan, but for the purposes of this document only the annual average figure will be provided.
% of HGV traffic as a total of annual average vehicle movements
2011 2012 2013 2014 2015
Using HGV appropriate routes
6.4% 6.3% 6.2% 5.9% 5.8%
Using HGV non-appropriate routes
6.2% 6.8% 7.1% 7.4% 7.3%
It should be noted that at the time of writing two of the non-appropriate monitoring sites require upgrading to enable full classified vehicle data to be extracted.
Target details
To maintain the % of HGV traffic on inappropriate roads to less than 5%
Outcomes it will help to assess
Support sustainable economic growth
Gloucestershire is a place to do business and attract investment
The transport network is reliable, fit for purpose and demonstrates value for money
LTP Monitoring Report 2016 v1 Page 9
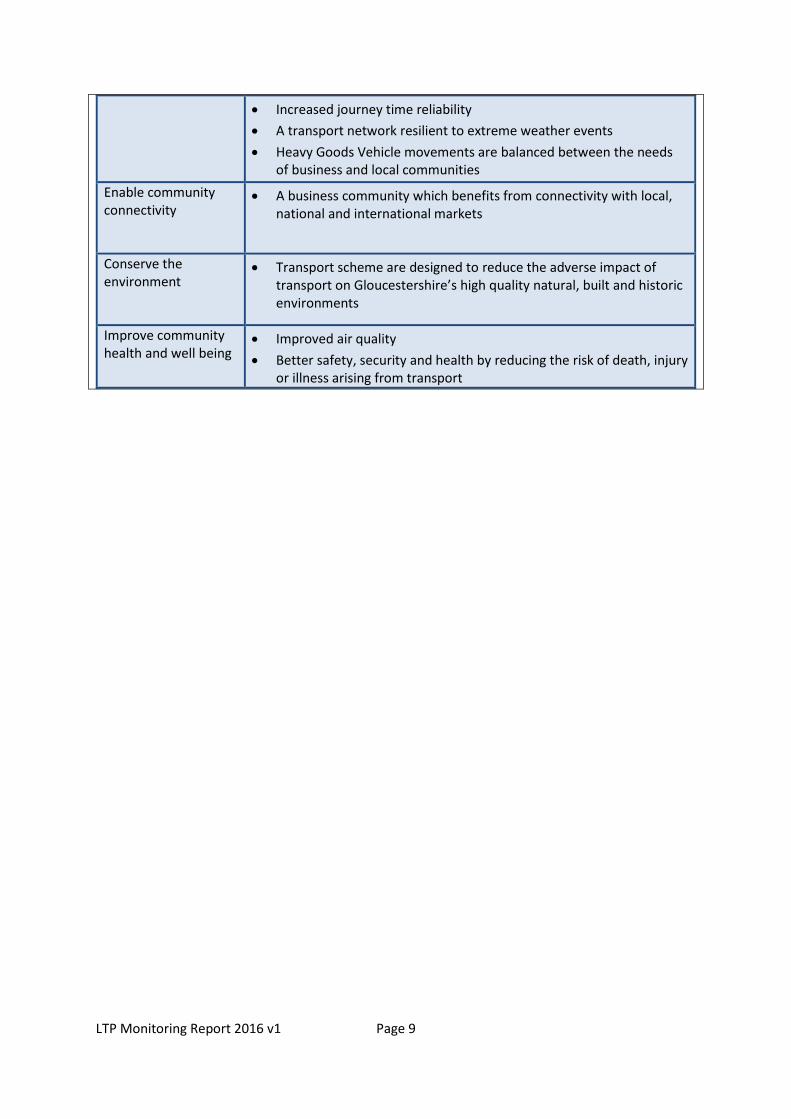
Increased journey time reliability
A transport network resilient to extreme weather events
Heavy Goods Vehicle movements are balanced between the needs of business and local communities
Enable community connectivity
A business community which benefits from connectivity with local, national and international markets
Conserve the environment
Transport scheme are designed to reduce the adverse impact of transport on Gloucestershire’s high quality natural, built and historic environments
Improve community health and well being
Improved air quality
Better safety, security and health by reducing the risk of death, injury or illness arising from transport
LTP Monitoring Report 2016 v1 Page 10
LTP PI-4 - Principal road network condition
Links to monitor impacts of:
PD3 – Freight
PD4 – Highways
Policy Document Owner:
Scott Tomkins, Lead Commissioner Highways Authority
Monitoring Officer:
Andy Tonkinson – Senior Asset Data Officer – Highway Assets
What will this indicator show / Why is it important?
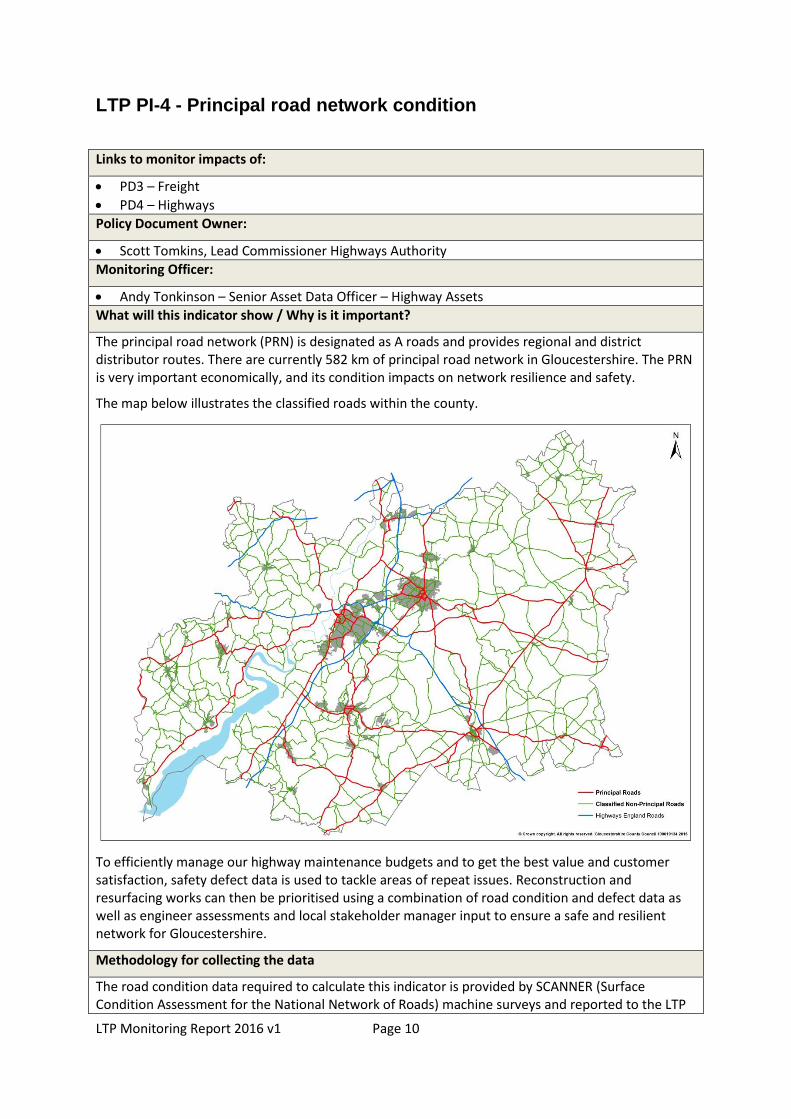
The principal road network (PRN) is designated as A roads and provides regional and district distributor routes. There are currently 582 km of principal road network in Gloucestershire. The PRN is very important economically, and its condition impacts on network resilience and safety.
The map below illustrates the classified roads within the county.
To efficiently manage our highway maintenance budgets and to get the best value and customer satisfaction, safety defect data is used to tackle areas of repeat issues. Reconstruction and resurfacing works can then be prioritised using a combination of road condition and defect data as well as engineer assessments and local stakeholder manager input to ensure a safe and resilient network for Gloucestershire.
Methodology for collecting the data
The road condition data required to calculate this indicator is provided by SCANNER (Surface Condition Assessment for the National Network of Roads) machine surveys and reported to the LTP

LTP Monitoring Report 2016 v1 Page 11
by Network and Traffic Management. In line with DfT guidance, 50% of the principal road network is surveyed in both directions, every year. The indicator is calculated on data collected over a two year period to ensure the whole network is considered. This indicator forms part of the single line data listing submission to central government (130-01) and is reported to the nearest whole number. The current structural maintenance strategy is to allocate sufficient capital funding to principal roads in order to maintain the current condition. Recent investment levels have managed to achieve this objective and even realise a slight improvement.
Historic trend data
Target details
Maintain the percentage of principal road network requiring maintenance at or below 4%
Outcomes it will help to assess
Support sustainable economic growth
A transport network resilient to extreme weather events
Heavy Goods Vehicle movements are balanced between the needs of business and local communities
A thriving tourist industry which benefits from ease of access to the county’s natural, built and historic environmental assets
Enable community connectivity
A business community which benefits from connectivity with local, national and international markets
Improve community health and well being
Better safety, security and health by reducing the risk of death, injury or illness arising from transport
2010/11 2011/12 2012/13 2013/14 2014/15 2015/16
Results 4 4 3 4 3 2
0
1
2
3
4
5
Pe
rce
nta
ge (
%)
Percentage of principal network where maintenance should be considered
Results Trend

LTP Monitoring Report 2016 v1 Page 12
LTP PI-5 - Non-Principal road network condition
Links to monitor impacts of:
PD3 – Freight
PD4 – Highways
Policy Document Owner:
Scott Tomkins, Lead Commissioner Highways Authority
Monitoring Officer:
Andy Tonkinson – Senior Asset Data Officer – Highway Assets
What will this indicator show / Why is it important?
This indicator shows the condition of the non-principal, classified road network. Non-principal roads are designated as B and C roads. In Gloucestershire there are 1966 km of classified non-principal road - B roads account for 407 km and 1559 km are C roads. These are main and secondary distributor routes, linking urban centres, larger villages and HGV generators to the strategic network. Preserving the condition of these routes ensures access and journey times are maintained to into key service areas for health, education, retail and employment.
The map below illustrates the classified roads within the county.
Methodology for collecting the data
The road condition data required to calculate this indicator is provided by SCANNER (Surface Condition Assessment for the National Network of Roads) machine surveys and reported to the LTP by Network and Traffic Management. The indicator is calculated on data collected over a two year period. In line with DfT guidance, half of the B road network is surveyed in both directions, every

LTP Monitoring Report 2016 v1 Page 13
year. Half of the C road network is also surveyed in both directions and though this is more than the national requirement, it ensures the whole network is considered in the calculation. This indicator forms part of the single line data listing submission to central government (130-02) and is reported to the nearest whole number. The current structural maintenance strategy is to allocate sufficient capital funding to classified non-principal roads in order to maintain the current condition. Recent investment levels have managed to achieve this objective and even realise a slight improvement. (Ref M7)
Historic trend data
Target details
Maintain the percentage of non-principal classified road network where maintenance should be considered at or below 9%
Outcomes it will help to assess
Support sustainable economic growth
A transport network resilient to extreme weather events
Heavy Goods Vehicle movements are balanced between the needs of business and local communities
A thriving tourist industry which benefits from ease of access to the county’s natural, built and historic environmental assets
Enable community connectivity
A business community which benefits from connectivity with local, national and international markets
Improve community health and well being
Better safety, security and health by reducing the risk of death, injury or illness arising from transport
2010/11 2011/12 2012/13 2013/14 2014/15 2015/16
Results 9 9 8 7 6 4
0
2
4
6
8
10
12
Pe
rce
nta
ge (
%)
Percentage of classified non-principal network where maintenance should be considered
Results Trend

LTP Monitoring Report 2016 v1 Page 14
LTP PI-6 - Unclassified road network condition
Links to monitor impacts of:
PD3 – Freight
PD4 – Highways
Policy Document Owner:
Scott Tomkins, Lead Commissioner Highways Authority
Monitoring Officer:
Andy Tonkinson – Senior Asset Data Officer – Highway Assets
What will this indicator show / Why is it important?
The majority of the adopted highway network is comprised of unclassified roads. In Gloucestershire this amounts to 2935 km of network.
This indicator will monitor the condition of these roads, which in rural areas can link smaller villages to the distributor roads, serve small settlements and provide access to individual properties and land. In urban areas they are residential or industrial interconnecting roads, residential loop roads or cul-de-sacs. These are fundamental to any business or resident accessing the transport network for any means.
The map below illustrates the classified and unclassified roads within the county.
Methodology for collecting the data
There is no longer a national requirement to declare the condition of unclassified roads however this part of the network still serves an important function and amounts to over 50% of all roads in

LTP Monitoring Report 2016 v1 Page 15
Gloucestershire.
Up until 2014/15, unclassified road condition was determined by processing coarse visual inspection data (CVI) to calculate the old BVPI national indicator - 224b. We are now undertaking surveys on this network by using an MRM vehicle (Multifunction Road Monitor) which uses technologies developed for the SCANNER vehicles.
The County has been split into three geographical areas, and one of these areas will be surveyed every year. An indicator has been developed in conjunction with other South West highway authority’s that uses defect threshold values which are more appropriate to roads of this type. This indicator is calculated on data collected over a three year period to ensure the condition of the whole network is considered.
Due to the nature of this network some very minor roads will not be able to be surveyed by this method. Roads such as this will have their serviceability and condition monitored by routine highway safety inspections. We have currently surveyed ⅔ of this network so a figure assessing the whole of the surveyed network will not be declared until 2016/17.
Historic trend data
Target details
Maintain the percentage of unclassified road network where maintenance should be considered at or below 18% (BVPI 224B Ref M7)
Outcomes it will help to assess
Support sustainable economic growth
A transport network resilient to extreme weather events
A thriving tourist industry which benefits from ease of access to the county’s natural, built and historic environmental assets
Enable community connectivity
A business community which benefits from connectivity with local, national and international markets
Improve community health and well being
Better safety, security and health by reducing the risk of death, injury or illness arising from transport
2010/11 2011/12 2012/13 2013/14 2014/15 2015/16
Results 17 17 16 14 15 13
0
2
4
6
8
10
12
14
16
18
20
Pe
rce
nta
ge (
%)
Percentage of unclassified road network where maintenance should be considered
2010/11 2011/12 2012/13 2013/14 2014/15 2015/16
New method of measurement for 2015/16

LTP Monitoring Report 2016 v1 Page 16
LTP PI-7 - Increase use of rail
Links to monitor impacts of:
PD5 – Rail
PD6 – Thinktravel
Policy Document Owner:
Simon Excell, Lead Commissioner Strategic Infrastructure
Monitoring Officer:
Ben Watts – Senior Planning Officer
What will this indicator show / Why is it important?
This indicator shows rail station usage across the county. Rail use is important to economic sustainability by ensuring connectivity and reliable travel times to access employment and services. Rail is also a low emission active travel alternative to car use.
Methodology for collecting the data
This target is informed by data collected for the Office of Rail Regulation (www.orr.gov.uk). This data is released annually around December. Based on ticket sales, rail station entry and exit data has been used to create an estimate of the number of journeys at each rail station in Gloucestershire over 12 month periods.
Historic trend data
Station Name Entry / exit data
2010/11 2011/12 2012/13 2013/14 2014/15
Ashchurch 68,964 74,168 76,386 83,840 87,384
Cam & Dursley 153,102 162,992 166,870 177,094 185,504
Cheltenham Spa 1,727,246 1,816,020 1,891,974 1,924,750 2,038,404
Gloucester 1,216,730 1,251,678 1,303,750 1,314,800 1,364,142
Kemble 340,536 361,568 356,268 340,766 356,078
Lydney 149,860 156,648 158,702 172,260 192,032
Moreton-In-Marsh 195,878 203,082 209,238 217,032 237,198
4,000,000
4,200,000
4,400,000
4,600,000
4,800,000
5,000,000
5,200,000
2010/11 2011/12 2012/13 2013/14 2014/15
County Rail Station Usage
County Rail Station Usage Linear (County Rail Station Usage)

LTP Monitoring Report 2016 v1 Page 17
Stonehouse 129,498 137,104 146,856 140,848 148,380
Stroud 448,272 465,698 485,428 464,842 490,546
Gloucestershire 4,430,086 4,628,958 4,795,472 4,836,232 5,099,668
Target details
To increase rail use within the county by 30% from 2015 to 2031.
Outcomes it will help to assess
Support sustainable economic growth
Gloucestershire is a place to do business and attract investment
The transport network is reliable, fit for purpose and demonstrates value for money
Greater economic activity
Increased footfall in retail areas
A transport network resilient to extreme weather events
A thriving tourist industry which benefits from ease of access to the county’s natural, built and historic environmental assets
Enable community connectivity
A business community which benefits from connectivity with local, national and international markets
Individuals benefit from economic prosperity and social benefits
A financially sustainable passenger transport network.
An integrated transport network which provides genuine transport choices
A transport network which provides individuals with the confidence to consider all travel choices
Conserve the environment
Reduced transport derived carbon emissions
A reduction in solo car use, and an increased uptake of sustainable transport modes (walking, cycling and public transport)
Transport scheme are designed to reduce the adverse impact of transport on Gloucestershire’s high quality natural, built and historic environments
Improve community health and well being
Less car trips resulting in fewer journey delays

LTP Monitoring Report 2016 v1 Page 18
LTP PI-8 - Increase use of cycling
Links to monitor impacts of:
PD2 – Cycle
PD6 – Thinktravel
Policy Document Owner:
Simon Excell, Lead Commissioner Strategic Infrastructure
Monitoring Officer:
Andy Tonkinson – Senior Asset Data Officer – Highway Assets
What will this indicator show / Why is it important?
This indicator shows 24 hour 7 day average daily flow, based on all months of the year across Gloucestershire. Cycling levels are important indicators of active and sustainable travel which benefit the local environment, health and the economy.
Methodology for collecting the data
Gloucestershire currently has 15 automatic cycle counters installed on various cycle routes (shown overleaf). Investment has been made to allow data to be collected continuously since 2010, to allow the calculation of more robust figures.
Historic trend data
Location 2007 2008 2009 2010 2011 2012 2013 2014
Nr Stn Rd Milkwall (Cyc) 24 20 30 24 25 19 23 22
Cannop (Cyc) 72 48 84 87 84 97 148 197
Cheltenham Rd East (Cyc) 227 239 272 286 292 236 239 264
Metz Way West (Cyc) 211 209 201 181 212 223 233 239
St Catherine St (Cyc) 72 91 115 117 99 92 83 74
Trier Way Glos (Cyc) 181 166 174 167 174 168 170 176
Nailsworth Cyc Trk (Cyc) 94 81 88 78 75 75 63 59
Ebley Bypass Strd (Cyc) 41 42 70 70 56 60 62 60
94
96
98
100
102
104
106
2007 2008 2009 2010 2011 2012 2013 2014
Annualised index of countywide cycle use since 2007

LTP Monitoring Report 2016 v1 Page 19
Lansdown Rd Chelt (Cyc) 175 282 279 277 287 288 281 284
P.E. Way Chelt (Cyc) (Bc) 146 138 125 125 130 130 134 151
Henrietta St (Cyc) (Bc) 83 63 90 97 100 113 90 83
Sandford Park (Cyc) (Bc) 227 217 194 190 223 246 241 247
Ashchurch Rd, Twks (Cyc) 426 413 384 302 319 331 298 302
Honeybourne Line Ne Malvern Rd (Cyc) (Bc)
359 485 385 305 356 375 388 456
Glos Rd, Ciren 116 102 110 95 60 40 54 59
Total 4461 4604 4610 4411 4503 4505 4520 4687
Percentage change from 2007 3.21% 3.24% -1.08% 0.95% 0.98% 1.31% 5.00%
Annualised index from 2007 base year
100 103.2 103.24 98.92 100.95 100.98 101.31 105
Target details
To increase cycle use within the county by 50% from 2015 to 2031.
Outcomes it will help to assess
Objective Expected Outcomes
Support sustainable economic growth
The transport network is reliable, fit for purpose and demonstrates value for money
A transport network resilient to extreme weather events
A thriving tourist industry which benefits from ease of access to the county’s natural, built and historic environmental assets
Enable community connectivity
Individuals benefit from economic prosperity and social benefits
Reduced risk of social isolation
An integrated transport network which provides genuine transport choices
A transport network which provides individuals with the confidence to consider all travel choices
Conserve the environment
Reduced transport derived carbon emissions
A reduction in solo car use, and an increased uptake of sustainable transport modes (walking, cycling and public transport)
Transport scheme are designed to reduce the adverse impact of transport on Gloucestershire’s high quality natural, built and historic environments
Improve community health and well being
Less car trips resulting in fewer journey delays
Increased number of walking and cycling trips
Improved air quality
A healthy more active population (addressing obesity and associated conditions)
Better safety, security and health by reducing the risk of death, injury or illness arising from transport

LTP Monitoring Report 2016 v1 Page 20
LTP PI-9 - Increase use of bus
Links to monitor impacts of:
PD1 – Bus
PD6 – Thinktravel
Policy Document Owner:
Philip Williams, Lead Commissioner Community Infrastructure
Monitoring Officer:
Passenger Transport Manager
What will this indicator show / Why is it important?
This indicator shows the actual number of journeys made on bus services running throughout the county. It covers both commercially provided and subsidised bus services and is therefore vulnerable to both economic trading conditions and the Council policy towards accessibility when considering whether or not to provide financial support for transport services that bus companies can no longer afford to run.
Methodology for collecting the data
Transport providers collect passenger data recorded predominantly via electronic ticket machines and smart readers which inform this report.
Historic trend data
2011/12 2012/13 2013/14 2014/15
Bus Passenger numbers 4,959,876 4,790,389 4,477,953 4,462,493
Target 4,687,387 4,959,876 4,220,000 4,500,000
Target details
Maintain number of bus passenger journeys (PUT 01)
Outcomes it will help to assess
4,000,000
4,200,000
4,400,000
4,600,000
4,800,000
5,000,000
5,200,000
2011/12 2012/13 2013/14 2014/15
Bus passenger numbers
Actual Trend

LTP Monitoring Report 2016 v1 Page 21
Objective Expected Outcomes
Support sustainable economic growth
The transport network is reliable, fit for purpose and demonstrates value for money
Increased journey time reliability
Greater economic activity
Increased footfall in retail areas
A transport network resilient to extreme weather events
A thriving tourist industry which benefits from ease of access to the county’s natural, built and historic environmental assets
Enable community connectivity
A business community which benefits from connectivity with local, national and international markets
Individuals benefit from economic prosperity and social benefits
A financially sustainable passenger transport network.
Reduced risk of social isolation
An integrated transport network which provides genuine transport choices
A transport network which provides individuals with the confidence to consider all travel choices
Conserve the environment
Reduced transport derived carbon emissions
A reduction in solo car use, and an increased uptake of sustainable transport modes (walking, cycling and public transport)
Transport scheme are designed to reduce the adverse impact of transport on Gloucestershire’s high quality natural, built and historic environments
Improve community health and well being
Less car trips resulting in fewer journey delays
Increased number of walking and cycling trips
Improved air quality
A healthy more active population (addressing obesity and associated conditions)
Better safety, security and health by reducing the risk of death, injury or illness arising from transport
LTP Monitoring Report 2016 v1 Page 22
LTP PI-10 - Maintain bus passenger access
Links to monitor impacts of:
PD1 – Bus
PD6 – Thinktravel
Policy Document Owner:
Philip Williams, Lead Commissioner Community Infrastructure
Monitoring Officer:
Passenger Transport Manager
What will this indicator show / Why is it important?
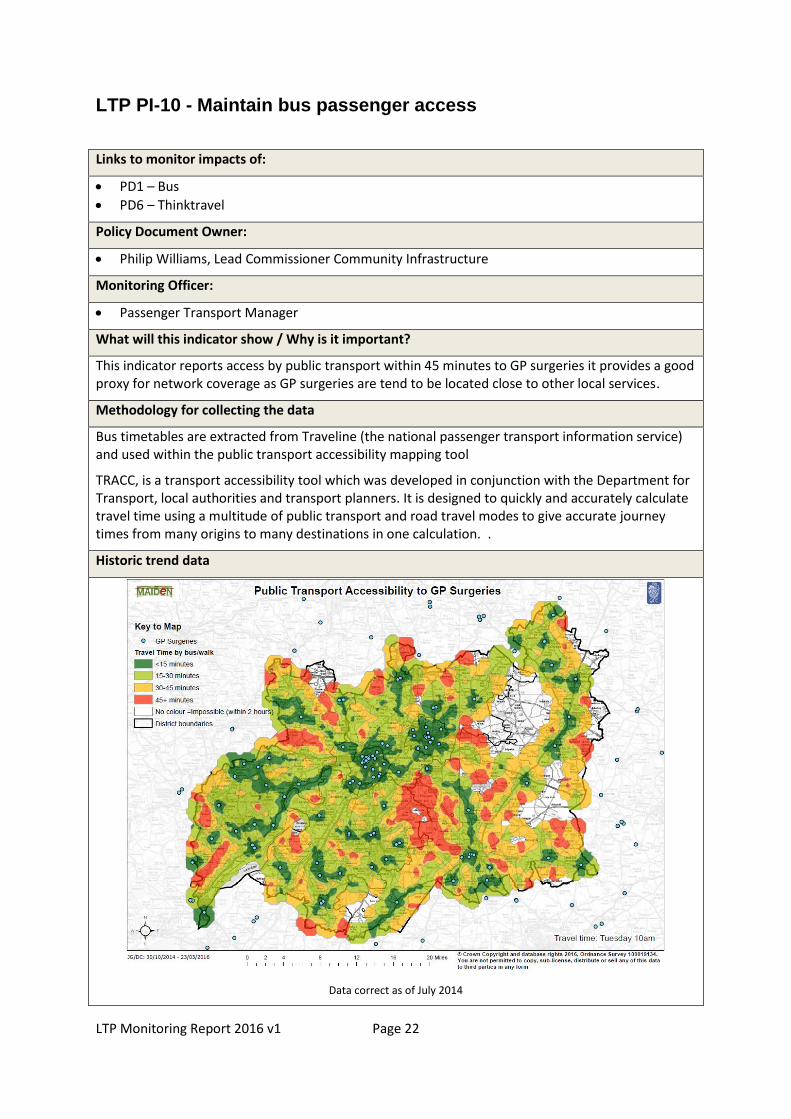
This indicator reports access by public transport within 45 minutes to GP surgeries it provides a good proxy for network coverage as GP surgeries are tend to be located close to other local services.
Methodology for collecting the data
Bus timetables are extracted from Traveline (the national passenger transport information service) and used within the public transport accessibility mapping tool
TRACC, is a transport accessibility tool which was developed in conjunction with the Department for Transport, local authorities and transport planners. It is designed to quickly and accurately calculate travel time using a multitude of public transport and road travel modes to give accurate journey times from many origins to many destinations in one calculation. .
Historic trend data
Data correct as of July 2014

LTP Monitoring Report 2016 v1 Page 23
2011/12 2012/13 2013/14 2014/15
Access 95.60% 96.10% 96.10% 96.10%
Target 92.00% 94.00% 94.00% 95.50%
Target details
Maintain level of Access to GP services and facilities by public transport within 45 minutes (PUT 08a)
Outcomes it will help to assess
Objective Expected Outcomes
Support sustainable economic growth
Increased footfall in retail areas
Enable community connectivity
A financially sustainable passenger transport network.
Reduced risk of social isolation
An integrated transport network which provides genuine transport choices
A transport network which provides individuals with the confidence to consider all travel choices
Conserve the environment
Reduced transport derived carbon emissions
A reduction in solo car use, and an increased uptake of sustainable transport modes (walking, cycling and public transport)
Improve community health and well being
Less car trips resulting in fewer journey delays
Increased number of walking and cycling trips
Improved air quality
A healthy more active population (addressing obesity and associated conditions)
95.20%
95.40%
95.60%
95.80%
96.00%
96.20%
96.40%
2011/12 2012/13 2013/14 2014/15
Access to GP services and facilities by Public Transport
Actual Trend

LTP Monitoring Report 2016 v1 Page 24
LTP PI-11 - Reduce the number of highway casualties
Links to monitor impacts of:
PD4 – Highways
Policy Document Owner:
Scott Tomkins, Lead Commissioner Highways Authority
Monitoring Officer:
Andrew Parker-Mowbray – Accident Investigation and Prevention
What will this indicator show / Why is it important?
Gloucestershire has adopted the national aspiration for a 40% reduction (from the 2005-2009 average) in the number of Killed or Serious injuries (KSI) in the 10 year period to 2020. This would aim to reduce annual casualties from an average of 259 to 104. Local reporting will remain focussed on the actual numbers of KSI casualties rather than introducing rates.
Methodology for collecting the data
This data is collated by the Road Safety Partnership. The multi-agency Partnership brings together officers from Gloucestershire County Council’s Road Safety Team, Fire and Rescue Service, Gloucestershire Constabulary, as well as officers from Gloucestershire Highways
Historic trend data
2001-04 2002-05 2003-06 2004-07 2005-08 2006-09 2007-10 2008-11 2009-12 2010-13 2011-14
4 year rolling average
339 308 291 269 265 257 236 233 231 225 234
Target details
40% reduction (from the 2005-2009 average) in the number of Killed or Serious injuries (KSI) on the highway by 2020
Outcomes it will help to assess
Objective Expected Outcomes
0
50
100
150
200
250
300
350
400
Killed & Seriously Injured Casualties
4 year rolling average Trend

LTP Monitoring Report 2016 v1 Page 25
Support sustainable economic growth
The transport network is reliable, fit for purpose and demonstrates value for money
A transport network resilient to extreme weather events
Heavy Goods Vehicle movements are balanced between the needs of business and local communities
A thriving tourist industry which benefits from ease of access to the county’s natural, built and historic environmental assets
Conserve the environment
Transport scheme are designed to reduce the adverse impact of transport on Gloucestershire’s high quality natural, built and historic environments
Improve community health and well being
Better safety, security and health by reducing the risk of death, injury or illness arising from transport

LTP Monitoring Report 2016 v1 Page 26
LTP PI-12 - Reduce the number of child highway casualties
Links to monitor impacts of:
PD4 – Highways
Policy Document Owner:
Scott Tomkins, Lead Commissioner Highways Authority
Monitoring Officer:
Andrew Parker-Mowbray – Accident Investigation and Prevention Team
What will this indicator show / Why is it important?
Gloucestershire has adopted the national aspiration for a 40% reduction (from the 2005-2009 average) in the number of Killed or Serious injuries (KSI) in the 10 year period to 2020. This would aim to reduce annual child casualties from an average of 19 to 8. Local reporting will remain focussed on the actual numbers of KSI casualties rather than introducing rates.
Research since the formation of the Partnership shows that young car occupants and vulnerable road users remain key target groups. Data is used to drive and focus work and maximise opportunities for casualty reduction.
Methodology for collecting the data
This data is collated by the Road Safety Partnership. The multi-agency Partnership brings together officers from Gloucestershire County Council’s Road Safety Team, Fire and Rescue Service, Gloucestershire Constabulary, as well as officers from Gloucestershire Highways
Historic trend data
2001-04 2002-05 2003-06 2004-07 2005-08 2006-09 2007-10 2008-11 2009-12 2010-13 2011-14
4 year rolling average
26 22 20 17 19 18 16 18 15 15 16
Target details
40% reduction (from the 2005-2009 average) in the number of children Killed or Serious injuries (KSI) on the highway by 2020
0
5
10
15
20
25
30
Child Highway Casualties
4 year rolling average Trend
LTP Monitoring Report 2016 v1 Page 27
Outcomes it will help to assess
Objective Expected Outcomes
Support sustainable economic growth
The transport network is reliable, fit for purpose and demonstrates value for money
A transport network resilient to extreme weather events
Heavy Goods Vehicle movements are balanced between the needs of business and local communities
A thriving tourist industry which benefits from ease of access to the county’s natural, built and historic environmental assets
Conserve the environment
Transport scheme are designed to reduce the adverse impact of transport on Gloucestershire’s high quality natural, built and historic environments
Improve community health and well being
Better safety, security and health by reducing the risk of death, injury or illness arising from transport
LTP Monitoring Report 2016 v1 Page 28
LTP PI-13 - Reduce levels of traffic derived Nitrogen Dioxide
Links to monitor impacts of:
Outputs from this indicator will assist in understanding the impacts of policies outlined across all policy documents.
Policy Document Owner:
Simon Excell, Lead Commissioner Strategic Infrastructure
Monitoring Officer:
Ben Watts – Senior Planning Officer
What will this indicator show / Why is it important?
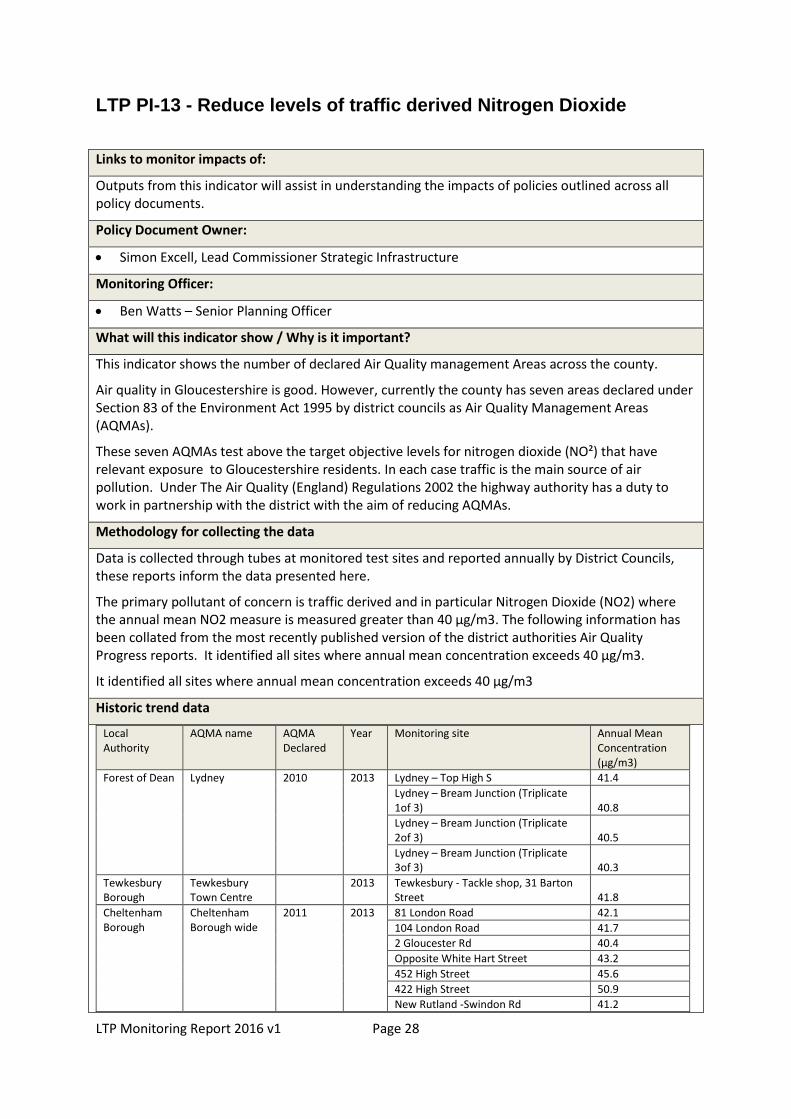
This indicator shows the number of declared Air Quality management Areas across the county.
Air quality in Gloucestershire is good. However, currently the county has seven areas declared under Section 83 of the Environment Act 1995 by district councils as Air Quality Management Areas (AQMAs).
These seven AQMAs test above the target objective levels for nitrogen dioxide (NO²) that have relevant exposure to Gloucestershire residents. In each case traffic is the main source of air pollution. Under The Air Quality (England) Regulations 2002 the highway authority has a duty to work in partnership with the district with the aim of reducing AQMAs.
Methodology for collecting the data
Data is collected through tubes at monitored test sites and reported annually by District Councils, these reports inform the data presented here.
The primary pollutant of concern is traffic derived and in particular Nitrogen Dioxide (NO2) where the annual mean NO2 measure is measured greater than 40 μg/m3. The following information has been collated from the most recently published version of the district authorities Air Quality Progress reports. It identified all sites where annual mean concentration exceeds 40 μg/m3.
It identified all sites where annual mean concentration exceeds 40 μg/m3
Historic trend data
Local Authority
AQMA name AQMA Declared
Year Monitoring site Annual Mean Concentration (μg/m3)
Forest of Dean Lydney 2010 2013 Lydney – Top High S 41.4
Lydney – Bream Junction (Triplicate 1of 3) 40.8
Lydney – Bream Junction (Triplicate 2of 3) 40.5
Lydney – Bream Junction (Triplicate 3of 3) 40.3
Tewkesbury Borough
Tewkesbury Town Centre
2013 Tewkesbury - Tackle shop, 31 Barton Street 41.8
Cheltenham Borough
Cheltenham Borough wide
2011 2013 81 London Road 42.1
104 London Road 41.7
2 Gloucester Rd 40.4
Opposite White Hart Street 43.2
452 High Street 45.6
422 High Street 50.9
New Rutland -Swindon Rd 41.2

LTP Monitoring Report 2016 v1 Page 29
1 Hewlett Road 41.4
The Restoration 40.2
8a Bath Road 41.8
Gloucester City
Priory Road 2005 2010
58 Priory Road 48.6
46 Priory Road 43.2
66 Priory Road 55.8
Barton Street 2005 2010 316 Barton Street 40.1
219a Barton Street 43.3
196 Barton Street 40.7
99 Barton Street 41.3
124 Barton Street 48.2
Painswick Road 2007 2010 106 Painswick Road 41
Undeclared 2010 61 Barnwood Road 43
Stroud District Undeclared 2012 Stroud - Bowbridge 44.3
Stroud – Signal House - Dudbridge Hill 49.8
Stroud – Signal House 1 - Dudbridge Hill 48.8
Stroud – Signal House 2 - Dudbridge Hill 46.3
Stroud – Signal House 3 - Dudbridge Hill 46
Cotswold District
Air Balloon 2008 2006 Birdlip - Air Balloon 68
Birdlip - coordinated site 1 61.2
Birdlip - coordinated site 2 61.6
Target details
To reduce the annual mean concentration level of transport derived NO2 at each of the county’s Air Quality Management Areas
Outcomes it will help to assess
Objective Expected Outcomes
Enable community connectivity
An integrated transport network which provides genuine transport choices
A transport network which provides individuals with the confidence to consider all travel choices
Conserve the environment
Reduced transport derived carbon emissions
A reduction in solo car use, and an increased uptake of sustainable transport modes (walking, cycling and public transport)
Improve community health and well being
Less car trips resulting in fewer journey delays
Increased number of walking and cycling trips
Improved air quality
A healthy more active population (addressing obesity and associated conditions)

LTP Monitoring Report 2016 v1 Page 30
LTP PI-14 - Reduce per capita transport carbon emissions
Links to policy documents
Outputs from this indicator will assist in understanding the impacts of policies outlined across all policy documents.
Policy Document Owner:
Simon Excell, Lead Commissioner Strategic Infrastructure
Monitoring Officer:
Ben Watts – Senior Planning Officer
What will this indicator show / Why is it important?
Carbon dioxide (CO2) is the main greenhouse gas, accounting for about 82 percent of the UK greenhouse gas emissions in 2013. The UK compiles an annual inventory of its greenhouse gas (GHG) emissions in order to monitor progress against domestic and international targets such as the Kyoto Protocol.
The statistics show emissions allocated on an “end-user” basis where emissions are distributed according to the point of energy consumption (or point of emission if not energy related).
On the 12th December 2015 a historic new global climate agreement has been struck at the United Nations conference on climate change in Paris. The deal sets out a clear long-term goal of net zero emissions by the end of the century, showing that the world is committed to decarbonising. Progress against this goal will be independently assessed in 2018 and every five years thereafter.
To reflect this, in 2020, countries will be expected to update their plans to cut emissions by 2030. Countries will also be legally obliged to make new post-2030 commitments to reduce emissions every 5 years, from 2025. For the first time, all countries will be held accountable by independent review for acting according to their pledges.
Methodology for collecting the data
Statistics are produced by government on an annual basis.
Transport emission estimates rely on national traffic statistics, and distribution of traffic on minor roads has had to be imputed at local level from regional level data
Transport emissions include freight and passenger transport, both private and for business purposes. The estimates are made on the basis of the distribution of traffic, therefore some of the emissions within an authority represent through traffic, or part of trips into or out of the area, whether by residents or non-residents. In some authorities this can be particularly significant, and the issue has to be borne in mind when looking at either totals or per capita estimates.
Historic trend data
For the purposes of this indicator the historic data was accessed using the following link:
https://www.gov.uk/government/statistics/uk-local-authority-and-regional-carbon-dioxide-emissions-national-statistics-2005-2013

LTP Monitoring Report 2016 v1 Page 31
The following data represents tonnes of CO2 per person in the county –
Year
Ind
ust
ry a
nd
C
om
mer
cial
Do
mes
tic
Tran
spo
rt
Tota
l
Tran
spo
rt a
s
A %
of
Tota
l
2005 3.0 2.6 1.9 7.5 25.7%
2006 3.1 2.6 1.9 7.5 25.0%
2007 2.9 2.5 1.9 7.3 25.9%
2008 2.9 2.5 1.8 7.2 25.5%
2009 2.5 2.2 1.7 6.5 27.1%
2010 2.7 2.4 1.7 6.8 25.4%
2011 2.5 2.0 1.7 6.2 26.8%
2012 2.6 2.2 1.6 6.5 25.4%
2013 2.5 2.1 1.6 6.3 25.8%
Target details
To reduce per capita transport carbon emissions, in order to contribute to achieving the government’s climate change commitments as part of COP21
Outcomes it will help to assess
Enable community connectivity
An integrated transport network which provides genuine transport choices
A transport network which provides individuals with the confidence to consider all travel choices
Conserve the environment
Reduced transport derived carbon emissions
A reduction in solo car use, and an increased uptake of sustainable transport modes (walking, cycling and public transport)
Improve community health and well being
Less car trips resulting in fewer journey delays
Increased number of walking and cycling trips
Improved air quality
A healthy more active population (addressing obesity and associated conditions)

LTP Monitoring Report 2016 v1 Page 32
Indicator Summary Table
Reference Indicator name Unit 2010/11 2011/12 2012/13 2013/14 2014/15 Target
LTP PI-1 Journey time reliability on strategic important routes during the AM peak
% 1.05 0.13
Maintain annual average variance to + or – 1%
LTP PI-2 Number of peak hour vehicle journeys % (AM) 0.1 -0.6 2.6 2.3 Restrict annual growth to 1% per annum % (PM) -0.2 0.0 2.2 1.8
LTP PI-3 Reduction in the inappropriate freight travel
% 6.2 6.8 7.1 7.4 7.3
To maintain the % of HGV traffic on inappropriate roads use to less than 5%
LTP PI-4 Principal road network condition % 3.6 3.6 3 4 3 Maintain at or below 4%
LTP PI-5 Non-Principal road network condition % 9.4 8.9 8 7 6 Maintain at or below 9%
LTP PI-6 Unclassified road network condition % 4 4 3 4 3 Maintain at or below 18%
LTP PI-7 Increase use of rail Journeys 4,614,000 4,795,472 4,836,232 5,099,668 Increase by 30% from 2015 to 2031
LTP PI-8 Increase use of cycling Journeys 4411 4503 4505 4520 4687 Increase by 50% from 2015 to 2031
LTP PI-9 Increase use of bus Journeys 4,959,876 4,790,389 4,477,953 4,462,493
Maintain bus passenger numbers in line with reviews
LTP PI-10 Maintain bus passenger access % 95.60% 96.10% 96.10% 96.10% Maintain access within 45 minutes
LTP PI-11 Reduce the number of highway casualties
Rolling 4 year average
236 233 231 225 234 40% reduction (from the 2005-2009 average) by 2020
LTP PI-12 Reduce the number of child highway casualties
Rolling 4 year average
16 18 15 15 16 40% reduction (from the 2005-2009 average) by 2020
LTP PI-13 Reduce levels of traffic derived Nitrogen Dioxide
Annual Mean Concentration (μg/m3) – see page 29-30 To reduce transport derived NO2 at each Air Quality Management Areas
LTP PI-14 Reduce per capita transport carbon emissions
Tonnes per capita
1.7 1.7 1.6 1.6 0 tonnes per capita by 2099