Local Structure and Magnetic Properties of Fe-Mn...
4
Journal of Magnetics 18(1), 1-4 (2013) http://dx.doi.org/10.4283/JMAG.2013.18.1.001 © 2013 Journal of Magnetics Local Structure and Magnetic Properties of Fe-Mn Nanocrystalline Alloys Fabricated by Mechanical Alloying Technique as a Function of Milling Time Kontan Tarigan 1 , Dong Seok Yang 2 , and Seong Cho Yu 3 * 1 Department of Electrical Engineering, Indonesia Institute of Technology, ITI, Serpong Tangerang Selatan 15320, Indonesia 2 Physics Division, School of Science Education, Chungbuk National University, Cheongju 361-763, Korea 3 Department of Physics, Chungbuk National University, Cheongju 361-763, Korea (Received 23 September 2012, Received in final form 3 January 2013, Accepted 4 January 2013) Structural and magnetic properties of Fe 50 Mn 50 nanocrystalline alloys prepared by the mechanical alloying technique (using commercial Fe and Mn powders as the precursors) are studied as a function of milling time, 1 hr to 48 hrs. The nano-crystallite size and shape are examined by using scanning electron microscopy (SEM). The effect of milling time on structural characterization was investigated using X-ray diffractometer (XRD) and extended X-ray absorption fine structure spectroscopy (EXAFS). Both XRD and EXAFS studies showed that the alloying process should be completed after 36 hrs milling. Concerning the magnetic behavior, the data obtained from superconducting quantum interference devices (SQUID) exhibited both magnetic saturation (M s ) and coercivity (H c ) depend strongly on the milling time, which are related to the changes in the crystallite size and magnetic dilution. Keywords : mechanical alloying, Fe 50 Mn 50 nanocrystalline alloys, structure and magnetic properties 1. Introduction Mechanical Alloying (MA) has been shown to be capable of synthesizing a variety of equilibrium and non-equi- librium alloy phases starting from blended elemental or pre-alloyed powders. The non-equilibrium phases synthe- sized include supersaturated solid solutions, meta-stable crystalline and quasi-crystalline phases, nanostructures, and amorphous alloys. MA produces nanostructured materials by the structural disintegration of coarser-grained struc- ture as a result of severe plastic deformation. MA is able to produce nanostructure materials with unique chemical, structural, electrical and magnetic properties, due to type of disorder created by the high density of defects and the small supersaturated solid solution, amorphous phases and nano powders, starting from a crystal size. Nowa- days, MA has been used to prepare metastable phases such as mixture of elemental components or inter-metallic compounds [1-5]. In fact, MA process is an effective way to fabricate nanocrystalline alloys [6], and their physical properties are related to structural variations. Some regularity in atomic arrangement in solids can be classified by the short-range order (SRO) and long-range order (LRO). Among these, LRO is frequently examined by X-ray diffr- action studies while SRO could be examined by extended X- ray absorption fine structure (EXAFS). EXAFS give use- ful information related to the local structure around specific atoms [4]. So far anti-ferromagnetic FeMn alloys have been exten- sively studied for many magnetic applications. Various phenomena such as spin transition and shape-memory effect in Fe-Mn alloys have been reported [4, 7]. In this work, we present preparation and characterization of the structure and magnetic behavior of Fe 50 Mn 50 alloys as changing the milling time. 2. Experimental Method Fe 50 Mn 50 metastable alloys were prepared by mech- anical alloying using SPEX 8000 mixer with stainless steel balls and vial. The starting material was a mixture of pure Fe and Mn powders (used commercial Fe and Mn powders as the precursors). The weight ratio of balls-to- powder mixture was 5:1. Fe 50 Mn 50 alloys were mixed and ground for different times 1-, 6-, 12-, 24-, 36- and 48 hrs. ©The Korean Magnetics Society. All rights reserved. *Corresponding author: Tel: +82-43-261-2269 Fax: +82-43-274-7811, e-mail: [email protected] ISSN (Print) 1226-1750 ISSN (Online) 2233-6656
Transcript of Local Structure and Magnetic Properties of Fe-Mn...
Journal of Magnetics 18(1), 1-4 (2013) http://dx.doi.org/10.4283/JMAG.2013.18.1.001
© 2013 Journal of Magnetics
Local Structure and Magnetic Properties of Fe-Mn Nanocrystalline Alloys
Fabricated by Mechanical Alloying Technique as a Function of Milling Time
Kontan Tarigan1, Dong Seok Yang2, and Seong Cho Yu3*
1Department of Electrical Engineering, Indonesia Institute of Technology, ITI, Serpong Tangerang Selatan 15320, Indonesia2Physics Division, School of Science Education, Chungbuk National University, Cheongju 361-763, Korea
3Department of Physics, Chungbuk National University, Cheongju 361-763, Korea
(Received 23 September 2012, Received in final form 3 January 2013, Accepted 4 January 2013)
Structural and magnetic properties of Fe50Mn50 nanocrystalline alloys prepared by the mechanical alloying
technique (using commercial Fe and Mn powders as the precursors) are studied as a function of milling time, 1
hr to 48 hrs. The nano-crystallite size and shape are examined by using scanning electron microscopy (SEM).
The effect of milling time on structural characterization was investigated using X-ray diffractometer (XRD)
and extended X-ray absorption fine structure spectroscopy (EXAFS). Both XRD and EXAFS studies showed
that the alloying process should be completed after 36 hrs milling. Concerning the magnetic behavior, the data
obtained from superconducting quantum interference devices (SQUID) exhibited both magnetic saturation (Ms)
and coercivity (Hc) depend strongly on the milling time, which are related to the changes in the crystallite size
and magnetic dilution.
Keywords : mechanical alloying, Fe50Mn50 nanocrystalline alloys, structure and magnetic properties
1. Introduction
Mechanical Alloying (MA) has been shown to be capable
of synthesizing a variety of equilibrium and non-equi-
librium alloy phases starting from blended elemental or
pre-alloyed powders. The non-equilibrium phases synthe-
sized include supersaturated solid solutions, meta-stable
crystalline and quasi-crystalline phases, nanostructures, and
amorphous alloys. MA produces nanostructured materials
by the structural disintegration of coarser-grained struc-
ture as a result of severe plastic deformation. MA is able
to produce nanostructure materials with unique chemical,
structural, electrical and magnetic properties, due to type of
disorder created by the high density of defects and the
small supersaturated solid solution, amorphous phases
and nano powders, starting from a crystal size. Nowa-
days, MA has been used to prepare metastable phases such
as mixture of elemental components or inter-metallic
compounds [1-5].
In fact, MA process is an effective way to fabricate
nanocrystalline alloys [6], and their physical properties
are related to structural variations. Some regularity in
atomic arrangement in solids can be classified by the
short-range order (SRO) and long-range order (LRO).
Among these, LRO is frequently examined by X-ray diffr-
action studies while SRO could be examined by extended X-
ray absorption fine structure (EXAFS). EXAFS give use-
ful information related to the local structure around
specific atoms [4].
So far anti-ferromagnetic FeMn alloys have been exten-
sively studied for many magnetic applications. Various
phenomena such as spin transition and shape-memory
effect in Fe-Mn alloys have been reported [4, 7]. In this
work, we present preparation and characterization of the
structure and magnetic behavior of Fe50Mn50 alloys as
changing the milling time.
2. Experimental Method
Fe50Mn50 metastable alloys were prepared by mech-
anical alloying using SPEX 8000 mixer with stainless
steel balls and vial. The starting material was a mixture of
pure Fe and Mn powders (used commercial Fe and Mn
powders as the precursors). The weight ratio of balls-to-
powder mixture was 5:1. Fe50Mn50 alloys were mixed and
ground for different times 1-, 6-, 12-, 24-, 36- and 48 hrs.
©The Korean Magnetics Society. All rights reserved.
*Corresponding author: Tel: +82-43-261-2269
Fax: +82-43-274-7811, e-mail: [email protected]
ISSN (Print) 1226-1750ISSN (Online) 2233-6656
− 2 − Local Structure and Magnetic Properties of Fe-Mn Nanocrystalline Alloys Fabricated by Mechanical… − Kontan Tarigan et al.
This process was performed in Ar ambient to prevent oxi-
dation during the alloying process. After the preparation,
the particle size and their shape were checked using
scanning electron microscope (SEM). Magnetic measure-
ments were carried out on SQUID. Structure data were
obtained by X-ray diffractometer (XRD) using the Cu-Kα
radiation. The data were analyzed using Material Data
Inc. (MDI) software. Based on these data, crystallite size
of the samples were estimated in terms of the Scherrer
formula. EXAFS data were collected from the 3C1
EXAFS beam line of the Pohang Light Source (PLS).
The PLS was operated with an energy of 2.5 GeV, and a
maximum current of 200 mA. EXAFS spectra were obtain-
ed at Fe K-edge (7112 eV) in the transmission mode at
room temperature. The sample chamber was filled with
pure nitrogen gas. Then the EXAFS data were analyzed
using IFEFFIT software, an interactive program for XAFS
analysis.
3. Results and Discussion
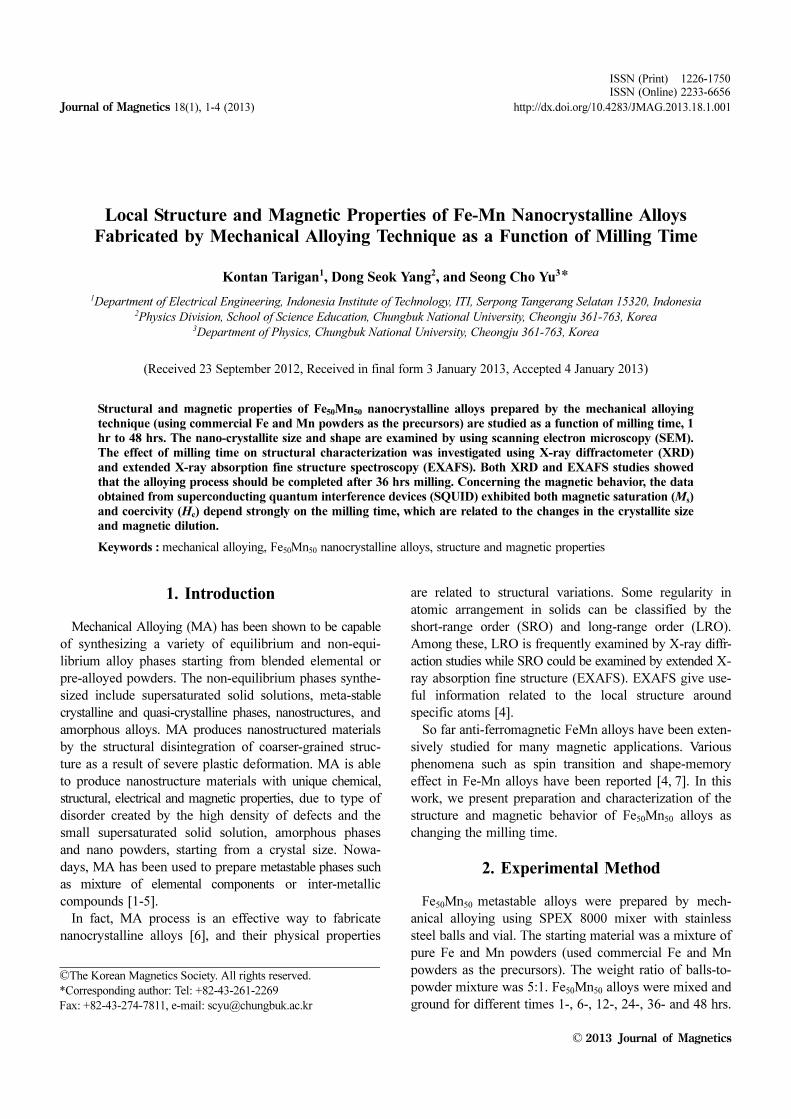
Fig. 1 is the typical SEM images of the samples Fe50Mn50
showing that the particle shape and size are in nanocrystalline
alloys with milling time of 1-, 6-, 12- and 24-hrs. In
general, the average particles size estimated from the SEM
images are found to decrease with increasing milling time.
Similar particle shapes of SEM pictures were also obtain-
ed for all other samples, but the images were not shown
here.
All the SEM images revealed that particles present in
the Fe50Mn50 samples have quite similar shapes, where
smaller particles are located on the surfaces of bigger
particles. The particle size looks consistent with crystallite
size which is revealed later in Fig. 3.
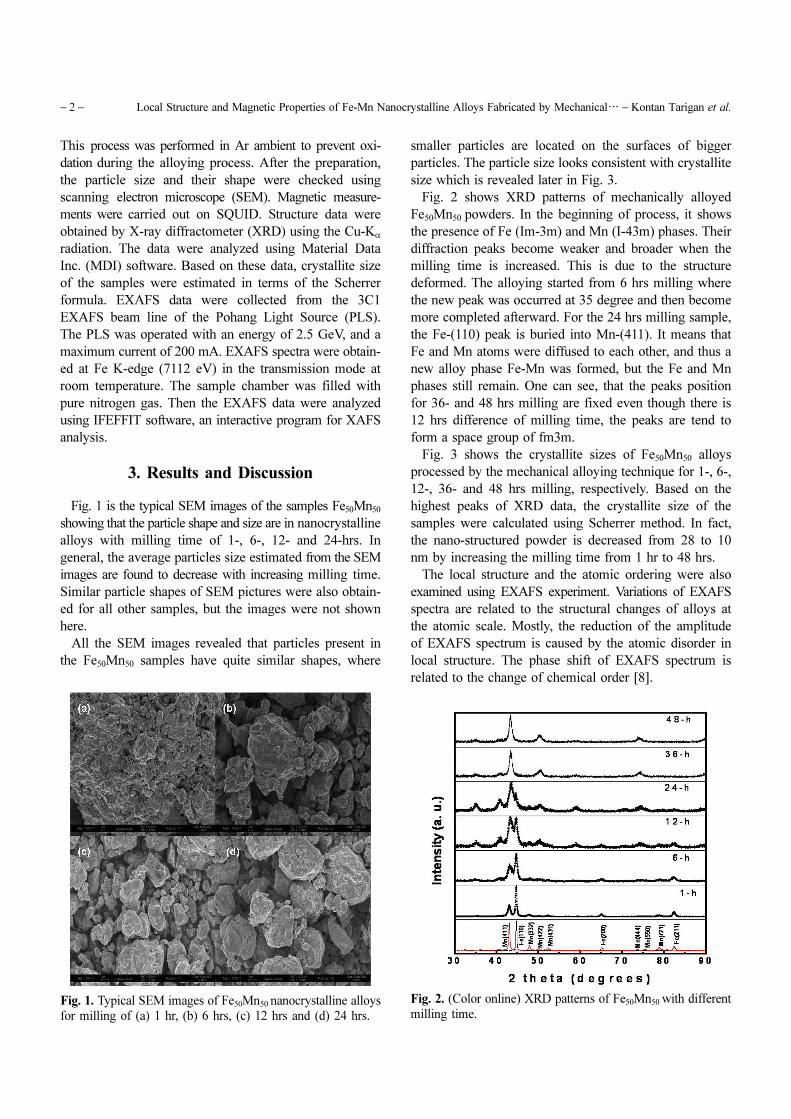
Fig. 2 shows XRD patterns of mechanically alloyed
Fe50Mn50 powders. In the beginning of process, it shows
the presence of Fe (Im-3m) and Mn (I-43m) phases. Their
diffraction peaks become weaker and broader when the
milling time is increased. This is due to the structure
deformed. The alloying started from 6 hrs milling where
the new peak was occurred at 35 degree and then become
more completed afterward. For the 24 hrs milling sample,
the Fe-(110) peak is buried into Mn-(411). It means that
Fe and Mn atoms were diffused to each other, and thus a
new alloy phase Fe-Mn was formed, but the Fe and Mn
phases still remain. One can see, that the peaks position
for 36- and 48 hrs milling are fixed even though there is
12 hrs difference of milling time, the peaks are tend to
form a space group of fm3m.
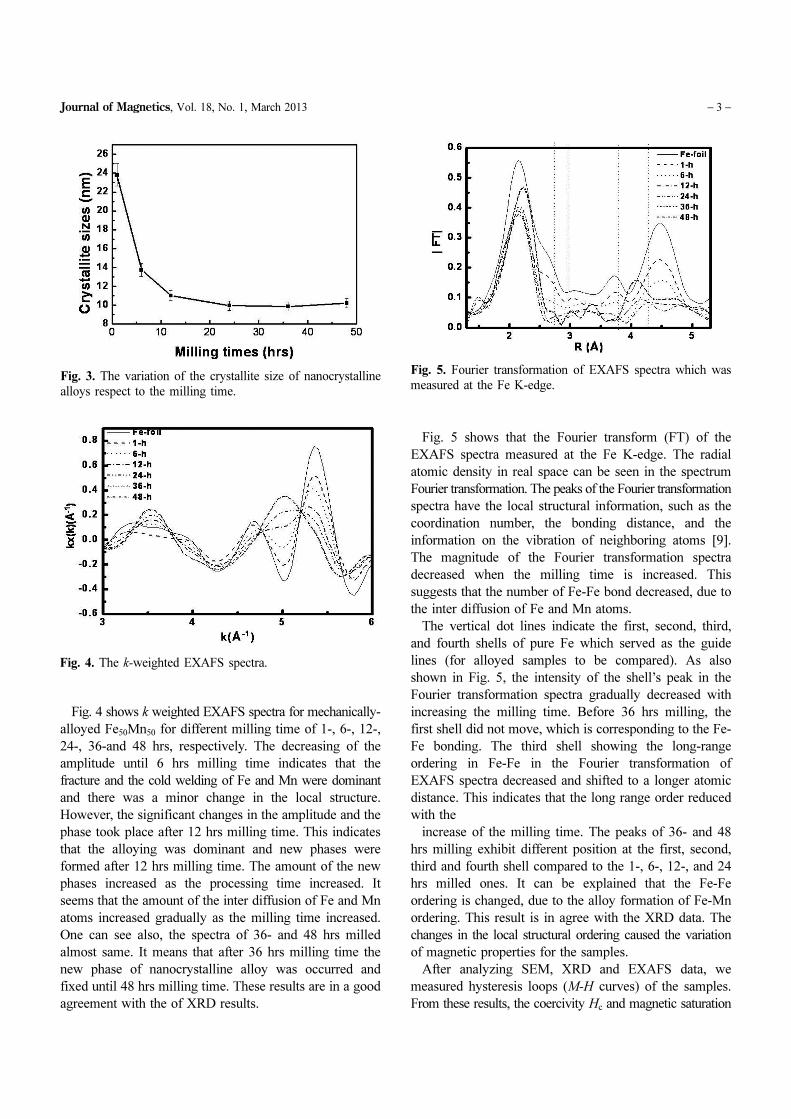
Fig. 3 shows the crystallite sizes of Fe50Mn50 alloys
processed by the mechanical alloying technique for 1-, 6-,
12-, 36- and 48 hrs milling, respectively. Based on the
highest peaks of XRD data, the crystallite size of the
samples were calculated using Scherrer method. In fact,
the nano-structured powder is decreased from 28 to 10
nm by increasing the milling time from 1 hr to 48 hrs.
The local structure and the atomic ordering were also
examined using EXAFS experiment. Variations of EXAFS
spectra are related to the structural changes of alloys at
the atomic scale. Mostly, the reduction of the amplitude
of EXAFS spectrum is caused by the atomic disorder in
local structure. The phase shift of EXAFS spectrum is
related to the change of chemical order [8].
Fig. 1. Typical SEM images of Fe50Mn50 nanocrystalline alloys
for milling of (a) 1 hr, (b) 6 hrs, (c) 12 hrs and (d) 24 hrs.
Fig. 2. (Color online) XRD patterns of Fe50Mn50 with different
milling time.
Journal of Magnetics, Vol. 18, No. 1, March 2013 − 3 −
Fig. 4 shows k weighted EXAFS spectra for mechanically-
alloyed Fe50Mn50 for different milling time of 1-, 6-, 12-,
24-, 36-and 48 hrs, respectively. The decreasing of the
amplitude until 6 hrs milling time indicates that the
fracture and the cold welding of Fe and Mn were dominant
and there was a minor change in the local structure.
However, the significant changes in the amplitude and the
phase took place after 12 hrs milling time. This indicates
that the alloying was dominant and new phases were
formed after 12 hrs milling time. The amount of the new
phases increased as the processing time increased. It
seems that the amount of the inter diffusion of Fe and Mn
atoms increased gradually as the milling time increased.
One can see also, the spectra of 36- and 48 hrs milled
almost same. It means that after 36 hrs milling time the
new phase of nanocrystalline alloy was occurred and
fixed until 48 hrs milling time. These results are in a good
agreement with the of XRD results.
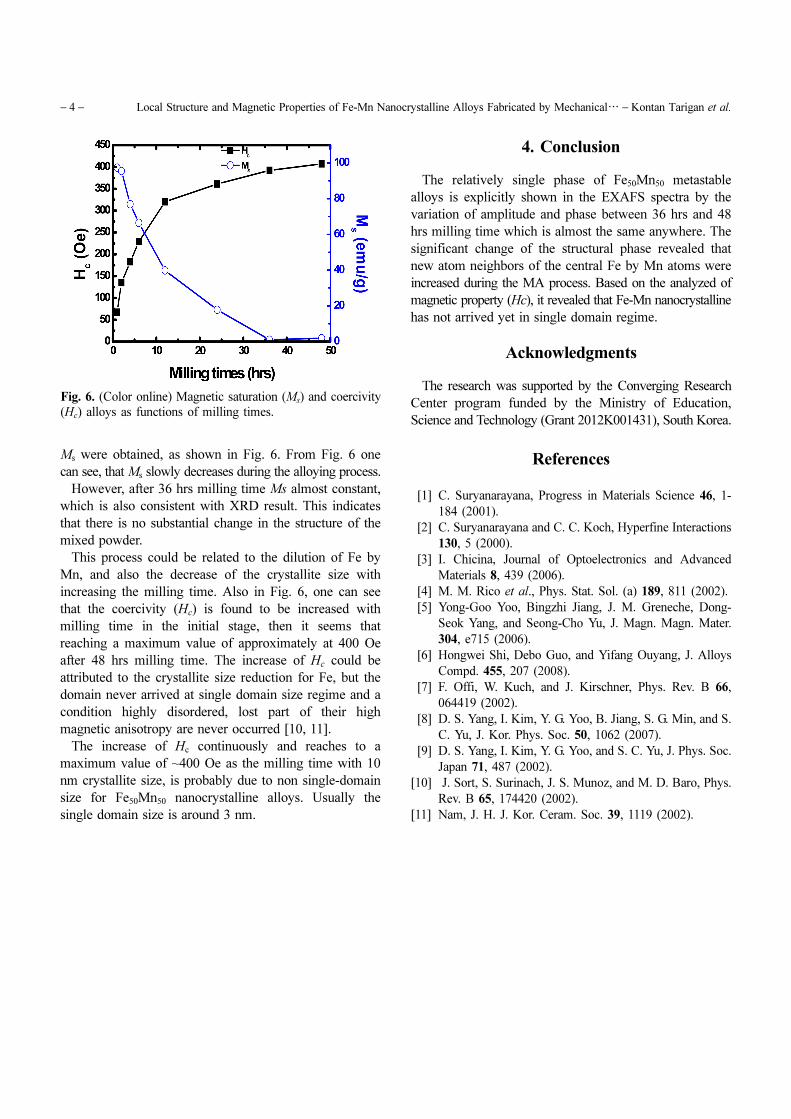
Fig. 5 shows that the Fourier transform (FT) of the
EXAFS spectra measured at the Fe K-edge. The radial
atomic density in real space can be seen in the spectrum
Fourier transformation. The peaks of the Fourier transformation
spectra have the local structural information, such as the
coordination number, the bonding distance, and the
information on the vibration of neighboring atoms [9].
The magnitude of the Fourier transformation spectra
decreased when the milling time is increased. This
suggests that the number of Fe-Fe bond decreased, due to
the inter diffusion of Fe and Mn atoms.
The vertical dot lines indicate the first, second, third,
and fourth shells of pure Fe which served as the guide
lines (for alloyed samples to be compared). As also
shown in Fig. 5, the intensity of the shell’s peak in the
Fourier transformation spectra gradually decreased with
increasing the milling time. Before 36 hrs milling, the
first shell did not move, which is corresponding to the Fe-
Fe bonding. The third shell showing the long-range
ordering in Fe-Fe in the Fourier transformation of
EXAFS spectra decreased and shifted to a longer atomic
distance. This indicates that the long range order reduced
with the
increase of the milling time. The peaks of 36- and 48
hrs milling exhibit different position at the first, second,
third and fourth shell compared to the 1-, 6-, 12-, and 24
hrs milled ones. It can be explained that the Fe-Fe
ordering is changed, due to the alloy formation of Fe-Mn
ordering. This result is in agree with the XRD data. The
changes in the local structural ordering caused the variation
of magnetic properties for the samples.
After analyzing SEM, XRD and EXAFS data, we
measured hysteresis loops (M-H curves) of the samples.
From these results, the coercivity Hc and magnetic saturation
Fig. 3. The variation of the crystallite size of nanocrystalline
alloys respect to the milling time.
Fig. 4. The k-weighted EXAFS spectra.
Fig. 5. Fourier transformation of EXAFS spectra which was
measured at the Fe K-edge.
− 4 − Local Structure and Magnetic Properties of Fe-Mn Nanocrystalline Alloys Fabricated by Mechanical… − Kontan Tarigan et al.
Ms were obtained, as shown in Fig. 6. From Fig. 6 one
can see, that Ms slowly decreases during the alloying process.
However, after 36 hrs milling time Ms almost constant,
which is also consistent with XRD result. This indicates
that there is no substantial change in the structure of the
mixed powder.
This process could be related to the dilution of Fe by
Mn, and also the decrease of the crystallite size with
increasing the milling time. Also in Fig. 6, one can see
that the coercivity (Hc) is found to be increased with
milling time in the initial stage, then it seems that
reaching a maximum value of approximately at 400 Oe
after 48 hrs milling time. The increase of Hc could be
attributed to the crystallite size reduction for Fe, but the
domain never arrived at single domain size regime and a
condition highly disordered, lost part of their high
magnetic anisotropy are never occurred [10, 11].
The increase of Hc continuously and reaches to a
maximum value of ~400 Oe as the milling time with 10
nm crystallite size, is probably due to non single-domain
size for Fe50Mn50 nanocrystalline alloys. Usually the
single domain size is around 3 nm.
4. Conclusion
The relatively single phase of Fe50Mn50 metastable
alloys is explicitly shown in the EXAFS spectra by the
variation of amplitude and phase between 36 hrs and 48
hrs milling time which is almost the same anywhere. The
significant change of the structural phase revealed that
new atom neighbors of the central Fe by Mn atoms were
increased during the MA process. Based on the analyzed of
magnetic property (Hc), it revealed that Fe-Mn nanocrystalline
has not arrived yet in single domain regime.
Acknowledgments
The research was supported by the Converging Research
Center program funded by the Ministry of Education,
Science and Technology (Grant 2012K001431), South Korea.
References
[1] C. Suryanarayana, Progress in Materials Science 46, 1-
184 (2001).
[2] C. Suryanarayana and C. C. Koch, Hyperfine Interactions
130, 5 (2000).
[3] I. Chicina, Journal of Optoelectronics and Advanced
Materials 8, 439 (2006).
[4] M. M. Rico et al., Phys. Stat. Sol. (a) 189, 811 (2002).
[5] Yong-Goo Yoo, Bingzhi Jiang, J. M. Greneche, Dong-
Seok Yang, and Seong-Cho Yu, J. Magn. Magn. Mater.
304, e715 (2006).
[6] Hongwei Shi, Debo Guo, and Yifang Ouyang, J. Alloys
Compd. 455, 207 (2008).
[7] F. Offi, W. Kuch, and J. Kirschner, Phys. Rev. B 66,
064419 (2002).
[8] D. S. Yang, I. Kim, Y. G. Yoo, B. Jiang, S. G. Min, and S.
C. Yu, J. Kor. Phys. Soc. 50, 1062 (2007).
[9] D. S. Yang, I. Kim, Y. G. Yoo, and S. C. Yu, J. Phys. Soc.
Japan 71, 487 (2002).
[10] J. Sort, S. Surinach, J. S. Munoz, and M. D. Baro, Phys.
Rev. B 65, 174420 (2002).
[11] Nam, J. H. J. Kor. Ceram. Soc. 39, 1119 (2002).
Fig. 6. (Color online) Magnetic saturation (Ms) and coercivity
(Hc) alloys as functions of milling times.

![The effects of substitutional Fe-doping on magnetism in ......magnetic properties in Fe, Co, and Mn-doped MoS 2 mono-layers [15]. Experiential observations of magnetism have been made](https://static.fdocuments.us/doc/165x107/61075925b88ecc124f72eeb4/the-effects-of-substitutional-fe-doping-on-magnetism-in-magnetic-properties.jpg)


![Interfacial magnetic coupling between Fe nanoparticles in Fe ...magnetic moment [10] and magnetic interactions [11–13]. Concerning interparticle magnetic interactions, it has been](https://static.fdocuments.us/doc/165x107/60eea974519ccd0158590d85/interfacial-magnetic-coupling-between-fe-nanoparticles-in-fe-magnetic-moment.jpg)