Local Sales Tax Distribution Comparison Chart
15
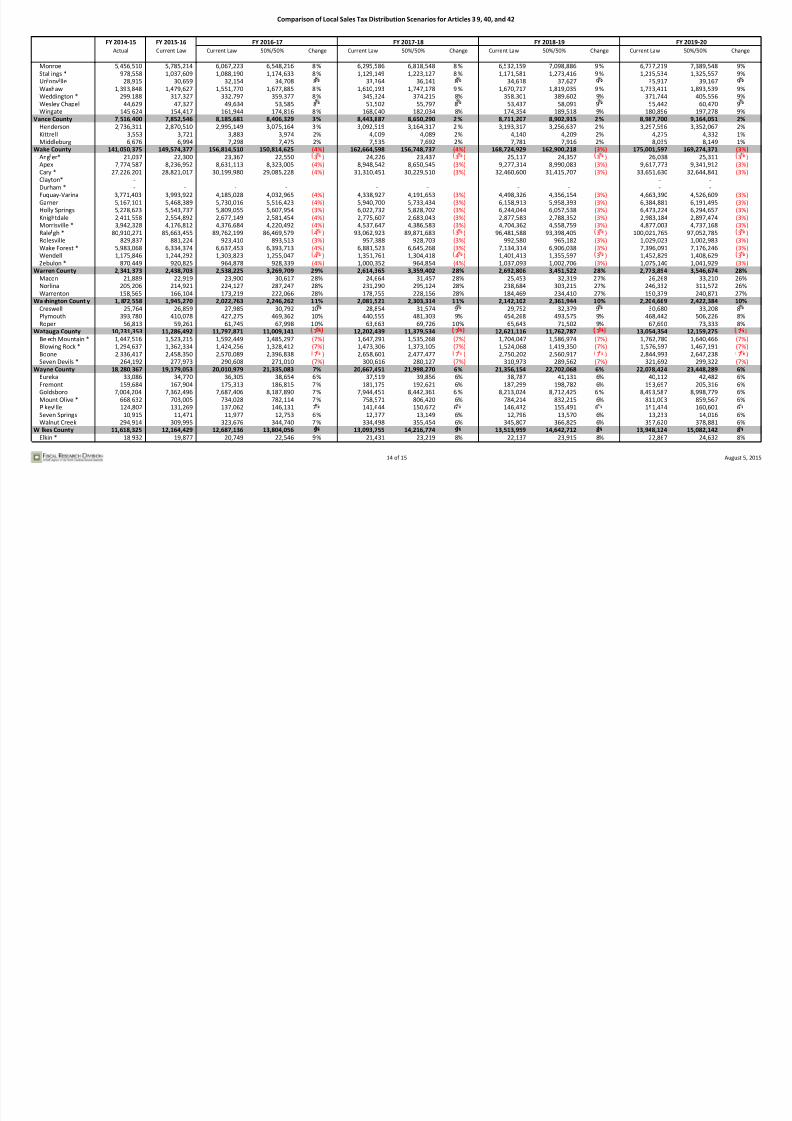
Comparison of Local Sales Tax Distribution Scenarios for Articles 3 9, 40, and 42 1 of 15 August 5, 2015 Analysis Parameters: - Compares potential distributions under current law to potential distributions under a "50% per capita; 50% point of sale" formula. - Includes no base expansion. Assumes growth of 5.4% in FY 2015-16; 4.6% in FY 2016-17; and 3.5% in all future years. - Shows only distributions under Articles 39, 40, and 42, including City Hold Harmless payments. - Per capita distributions are based upon the State Demographer's April 2015 county-level population projections. FY 2014-15 FY 2015-16 Actual Current Law Current Law 50%/50% Change Current Law 50%/50% Change Current Law 50%/50% Change Current Law 50%/50% Change St at ew id e To tal 2, 49 5, 187 ,2 20 2,629,927,330 2,750,903,987 2,750,903,987 0% 2,847,185,627 2,847,185,627 0% 2,946,837,124 2,946,837,124 (0%) 3,049,976,423 3,049,976,423 0% Alamance County 24,945,427 26,321,488 27,544,873 26,246,762 (5%) 28,522,859 27,188,753 (5%) 29,536,167 28,165,566 (5%) 30,585,741 29,177,912 (5%) Alamance 213,420 225,296 235,742 224,948 (5%) 244,084 233,022 (5%) 252,725 241,394 (4%) 261,673 250,071 (4%) Burlington * 10,840,472 11,435,440 11,965,629 11,406,436 (5%) 12,389,019 11,815,811 (5%) 12,827,589 12,240,320 (5%) 13,281,773 12,680,270 (5%) Elon 2,081,399 2,197,355 2,299,235 2,194,135 (5%) 2,380,594 2,272,887 (5%) 2,464,869 2,354,550 (4%) 2,552,146 2,439,184 (4%) Gibsonville * 703,269 742,241 776,655 740,870 (5%) 804,136 767,461 (5%) 832,603 795,034 (5%) 862,084 823,611 (4%) Graham 3,033,738 3,199,795 3,348,148 3,191,067 (5%) 3,466,618 3,305,592 (5%) 3,589,335 3,424,352 (5%) 3,716,421 3,547,431 (5%) Green Level 445,046 469,145 490,896 467,509 5 ) 508,265 484,287 5 ) 526,257 501,685 5 ) 544,890 519,716 5 ) Haw River 494,561 521,611 545,795 520,160 (5%) 565,107 538,828 (5%) 585,112 558,187 (5%) 605,828 578,249 (5%) Mebane * 2,171,955 2,292,338 2,398,621 2,288,137 (5%) 2,483,496 2,370,261 (5%) 2,571,414 2,455,421 (5%) 2,662,461 2,543,679 (4%) Oss pee 118,664 125,176 130,980 124,858 5 ) 135,614 129,339 5 ) 140,415 133,986 5 ) 145,387 138,802 5 ) Swepsonville 253,236 267,375 279,772 267,026 (5%) 289,672 276,610 (5%) 299,927 286,549 (4%) 310,547 296,849 (4%) Alexander County 5,055,289 5,330,495 5,577,257 6,887,111 23% 5,771,851 7,126,645 23% 5,973,396 7,374,816 23% 6,181,707 7,631,098 23% Taylorsville 439,453 463,563 484,975 599,505 24% 501,915 620,356 24% 519,455 641,959 24% 537,594 664,267 24% Alleghany C ounty 1,635,053 1,716,193 1,791,915 2,001,316 12% 1,851,306 2,065,316 12% 1,912,666 2,131,360 11% 1,976,104 2,199,585 11% Sparta 386,366 406,118 424,287 472,988 11% 438,609 488,114 11% 453,414 503,722 11% 468,727 519,846 11% Anson C ounty 2,414,729 2,519,232 2,622,060 3,094,439 18% 2,700,728 3,181,443 18% 2,781,917 3,271,112 18% 2,865,562 3,363,293 17% Ansonville 100,928 105,864 110,426 129,596 17% 113,982 133,239 17% 117,657 136,993 16% 121,452 140,853 16% L lesv lle 86,833 91,107 95,033 111,579 17 98,093 114,715 17 101,256 117,947 16 104,521 121,270 16 McFarlan 19,132 20,090 20,956 24,632 18% 21,630 25,324 17% 22,327 26,038 17% 23,047 26,771 16% Morven 81,360 85,348 89,026 104,498 17% 91,893 107,435 17% 94,856 110,462 16% 97,915 113,574 16% Peachland 69,437 72,808 75,945 89,084 17% 78,391 91,589 17% 80,919 94,170 16% 83,529 96,823 16% Polkton 527,078 550,685 574,433 670,306 17% 592,949 689,171 16% 612,086 708,614 16% 631,845 728,602 15% Wadesboro 926,950 972,177 1,014,073 1,189,932 17% 1,046,732 1,223,382 17% 1,080,483 1,257,855 16% 1,115,332 1,293,294 16% Ashe County 4,749,056 4,975,068 5,188,898 5,648,188 9% 5,355,440 5,815,846 9% 5,527,290 5,988,336 8% 5,705,201 6,166,944 8% Jefferson 369,888 387,277 404,239 437,561 8 417,532 450,559 8 431,261 463,931 8 445,473 477,778 7 Lansing 37,237 39,061 40,771 44,251 9% 42,111 45,564 8% 43,495 46,916 8% 44,928 48,315 8% West Jefferson 316,114 331,923 346,454 376,567 9% 357,840 387,743 8% 369,598 399,240 8% 381,771 411,145 8% Avery County 4,262,113 4,469,033 4,662,634 4,416,472 5 4,813,446 4,549,699 5 4,969,364 4,687,289 6 5,130,665 4,829,562 6 Banner Elk 334,423 351,983 367,423 348,713 (5%) 379,506 359,220 (5%) 392,001 370,070 (6%) 404,929 381,290 (6%) Beech Mountain * 7,569 7,943 8,292 7,839 (5%) 8,565 8,076 (6%) 8,847 8,320 (6%) 9,139 8,572 (6%) Crossnore 61,713 65,152 68,008 64,801 (5%) 70,243 66,751 (5%) 72,554 68,765 (5%) 74,945 70,847 (5%) Elk Park 136,247 142,977 149,252 141,105 (5%) 154,164 145,362 (6%) 159,244 149,758 (6%) 164,499 154,304 (6%) Grandfather Vil. 7,569 7,943 8,292 7,839 (5%) 8,565 8,076 (6%) 8,847 8,320 (6%) 9,139 8,572 (6%) Newland 212,312 223,037 232,824 220,424 (5%) 240,485 227,071 (6%) 248,407 233,935 (6%) 256,603 241,034 (6%) Seven Dev ls * 8,780 9,214 9,619 9,094 5 ) 9,935 9,368 6 ) 10,263 9,651 6 ) 10,601 9,944 6 ) Sugar Mountain 59,845 62,822 65,579 62,028 (5%) 67,737 63,899 (6%) 69,969 65,831 (6%) 72,278 67,829 (6%) Beaufort County 8,078,049 8,447,518 8,808,945 8,916,420 1% 9,089,197 9,179,724 1% 9,379,105 9,451,969 1% 9,678,489 9,732,574 1% Aurora 120,047 125,769 131,265 132,396 1 135,559 136,306 1 140,003 140,349 0 144,594 144,516 0 ) Bath 57,404 60,147 62,775 63,326 1% 64,829 65,196 1% 66,954 67,130 0% 69,150 69,123 (0%) Belhaven 386,572 404,927 422,620 426,165 1% 436,448 438,752 1% 450,755 451,767 0% 465,539 465,181 (0%) FY 2019-20 FY 2016-17 FY 2017-18 FY 2018-19
-
Upload
jeffrey-billman -
Category
Documents
-
view
728 -
download
0
description
Impacts to N.C. counties and cities.
Transcript of Local Sales Tax Distribution Comparison Chart
7/18/2019 Local Sales Tax Distribution Comparison Chart
http://slidepdf.com/reader/full/local-sales-tax-distribution-comparison-chart 1/15
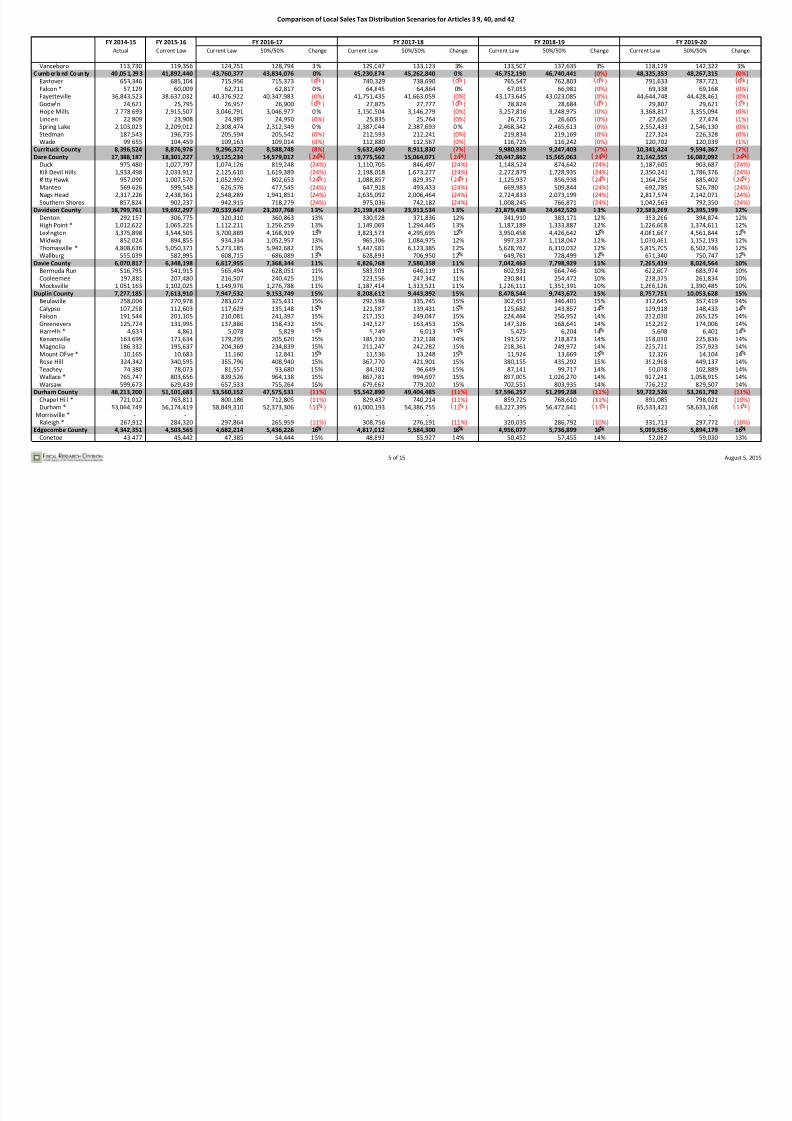
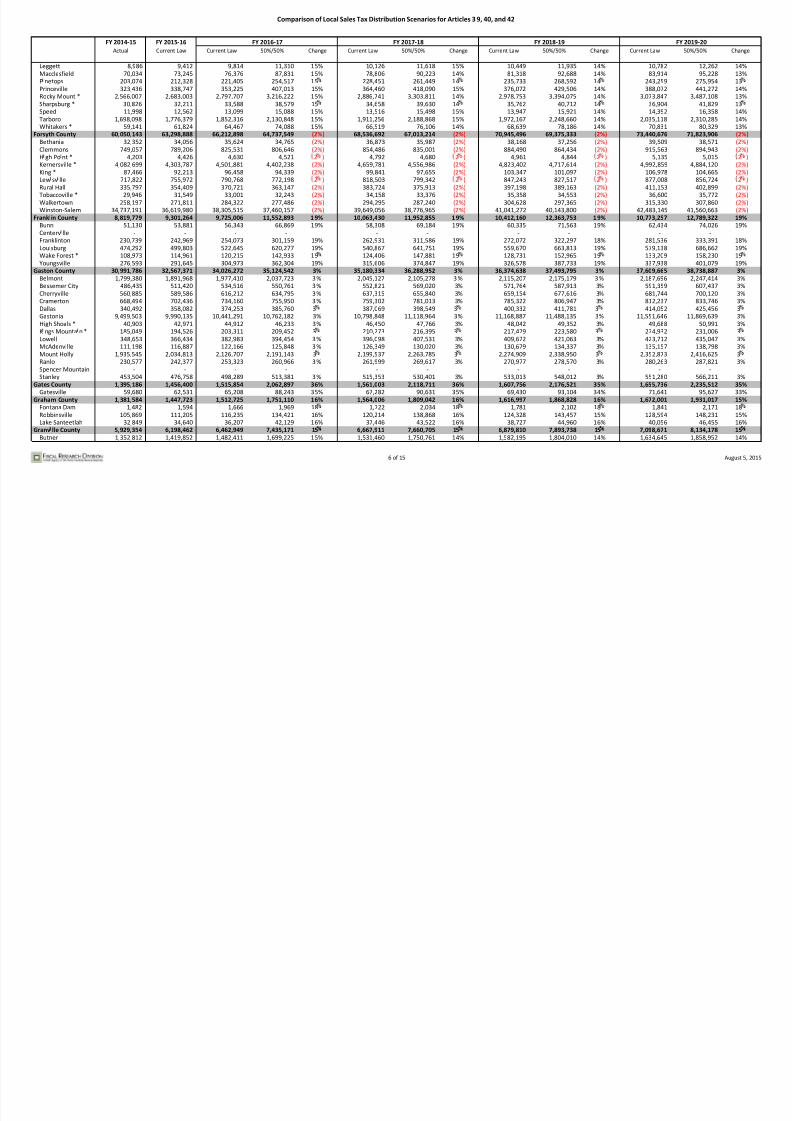
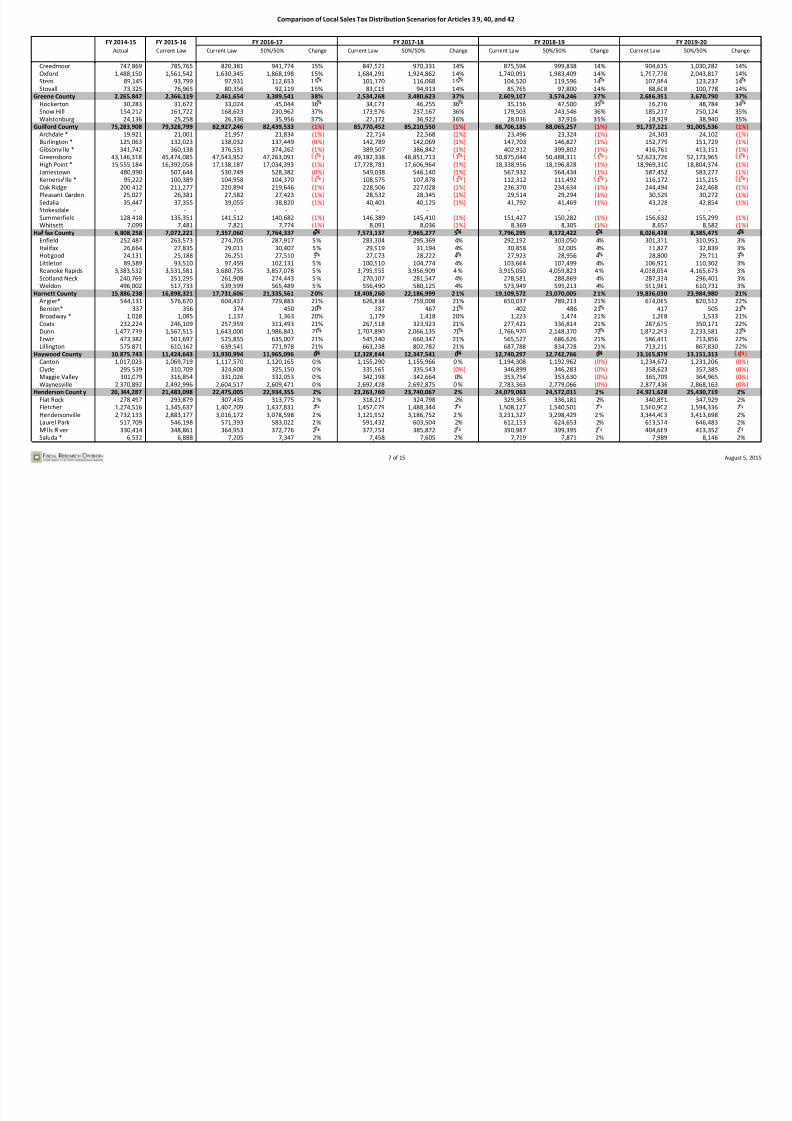
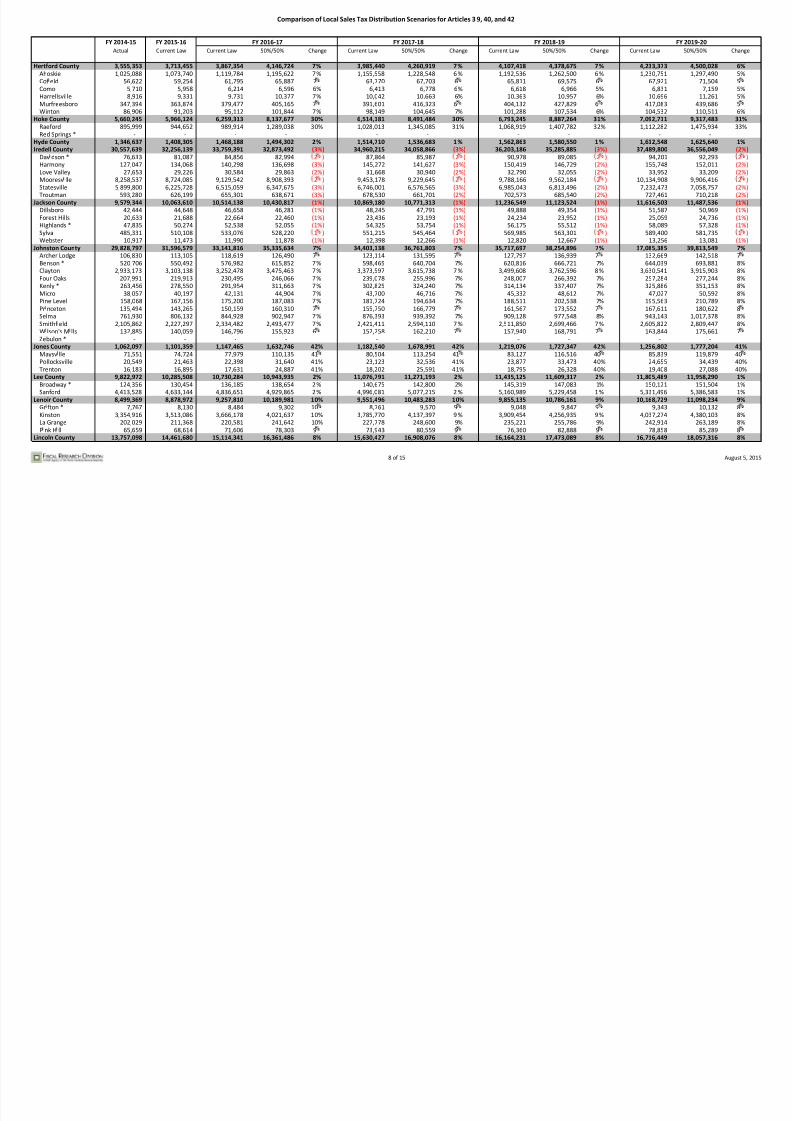
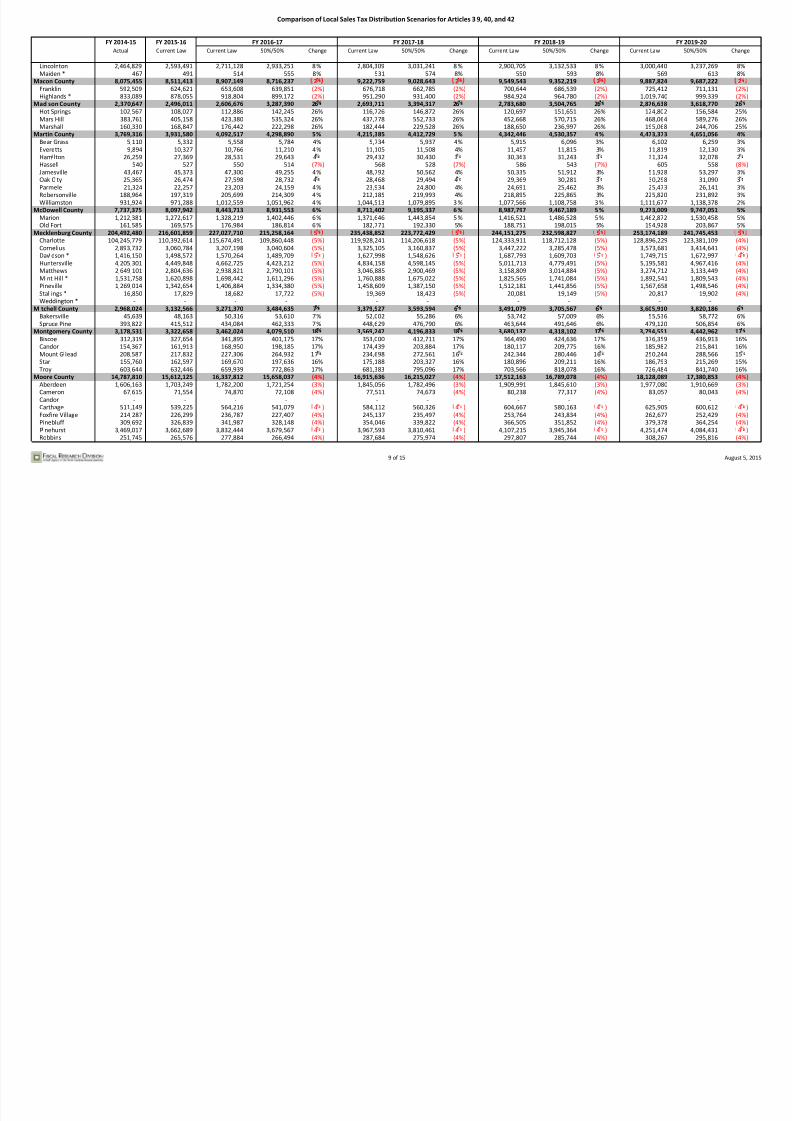
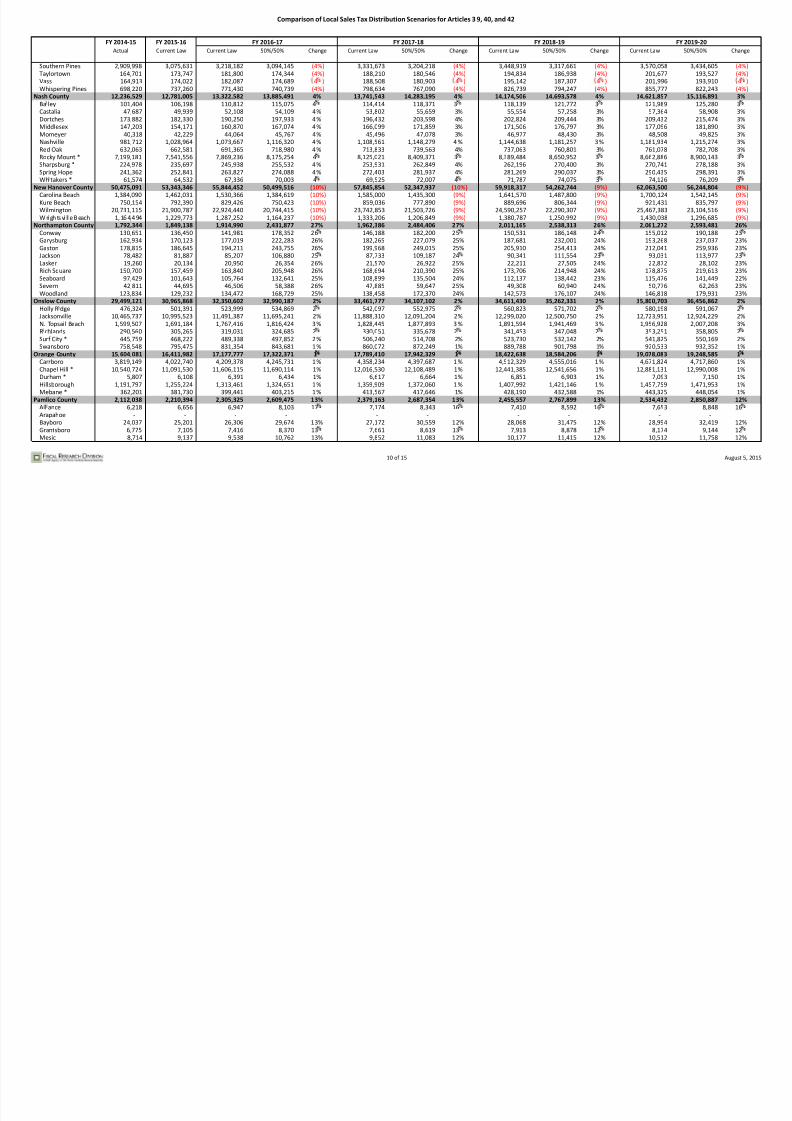
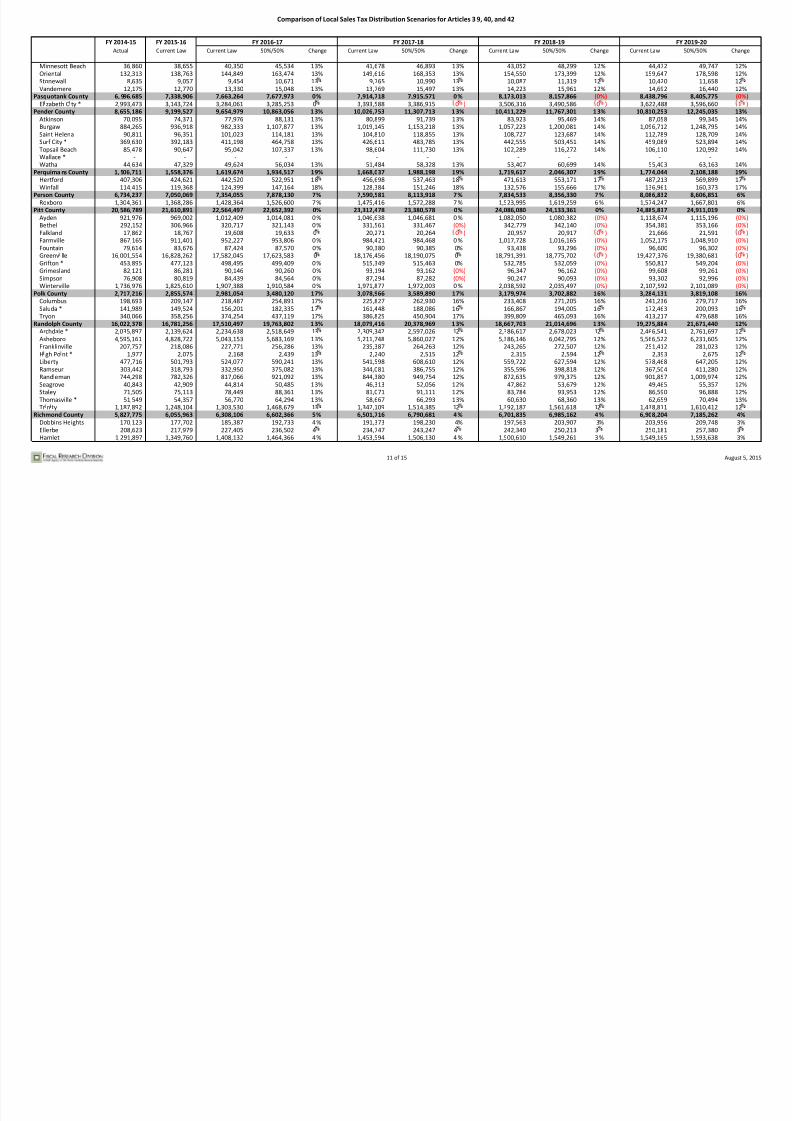
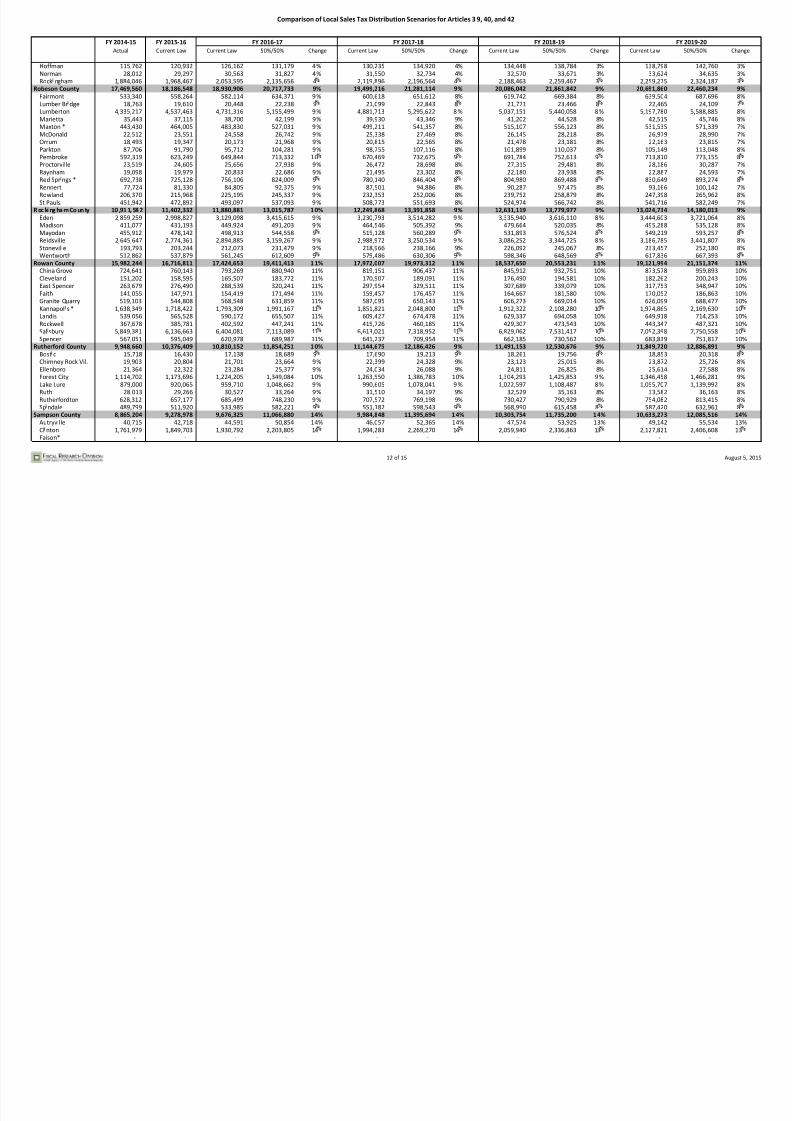
Comparison of Local Sales Tax Distribution Scenarios for Articles 3 9, 40, and 42
1 of 15
Analysis Parameters:
- Compares potential distributions under current law to potential distributions under a "50% per capita; 50% point of sale" formula.
- Includes no base expansion. Assumes growth of 5.4% in FY 2015-16; 4.6% in FY 2016-17; and 3.5% in all future years.
- Shows only distributions under Articles 39, 40, and 42, including City Hold Harmless payments.
- Per capita distributions are based upon the State Demographer's April 2015 county-level population projections.
FY 2014-15 FY 2015-16
Actual Current Law Current Law 50%/50% Change Current Law 50%/50% Change Current Law 50%/50% Change Current Law
S ta tew id e T ot al 2 ,4 95 ,18 7, 22 0 2,629,927,330 2,750,903,987 2,750,903,987 0% 2,847,185,627 2,847,185,627 0% 2,946,837,124 2,946,837,124 (0%) 3,049,976,423 3
Alamance County 24,945,427 26,321,488 27,544,873 26,246,762 (5%) 28,522,859 27,188,753 (5%) 29,536,167 28,165,566 (5%) 30,585,741
Alamance 213,420 225,296 235,742 224,948 (5%) 244,084 233,022 (5%) 252,725 241,394 (4%) 261,673 Burlington * 10,840,472 11,435,440 11,965,629 11,406,436 (5%) 12,389,019 11,815,811 (5%) 12,827,589 12,240,320 (5%) 13,281,773
Elon 2,081,399 2,197,355 2,299,235 2,194,135 (5%) 2,380,594 2,272,887 (5%) 2,464,869 2,354,550 (4%) 2,552,146 Gibsonville * 703,269 742,241 776,655 740,870 (5%) 804,136 767,461 (5%) 832,603 795,034 (5%) 862,084
Graham 3,033,738 3,199,795 3,348,148 3,191,067 (5%) 3,466,618 3,305,592 (5%) 3,589,335 3,424,352 (5%) 3,716,421 Green Level 445,046 469,145 490,896 467,509 5 ) 508,265 484,287 5 ) 526,257 501,685 5 ) 544,890
Haw River 494,561 521,611 545,795 520,160 (5%) 565,107 538,828 (5%) 585,112 558,187 (5%) 605,828 Mebane * 2,171,955 2,292,338 2,398,621 2,288,137 (5%) 2,483,496 2,370,261 (5%) 2,571,414 2,455,421 (5%) 2,662,461 Oss pee 118,664 125,176 130,980 124,858 5 ) 135,614 129,339 5 ) 140,415 133,986 5 ) 145,387
Swepsonville 253,236 267,375 279,772 267,026 (5%) 289,672 276,610 (5%) 299,927 286,549 (4%) 310,547 Alexander County 5,055,289 5,330,495 5,577,257 6,887,111 23% 5,771,851 7,126,645 23% 5,973,396 7,374,816 23% 6,181,707
Taylorsville 439,453 463,563 484,975 599,505 24% 501,915 620,356 24% 519,455 641,959 24% 537,594 Alleghany County 1,635,053 1,716,193 1,791,915 2,001,316 12% 1,851,306 2,065,316 12% 1,912,666 2,131,360 11% 1,976,104
Sparta 386,366 406,118 424,287 472,988 11% 438,609 488,114 11% 453,414 503,722 11% 468,727 Anson County 2,414,729 2,519,232 2,622,060 3,094,439 18% 2,700,728 3,181,443 18% 2,781,917 3,271,112 18% 2,865,562
Ansonville 100,928 105,864 110,426 129,596 17% 113,982 133,239 17% 117,657 136,993 16% 121,452
L lesv lle 86,833 91,107 95,033 111,579 17 98,093 114,715 17 101,256 117,947 16 104,521 McFarlan 19,132 20,090 20,956 24,632 18% 21,630 25,324 17% 22,327 26,038 17% 23,047
Morven 81,360 85,348 89,026 104,498 17% 91,893 107,435 17% 94,856 110,462 16% 97,915 Peachland 69,437 72,808 75,945 89,084 17% 78,391 91,589 17% 80,919 94,170 16% 83,529
Polkton 527,078 550,685 574,433 670,306 17% 592,949 689,171 16% 612,086 708,614 16% 631,845 Wadesboro 926,950 972,177 1,014,073 1,189,932 17% 1,046,732 1,223,382 17% 1,080,483 1,257,855 16% 1,115,332
Ashe County 4,749,056 4,975,068 5,188,898 5,648,188 9% 5,355,440 5,815,846 9% 5,527,290 5,988,336 8% 5,705,201
Jefferson 369,888 387,277 404,239 437,561 8 417,532 450,559 8 431,261 463,931 8 445,473 Lansing 37,237 39,061 40,771 44,251 9% 42,111 45,564 8% 43,495 46,916 8% 44,928
West Jefferson 316,114 331,923 346,454 376,567 9% 357,840 387,743 8% 369,598 399,240 8% 381,771 Avery County 4,262,113 4,469,033 4,662,634 4,416,472 5 4,813,446 4,549,699 5 4,969,364 4,687,289 6 5,130,665
Banner Elk 334,423 351,983 367,423 348,713 (5%) 379,506 359,220 (5%) 392,001 370,070 (6%) 404,929 Beech Mountain * 7,569 7,943 8,292 7,839 (5%) 8,565 8,076 (6%) 8,847 8,320 (6%) 9,139
Crossnore 61,713 65,152 68,008 64,801 (5%) 70,243 66,751 (5%) 72,554 68,765 (5%) 74,945 Elk Park 136,247 142,977 149,252 141,105 (5%) 154,164 145,362 (6%) 159,244 149,758 (6%) 164,499
Grandfather Vil. 7,569 7,943 8,292 7,839 (5%) 8,565 8,076 (6%) 8,847 8,320 (6%) 9,139 Newland 212,312 223,037 232,824 220,424 (5%) 240,485 227,071 (6%) 248,407 233,935 (6%) 256,603
Seven Dev ls * 8,780 9,214 9,619 9,094 5 ) 9,935 9,368 6 ) 10,263 9,651 6 ) 10,601 Sugar Mountain 59,845 62,822 65,579 62,028 (5%) 67,737 63,899 (6%) 69,969 65,831 (6%) 72,278
Beaufort County 8,078,049 8,447,518 8,808,945 8,916,420 1% 9,089,197 9,179,724 1% 9,379,105 9,451,969 1% 9,678,489
Aurora 120,047 125,769 131,265 132,396 1 135,559 136,306 1 140,003 140,349 0 144,594
Bath 57,404 60,147 62,775 63,326 1% 64,829 65,196 1% 66,954 67,130 0% 69,150 Belhaven 386,572 404,927 422,620 426,165 1% 436,448 438,752 1% 450,755 451,767 0% 465,539
FYFY 2016-17 FY 2017-18 FY 2018-19

7/18/2019 Local Sales Tax Distribution Comparison Chart
http://slidepdf.com/reader/full/local-sales-tax-distribution-comparison-chart 2/15
Comparison of Local Sales Tax Distribution Scenarios for Articles 3 9, 40, and 42
2 of 15
FY 2014-15 FY 2015-16
Actual Current Law Current Law 50%/50% Change Current Law 50%/50% Change Current Law 50%/50% Change Current Law
FYFY 2016-17 FY 2017-18 FY 2018-19
Chocowinity 192,393 201,656 210,467 212,407 1% 217,352 218,679 1% 224,476 225,164 0% 231,837
Pantego 41,764 43,787 45,700 46,138 1% 47,195 47,500 1% 48,742 48,909 0% 50,340 Wash ngton 2,274,403 2,384,249 2,488,417 2,511,820 1 2,569,822 2,585,988 1 2,654,044 2,662,674 0 2,741,079
Washington Park 105,426 110,514 115,342 116,421 1% 119,115 119,859 1% 123,019 123,413 0% 127,053 Bertie County 1,777,141 1,834,801 1,895,444 2,415,825 27% 1,937,810 2,459,041 27% 1,981,106 2,502,817 26% 2,025,475
Askewv lle 37,779 39,408 40,946 51,488 26 42,100 52,409 24 43,289 53,341 23 44,515 Aulander 137,724 143,500 149,100 187,192 26% 153,308 190,541 24% 157,640 193,933 23% 162,105
Colerain 31,350 32,686 33,961 42,675 26% 34,919 43,439 24% 35,905 44,211 23% 36,922 Kelford 38,515 40,143 41,710 52,389 26% 42,887 53,326 24% 44,098 54,276 23% 45,347
Lewiston Woodville 85,672 89,318 92,802 116,608 26% 95,421 118,693 24% 98,116 120,805 23% 100,894 Powellsville 42,148 43,884 45,596 57,187 25% 46,884 58,211 24% 48,209 59,248 23% 49,575
Roxobel 36,457 37,947 39,429 49,432 25% 40,542 50,317 24% 41,688 51,213 23% 42,870 W ndsor 555,612 580,490 603,117 760,053 26 620,113 773,622 25 637,609 787,365 23 655,642
Bladen County 4,883,873 5,098,686 5,313,931 6,016,375 13% 5,480,041 6,191,265 13% 5,651,756 6,371,892 13% 5,829,059
Bladenboro 169,906 177,911 185,656 209,141 13% 191,702 215,221 12% 197,955 221,501 12% 204,417 Clarkton 111,541 116,755 121,838 137,179 13 125,806 141,167 12 129,909 145,286 12 134,150
Dublin 30,565 32,000 33,393 37,608 13% 34,480 38,701 12% 35,605 39,831 12% 36,767 East Arcadia 16,708 17,501 18,262 20,581 13% 18,857 21,179 12% 19,472 21,797 12% 20,108
Elizabethtown 602,263 630,778 658,237 741,734 13% 679,672 763,296 12% 701,840 785,565 12% 724,749 Tar Heel 6,073 6,353 6,629 7,457 12% 6,845 7,673 12% 7,069 7,897 12% 7,299
White Lake 253,524 265,590 277,151 312,412 13% 286,176 321,493 12% 295,509 330,872 12% 305,155 Brunswick County 19, 410,746 20,679,787 21,730,995 20,490,712 (6%) 22,592,267 21,358,702 (5%) 23,485,341 22,259,505 (5%) 24,410,903
Bald Head Island 38,797 41,184 43,221 40,904 5 ) 44,877 42,636 5 ) 46,594 44,434 5 ) 48,372 Belville 483,545 513,523 538,926 510,360 (5%) 559,581 531,978 (5%) 580,989 554,414 (5%) 603,169
B oi li ng S pr ing L ak es 1, 37 5,4 77 1,461,530 1,533,836 1,453,613 (5%) 1,592,635 1,515,201 (5%) 1,653,576 1,579,118 (5%) 1,716,713 Bol v a 34,538 36,668 38,482 36,427 5 ) 39,957 37,970 5 ) 41,485 39,571 5 ) 43,069
Calabash 445,501 472,672 496,048 469,134 (5%) 515,054 488,997 (5%) 534,752 509,611 (5%) 555,160 Carolina Shores 763,202 810,520 850,613 805,529 (5%) 883,215 839,650 (5%) 917,005 875,061 (5%) 952,012
Caswell Beach 99,116 105,238 110,443 104,557 (5%) 114,676 108,986 (5%) 119,063 113,582 (5%) 123,608 Holden Beach 141,231 149,938 157,354 148,947 (5%) 163,385 155,255 (5%) 169,635 161,801 (5%) 176,110
Leland 3,594,838 3,824,134 4,013,387 3,809,565 (5%) 4,167,298 3,971,060 (5%) 4,326,817 4,138,661 (4%) 4,492,084 Navassa 381,724 405,289 425,335 402,650 (5%) 441,636 419,703 (5%) 458,530 437,402 (5%) 476,034
Northwest 183,106 194,384 203,999 193,085 5 ) 211,817 201,262 5 ) 219,919 209,748 5 ) 228,314 Oak Island 1,665,916 1,768,559 1,856,035 1,756,772 (5%) 1,927,163 1,831,174 (5%) 2,000,883 1,908,389 (5%) 2,077,258
Ocean Isle Beach 138,513 147,132 154,410 146,269 (5%) 160,329 152,466 (5%) 166,463 158,896 (5%) 172,818 St James 845,443 900,214 944,776 897,965 5 ) 981,020 936,048 5 ) 1,018,584 975,571 4 ) 1,057,501
Sandy Creek 64,192 68,141 71,511 67,679 (5%) 74,252 70,545 (5%) 77,092 73,520 (5%) 80,035 Shallotte 943,848 1,002,874 1,052,489 997,409 (5%) 1,092,836 1,039,668 (5%) 1,134,652 1,083,524 (5%) 1,177,974
Southport 718,034 762,526 800,245 757,796 5 ) 830,916 789,895 5 ) 862,705 823,207 5 ) 895,638 Sunset Beach 894,575 949,989 996,981 944,071 (5%) 1,035,192 984,060 (5%) 1,074,795 1,025,561 (5%) 1,115,825
Varnamtown 134,601 142,910 149,979 141,980 (5%) 155,726 147,993 (5%) 161,684 154,234 (5%) 167,856 Buncombe County 59, 558,668 62,836,114 65,752,867 60,318,423 (8%) 68,079,476 62,472,925 (8%) 70,488,245 64,704,033 (8%) 72,981,048
Asheville 18,806,684 19,838,764 20,758,236 19,047,229 (8%) 21,491,393 19,727,574 (8%) 22,250,402 20,432,110 (8%) 23,035,904 Biltmore Forest 894,118 941,592 985,231 902,418 (8%) 1,020,026 934,649 (8%) 1,056,048 968,025 (8%) 1,093,327
Black Mountain 1,377,027 1,451,687 1,518,967 1,392,850 (8%) 1,572,614 1,442,599 (8%) 1,628,153 1,494,118 (8%) 1,685,630 Montreat 355,491 374,891 392,266 359,824 8 ) 406,120 372,676 8 ) 420,463 385,985 8 ) 435,306
Weaverville 973,151 1,024,984 1,072,487 982,505 (8%) 1,110,365 1,017,596 (8%) 1,149,577 1,053,935 (8%) 1,190,158 Woodfin 735,932 776,548 812,539 745,797 (8%) 841,238 772,436 (8%) 870,948 800,023 (8%) 901,695
Burke County 11,127,785 11,599,348 12,086,082 13,302,377 1 0 12,461,203 13,685,826 10 12,848,897 14,081,730 1 0 13,249,098
Connelly Springs 316,833 331,624 346,022 378,958 10% 357,257 389,880 9% 368,875 401,158 9% 380,880
7/18/2019 Local Sales Tax Distribution Comparison Chart
http://slidepdf.com/reader/full/local-sales-tax-distribution-comparison-chart 3/15
Comparison of Local Sales Tax Distribution Scenarios for Articles 3 9, 40, and 42
3 of 15
FY 2014-15 FY 2015-16
Actual Current Law Current Law 50%/50% Change Current Law 50%/50% Change Current Law 50%/50% Change Current Law
FYFY 2016-17 FY 2017-18 FY 2018-19
Drexel 356,630 373,496 389,710 427,156 10% 402,362 439,465 9% 415,445 452,174 9% 428,964
Glen Alpine 291,307 305,099 318,344 348,957 10% 328,679 359,013 9% 339,366 369,395 9% 350,409 H ckory * 12,883 13,506 14,093 15,469 10 14,550 15,915 9 15,023 16,375 9 15,512
Hildebran 383,834 401,744 419,187 459,073 10% 432,798 472,305 9% 446,873 485,967 9% 461,416 Long View * 143,146 149,849 156,355 171,269 10% 161,431 176,205 9% 166,681 181,302 9% 172,105
Morganton 3,237,228 3,389,745 3,536,908 3,875,815 10 3,651,736 3,987,512 9 3,770,480 4,102,836 9 3,893,181 Rhodhiss * 137,339 143,919 150,166 164,733 10% 155,041 169,479 9% 160,081 174,380 9% 165,290
Rutherford College 261,129 273,906 285,793 313,944 10% 295,068 322,986 9% 304,659 332,322 9% 314,569 Valdese 857,627 898,203 937,197 1,027,274 10% 967,622 1,056,877 9% 999,085 1,087,441 9% 1,031,596
Cabarrus County 35,470,424 37,679,131 39,549,305 37,107,603 (6%) 41,050,004 38,607,914 (6%) 42,585,399 40,129,618 (6%) 44,167,498
Concord 14,449,976 15,323,747 16,072,626 15,114,808 (6%) 16,672,581 15,725,906 (6%) 17,287,809 16,345,720 (5%) 17,922,310
Harrisburg 1,422,754 1,508,649 1,582,375 1,487,882 (6%) 1,641,440 1,548,035 (6%) 1,702,009 1,609,047 (5%) 1,764,476 Kannapol s * 5,522,507 5,855,439 6,141,584 5,774,163 6 ) 6,370,825 6,007,599 6 ) 6,605,903 6,244,366 5 ) 6,848,346 Locust * 54,459 57,650 60,466 56,719 (6%) 62,722 59,011 (6%) 65,036 61,335 (6%) 67,422
Midland 205,367 218,356 229,035 216,194 (6%) 237,590 224,944 (5%) 246,363 233,817 (5%) 255,409 Mount Pleasant 213,841 226,689 237,766 223,479 6 ) 246,640 232,513 6 ) 255,741 241,676 5 ) 265,126
Caldwell County 9,257,317 9,665,245 10,068,463 10,914,573 8% 10,378,848 11,227,615 8% 10,699,612 11,550,808 8% 11,030,972
Blowing Rock * 19,430 20,314 21,195 22,791 8% 21,882 23,445 7% 22,593 24,121 7% 23,328
Cajah's Mountain 499,974 523,782 546,483 589,259 8% 564,197 606,160 7% 582,514 623,610 7% 601,451 Cedar Rock 53,074 55,616 58,026 62,590 8% 59,907 64,385 7% 61,851 66,239 7% 63,862
Gamewell 722,285 756,802 789,602 851,596 8% 815,195 876,020 7% 841,660 901,237 7% 869,020 Granite Falls 841,090 881,467 919,668 992,153 8% 949,475 1,020,607 7% 980,298 1,049,983 7% 1,012,163
H ckory * 3,418 3,582 3,737 4,031 8 3,858 4,147 7 3,984 4,266 7 4,113 Hudson 696,803 730,547 762,205 822,729 8% 786,906 846,320 8% 812,449 870,677 7% 838,856
Lenoir 3,222,162 3,376,598 3,522,937 3,800,224 8% 3,637,119 3,909,213 7 % 3,755,192 4,021,736 7% 3,877,261 Rhodh ss * 65,247 68,342 71,304 76,866 8 73,615 79,070 7 76,005 81,347 7 78,476
Sawmills 930,202 974,600 1,016,840 1,096,591 8% 1,049,799 1,128,043 7 % 1,083,880 1,160,515 7% 1,119,115 Camden County 1,434,853 1,509,659 1,577,161 1,983,701 26% 1,629,570 2,047,013 26% 1,683,121 2,111,046 25% 1,737,940
Elizabeth City * 9,236 9,735 10,174 12,808 26% 10,518 13,216 26% 10,871 13,630 25% 11,233 Carteret County 14,358,874 15,079,605 15,744,477 14,404,003 (9%) 16,266,068 14,860,341 (9%) 16,805,396 15,331,801 (9%) 17,363,347
Atlantic Beach 1,021,682 1,073,362 1,121,150 1,024,242 (9%) 1,158,765 1,056,694 (9%) 1,197,669 1,090,222 (9%) 1,237,920 Beaufort 930,691 970,216 1,013,468 914,437 (10%) 1,047,530 943,504 (10%) 1,082,759 973,535 (10%) 1,119,209
Bogue 14,070 14,790 15,448 14,121 9 ) 15,966 14,569 9 ) 16,502 15,031 9 ) 17,057 Cape Carteret 237,977 250,106 261,241 238,750 (9%) 270,005 246,314 (9%) 279,069 254,129 (9%) 288,448
Cedar Point 89,935 94,572 98,782 90,330 (9%) 102,096 93,191 (9%) 105,523 96,147 (9%) 109,069 Emerald Isle 1,634,625 1,719,644 1,796,191 1,643,244 9 ) 1,856,442 1,695,290 9 ) 1,918,755 1,749,061 9 ) 1,983,227
Indian Beach 310,475 341,870 356,981 346,072 (3%) 368,847 356,876 (3%) 381,116 368,035 (3%) 393,810 Morehead City 2,238,200 2,355,659 2,460,512 2,252,031 (8%) 2,543,040 2,323,351 (9%) 2,628,394 2,397,034 (9%) 2,716,704
Newport 412,329 433,575 452,876 414,115 9 ) 468,068 427,233 9 ) 483,780 440,785 9 ) 500,037 Peletier 15,211 15,991 16,703 15,271 (9%) 17,264 15,755 (9%) 17,843 16,254 (9%) 18,443
Pine Knoll Shores 723,076 759,975 793,808 725,514 (9%) 820,439 748,498 (9%) 847,982 772,245 (9%) 876,479 Caswell County 2,550,459 2,649,357 2,755,245 3,832,614 39% 2,836,625 3,935,767 39% 2,920,120 4,041,022 38% 3,006,532
Milton 13,468 14,071 14,669 20,230 38% 15,135 20,775 37% 15,615 21,330 37% 16,112 Yanceyville 138,123 144,302 150,426 207,438 38% 155,207 213,022 37% 160,132 218,719 37% 165,229
Catawba County 25,981,541 27,258,522 28,455,203 27,923,447 (2%) 29,392,545 28,792,943 (2%) 30,361,648 29,690,927 (2%) 31,363,988
Brookford 83,563 87,766 91,664 89,810 2 ) 94,729 92,607 2 ) 97,899 95,495 2 ) 101,179
Catawba 133,025 139,746 145,952 143,044 (2%) 150,832 147,498 (2%) 155,880 152,098 (2%) 161,101 Claremont 308,460 324,202 338,599 332,081 (2%) 349,920 342,419 (2%) 361,629 353,096 (2%) 373,741
Conover 1,816,574 1,908,672 1,993,432 1,954,178 2 ) 2,060,090 2,015,021 2 ) 2,129,026 2,077,857 2 ) 2,200,338 Hickory * 8,836,000 9,283,187 9,695,438 9,503,392 (2%) 10,019,647 9,799,285 (2%) 10,354,933 10,104,871 (2%) 10,701,778
7/18/2019 Local Sales Tax Distribution Comparison Chart
http://slidepdf.com/reader/full/local-sales-tax-distribution-comparison-chart 4/15
Comparison of Local Sales Tax Distribution Scenarios for Articles 3 9, 40, and 42
4 of 15
FY 2014-15 FY 2015-16
Actual Current Law Current Law 50%/50% Change Current Law 50%/50% Change Current Law 50%/50% Change Current Law
FYFY 2016-17 FY 2017-18 FY 2018-19
Long View * 910,383 956,491 998,967 979,229 (2%) 1,032,372 1,009,717 (2%) 1,066,918 1,041,205 (2%) 1,102,655
Maiden * 743,621 781,586 816,293 800,598 (2%) 843,587 825,521 (2%) 871,814 851,261 (2%) 901,013 Newton 2,867,994 3,013,309 3,147,124 3,085,025 2 ) 3,252,361 3,181,077 2 ) 3,361,193 3,280,276 2 ) 3,473,777
Chatham County 9,903,008 10,493,403 10,999,974 12,003,301 9% 11,408,906 12,466,041 9% 11,832,578 12,945,713 9% 12,271,066
Cary * 420,792 447,706 469,013 517,290 10% 486,144 537,249 11% 503,887 557,939 11% 522,250
Goldston 58,550 61,897 64,842 70,867 9 67,208 73,598 10 69,659 76,430 10 72,196 Pittsboro 878,014 929,569 973,789 1,066,501 10% 1,009,334 1,107,621 10% 1,046,150 1,150,246 10% 1,084,253
Siler City 1,756,141 1,857,092 1,945,424 2,127,086 9% 2,016,426 2,209,084 10% 2,089,964 2,294,083 10% 2,166,076 Cherokee County 5,521,765 5,776,474 6,025,407 6,200,307 3% 6,219,136 6,383,369 3% 6,419,407 6,572,362 2% 6,626,451
Andrews 458,145 480,316 501,329 515,045 3% 517,770 530,248 2% 534,771 545,944 2% 552,352 Murphy 420,558 440,750 460,033 472,371 3% 475,121 486,317 2% 490,723 500,715 2% 506,857
Chowan County 2,390,085 2,488,511 2,593,325 2,779,136 7% 2,674,150 2,859,145 7% 2,757,597 2,941,596 7% 2,843,860
Edenton 491,394 513,757 536,034 571,724 7 553,399 588,182 6 571,343 605,142 6 589,900 Clay County 1,903,933 1,995,516 2,075,725 2,344,769 13% 2,145,040 2,419,861 13% 2,209,614 2,482,803 12% 2,282,184
Hayesville 31,706 33,286 34,675 39,063 13% 35,848 40,313 12% 36,974 41,362 12% 38,210 Cleveland County 16,426,387 17,225,641 17,976,656 18,923,340 5 18,561,597 19,503,156 5 19,164,368 20,098,350 5 19,785,854
Belwood - - - - - - - - -
Boiling Springs 305,073 320,056 334,223 350,688 5% 345,328 361,435 5% 356,785 372,468 4% 368,612
Casar 2,414 2,532 2,644 2,773 5% 2,732 2,857 5% 2,822 2,945 4% 2,916 Earl 6,451 6,768 7,068 7,418 5% 7,303 7,645 5% 7,545 7,878 4% 7,795
Fallston 7,973 8,363 8,733 9,162 5% 9,024 9,443 5% 9,323 9,731 4% 9,632 Grover 51,472 53,978 56,368 59,113 5% 58,241 60,925 5% 60,173 62,784 4% 62,168
K ngs Mounta n * 1,267,653 1,335,194 1,394,268 1,470,745 5 1,440,560 1,515,773 5 1,488,323 1,561,993 5 1,537,622 Kingstown 30,948 32,484 33,922 35,617 5% 35,049 36,709 5% 36,212 37,829 4% 37,412
Lattimore 11,852 12,403 12,952 13,545 5% 13,383 13,961 4% 13,827 14,387 4% 14,286 Lawndale 10,921 13,552 14,139 18,056 28 14,596 18,590 27 15,066 19,137 27 15,551
Mooresboro - - - - - - - - - Patterson Springs - - - - - - - - -
Polkville 5,098 5,348 5,585 5,860 5% 5,770 6,039 5% 5,962 6,224 4% 6,159 Shelby 2,932,884 3,077,390 3,213,613 3,372,609 5% 3,320,382 3,475,967 5 % 3,430,546 3,582,069 4% 3,544,258
Waco 8,646 9,073 9,475 9,945 5% 9,789 10,250 5% 10,114 10,563 4% 10,449 Columbus County 6,864,665 7,166,648 7,470,958 9,056,538 21% 7,706,648 9,315,415 21% 7,950,093 9,582,235 21% 8,201,789
Boardman 26,277 27,499 28,696 34,624 21 29,632 35,613 20 30,600 36,634 20 31,601 Bolton 118,139 123,845 129,237 156,379 21% 133,451 160,847 21% 137,806 165,452 20% 142,311
Brunswick 189,582 198,405 207,047 249,825 21% 213,800 256,968 20% 220,780 264,329 20% 228,000 Cerro Gordo 34,826 36,455 38,043 45,920 21 39,283 47,233 20 40,566 48,586 20 41,892
Chadbourn 314,081 329,151 343,484 415,413 21% 354,684 427,283 20% 366,261 439,517 20% 378,233 Fair Bluff 161,515 169,256 176,627 213,595 21% 182,386 219,698 20% 188,339 225,989 20% 194,495
Lake Waccamaw 253,752 266,234 277,825 336,651 21 286,881 346,266 21 296,242 356,176 20 305,923 Sandyfield 78,005 81,913 85,479 103,729 21% 88,265 106,691 21% 91,144 109,744 20% 94,122
Tabor City 666,973 697,847 728,244 878,359 21% 752,000 903,473 20% 776,553 929,358 20% 801,948 Whiteville 921,247 965,658 1,007,706 1,219,162 21% 1,040,562 1,253,996 21% 1,074,522 1,289,898 20% 1,109,646
Craven County 14,091,289 14,758,549 15,420,024 15,960,671 4% 15,946,764 16,497,041 3% 16,494,394 17,056,252 3% 17,062,383
Bridgeton 152,727 160,321 167,569 173,053 3% 173,339 178,868 3% 179,329 184,932 3% 185,538
Cove City 11,982 12,580 13,148 13,582 3% 13,601 14,039 3% 14,071 14,514 3% 14,558 Dover 21,257 22,318 23,327 24,095 3 24,130 24,905 3 24,964 25,749 3 25,828
Havelock 1,948,125 2,044,415 2,136,838 2,205,975 3% 2,210,422 2,280,109 3 % 2,286,810 2,357,399 3% 2,365,982 New Bern 5,768,599 6,052,928 6,326,569 6,530,158 3% 6,544,431 6,749,613 3 % 6,770,594 6,978,412 3% 7,005,001
R ver Bend 386,751 405,941 424,292 438,122 3 438,903 452,845 3 454,070 468,196 3 469,790 Trent Woods 479,155 502,900 525,635 542,729 3% 543,736 560,968 3% 562,526 579,983 3% 582,001
7/18/2019 Local Sales Tax Distribution Comparison Chart
http://slidepdf.com/reader/full/local-sales-tax-distribution-comparison-chart 5/15
Comparison of Local Sales Tax Distribution Scenarios for Articles 3 9, 40, and 42
5 of 15
FY 2014-15 FY 2015-16
Actual Current Law Current Law 50%/50% Change Current Law 50%/50% Change Current Law 50%/50% Change Current Law
FYFY 2016-17 FY 2017-18 FY 2018-19
Vanceboro 113,730 119,356 124,751 128,794 3% 129,047 133,123 3% 133,507 137,635 3% 138,129 C umb er la nd Co un ty 40 ,05 1, 29 3 41,892,440 43,760,377 43,834,076 0% 45,230,874 45,262,840 0% 46,752,190 46,740,441 (0%) 48,325,353
Eastover 653,346 685,104 715,956 715,373 0 ) 740,329 738,690 0 ) 765,547 762,803 0 ) 791,633
Falcon * 57,129 60,009 62,711 62,817 0% 64,845 64,864 0% 67,053 66,981 (0%) 69,338 Fayetteville 36,843,523 38,637,032 40,376,922 40,347,983 (0%) 41,751,435 41,663,059 (0%) 43,173,645 43,023,085 (0%) 44,644,748
Godw n 24,621 25,795 26,957 26,900 0 ) 27,875 27,777 0 ) 28,824 28,684 0 ) 29,807 Hope Mills 2,778,693 2,915,507 3,046,791 3,046,977 0% 3,150,504 3,146,279 (0%) 3,257,816 3,248,975 (0%) 3,368,817
Linden 22,809 23,908 24,985 24,950 (0%) 25,835 25,764 (0%) 26,715 26,605 (0%) 27,626 Spring Lake 2,103,023 2,209,012 2,308,474 2,312,349 0% 2,387,044 2,387,693 0 % 2,468,342 2,465,613 (0%) 2,552,433
Stedman 187,543 196,735 205,594 205,542 (0%) 212,593 212,241 (0%) 219,834 219,169 (0%) 227,324 Wade 99,655 104,459 109,163 109,014 (0%) 112,880 112,567 (0%) 116,725 116,242 (0%) 120,702
Currituck County 8,396,524 8,876,976 9,296,372 8,588,748 (8%) 9,632,490 8,911,830 (7%) 9,980,939 9,247,403 (7%) 10,341,424
Dare County 17,388,187 18,301,227 19,125,234 14,579,012 24 19,775,562 15,064,071 24 20,447,862 15,565,063 24 21,142,555
Duck 975,480 1,027,797 1,074,126 819,248 (24%) 1,110,705 846,497 (24%) 1,148,524 874,642 (24%) 1,187,605
Kill Devil Hills 1,933,498 2,033,912 2,125,610 1,619,389 (24%) 2,198,018 1,673,277 (24%) 2,272,879 1,728,935 (24%) 2,350,241 K tty Hawk 957,090 1,007,570 1,052,992 802,653 24 ) 1,088,857 829,357 24 ) 1,125,937 856,938 24 ) 1,164,256
Manteo 569,626 599,548 626,576 477,545 (24%) 647,918 493,433 (24%) 669,983 509,844 (24%) 692,785 Nags Head 2,317,226 2,438,361 2,548,289 1,941,851 (24%) 2,635,092 2,006,464 (24%) 2,724,833 2,073,199 (24%) 2,817,574
Southern Shores 857,824 902,237 942,915 718,279 (24%) 975,036 742,182 (24%) 1,008,245 766,871 (24%) 1,042,563 Davidson County 18,799,761 19,692,297 20,539,647 23,207,768 13% 21,198,424 23,913,534 13% 21,879,438 24,642,520 13% 22,583,269
Denton 292,157 306,775 320,310 360,863 13% 330,928 371,836 12% 341,910 383,171 12% 353,266 High Point * 1,012,622 1,065,225 1,112,211 1,256,259 13% 1,149,069 1,294,445 13% 1,187,189 1,333,887 12% 1,226,608
Lex ngton 3,375,898 3,544,505 3,700,889 4,168,919 13 3,823,573 4,295,695 12 3,950,458 4,426,642 12 4,081,667 Midway 852,024 894,855 934,334 1,052,957 13% 965,306 1,084,975 12% 997,337 1,118,047 12% 1,030,461
Thomasville * 4,808,636 5,050,371 5,273,185 5,942,682 13% 5,447,981 6,123,385 12% 5,628,762 6,310,032 12% 5,815,705 Wallburg 555,039 582,995 608,715 686,089 13 628,893 706,950 12 649,761 728,499 12 671,340
Davie County 6,070,817 6,348,198 6,617,955 7,368,344 11% 6,826,768 7,580,358 11% 7,042,463 7,798,929 11% 7,265,419
Bermuda Run 516,795 541,915 565,494 628,051 11% 583,903 646,119 11% 602,931 664,746 10% 622,607
Cooleemee 197,881 207,480 216,507 240,425 11% 223,556 247,342 11% 230,841 254,472 10% 238,375 Mocksville 1,051,163 1,102,025 1,149,976 1,276,788 11% 1,187,414 1,313,521 11% 1,226,111 1,351,391 10% 1,266,126
Duplin County 7,277,185 7,613,910 7,947,532 9,153,749 15% 8,208,612 9,443,892 15% 8,478,544 9,743,672 15% 8,757,751
Beulaville 258,004 270,978 283,072 325,431 15% 292,598 335,745 15% 302,451 346,401 15% 312,645
Calypso 107,258 112,603 117,629 135,148 15 121,587 139,431 15 125,682 143,857 14 129,918 Faison 191,544 201,105 210,081 241,397 15% 217,151 249,047 15% 224,464 256,952 14% 232,030
Greenevers 125,724 131,995 137,886 158,432 15% 142,527 163,453 15% 147,326 168,641 14% 152,292 Harrells * 4,633 4,861 5,078 5,829 15 5,249 6,013 15 5,425 6,204 14 5,608
Kenansville 163,699 171,634 179,295 205,620 15% 185,330 212,138 14% 191,572 218,873 14% 198,030 Magnolia 186,332 195,637 204,369 234,839 15% 211,247 242,282 15% 218,361 249,972 14% 225,721
Mount Ol ve * 10,165 10,683 11,160 12,841 15 11,536 13,248 15 11,924 13,669 15 12,326 Rose Hill 324,342 340,595 355,796 408,940 15% 367,770 421,901 15% 380,155 435,292 15% 392,968
Teachey 74,380 78,073 81,557 93,680 15% 84,302 96,649 15% 87,141 99,717 14% 90,078 Wallace * 765,747 803,656 839,526 964,138 15% 867,781 994,697 15% 897,005 1,026,270 14% 927,241
Warsaw 599,673 629,439 657,533 755,264 15% 679,662 779,202 15% 702,551 803,935 14% 726,232 Durham County 48,213,200 51,101,683 53,560,152 47,575,531 (11%) 55,542,890 49,404,485 (11%) 57,596,257 51,299,238 (11%) 59,722,526
Chapel Hill * 721,012 763,811 800,186 712,805 (11%) 829,437 740,214 (11%) 859,725 768,610 (11%) 891,085 Durham * 53,064,749 56,174,419 58,849,310 52,373,306 11 ) 61,000,193 54,386,755 11 ) 63,227,395 56,472,641 11 ) 65,533,421
Morrisville * - - - - - - - - - Raleigh * 267,912 284,320 297,864 265,959 (11%) 308,756 276,191 (11%) 320,035 286,792 (10%) 331,713
Edgecombe County 4,342,351 4,503,565 4,682,214 5,436,226 16 4,817,012 5,584,300 16 4,956,077 5,736,899 16 5,099,556
Conetoe 43,477 45,442 47,385 54,444 15% 48,893 55,927 14% 50,452 57,455 14% 52,062
7/18/2019 Local Sales Tax Distribution Comparison Chart
http://slidepdf.com/reader/full/local-sales-tax-distribution-comparison-chart 6/15
Comparison of Local Sales Tax Distribution Scenarios for Articles 3 9, 40, and 42
6 of 15
FY 2014-15 FY 2015-16
Actual Current Law Current Law 50%/50% Change Current Law 50%/50% Change Current Law 50%/50% Change Current Law
FYFY 2016-17 FY 2017-18 FY 2018-19
Leggett 8,986 9,412 9,814 11,310 15% 10,126 11,618 15% 10,449 11,935 14% 10,782
Macclesfield 70,034 73,245 76,376 87,831 15% 78,806 90,223 14% 81,318 92,688 14% 83,914 P netops 203,074 212,328 221,405 254,517 15 228,451 261,449 14 235,733 268,592 14 243,259
Princeville 323,436 338,747 353,225 407,013 15% 364,460 418,090 15% 376,072 429,506 14% 388,072 Rocky Mount * 2,566,007 2,683,003 2,797,707 3,216,222 15% 2,886,741 3,303,811 14% 2,978,753 3,394,075 14% 3,073,847
Sharpsburg * 30,826 32,211 33,588 38,579 15 34,658 39,630 14 35,762 40,712 14 36,904 Speed 11,998 12,562 13,099 15,088 15% 13,516 15,498 15% 13,947 15,921 14% 14,392
Tarboro 1,698,098 1,776,379 1,852,316 2,130,848 15% 1,911,256 2,188,868 15% 1,972,167 2,248,660 14% 2,035,118 Whitakers * 59,141 61,824 64,467 74,088 15% 66,519 76,106 14% 68,639 78,186 14% 70,831
Forsyth County 60,050,143 63,298,888 66,212,898 64,737,549 (2%) 68,536,692 67,013,214 (2%) 70,945,496 69,375,333 (2%) 73,440,676
Bethania 32,352 34,056 35,624 34,765 (2%) 36,873 35,987 (2%) 38,168 37,256 (2%) 39,509 Clemmons 749,057 789,206 825,531 806,646 (2%) 854,486 835,001 (2%) 884,490 864,434 (2%) 915,563 H gh Po nt * 4,203 4,426 4,630 4,521 2 ) 4,792 4,680 2 ) 4,961 4,844 2 ) 5,135 Kernersville * 4,082,699 4,303,787 4,501,881 4,402,238 (2%) 4,659,781 4,556,986 (2%) 4,823,402 4,717,614 (2%) 4,992,859
King * 87,466 92,213 96,458 94,339 (2%) 99,841 97,655 (2%) 103,347 101,097 (2%) 106,978 Lew sv lle 717,822 755,972 790,768 772,198 2 ) 818,503 799,342 2 ) 847,243 827,517 2 ) 877,008
Rural Hall 335,797 354,409 370,721 363,147 (2%) 383,724 375,913 (2%) 397,198 389,163 (2%) 411,153 Tobaccoville * 29,946 31,549 33,001 32,243 (2%) 34,158 33,376 (2%) 35,358 34,553 (2%) 36,600
Walkertown 258,197 271,811 284,322 277,486 (2%) 294,295 287,240 (2%) 304,628 297,365 (2%) 315,330 Winston-Salem 34,737,191 36,619,980 38,305,515 37,460,157 (2%) 39,649,056 38,776,965 (2%) 41,041,272 40,143,800 (2%) 42,483,145
Franklin County 8,819,779 9,301,264 9,725,006 11,552,893 19% 10,063,430 11,952,855 19% 10,412,160 12,363,753 19% 10,773,257
Bunn 51,130 53,881 56,343 66,869 19% 58,308 69,184 19% 60,335 71,563 19% 62,434
Centerv lle - - - - - - - - - Franklinton 230,739 242,969 254,073 301,159 19% 262,931 311,586 19% 272,072 322,297 18% 281,536
Louisburg 474,292 499,803 522,645 620,277 19% 540,867 641,751 19% 559,670 663,813 19% 579,138 Wake Forest * 108,973 114,961 120,215 142,933 19 124,406 147,881 19 128,731 152,965 19 133,209
Youngsville 276,593 291,645 304,973 362,304 19% 315,606 374,847 19% 326,578 387,733 19% 337,938 Gaston County 30,991,786 32,567,371 34,026,272 35,124,542 3% 35,180,334 36,288,952 3% 36,374,638 37,493,795 3% 37,609,665
Belmont 1,799,380 1,891,968 1,977,410 2,037,723 3% 2,045,127 2,105,278 3 % 2,115,207 2,175,179 3% 2,187,696 Bessemer City 486,435 511,420 534,516 550,761 3% 552,821 569,020 3% 571,764 587,913 3% 591,359
Cherryville 560,885 589,586 616,212 634,795 3% 637,315 655,840 3% 659,154 677,616 3% 681,744 Cramerton 668,494 702,436 734,160 755,950 3% 759,302 781,013 3% 785,322 806,947 3% 812,237
Dallas 340,492 358,082 374,253 385,760 3 387,069 398,549 3 400,332 411,781 3 414,052 Gastonia 9,499,503 9,990,135 10,441,291 10,762,182 3% 10,798,848 11,118,964 3% 11,168,887 11,488,135 3% 11,551,646
High Shoals * 40,903 42,971 44,912 46,233 3% 46,450 47,766 3% 48,042 49,352 3% 49,688 K ngs Mounta n * 185,049 194,526 203,311 209,452 3 210,273 216,395 3 217,479 223,580 3 224,932
Lowell 348,653 366,434 382,983 394,454 3% 396,098 407,531 3% 409,672 421,063 3% 423,712 McAdenville 111,198 116,887 122,166 125,848 3% 126,349 130,020 3% 130,679 134,337 3% 135,157
Mount Holly 1,935,545 2,034,813 2,126,707 2,191,143 3 2,199,537 2,263,785 3 2,274,909 2,338,950 3 2,352,873 Ranlo 230,577 242,377 253,323 260,966 3% 261,999 269,617 3% 270,977 278,570 3% 280,263
Spencer Mountain - - - - - - - - - Stanley 453,504 476,758 498,289 513,381 3% 515,353 530,401 3% 533,013 548,012 3% 551,280
Gates County 1,395,186 1,456,400 1,515,854 2,062,897 36% 1,561,003 2,118,711 36% 1,607,756 2,176,521 35% 1,655,736
Gatesville 59,680 62,531 65,208 88,243 35% 67,282 90,631 35% 69,430 93,104 34% 71,641
Graham County 1,381,584 1,447,723 1,512,725 1,751,110 16% 1,564,006 1,809,042 16% 1,616,997 1,868,828 16% 1,672,001
Fontana Dam 1,482 1,594 1,666 1,969 18 1,722 2,034 18 1,781 2,102 18 1,841
Robbinsville 105,869 111,205 116,235 134,421 16% 120,214 138,868 16% 124,328 143,457 15% 128,594 Lake Santeetlah 32,849 34,640 36,207 42,129 16% 37,446 43,522 16% 38,727 44,960 16% 40,056
Granv lle County 5,929,354 6,198,462 6,462,949 7,435,171 15 6,667,911 7,660,705 15 6,879,810 7,893,738 15 7,098,671
Butner 1,352,812 1,419,852 1,482,411 1,699,225 15% 1,531,460 1,750,761 14% 1,582,195 1,804,010 14% 1,634,645
7/18/2019 Local Sales Tax Distribution Comparison Chart
http://slidepdf.com/reader/full/local-sales-tax-distribution-comparison-chart 7/15
Comparison of Local Sales Tax Distribution Scenarios for Articles 3 9, 40, and 42
7 of 15
FY 2014-15 FY 2015-16
Actual Current Law Current Law 50%/50% Change Current Law 50%/50% Change Current Law 50%/50% Change Current Law
FYFY 2016-17 FY 2017-18 FY 2018-19
Creedmoor 747,869 785,765 820,381 941,774 15% 847,521 970,331 14% 875,594 999,838 14% 904,615
Oxford 1,488,150 1,561,542 1,630,345 1,868,198 15% 1,684,291 1,924,862 14% 1,740,091 1,983,409 14% 1,797,778 Stem 89,145 93,799 97,931 112,653 15 101,170 116,068 15 104,520 119,596 14 107,984
Stovall 73,325 76,965 80,356 92,119 15% 83,015 94,913 14% 85,765 97,800 14% 88,608 Greene County 2,265,847 2,366,119 2,461,654 3,389,541 38% 2,534,268 3,480,623 37% 2,609,107 3,574,246 37% 2,686,391
Hookerton 30,283 31,672 33,024 45,044 36 34,073 46,255 36 35,156 47,500 35 36,276 Snow Hill 154,212 161,722 168,623 230,962 37% 173,976 237,167 36% 179,503 243,546 36% 185,217
Walstonburg 24,136 25,258 26,336 35,956 37% 27,172 36,922 36% 28,036 37,916 35% 28,929 Guilford County 75,283,908 79,328,799 82,927,246 82,439,533 (1%) 85,770,452 85,210,550 (1%) 88,706,185 88,065,257 (1%) 91,737,121
Archdale * 19,921 21,001 21,957 21,834 (1%) 22,714 22,568 (1%) 23,496 23,324 (1%) 24,303
Burlington * 125,063 132,023 138,032 137,449 (0%) 142,789 142,069 (1%) 147,703 146,827 (1%) 152,779 Gibsonville * 341,742 360,138 376,531 374,262 (1%) 389,507 386,842 (1%) 402,912 399,802 (1%) 416,761 Greensboro 43,146,318 45,474,085 47,543,952 47,263,091 1 ) 49,182,338 48,851,713 1 ) 50,875,044 50,488,311 1 ) 52,623,726 High Point * 15,555,184 16,392,058 17,138,187 17,034,393 (1%) 17,728,781 17,606,964 (1%) 18,338,956 18,196,828 (1%) 18,969,310
Jamestown 480,990 507,644 530,749 528,382 (0%) 549,038 546,140 (1%) 567,932 564,434 (1%) 587,452 Kernersv lle * 95,222 100,389 104,958 104,370 1 ) 108,575 107,878 1 ) 112,312 111,492 1 ) 116,172
Oak Ridge 200,412 211,277 220,894 219,646 (1%) 228,506 227,028 (1%) 236,370 234,634 (1%) 244,494 Pleasant Garden 25,027 26,381 27,582 27,423 (1%) 28,532 28,345 (1%) 29,514 29,294 (1%) 30,529
Sedalia 35,447 37,355 39,055 38,820 (1%) 40,401 40,125 (1%) 41,792 41,469 (1%) 43,228 Stokesdale - - - - - - - - -
Summerfield 128,418 135,351 141,512 140,682 (1%) 146,389 145,410 (1%) 151,427 150,282 (1%) 156,632 Whitsett 7,099 7,481 7,821 7,774 (1%) 8,091 8,036 (1%) 8,369 8,305 (1%) 8,657
Hal fax County 6,808,258 7,072,221 7,357,060 7,764,337 6 7,573,137 7,965,277 5 7,796,295 8,172,422 5 8,026,478
Enfield 252,487 263,573 274,705 287,917 5% 283,304 295,369 4% 292,192 303,050 4% 301,371
Halifax 26,664 27,835 29,011 30,407 5% 29,919 31,194 4% 30,858 32,005 4% 31,827 Hobgood 24,131 25,188 26,251 27,510 5 27,073 28,222 4 27,923 28,956 4 28,800
Littleton 89,589 93,510 97,459 102,131 5% 100,510 104,774 4% 103,664 107,499 4% 106,921 Roanoke Rapids 3,383,532 3,531,581 3,680,735 3,857,078 5% 3,795,955 3,956,909 4 % 3,915,050 4,059,823 4% 4,038,054
Scotland Neck 240,769 251,295 261,908 274,443 5% 270,107 281,547 4% 278,581 288,869 4% 287,334 Weldon 496,002 517,733 539,599 565,489 5% 556,490 580,125 4% 573,949 595,213 4% 591,981
Harnett County 15,886,238 16,898,321 17,731,606 21,335,561 20% 18,408,260 22,186,999 21% 19,109,572 23,070,005 21% 19,836,030
Angier* 544,131 576,670 604,437 729,883 21% 626,834 759,008 21% 650,037 789,213 21% 674,065
Benson* 337 356 374 450 20 387 467 21 402 486 21 417 Broadway * 1,028 1,085 1,137 1,363 20% 1,179 1,418 20% 1,223 1,474 21% 1,268
Coats 232,224 246,109 257,959 311,493 21% 267,518 323,923 21% 277,421 336,814 21% 287,675 Dunn 1,477,739 1,567,515 1,643,000 1,986,841 21 1,703,890 2,066,135 21 1,766,970 2,148,370 22 1,832,293
Erwin 473,382 501,697 525,855 635,007 21% 545,340 660,347 21% 565,527 686,626 21% 586,431 Lillington 575,871 610,162 639,541 771,978 21% 663,238 802,782 21% 687,788 834,728 21% 713,211
Haywood County 10,875,743 11,424,643 11,930,994 11,965,096 0 12,328,844 12,347,541 0 12,740,297 12,742,766 0 13,165,879
Canton 1,017,023 1,069,719 1,117,570 1,120,165 0% 1,155,290 1,155,966 0 % 1,194,308 1,192,962 (0%) 1,234,672
Clyde 295,539 310,709 324,608 325,150 0% 335,565 335,543 (0%) 346,899 346,283 (0%) 358,623 Maggie Valley 301,079 316,854 331,026 332,053 0% 342,198 342,664 0% 353,754 353,630 (0%) 365,709
Waynesville 2,370,892 2,492,996 2,604,517 2,609,471 0% 2,692,428 2,692,875 0 % 2,783,363 2,779,066 (0%) 2,877,436 Henderson Count y 20, 344,287 21,483,098 22,475,005 22,934,355 2% 23,263,760 23,740,067 2% 24,079,063 24,572,011 2% 24,921,628
Flat Rock 278,497 293,879 307,435 313,775 2% 318,217 324,798 2% 329,365 336,181 2% 340,891 Fletcher 1,274,516 1,345,637 1,407,709 1,437,831 2 1,457,079 1,488,344 2 1,508,127 1,540,501 2 1,560,902
Hendersonville 2,732,133 2,883,177 3,016,172 3,078,598 2% 3,121,952 3,186,752 2 % 3,231,327 3,298,429 2% 3,344,403 Laurel Park 517,709 546,198 571,393 583,022 2% 591,432 603,504 2% 612,153 624,653 2% 633,574
M lls R ver 330,414 348,861 364,953 372,776 2 377,753 385,872 2 390,987 399,395 2 404,669 Saluda * 6,532 6,888 7,205 7,347 2% 7,458 7,605 2% 7,719 7,871 2% 7,989
7/18/2019 Local Sales Tax Distribution Comparison Chart
http://slidepdf.com/reader/full/local-sales-tax-distribution-comparison-chart 8/15
Comparison of Local Sales Tax Distribution Scenarios for Articles 3 9, 40, and 42
8 of 15
FY 2014-15 FY 2015-16
Actual Current Law Current Law 50%/50% Change Current Law 50%/50% Change Current Law 50%/50% Change Current Law
FYFY 2016-17 FY 2017-18 FY 2018-19
Hertford County 3,555,353 3,713,455 3,867,354 4,146,724 7% 3,985,440 4,260,919 7% 4,107,418 4,378,675 7% 4,233,373
Ahoskie 1,025,088 1,073,740 1,119,784 1,195,622 7% 1,155,558 1,228,548 6 % 1,192,536 1,262,500 6% 1,230,751 Cof eld 56,622 59,254 61,795 65,887 7 63,770 67,703 6 65,811 69,575 6 67,921
Como 5,710 5,958 6,214 6,596 6% 6,413 6,778 6% 6,618 6,966 5% 6,831 Harrellsville 8,916 9,331 9,731 10,377 7% 10,042 10,663 6% 10,363 10,957 6% 10,696
Murfreesboro 347,394 363,874 379,477 405,165 7 391,601 416,323 6 404,132 427,829 6 417,083 Winton 86,906 91,203 95,112 101,844 7% 98,149 104,645 7% 101,288 107,534 6% 104,532
Hoke County 5,660,245 5,966,124 6,259,313 8,137,677 30% 6,514,181 8,491,484 30% 6,793,245 8,887,264 31% 7,092,711
Raeford 895,999 944,652 989,914 1,289,038 30% 1,028,013 1,345,085 31% 1,068,919 1,407,782 32% 1,112,282
Red Springs * - - - - - - - - -
Hyde County 1,346,637 1,408,305 1,468,188 1,494,302 2% 1,514,710 1,536,683 1% 1,562,863 1,580,550 1% 1,612,548 Iredell County 30,557,639 32,256,139 33,759,391 32,873,492 (3%) 34,960,215 34,058,866 (3%) 36,203,186 35,285,885 (3%) 37,489,800
Dav dson * 76,633 81,087 84,856 82,994 2 ) 87,864 85,987 2 ) 90,978 89,085 2 ) 94,201 Harmony 127,047 134,068 140,298 136,698 (3%) 145,272 141,627 (3%) 150,419 146,729 (2%) 155,748
Love Valley 27,653 29,226 30,584 29,863 (2%) 31,668 30,940 (2%) 32,790 32,055 (2%) 33,952 Mooresv lle 8,258,537 8,724,085 9,129,542 8,908,393 2 ) 9,453,178 9,229,645 2 ) 9,788,166 9,562,184 2 ) 10,134,908
Statesville 5,899,800 6,225,728 6,515,059 6,347,675 (3%) 6,746,001 6,576,565 (3%) 6,985,043 6,813,496 (2%) 7,232,473 Troutman 593,280 626,199 655,301 638,671 (3%) 678,530 661,701 (2%) 702,573 685,540 (2%) 727,461
Jackson County 9,579,344 10,063,610 10,514,138 10,430,817 (1%) 10,869,180 10,771,313 (1%) 11,236,549 11,123,524 (1%) 11,616,503
Dillsboro 42,444 44,648 46,658 46,281 (1%) 48,245 47,791 (1%) 49,888 49,354 (1%) 51,587
Forest Hills 20,633 21,688 22,664 22,460 (1%) 23,436 23,193 (1%) 24,234 23,952 (1%) 25,059 Highlands * 47,835 50,274 52,538 52,055 (1%) 54,325 53,754 (1%) 56,175 55,512 (1%) 58,089
Sylva 485,331 510,108 533,076 528,220 1 ) 551,215 545,464 1 ) 569,985 563,301 1 ) 589,400 Webster 10,917 11,473 11,990 11,878 (1%) 12,398 12,266 (1%) 12,820 12,667 (1%) 13,256
Johnston County 29,828,797 31,596,579 33,141,816 35,335,634 7% 34,403,138 36,761,803 7% 35,717,697 38,254,896 7% 37,085,385
Archer Lodge 106,830 113,105 118,619 126,490 7 123,114 131,595 7 127,797 136,939 7 132,669
Benson * 520,706 550,492 576,982 615,852 7% 598,465 640,704 7% 620,816 666,721 7% 644,039 Clayton 2,933,173 3,103,138 3,252,478 3,475,463 7% 3,373,597 3,615,738 7 % 3,499,608 3,762,596 8% 3,630,541
Four Oaks 207,991 219,913 230,495 246,066 7% 239,078 255,996 7% 248,007 266,392 7% 257,284 Kenly * 263,456 278,550 291,954 311,663 7% 302,825 324,240 7% 314,134 337,407 7% 325,886
Micro 38,057 40,197 42,131 44,904 7% 43,700 46,716 7% 45,332 48,612 7% 47,027 Pine Level 158,068 167,156 175,200 187,083 7% 181,724 194,634 7% 188,511 202,538 7% 195,563
Pr nceton 135,494 143,265 150,159 160,310 7 155,750 166,779 7 161,567 173,552 7 167,611 Selma 761,930 806,132 844,928 902,947 7% 876,393 939,392 7% 909,128 977,548 8% 943,143
Smithfield 2,105,862 2,227,297 2,334,482 2,493,477 7% 2,421,411 2,594,110 7 % 2,511,850 2,699,466 7% 2,605,822 W lson's M lls 132,885 140,059 146,796 155,923 6 152,258 162,210 7 157,940 168,791 7 163,844
Zebulon * - - - - - - - - - Jones County 1,062,097 1,101,359 1,147,465 1,632,746 42% 1,182,540 1,678,991 42% 1,219,076 1,727,347 42% 1,256,802
Maysv lle 71,551 74,724 77,979 110,135 41 80,504 113,254 41 83,127 116,516 40 85,839 Pollocksville 20,549 21,463 22,398 31,640 41% 23,123 32,536 41% 23,877 33,473 40% 24,655
Trenton 16,183 16,895 17,631 24,887 41% 18,202 25,591 41% 18,795 26,328 40% 19,408 Lee County 9,822,972 10,285,508 10,730,284 10,943,935 2% 11,076,791 11,271,193 2% 11,435,125 11,609,317 2% 11,805,489
Broadway * 124,356 130,454 136,185 138,654 2% 140,675 142,800 2% 145,319 147,083 1% 150,121 Sanford 4,413,528 4,633,144 4,836,651 4,929,865 2% 4,996,081 5,077,215 2 % 5,160,989 5,229,458 1% 5,331,496
Lenoir County 8,499,369 8,878,972 9,257,810 10,189,981 10% 9,551,496 10,483,283 10% 9,855,135 10,786,161 9% 10,168,729
Gr fton * 7,767 8,130 8,484 9,302 10 8,761 9,570 9 9,048 9,847 9 9,343
Kinston 3,354,916 3,513,086 3,666,178 4,021,637 10% 3,785,770 4,137,397 9 % 3,909,454 4,256,935 9% 4,037,274 La Grange 202,029 211,368 220,581 241,642 10% 227,778 248,600 9% 235,221 255,786 9% 242,914
P nk H ll 65,659 68,614 71,606 78,303 9 73,943 80,559 9 76,360 82,888 9 78,858 Lincoln County 13,757,098 14,461,680 15,114,341 16,361,486 8% 15,630,427 16,908,076 8% 16,164,231 17,473,089 8% 16,716,449
7/18/2019 Local Sales Tax Distribution Comparison Chart
http://slidepdf.com/reader/full/local-sales-tax-distribution-comparison-chart 9/15
Comparison of Local Sales Tax Distribution Scenarios for Articles 3 9, 40, and 42
9 of 15
FY 2014-15 FY 2015-16
Actual Current Law Current Law 50%/50% Change Current Law 50%/50% Change Current Law 50%/50% Change Current Law
FYFY 2016-17 FY 2017-18 FY 2018-19
Lincolnton 2,464,829 2,593,491 2,711,128 2,933,251 8% 2,804,309 3,031,241 8 % 2,900,705 3,132,533 8% 3,000,440
Maiden * 467 491 514 555 8% 531 574 8% 550 593 8% 569 Macon County 8,075,455 8,511,413 8,907,149 8,716,237 2 9,222,759 9,028,643 2 9,549,543 9,352,219 2 9,887,824
Franklin 592,509 624,621 653,608 639,851 (2%) 676,718 662,785 (2%) 700,644 686,539 (2%) 725,412 Highlands * 833,089 878,055 918,804 899,172 (2%) 951,290 931,400 (2%) 984,924 964,780 (2%) 1,019,740
Mad son County 2,370,647 2,496,011 2,606,676 3,287,390 26 2,693,711 3,394,317 26 2,783,680 3,504,765 26 2,876,638
Hot Springs 102,567 108,027 112,886 142,245 26% 116,726 146,872 26% 120,697 151,651 26% 124,802
Mars Hill 383,761 405,158 423,380 535,324 26% 437,778 552,733 26% 452,668 570,715 26% 468,064 Marshall 160,330 168,847 176,442 222,298 26% 182,444 229,528 26% 188,650 236,997 26% 195,068
Martin County 3,769,316 3,931,580 4,092,517 4,298,890 5% 4,215,385 4,412,729 5% 4,342,446 4,530,357 4% 4,473,373
Bear Grass 5,110 5,332 5,558 5,784 4% 5,734 5,937 4% 5,915 6,096 3% 6,102 Everetts 9,894 10,327 10,766 11,210 4% 11,105 11,508 4% 11,457 11,815 3% 11,819 Ham lton 26,259 27,369 28,531 29,643 4 29,432 30,430 3 30,363 31,243 3 31,324 Hassell 540 527 550 514 (7%) 568 528 (7%) 586 543 (7%) 605
Jamesville 43,467 45,373 47,300 49,255 4% 48,792 50,562 4% 50,335 51,912 3% 51,928 Oak C ty 25,365 26,474 27,598 28,732 4 28,468 29,494 4 29,369 30,281 3 30,298
Parmele 21,324 22,257 23,203 24,159 4% 23,934 24,800 4% 24,691 25,462 3% 25,473 Robersonville 188,964 197,319 205,699 214,309 4% 212,185 219,993 4% 218,895 225,865 3% 225,820
Williamston 931,924 971,288 1,012,559 1,051,962 4% 1,044,513 1,079,895 3 % 1,077,566 1,108,758 3% 1,111,677 McDowell County 7,737,375 8,097,942 8,443,713 8,931,553 6% 8,711,402 9,195,337 6% 8,987,797 9,467,189 5% 9,273,009
Marion 1,212,381 1,272,617 1,328,219 1,402,446 6% 1,371,646 1,443,854 5 % 1,416,521 1,486,528 5% 1,462,872 Old Fort 161,585 169,575 176,984 186,814 6% 182,771 192,330 5% 188,751 198,015 5% 194,928
Mecklenburg County 204,492,480 216,601,859 227,027,710 215,258,164 5 235,438,852 223,772,429 5 244,151,275 232,598,827 5 253,174,189
Charlotte 104,245,779 110,392,614 115,674,491 109,860,448 (5%) 119,928,241 114,206,618 (5%) 124,333,911 118,712,128 (5%) 128,896,229
Cornelius 2,893,732 3,060,784 3,207,198 3,040,604 (5%) 3,325,105 3,160,837 (5%) 3,447,222 3,285,478 (5%) 3,573,681 Dav dson * 1,416,150 1,498,572 1,570,264 1,489,709 5 ) 1,627,998 1,548,626 5 ) 1,687,793 1,609,703 5 ) 1,749,715
Huntersville 4,205,301 4,449,848 4,662,725 4,423,212 (5%) 4,834,158 4,598,145 (5%) 5,011,713 4,779,491 (5%) 5,195,581 Matthews 2,649,101 2,804,636 2,938,821 2,790,101 (5%) 3,046,885 2,900,469 (5%) 3,158,809 3,014,884 (5%) 3,274,712
Mint Hill * 1,531,758 1,620,898 1,698,442 1,611,296 (5%) 1,760,888 1,675,022 (5%) 1,825,565 1,741,084 (5%) 1,892,541 Pineville 1,269,014 1,342,654 1,406,884 1,334,380 (5%) 1,458,609 1,387,150 (5%) 1,512,181 1,441,856 (5%) 1,567,658
Stallings * 16,850 17,829 18,682 17,722 (5%) 19,369 18,423 (5%) 20,081 19,149 (5%) 20,817 Weddington * - - - - - - - - -
M tchell County 2,968,024 3,132,566 3,271,370 3,484,635 7 3,379,527 3,593,594 6 3,491,079 3,705,567 6 3,605,910
Bakersville 45,639 48,163 50,316 53,610 7% 52,002 55,286 6% 53,742 57,009 6% 55,536
Spruce Pine 393,822 415,512 434,084 462,333 7% 448,629 476,790 6% 463,644 491,646 6% 479,120 Montgomery County 3,178,531 3,322,658 3,462,024 4,079,510 18 3,569,247 4,196,833 18 3,680,137 4,318,102 17 3,794,551
Biscoe 312,319 327,654 341,895 401,175 17% 353,000 412,711 17% 364,490 424,636 17% 376,359 Candor 154,367 161,913 168,950 198,185 17% 174,439 203,884 17% 180,117 209,775 16% 185,982
Mount G lead 208,587 217,832 227,306 264,932 17 234,698 272,561 16 242,344 280,446 16 250,244 Star 155,760 162,597 169,670 197,636 16% 175,188 203,327 16% 180,896 209,211 16% 186,793
Troy 603,644 632,446 659,939 772,863 17% 681,383 795,096 17% 703,566 818,078 16% 726,484 Moore County 14,787,810 15,612,125 16,337,812 15,658,037 (4%) 16,915,636 16,215,027 (4%) 17,512,163 16,789,078 (4%) 18,128,089
Aberdeen 1,606,163 1,703,249 1,782,200 1,721,254 (3%) 1,845,056 1,782,496 (3%) 1,909,991 1,845,610 (3%) 1,977,080 Cameron 67,615 71,554 74,870 72,108 (4%) 77,511 74,673 (4%) 80,238 77,317 (4%) 83,057
Candor - - - - - - - - - Carthage 511,149 539,225 564,216 541,079 4 ) 584,112 560,326 4 ) 604,667 580,163 4 ) 625,905
Foxfire Village 214,287 226,299 236,787 227,407 (4%) 245,137 235,497 (4%) 253,764 243,834 (4%) 262,677 Pinebluff 309,692 326,839 341,987 328,148 (4%) 354,046 339,822 (4%) 366,505 351,852 (4%) 379,378
P nehurst 3,469,017 3,662,689 3,832,444 3,679,567 4 ) 3,967,593 3,810,461 4 ) 4,107,215 3,945,364 4 ) 4,251,474 Robbins 251,745 265,576 277,884 266,494 (4%) 287,684 275,974 (4%) 297,807 285,744 (4%) 308,267
7/18/2019 Local Sales Tax Distribution Comparison Chart
http://slidepdf.com/reader/full/local-sales-tax-distribution-comparison-chart 10/15
Comparison of Local Sales Tax Distribution Scenarios for Articles 3 9, 40, and 42
10 of 15
FY 2014-15 FY 2015-16
Actual Current Law Current Law 50%/50% Change Current Law 50%/50% Change Current Law 50%/50% Change Current Law
FYFY 2016-17 FY 2017-18 FY 2018-19
Southern Pines 2,909,998 3,075,631 3,218,182 3,094,145 (4%) 3,331,673 3,204,218 (4%) 3,448,919 3,317,661 (4%) 3,570,058
Taylortown 164,701 173,747 181,800 174,344 (4%) 188,210 180,546 (4%) 194,834 186,938 (4%) 201,677 Vass 164,913 174,022 182,087 174,689 4 ) 188,508 180,903 4 ) 195,142 187,307 4 ) 201,996
Whispering Pines 698,220 737,260 771,430 740,739 (4%) 798,634 767,090 (4%) 826,739 794,247 (4%) 855,777 Nash County 12,236,529 12,781,005 13,322,582 13,885,491 4% 13,741,543 14,283,195 4% 14,174,506 14,693,578 4% 14,621,857
Ba ley 101,404 106,198 110,812 115,075 4 114,414 118,371 3 118,139 121,772 3 121,989 Castalia 47,687 49,939 52,108 54,109 4% 53,802 55,659 3% 55,554 57,258 3% 57,364
Dortches 173,882 182,330 190,250 197,933 4% 196,432 203,598 4% 202,824 209,444 3% 209,432 Middlesex 147,203 154,171 160,870 167,074 4% 166,099 171,859 3% 171,506 176,797 3% 177,096
Momeyer 40,318 42,229 44,064 45,767 4% 45,496 47,078 3% 46,977 48,430 3% 48,508
Nashville 981,712 1,028,964 1,073,667 1,116,320 4% 1,108,561 1,148,279 4 % 1,144,638 1,181,257 3% 1,181,934 Red Oak 632,063 662,581 691,365 718,980 4% 713,833 739,563 4% 737,063 760,801 3% 761,078 Rocky Mount * 7,199,181 7,541,556 7,869,236 8,175,254 4 8,125,021 8,409,371 3 8,389,484 8,650,952 3 8,662,886 Sharpsburg * 224,978 235,697 245,938 255,532 4% 253,931 262,849 4% 262,196 270,400 3% 270,741
Spring Hope 241,362 252,841 263,827 274,088 4% 272,403 281,937 4% 281,269 290,037 3% 290,435 Wh takers * 61,574 64,532 67,336 70,003 4 69,525 72,007 4 71,787 74,075 3 74,126
New Hanover County 50,475,091 53,343,346 55,844,452 50,499,516 (10%) 57,845,854 52,347,937 (10%) 59,918,317 54,262,744 (9%) 62,063,500
Carolina Beach 1,384,090 1,462,031 1,530,366 1,384,619 (10%) 1,585,000 1,435,300 (9%) 1,641,570 1,487,800 (9%) 1,700,124
Kure Beach 750,154 792,390 829,426 750,423 (10%) 859,036 777,890 (9%) 889,696 806,344 (9%) 921,431 Wilmington 20,731,115 21,900,787 22,924,440 20,744,415 (10%) 23,742,853 21,503,726 (9%) 24,590,257 22,290,307 (9%) 25,467,383
W ri gh ts vi ll e B each 1, 16 4,4 94 1,229,773 1,287,252 1,164,237 (10%) 1,333,206 1,206,849 (9%) 1,380,787 1,250,992 (9%) 1,430,038 Northampton County 1,792,344 1,849,138 1,914,990 2,431,877 27% 1,962,386 2,484,406 27% 2,011,165 2,538,313 26% 2,061,272
Conway 130,651 136,450 141,981 178,352 26 146,188 182,200 25 150,531 186,148 24 155,012 Garysburg 162,934 170,123 177,019 222,283 26% 182,265 227,079 25% 187,681 232,001 24% 193,268
Gaston 178,815 186,645 194,211 243,755 26% 199,968 249,015 25% 205,910 254,413 24% 212,041 Jackson 78,482 81,887 85,207 106,880 25 87,733 109,187 24 90,341 111,554 23 93,031
Lasker 19,260 20,134 20,950 26,354 26% 21,570 26,922 25% 22,211 27,505 24% 22,872 Rich Square 150,700 157,459 163,840 205,948 26% 168,694 210,390 25% 173,706 214,948 24% 178,875
Seaboard 97,429 101,643 105,764 132,641 25% 108,899 135,504 24% 112,137 138,442 23% 115,476 Severn 42,811 44,695 46,506 58,388 26% 47,885 59,647 25% 49,308 60,940 24% 50,776
Woodland 123,834 129,232 134,472 168,729 25% 138,458 172,370 24% 142,573 176,107 24% 146,818 Onslow County 29,499,121 30,965,868 32,350,602 32,990,187 2% 33,461,777 34,107,102 2% 34,611,430 35,262,331 2% 35,800,703
Holly R dge 476,324 501,391 523,999 534,869 2 542,097 552,975 2 560,823 571,702 2 580,198 Jacksonville 10,465,737 10,995,523 11,491,387 11,695,241 2% 11,888,310 12,091,204 2% 12,299,020 12,500,750 2% 12,723,951
N. Topsail Beach 1,599,507 1,691,184 1,767,416 1,816,424 3% 1,828,445 1,877,893 3 % 1,891,594 1,941,469 3% 1,956,928 R chlands 290,560 305,265 319,031 324,685 2 330,051 335,678 2 341,453 347,048 2 353,251
Surf City * 445,759 468,222 489,338 497,852 2% 506,240 514,708 2% 523,730 532,142 2% 541,825 Swansboro 758,548 795,475 831,354 843,681 1% 860,072 872,249 1% 889,788 901,798 1% 920,533
Orange County 15,604,081 16,411,982 17,177,777 17,322,371 1 17,789,410 17,942,329 1 18,422,638 18,584,206 1 19,078,083
Carrboro 3,819,149 4,022,740 4,209,378 4,245,731 1% 4,358,234 4,397,687 1 % 4,512,329 4,555,016 1% 4,671,824
Chapel Hill * 10,540,724 11,091,530 11,606,115 11,690,114 1% 12,016,530 12,108,489 1% 12,441,385 12,541,656 1% 12,881,131 Durham * 5,807 6,108 6,391 6,434 1% 6,617 6,664 1% 6,851 6,903 1% 7,093
Hillsborough 1,191,797 1,255,224 1,313,461 1,324,651 1% 1,359,909 1,372,060 1 % 1,407,992 1,421,146 1% 1,457,759 Mebane * 362,201 381,730 399,441 403,215 1% 413,567 417,646 1% 428,190 432,588 1% 443,325
Pamlico County 2,112,038 2,210,394 2,305,325 2,609,475 13% 2,379,163 2,687,354 13% 2,455,557 2,767,899 13% 2,534,432
All ance 6,218 6,656 6,947 8,103 17 7,174 8,343 16 7,410 8,592 16 7,653
Arapahoe - - - - - - - - - Bayboro 24,037 25,201 26,306 29,674 13% 27,172 30,559 12% 28,068 31,475 12% 28,994
Grantsboro 6,775 7,105 7,416 8,370 13 7,661 8,619 13 7,913 8,878 12 8,174 Mesic 8,714 9,137 9,538 10,762 13% 9,852 11,083 12% 10,177 11,415 12% 10,512
7/18/2019 Local Sales Tax Distribution Comparison Chart
http://slidepdf.com/reader/full/local-sales-tax-distribution-comparison-chart 11/15
Comparison of Local Sales Tax Distribution Scenarios for Articles 3 9, 40, and 42
11 of 15
FY 2014-15 FY 2015-16
Actual Current Law Current Law 50%/50% Change Current Law 50%/50% Change Current Law 50%/50% Change Current Law
FYFY 2016-17 FY 2017-18 FY 2018-19
Minnesott Beach 36,860 38,655 40,350 45,534 13% 41,678 46,893 13% 43,052 48,299 12% 44,472
Oriental 132,313 138,763 144,849 163,474 13% 149,616 168,353 13% 154,550 173,399 12% 159,647 Stonewall 8,635 9,057 9,454 10,671 13 9,765 10,990 13 10,087 11,319 12 10,420
Vandemere 12,175 12,770 13,330 15,048 13% 13,769 15,497 13% 14,223 15,961 12% 14,692 Pasquotank County 6, 996,685 7,338,906 7,663,264 7,677,973 0% 7,914,718 7,915,571 0% 8,173,013 8,157,866 (0%) 8,438,796
El zabeth C ty * 2,993,473 3,143,724 3,284,061 3,285,253 0 3,393,588 3,386,915 0 ) 3,506,316 3,490,586 0 ) 3,622,488 Pender County 8,655,186 9,199,527 9,654,979 10,863,056 13% 10,026,753 11,307,713 13% 10,411,229 11,767,301 13% 10,810,253
Atkinson 70,095 74,371 77,976 88,131 13% 80,899 91,739 13% 83,923 95,469 14% 87,058 Burgaw 884,265 936,918 982,333 1,107,877 13% 1,019,145 1,153,218 13% 1,057,223 1,200,081 14% 1,096,712
Saint Helena 90,811 96,351 101,023 114,181 13% 104,810 118,855 13% 108,727 123,687 14% 112,789
Surf City * 369,630 392,183 411,198 464,758 13% 426,611 483,785 13% 442,555 503,451 14% 459,089 Topsail Beach 85,478 90,647 95,042 107,337 13% 98,604 111,730 13% 102,289 116,272 14% 106,110 Wallace * - - - - - - - - - Watha 44,634 47,329 49,624 56,034 13% 51,484 58,328 13% 53,407 60,699 14% 55,403
Perquima ns County 1, 506,711 1,558,376 1,619,674 1,934,517 19% 1,668,037 1,988,198 19% 1,719,617 2,046,307 19% 1,774,044
Hertford 407,306 424,621 442,520 522,951 18 456,698 537,463 18 471,613 553,171 17 487,213
Winfall 114,415 119,368 124,399 147,164 18% 128,384 151,246 18% 132,576 155,666 17% 136,961 Person County 6,734,237 7,050,069 7,354,055 7,878,130 7% 7,590,581 8,113,918 7% 7,834,533 8,356,330 7% 8,086,832
Roxboro 1,304,361 1,368,286 1,428,364 1,526,600 7% 1,475,416 1,572,288 7 % 1,523,995 1,619,259 6% 1,574,247 Pitt County 20,586,789 21,610,891 22,564,497 22,652,392 0% 23,312,478 23,380,578 0% 24,086,080 24,133,361 0% 24,885,817
Ayden 921,976 969,002 1,012,409 1,014,081 0% 1,046,638 1,046,681 0 % 1,082,050 1,080,382 (0%) 1,118,674 Bethel 292,152 306,966 320,717 321,143 0% 331,561 331,467 (0%) 342,779 342,140 (0%) 354,381
Falkland 17,862 18,767 19,608 19,633 0 20,271 20,264 0 ) 20,957 20,917 0 ) 21,666 Farmville 867,165 911,401 952,227 953,806 0% 984,421 984,468 0 % 1,017,728 1,016,165 (0%) 1,052,175
Fountain 79,614 83,676 87,424 87,570 0% 90,380 90,385 0% 93,438 93,296 (0%) 96,600 Greenv lle 16,001,554 16,828,262 17,582,045 17,623,583 0 18,176,456 18,190,075 0 18,791,391 18,775,702 0 ) 19,427,376
Grifton * 453,895 477,123 498,495 499,409 0% 515,349 515,463 0% 532,785 532,059 (0%) 550,817 Grimesland 82,121 86,281 90,146 90,260 0% 93,194 93,162 (0%) 96,347 96,162 (0%) 99,608
Simpson 76,908 80,819 84,439 84,564 0% 87,294 87,282 (0%) 90,247 90,093 (0%) 93,302 Winterville 1,736,976 1,825,610 1,907,388 1,910,584 0% 1,971,877 1,972,003 0 % 2,038,592 2,035,497 (0%) 2,107,592
Polk County 2,717,216 2,855,574 2,981,054 3,480,120 17% 3,078,966 3,589,890 17% 3,179,974 3,702,882 16% 3,284,131
Columbus 198,693 209,147 218,487 254,891 17% 225,827 262,930 16% 233,408 271,205 16% 241,236
Saluda * 141,989 149,524 156,201 182,335 17 161,448 188,086 16 166,867 194,005 16 172,463 Tryon 340,066 358,256 374,254 437,119 17% 386,825 450,904 17% 399,809 465,093 16% 413,217
Randolph County 16,022,378 16,781,256 17,510,497 19,763,802 13% 18,079,416 20,378,969 13% 18,667,703 21,014,696 13% 19,275,884
Archdale * 2,035,897 2,139,624 2,234,638 2,518,649 13 2,309,342 2,597,026 12 2,386,617 2,678,023 12 2,466,541
Asheboro 4,595,161 4,828,722 5,043,153 5,683,169 13% 5,211,748 5,860,027 12% 5,386,146 6,042,795 12% 5,566,522 Franklinville 207,757 218,086 227,771 256,286 13% 235,387 264,263 12% 243,265 272,507 12% 251,412
H gh Po nt * 1,977 2,075 2,168 2,439 13 2,240 2,515 12 2,315 2,594 12 2,393 Liberty 477,716 501,793 524,077 590,241 13% 541,598 608,610 12% 559,722 627,594 12% 578,468
Ramseur 303,442 318,793 332,950 375,082 13% 344,081 386,755 12% 355,596 398,818 12% 367,504 Randleman 744,298 782,326 817,066 921,092 13% 844,380 949,754 12% 872,635 979,375 12% 901,857
Seagrove 40,843 42,909 44,814 50,485 13% 46,313 52,056 12% 47,862 53,679 12% 49,465 Staley 71,505 75,113 78,449 88,361 13% 81,071 91,111 12% 83,784 93,953 12% 86,590
Thomasville * 51,549 54,357 56,770 64,294 13% 58,667 66,293 13% 60,630 68,360 13% 62,659 Tr n ty 1,187,892 1,248,104 1,303,530 1,468,679 13 1,347,109 1,514,385 12 1,392,187 1,561,618 12 1,438,811
Richmond County 5,827,775 6,055,963 6,308,106 6,602,366 5% 6,501,716 6,790,681 4% 6,701,835 6,985,162 4% 6,908,204 Dobbins Heights 170,123 177,702 185,387 192,733 4% 191,373 198,230 4% 197,563 203,907 3% 203,956
Ellerbe 208,623 217,979 227,405 236,502 4 234,747 243,247 4 242,340 250,213 3 250,181 Hamlet 1,291,897 1,349,760 1,408,132 1,464,366 4% 1,453,594 1,506,130 4 % 1,500,610 1,549,261 3% 1,549,165
7/18/2019 Local Sales Tax Distribution Comparison Chart
http://slidepdf.com/reader/full/local-sales-tax-distribution-comparison-chart 12/15
Comparison of Local Sales Tax Distribution Scenarios for Articles 3 9, 40, and 42
12 of 15
FY 2014-15 FY 2015-16
Actual Current Law Current Law 50%/50% Change Current Law 50%/50% Change Current Law 50%/50% Change Current Law
FYFY 2016-17 FY 2017-18 FY 2018-19
Hoffman 115,762 120,932 126,162 131,179 4% 130,235 134,920 4% 134,448 138,784 3% 138,798
Norman 28,012 29,297 30,563 31,827 4% 31,550 32,734 4% 32,570 33,671 3% 33,624 Rock ngham 1,884,046 1,968,467 2,053,595 2,135,656 4 2,119,896 2,196,564 4 2,188,463 2,259,467 3 2,259,275
Robeson County 17,469,560 18,186,548 18,930,906 20,717,733 9% 19,499,216 21,281,114 9% 20,086,042 21,861,842 9% 20,691,860
Fairmont 533,340 558,264 582,114 634,371 9% 600,618 651,612 8% 619,742 669,384 8% 639,504
Lumber Br dge 18,763 19,610 20,448 22,238 9 21,099 22,843 8 21,771 23,466 8 22,465 Lumberton 4,335,217 4,537,463 4,731,316 5,155,499 9% 4,881,713 5,295,622 8 % 5,037,151 5,440,058 8% 5,197,780
Marietta 35,443 37,115 38,700 42,199 9% 39,930 43,346 9% 41,202 44,528 8% 42,515 Maxton * 443,430 464,005 483,830 527,031 9% 499,211 541,357 8% 515,107 556,123 8% 531,535
McDonald 22,512 23,551 24,558 26,742 9% 25,338 27,469 8% 26,145 28,218 8% 26,979
Orrum 18,493 19,347 20,173 21,968 9% 20,815 22,565 8% 21,478 23,181 8% 22,163 Parkton 87,706 91,790 95,712 104,281 9% 98,755 107,116 8% 101,899 110,037 8% 105,149 Pembroke 592,319 623,249 649,844 713,332 10 670,469 732,675 9 691,784 752,613 9 713,810 Proctorville 23,519 24,605 25,656 27,938 9% 26,472 28,698 8% 27,315 29,481 8% 28,186
Raynham 19,098 19,979 20,833 22,686 9% 21,495 23,302 8% 22,180 23,938 8% 22,887 Red Spr ngs * 692,738 725,128 756,106 824,009 9 780,140 846,404 8 804,980 869,488 8 830,649
Rennert 77,724 81,330 84,805 92,375 9% 87,501 94,886 8% 90,287 97,475 8% 93,166 Rowland 206,370 215,968 225,195 245,337 9% 232,353 252,006 8% 239,752 258,879 8% 247,398
St Pauls 451,942 472,892 493,097 537,093 9% 508,773 551,693 8% 524,974 566,742 8% 541,716 R oc ki ng ha m Co un ty 10 ,91 1, 58 2 11,402,332 11,880,881 13,015,787 10% 12,249,868 13,391,858 9% 12,631,119 13,779,977 9% 13,024,734
Eden 2,859,259 2,998,827 3,129,098 3,415,615 9% 3,230,793 3,514,282 9 % 3,335,940 3,616,110 8% 3,444,603 Madison 411,077 431,193 449,924 491,203 9% 464,546 505,392 9% 479,664 520,035 8% 495,288
Mayodan 455,912 478,142 498,913 544,558 9 515,128 560,289 9 531,893 576,524 8 549,219 Reidsville 2,645,647 2,774,361 2,894,885 3,159,267 9% 2,988,972 3,250,534 9 % 3,086,252 3,344,725 8% 3,186,785
Stoneville 193,793 203,244 212,073 231,479 9% 218,966 238,166 9% 226,092 245,067 8% 233,457 Wentworth 512,862 537,879 561,245 612,609 9 579,486 630,306 9 598,346 648,569 8 617,836
Rowan County 15,982,244 16,716,811 17,424,653 19,411,413 11% 17,972,007 19,973,312 11% 18,537,650 20,553,231 11% 19,121,994
China Grove 724,641 760,143 793,269 880,940 11% 819,151 906,437 11% 845,912 932,751 10% 873,578
Cleveland 151,202 158,595 165,507 183,772 11% 170,907 189,091 11% 176,490 194,581 10% 182,262 East Spencer 263,679 276,490 288,539 320,241 11% 297,954 329,511 11% 307,689 339,079 10% 317,753
Faith 141,055 147,971 154,419 171,494 11% 159,457 176,457 11% 164,667 181,580 10% 170,052 Granite Quarry 519,103 544,808 568,548 631,859 11% 587,095 650,143 11% 606,273 669,014 10% 626,099
Kannapol s * 1,638,349 1,718,422 1,793,309 1,991,167 11 1,851,821 2,048,800 11 1,912,322 2,108,280 10 1,974,865 Landis 539,056 565,528 590,172 655,507 11% 609,427 674,478 11% 629,337 694,058 10% 649,918
Rockwell 367,678 385,781 402,592 447,241 11% 415,726 460,185 11% 429,307 473,543 10% 443,347 Sal sbury 5,849,381 6,136,663 6,404,081 7,113,089 11 6,613,021 7,318,952 11 6,829,062 7,531,417 10 7,052,398
Spencer 567,051 595,049 620,978 689,987 11% 641,237 709,954 11% 662,185 730,562 10% 683,839 Rutherford County 9,948,660 10,376,409 10,810,152 11,854,251 10% 11,144,675 12,186,426 9% 11,491,153 12,530,676 9% 11,849,720
Bost c 15,718 16,430 17,138 18,689 9 17,690 19,213 9 18,261 19,756 8 18,853 Chimney Rock Vil. 19,903 20,804 21,701 23,664 9% 22,399 24,328 9% 23,123 25,015 8% 23,872
Ellenboro 21,364 22,322 23,284 25,377 9% 24,034 26,088 9% 24,811 26,825 8% 25,614 Forest City 1,114,702 1,173,696 1,224,205 1,349,084 10% 1,263,550 1,386,783 10% 1,304,293 1,425,853 9% 1,346,458
Lake Lure 879,000 920,065 959,710 1,048,662 9% 990,605 1,078,041 9 % 1,022,597 1,108,487 8% 1,055,707 Ruth 28,013 29,266 30,527 33,264 9% 31,510 34,197 9% 32,529 35,163 8% 33,582
Rutherfordton 628,312 657,177 685,499 748,230 9% 707,572 769,198 9% 730,427 790,929 8% 754,082 Sp ndale 489,799 511,920 533,985 582,221 9 551,182 598,543 9 568,990 615,458 8 587,420
Sampson County 8,865,204 9,278,978 9,676,325 11,066,880 14% 9,984,848 11,395,694 14% 10,303,754 11,735,200 14% 10,633,273 Autryville 40,715 42,718 44,591 50,854 14% 46,057 52,365 14% 47,574 53,925 13% 49,142
Cl nton 1,761,979 1,849,703 1,930,792 2,203,805 14 1,994,283 2,269,270 14 2,059,940 2,336,863 13 2,127,821 Faison* - - - - - - - - -

7/18/2019 Local Sales Tax Distribution Comparison Chart
http://slidepdf.com/reader/full/local-sales-tax-distribution-comparison-chart 13/15
Comparison of Local Sales Tax Distribution Scenarios for Articles 3 9, 40, and 42
13 of 15
FY 2014-15 FY 2015-16
Actual Current Law Current Law 50%/50% Change Current Law 50%/50% Change Current Law 50%/50% Change Current Law
FYFY 2016-17 FY 2017-18 FY 2018-19
Falcon * - - - - - - - - -
Garland 127,754 134,109 139,988 159,772 14% 144,592 164,518 14% 149,352 169,419 13% 154,274 Harrells * 36,588 38,408 40,091 45,757 14 41,410 47,116 14 42,773 48,520 13 44,183
Newton Grove 114,572 120,175 125,444 143,007 14% 129,570 147,256 14% 133,837 151,643 13% 138,248 Roseboro 243,070 255,082 266,265 303,760 14% 275,022 312,784 14% 284,077 322,102 13% 293,438
Salemburg 89,068 93,519 97,618 111,450 14 100,828 114,760 14 104,148 118,178 13 107,579 Turkey 60,864 63,940 66,743 76,259 14% 68,937 78,524 14% 71,207 80,863 14% 73,553
Scotland County 5,744,408 5,986,283 6,225,676 6,798,126 9% 6,407,266 6,966,279 9% 6,594,401 7,138,759 8% 6,787,792
East Laurinburg 5,605 5,858 6,102 6,624 9% 6,291 6,788 8% 6,485 6,956 7% 6,686
Gibson 41,585 43,481 45,296 49,201 9% 46,694 50,418 8% 48,137 51,667 7% 49,629
Laurinburg 1,250,253 1,303,663 1,358,129 1,469,096 8% 1,400,110 1,505,517 8 % 1,443,436 1,542,878 7% 1,488,233 Maxton * 38,196 39,933 41,600 45,179 9% 42,884 46,296 8% 44,209 47,443 7% 45,580 Wagram 66,840 69,852 72,769 78,984 9 75,016 80,938 8 77,335 82,943 7 79,732
Stanly County 7,595,060 7,972,250 8,321,766 8,838,019 6% 8,595,480 9,116,674 6% 8,878,440 9,404,492 6% 9,170,913
Albemarle 2,980,135 3,133,049 3,272,655 3,469,947 6% 3,382,593 3,579,346 6 % 3,496,292 3,692,341 6% 3,613,868 Bad n 368,666 387,563 404,832 429,205 6 418,432 442,737 6 432,497 456,714 6 447,041
Locust * 524,158 551,352 575,919 611,114 6% 595,264 630,379 6% 615,271 650,277 6% 635,960 Misenheimer 126,508 133,082 139,012 147,524 6% 143,681 152,175 6% 148,510 156,978 6% 153,504
New London 113,448 119,295 124,610 132,162 6% 128,796 136,329 6% 133,125 140,632 6% 137,602 Norwood 443,991 466,709 487,505 516,794 6% 503,882 533,087 6% 520,820 549,917 6% 538,335
Oakboro 356,463 374,917 391,622 415,491 6% 404,777 428,589 6% 418,382 442,118 6% 432,451 Red Cross 139,576 146,744 153,282 162,532 6% 158,432 167,656 6% 163,757 172,948 6% 169,264
R chf eld 116,137 122,105 127,546 135,251 6 131,831 139,515 6 136,262 143,919 6 140,844 Stanfield * 283,457 298,148 311,432 330,439 6% 321,893 340,856 6% 332,712 351,615 6% 343,900
Stokes County 5,736,351 5,979,019 6,224,234 7,670,714 23% 6,411,656 7,882,113 23% 6,605,280 8,100,233 23% 6,805,081
Danbury 10,086 10,542 10,994 13,436 22 11,346 13,807 22 11,710 14,189 21 12,085
King * 774,450 810,996 845,799 1,036,782 23% 872,848 1,065,351 22% 900,814 1,094,828 22% 929,708 Tobaccoville * - - - - - - - - -
Walnut Cove 148,416 155,340 162,007 198,430 22% 167,188 203,899 22% 172,546 209,541 21% 178,081 Surry County 14,334,334 15,034,189 15,682,282 15,540,705 (1%) 16,186,762 16,004,859 (1%) 16,708,100 16,483,817 (1%) 17,247,027
Dobson 409,066 429,717 448,540 443,927 (1%) 463,276 457,184 (1%) 478,509 470,863 (2%) 494,262 Elkin * 996,888 1,047,120 1,092,988 1,081,612 (1%) 1,128,895 1,113,913 (1%) 1,166,017 1,147,243 (2%) 1,204,403
Mount A ry 2,666,045 2,800,429 2,923,100 2,892,740 1 ) 3,019,130 2,979,125 1 ) 3,118,408 3,068,265 2 ) 3,221,067 Pilot Mountain 383,789 403,298 420,963 416,821 (1%) 434,791 429,266 (1%) 449,087 442,108 (2%) 463,869
Swain County 2,555,184 2,701,349 2,825,705 3,066,009 9% 2,924,619 3,173,222 9% 3,027,001 3,284,190 8% 3,133,142
Bryson C ty 356,610 376,590 393,923 427,592 9 407,711 442,544 9 421,983 458,020 9 436,773
T ra ns ylv an ia Co un ty 6 ,24 8, 70 6 6,574,493 6,874,623 6,984,724 2% 7,112,918 7,224,943 2% 7,359,533 7,473,519 2% 7,614,541
Brevard 1,336,149 1,405,068 1,469,345 1,489,819 1% 1,520,413 1,541,059 1 % 1,573,265 1,594,082 1% 1,627,930
Rosman 25,814 27,110 28,350 28,695 1 29,336 29,682 1 30,356 30,704 1 31,410 Tyrrell County 589,024 613,752 639,224 754,636 18% 659,031 776,039 18% 679,299 797,739 17% 700,363
Columbia 68,079 71,151 74,212 86,995 17% 76,612 89,464 17% 79,078 91,966 16% 81,637 Union County 32,171,466 34,204,245 35,910,796 38,628,004 8% 37,301,845 40,222,792 8% 38,743,408 41,876,602 8% 40,237,150
Fairview 24,151 25,608 26,856 28,989 8% 27,867 30,186 8% 28,915 31,427 9% 29,999 Hemby Bridge - - - - - - - - -
Indian Trail 1,848,065 1,960,692 2,056,280 2,221,513 8% 2,133,687 2,313,241 8 % 2,213,878 2,408,365 9% 2,296,946 Lake Park 171,364 181,676 190,532 205,619 8 197,704 214,108 8 205,133 222,911 9 212,829
Marshville 233,300 247,934 260,025 281,628 8% 269,817 293,262 9% 279,961 305,327 9% 290,469 Marvin 150,891 159,995 167,795 181,122 8% 174,110 188,600 8% 180,653 196,354 9% 187,431
M neral Spr ngs 19,711 20,891 21,909 23,634 8 22,734 24,609 8 23,588 25,621 9 24,473 Mint Hill * 1,555 1,649 1,729 1,866 8% 1,794 1,943 8% 1,862 2,023 9% 1,932
7/18/2019 Local Sales Tax Distribution Comparison Chart
http://slidepdf.com/reader/full/local-sales-tax-distribution-comparison-chart 14/15
Comparison of Local Sales Tax Distribution Scenarios for Articles 3 9, 40, and 42
14 of 15
FY 2014-15 FY 2015-16
Actual Current Law Current Law 50%/50% Change Current Law 50%/50% Change Current Law 50%/50% Change Current Law
FYFY 2016-17 FY 2017-18 FY 2018-19
Monroe 5,456,510 5,785,214 6,067,223 6,548,216 8% 6,295,586 6,818,548 8 % 6,532,159 7,098,886 9% 6,777,219
Stallings * 978,558 1,037,609 1,088,190 1,174,633 8% 1,129,149 1,223,127 8 % 1,171,581 1,273,416 9% 1,215,534 Un onv lle 28,915 30,659 32,154 34,708 8 33,364 36,141 8 34,618 37,627 9 35,917
Waxhaw 1,393,848 1,479,627 1,551,770 1,677,885 8% 1,610,193 1,747,178 9 % 1,670,717 1,819,035 9% 1,733,411 Weddington * 299,188 317,327 332,797 359,377 8% 345,324 374,215 8% 358,301 389,602 9% 371,744
Wesley Chapel 44,629 47,327 49,634 53,585 8 51,502 55,797 8 53,437 58,091 9 55,442 Wingate 145,624 154,417 161,944 174,816 8% 168,040 182,034 8% 174,354 189,518 9% 180,896
Vance County 7,516,400 7,852,546 8,185,681 8,406,329 3% 8,443,887 8,650,290 2% 8,711,207 8,902,915 2% 8,987,700
Henderson 2,736,311 2,870,510 2,995,149 3,075,164 3% 3,092,519 3,164,317 2 % 3,193,317 3,256,637 2% 3,297,596
Kittrell 3,553 3,721 3,883 3,974 2% 4,009 4,089 2% 4,140 4,209 2% 4,275
Middleburg 6,676 6,994 7,298 7,475 2% 7,535 7,692 2% 7,781 7,916 2% 8,035 Wake County 141,050,375 149,574,377 156,814,510 150,814,625 (4%) 162,664,598 156,748,737 (4%) 168,724,929 162,900,218 (3%) 175,001,597
Ang er* 21,037 22,300 23,367 22,550 3 ) 24,226 23,437 3 ) 25,117 24,357 3 ) 26,038 Apex 7,774,587 8,236,952 8,631,113 8,323,005 (4%) 8,948,542 8,650,545 (3%) 9,277,314 8,990,083 (3%) 9,617,773
Cary * 27,226,201 28,821,017 30,199,980 29,085,228 (4%) 31,310,451 30,229,510 (3%) 32,460,600 31,415,707 (3%) 33,651,630 Clayton* - - - - - - - - -
Durham * - - - - - - - - - Fuquay-Varina 3,771,403 3,993,922 4,185,028 4,032,965 (4%) 4,338,927 4,191,653 (3%) 4,498,326 4,356,154 (3%) 4,663,390
Garner 5,167,101 5,468,389 5,730,016 5,516,423 (4%) 5,940,700 5,733,434 (3%) 6,158,913 5,958,393 (3%) 6,384,881 Holly Springs 5,228,623 5,543,737 5,809,055 5,607,954 (3%) 6,022,732 5,828,702 (3%) 6,244,044 6,057,538 (3%) 6,473,224
Knightdale 2,411,558 2,554,892 2,677,149 2,581,454 (4%) 2,775,607 2,683,043 (3%) 2,877,583 2,788,352 (3%) 2,983,184 Morrisville * 3,942,328 4,176,812 4,376,684 4,220,492 (4%) 4,537,647 4,386,583 (3%) 4,704,362 4,558,759 (3%) 4,877,003
Rale gh * 80,910,271 85,663,455 89,762,199 86,469,579 4 ) 93,062,923 89,871,683 3 ) 96,481,588 93,398,405 3 ) 100,021,765 Rolesville 829,837 881,224 923,410 893,513 (3%) 957,388 928,703 (3%) 992,580 965,182 (3%) 1,029,023
Wake Forest * 5,983,068 6,334,374 6,637,453 6,393,713 (4%) 6,881,523 6,645,268 (3%) 7,134,314 6,906,038 (3%) 7,396,091 Wendell 1,175,846 1,244,292 1,303,823 1,255,047 4 ) 1,351,761 1,304,418 4 ) 1,401,413 1,355,597 3 ) 1,452,829
Zebulon * 870,449 920,825 964,878 928,339 (4%) 1,000,352 964,854 (4%) 1,037,093 1,002,706 (3%) 1,075,140 Warren County 2,341,373 2,438,703 2,538,225 3,269,709 29% 2,614,365 3,359,402 28% 2,692,806 3,451,522 28% 2,773,894
Macon 21,889 22,919 23,900 30,617 28% 24,664 31,457 28% 25,453 32,319 27% 26,268 Norlina 205,206 214,921 224,127 287,247 28% 231,290 295,124 28% 238,684 303,215 27% 246,332
Warrenton 158,565 166,104 173,219 222,066 28% 178,755 228,156 28% 184,469 234,410 27% 190,379 Wa shington Count y 1, 872,558 1,945,270 2,022,763 2,246,262 11% 2,081,521 2,303,314 11% 2,142,102 2,361,944 10% 2,204,669
Creswell 25,764 26,859 27,985 30,792 10 28,854 31,574 9 29,752 32,379 9 30,680 Plymouth 393,780 410,078 427,275 469,362 10% 440,555 481,303 9% 454,268 493,575 9% 468,442
Roper 56,813 59,261 61,745 67,998 10% 63,663 69,726 10% 65,643 71,502 9% 67,690 Watauga County 10,731,353 11,286,492 11,797,871 11,009,141 7 12,202,439 11,379,534 7 12,621,116 11,762,787 7 13,054,354
Be ech Mountain * 1,447,516 1,523,215 1,592,449 1,485,297 (7%) 1,647,291 1,535,268 (7%) 1,704,047 1,586,974 (7%) 1,762,780 Blowing Rock * 1,294,637 1,362,334 1,424,256 1,328,412 (7%) 1,473,306 1,373,105 (7%) 1,524,068 1,419,350 (7%) 1,576,597
Boone 2,336,417 2,458,350 2,570,089 2,396,838 7 ) 2,658,601 2,477,477 7 ) 2,750,202 2,560,917 7 ) 2,844,993 Seven Devils * 264,192 277,973 290,608 271,010 (7%) 300,616 280,127 (7%) 310,973 289,562 (7%) 321,692
Wayne County 18,280,367 19,179,053 20,010,979 21,335,083 7% 20,667,451 21,998,270 6% 21,356,154 22,702,068 6% 22,078,424
Eureka 33,086 34,770 36,305 38,654 6% 37,519 39,856 6% 38,787 41,131 6% 40,112
Fremont 159,684 167,904 175,313 186,815 7% 181,175 192,621 6% 187,299 198,782 6% 193,697 Goldsboro 7,004,204 7,362,496 7,687,406 8,187,890 7% 7,944,451 8,442,361 6 % 8,213,024 8,712,425 6% 8,493,587
Mount Olive * 668,632 703,005 734,028 782,114 7% 758,571 806,420 6% 784,214 832,215 6% 811,003 P kev lle 124,802 131,269 137,062 146,131 7 141,644 150,672 6 146,432 155,491 6 151,434
Seven Springs 10,915 11,471 11,977 12,753 6% 12,377 13,149 6% 12,796 13,570 6% 13,233 Walnut Creek 294,914 309,995 323,676 344,740 7% 334,498 355,454 6% 345,807 366,825 6% 357,620
W lkes County 11,618,325 12,164,429 12,687,136 13,804,056 9 13,093,755 14,216,774 9 13,513,959 14,642,712 8 13,948,124
Elkin * 18,932 19,877 20,749 22,546 9% 21,431 23,219 8% 22,137 23,915 8% 22,867
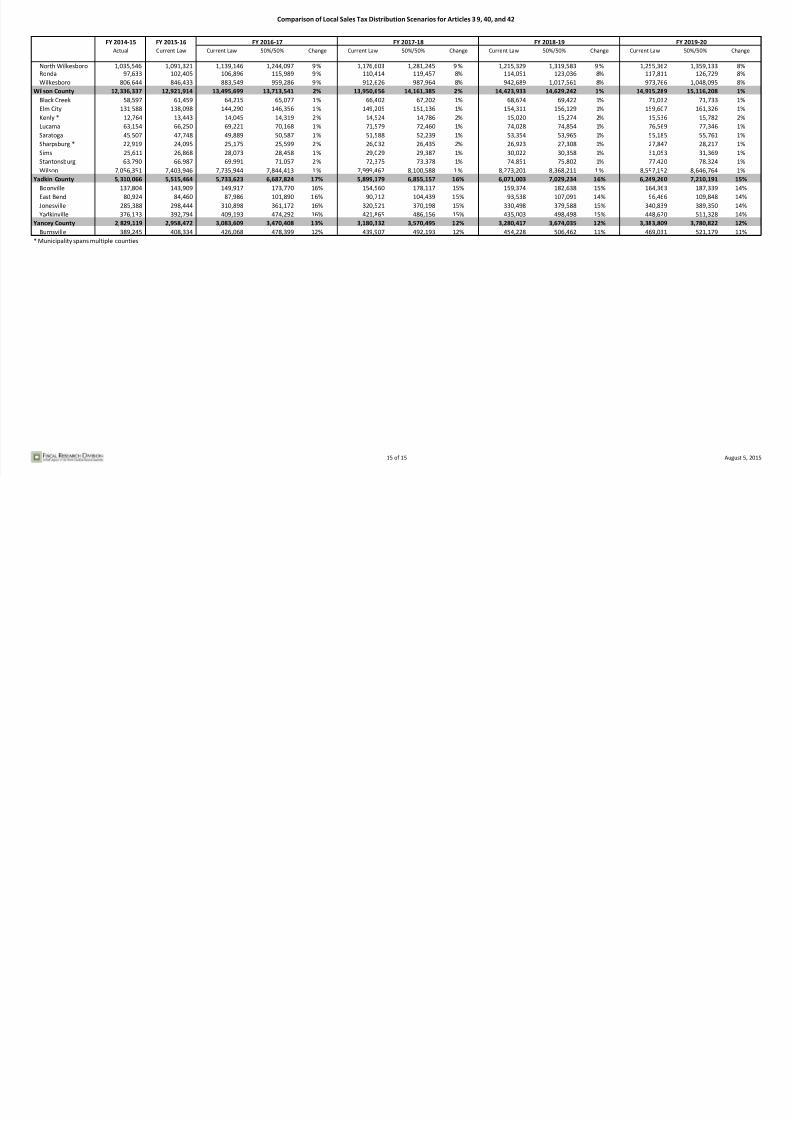
7/18/2019 Local Sales Tax Distribution Comparison Chart
http://slidepdf.com/reader/full/local-sales-tax-distribution-comparison-chart 15/15
Comparison of Local Sales Tax Distribution Scenarios for Articles 3 9, 40, and 42
15 of 15
FY 2014-15 FY 2015-16
Actual Current Law Current Law 50%/50% Change Current Law 50%/50% Change Current Law 50%/50% Change Current Law
FYFY 2016-17 FY 2017-18 FY 2018-19
North Wilkesboro 1,035,546 1,091,321 1,139,146 1,244,097 9% 1,176,603 1,281,245 9 % 1,215,329 1,319,583 9% 1,255,362
Ronda 97,633 102,405 106,896 115,989 9% 110,414 119,457 8% 114,051 123,036 8% 117,811
Wilkesboro 806,644 846,433 883,549 959,286 9% 912,626 987,964 8% 942,689 1,017,561 8% 973,766
Wilson County 12,336,337 12,921,914 13,495,699 13,713,541 2% 13,950,656 14,161,385 2% 14,423,933 14,629,242 1% 14,915,289
Black Creek 58,597 61,459 64,215 65,077 1% 66,402 67,202 1% 68,674 69,422 1% 71,032
Elm City 131,588 138,098 144,290 146,356 1% 149,205 151,136 1% 154,311 156,129 1% 159,607
Kenly * 12,764 13,443 14,045 14,319 2% 14,524 14,786 2% 15,020 15,274 2% 15,536
Lucama 63,154 66,250 69,221 70,168 1% 71,579 72,460 1% 74,028 74,854 1% 76,569
Saratoga 45,507 47,748 49,889 50,587 1% 51,588 52,239 1% 53,354 53,965 1% 55,185
Sharpsburg * 22,919 24,095 25,175 25,599 2% 26,032 26,435 2% 26,923 27,308 1% 27,847
Sims 25,611 26,868 28,073 28,458 1% 29,029 29,387 1% 30,022 30,358 1% 31,053
Stantonsburg 63,790 66,987 69,991 71,057 2% 72,375 73,378 1% 74,851 75,802 1% 77,420
Wilson 7,056,351 7,403,946 7,735,944 7,844,413 1% 7,999,462 8,100,588 1 % 8,273,201 8,368,211 1% 8,557,152
Yadkin County 5,310,066 5,515,464 5,733,623 6,687,824 17% 5,899,179 6,855,157 16% 6,071,003 7,029,234 16% 6,249,260
Boonville 137,804 143,909 149,917 173,770 16% 154,560 178,117 15% 159,374 182,638 15% 164,363
East Bend 80,924 84,460 87,986 101,890 16% 90,712 104,439 15% 93,538 107,091 14% 96,466
Jonesville 285,388 298,444 310,898 361,172 16% 320,521 370,198 15% 330,498 379,588 15% 340,839
Yadkinville 376,133 392,794 409,193 474,292 16% 421,865 486,156 15% 435,003 498,498 15% 448,620
Yancey County 2,829,119 2,958,472 3,083,609 3,470,408 13% 3,180,332 3,570,495 12% 3,280,417 3,674,035 12% 3,383,809
Burnsville 389,245 408,334 426,068 478,399 12% 439,907 492,193 12% 454,228 506,462 11% 469,031
* Municipality spans multiple counties.