Local resolved investigation of hydrogen crossover in ... · 2 . 1 Introduction Proton Exchange...
24
1 Published in Energy http://dx.doi.org/10.1016/j.energy.2017.03.104 Author’s post-print Version Local resolved investigation of hydrogen crossover in polymer electrolyte fuel cell Jing Shan a, b, c , Pawel Gazdzicki c , Rui Lin a, b,* , Mathias Schulze c , K. Andreas Friedrich c,d a Clean Energy Automotive Engineering Centre, Tongji University, Shanghai 201804, Shanghai, China b School of Automotive Studies, Tongji University, Shanghai 201804, Shanghai, China c German Aerospace Center (DLR), Institute of Engineering Thermodynamics, Pfaffenwaldring 38-40, 70569 Stuttgart, Germany d University of Stuttgart, Institute of Energy Storage, Pfaffenwaldring 31, 70569 Stuttgart, Germany Abstract In this study, the effects of temperature, pressure and relative humidity (RH) on hydrogen crossover rate from anode to cathode of a PEMFC is investigated. Segmented cells are used to measure the local hydrogen crossover current density (j cross H2 ) distribution. The results present approximate linear increase of the hydrogen crossover rate with increasing temperature and hydrogen back pressure with rates of 0.038 mA cm -2 K -1 and 3.33 mA cm -2 bar -1 , respectively. Generally, slightly increased H 2 crossover is observed in gas inlet areas than cell average. Unlike the approximate linear relationship between temperature or pressure with hydrogen crossover, the effect of relative humidification on hydrogen crossover is more complex with different increasing rate before fully humidification and dramatic decline at excessive humidification. It is demonstrated that segmented cells can be advantageously applied to study local H 2 crossover of intact MEAs. Keywords hydrogen crossover; segmented cell; operating condition; PEMFC
Transcript of Local resolved investigation of hydrogen crossover in ... · 2 . 1 Introduction Proton Exchange...
1
Published in Energy http://dx.doi.org/10.1016/j.energy.2017.03.104
Author’s post-print Version
Local resolved investigation of hydrogen crossover in
polymer electrolyte fuel cell
Jing Shana, b, c, Pawel Gazdzickic, Rui Lina, b,*, Mathias Schulzec, K. Andreas Friedrichc,d
a Clean Energy Automotive Engineering Centre, Tongji University, Shanghai 201804, Shanghai, China
b School of Automotive Studies, Tongji University, Shanghai 201804, Shanghai, China
c German Aerospace Center (DLR), Institute of Engineering Thermodynamics, Pfaffenwaldring 38-40, 70569 Stuttgart, Germany
d University of Stuttgart, Institute of Energy Storage, Pfaffenwaldring 31, 70569 Stuttgart, Germany
Abstract
In this study, the effects of temperature, pressure and relative humidity (RH) on
hydrogen crossover rate from anode to cathode of a PEMFC is investigated.
Segmented cells are used to measure the local hydrogen crossover current density (j
cross H2 ) distribution. The results present approximate linear increase of the hydrogen
crossover rate with increasing temperature and hydrogen back pressure with rates of
0.038 mA cm-2 K-1 and 3.33 mA cm-2 bar-1, respectively. Generally, slightly increased
H2 crossover is observed in gas inlet areas than cell average. Unlike the approximate
linear relationship between temperature or pressure with hydrogen crossover, the
effect of relative humidification on hydrogen crossover is more complex with
different increasing rate before fully humidification and dramatic decline at excessive
humidification. It is demonstrated that segmented cells can be advantageously applied
to study local H2 crossover of intact MEAs.
Keywords hydrogen crossover; segmented cell; operating condition; PEMFC
2
1 Introduction
Proton Exchange Membrane Fuel Cells (PEMFC) have received considerable
attention from researchers in the recent decades as a source of clean energy and as an
alternative to conventional internal-combustion engines in automobile and
transportation applications due to its high power density, high efficiency, zero
emissions, nonmoving parts and silent operation. The main advantage of PEMFC
arises from the emission free electricity generation by reacting oxygen and hydrogen
to produce water and heat as the only byproducts.[1-3] However, PEMFC still faces
several difficulties, such as high cost due to use of expensive materials and limited
durability related to component degradation during operation [4]. Thus, a lot of
emphasis has been given to study, understand, and alleviate these issues [5-7].
The polymer ion conducting membrane is a key component of membrane electrode
assembly (MEA) of a PEMFC. In recent years thinner membranes have been
developed to increase ionic conductivity and, hence, to increase the cell performance.
However, with decreased membrane thickness other problems have arisen, such as
reactant crossover (especially at low current densities) and reduced mechanical
stability of the membrane.
Hydrogen crossover is the diffusion of hydrogen from the anode to the cathode
through the membrane which occurs faster than the diffusion of other gases. Several
groups [8-11] have investigated the effect of hydrogen crossover. Hydrogen crossover
has at least three negative effects on fuel cell operation: fuel efficiency reduction,
cathode potential depression, and aggressive peroxide radical formation [12].
Specifically, the hydrogen which crosses over can directly react with oxygen at the
cathode surface, resulting in reduced cell voltage due to development of so called
3
mixed cathode potentials [13, 14]. H2 and O2 could also react directly at the cathode
producing peroxide radicals at the same time, which not only attack the catalyst layer
but also the membrane, causing significant catalyst layer and membrane degradation
[15]. Wang et al. [16] demonstrated via ex-situ NMR (nuclear magnetic resonance)
and FTIR (Fourier transform infrared spectroscopic) analysis of Nafion® based MEAs
that the membrane degradation was originated from the decomposition of polymer
main chain. It is speculated that with the increased loss of membrane units, small
bubbles with the diameter of several microns started to form inside the membrane
itself. These bubbles made the membrane vulnerable to hazards of gas crossover,
which further led to a catastrophic failure of the proton exchange membrane. There
are mainly two ways to form hydrogen peroxide, one being oxygen reduction at the
cathode, the other based on the crossover of oxygen from the cathode to the anode.
The hydrogen peroxide diffuses into the membrane and reacts with metal ions, present
as impurities in the membrane to form HO• or HOO•, which can attack the polymer
and degrade the membrane [17, 18]. In addition, hydrogen radical species have also
been reported can degrade the membrane [19]. Therefore, the measurement of
hydrogen crossover is of great importance for the fundamental understanding and
practical mitigation of fuel cell degradation and membrane failure.
Effects of operating conditions on the hydrogen crossover has been investigated by
several groups [15, 20, 21] but the detailed mechanism and locally evolving process
of hydrogen crossover during the changing of operating conditions have not been
clarified. In this study, we applied segmented cell measurements, which are powerful
tools for in-operando monitoring of current density distribution [22-26], for locally
resolved monitoring of the hydrogen crossover current density distribution.
Segmented cells have been already demonstrated to be suitable to detect large
4
amounts of hydrogen crossover due to pinholes in the membrane [24]. To the best of
our knowledge, however, they have not yet been used to investigate effects of cell
temperature, back pressure and relative humidification on local hydrogen crossover
distribution in intact MEAs.
2 Experimental
In this section, the test objects and segmented cell technology are firstly described.
Afterwards the electrochemical method of measuring hydrogen crossover and
methods of measuring the effects of temperature, back pressure and relative humidity
on hydrogen crossover are described separately.
2.1 Test objects
Two different membrane electrode assemblies (MEAs) were used as test objects.
MEA1 is a commercially available MEA from Wuhan Xinyuan Corporation with a
perfluorosulfonic acid (PFSA) membrane with a thickness of 25 µm. The active
electrode area was 50 cm2. Single channel serpentine flow fields were applied on both
electrodes of the cell. In order to keep the MEA, the gaskets and the segmented board
in good contact, clamping pressure of 8 bars was provided by cylinder compression.
Relative humidity was controlled by passing reactants through bubbler humidifiers.
MEA2 is a commercially available product from Johnson Matthey Fuel Cells. The
membrane thickness was 20 - 25 µm and the active electrode area was 25 cm2. The
experiments were conducted on a homemade single cell test bench at DLR (see
affiliation above) in Stuttgart, Germany, using single channel serpentine flow fields.
50 cm2 and 25 cm2 cell plates are used for MEA1 and MEA2, respectively. The test
5
samples were conditioned at 1000 mA cm-2 with fully humidified gases for 20 hours.
Stoichiometry ratios were 1.5 and 2.0 for hydrogen and air, respectively.
2.2 Segmented cell technology
To investigate the locally resolved hydrogen crossover current density, the segmented
printed circuit broad (PCB) technology [22 - 24, 27] was adopted. The segmented
flow field plate integrated with temperature sensors was installed between the MEA
and the anode current collector plate. Our previous study [24] ascertained the
assumption of identical current density distributions in anode and cathode by
integrating segmented bipolar plates on both sides of the cell. The identical current
density distributions obtained indicate negligible lateral currents due to high
conductivity perpendicular to the membrane plane compared to the in-plane
conductivity and the anode and cathode current density distributions are equivalent.
The current density distribution data were collected using a data acquisition unit
consisting of a multiplexer and a digital multimeter. In this study, two segmented
plates with the same segment configuration but different segment size were used for
MEA1 and MEA2, respectively.
2.3 Measuring hydrogen crossover rate
After the conditioning procedure a nitrogen flow was introduced into the cathode to
remove the air and the anodic H2 flow was set at a constant rate. The specific flow of
nitrogen was 120 ml min-1 for MEA1 and 60 ml min-1 for MEA2. The hydrogen flow
was 380 ml min-1 for MEA1 and 190 ml min-1 for MEA2. After 20 mins of N2
flushing, the cathode potential was below 120 mV. Then a Zahner IM6 potentiostat
was connected to the fuel cell for H2 crossover measurements, with the working
electrode probe connected to the cathode and the counter/reference electrode probes
6
connected together to the anode. The current produced from the oxidation of crossed
H2 from the anode was measured at a potential of 0.4 V. At this cathode potential, all
H2 that has crossed over from the anode to the cathode should be completely oxidized,
producing a current (Jcross H2 ) indicating the amount of hydrogen that has crossed over.
The molar permeation flux density (j) of hydrogen through the membrane is
determined by the measured crossover current densities (jcross H2 ) using Faraday’s law
2crossHjzF
j = (1)
Throughout the whole experiment the hydrogen crossover current density distribution
was recorded using a segmented plate.
2.4 Effects of temperature and back pressure on H2 crossover rate
MEA1 was used in this section. Throughout the experiment the RH was kept at 100%
for both electrodes. The investigated cell temperature range was from 50 °C to 80 °C
and the investigated back pressure range was from 1.4 bars to 1.9 bars absolute
pressure. Throughout the experiment, jcross H2 was recorded by a 50 cm2 segmented plate.
2.5 Effects of relative humidity on H2 crossover rate
To analyze the effect of relative humidity on hydrogen crossover MEA2 was used.
The RH range, controlled by adjusting the dew point temperature of bubbler
humidifiers, was from 50% to excessive humidification. Back pressures were kept at
1.5 absolute bars for both electrodes and cell temperature was kept constant at 80 °C. j
cross H2 distribution was recorded throughout the experiment using a 25 cm2 segmented
plate.
7
3 Results and discussion
3.1 Effects of cell temperature on H2 crossover
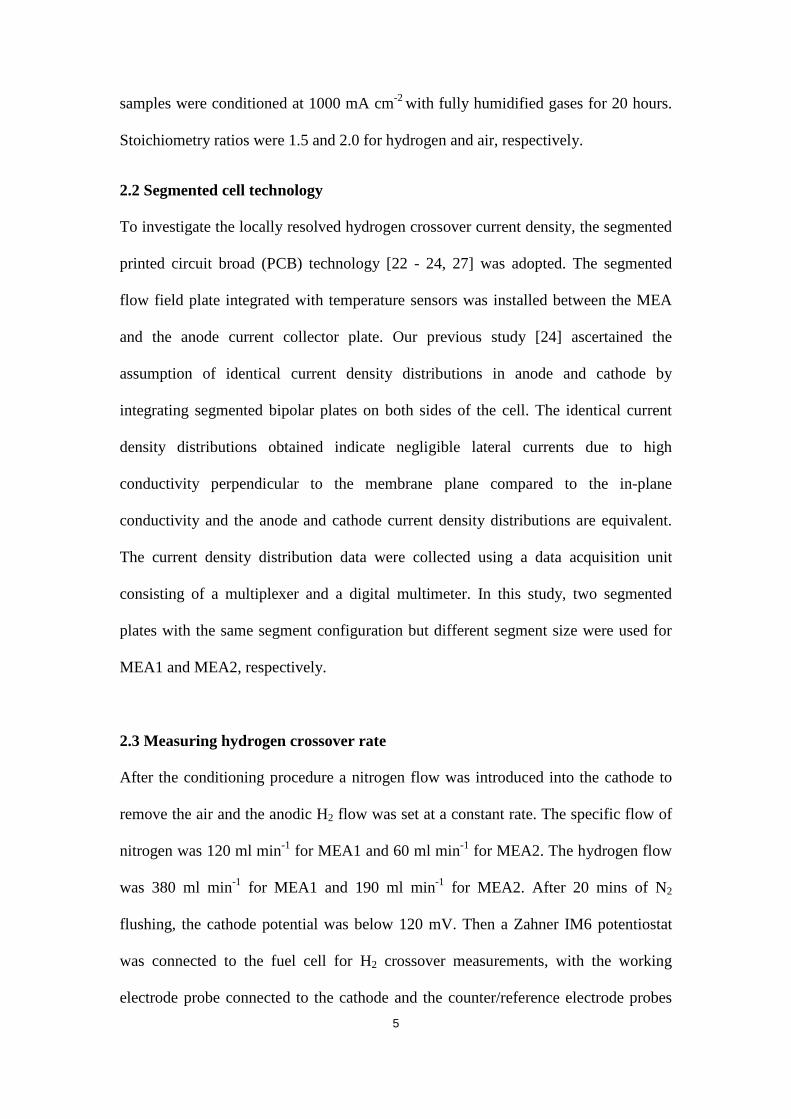
Fig. 1 shows the H2 crossover current density jcross H2 in cell temperature range of 50 °C
to 80 °C at 100% relative humidity. In the individual panels jcross H2 is plotted as an
average value of the entire cell (A), gas inlet area (B), center flow field area (C), and
gas outlet area (D). The data is determined from segmented cell measurements
depicted in Figure 2. In accordance with Inaba et al. [28] it was found that the average
hydrogen crossover current density increases with temperature. In panel (A) an almost
linearly dependence of jcross H2 on Tcell is observed with a slope of 0.038 mA cm-2 K-1.
From a thermodynamic perspective, gas diffusion through polymers is due to random
thermal movement of gas molecules in the polymer structure as reviewed by Rogers
[29]. Through thermally activated jumps, gas molecules can permeate across the
barriers comprised of van der Waals force between the polymer chains [30]. So when
temperature increases, the thermally activated hydrogen molecules could permeate
across more barriers which lead to an increased hydrogen diffusion coefficient. From
the perspective of microscopic structure of the membrane, the flexibility of the
membrane increases with increasing temperature [28, 31]. Apart from that, the
movement of the hydrophobic backbone in the PFSA membrane is facilitated at
elevated temperatures, resulting in increased free volume for the hydrogen crossover
in the PFSA membrane [32].
8
Fig. 1 H2 crossover current density at different cell temperature of MEA1. (H2 flow: 380 ml min-1, N2 flow: 120 ml min-1, 100% RH, back pressure: 1.5 bars absolute pressure for both electrodes). In (A) the average current density of the entire cell is plotted along with a linear fit (included in other panels for comparison). In (B) the gas inlet area corresponds to segments in lines 1 and 2 according to the images in Figure 2. Center area is defined as segments of lines 3, 4, and 5 (C). Gas outlet area corresponds to segments of lines 6 and 7.
9
(a) 50 oC (b) 60 oC
(c) 70 oC (d) 80 oC
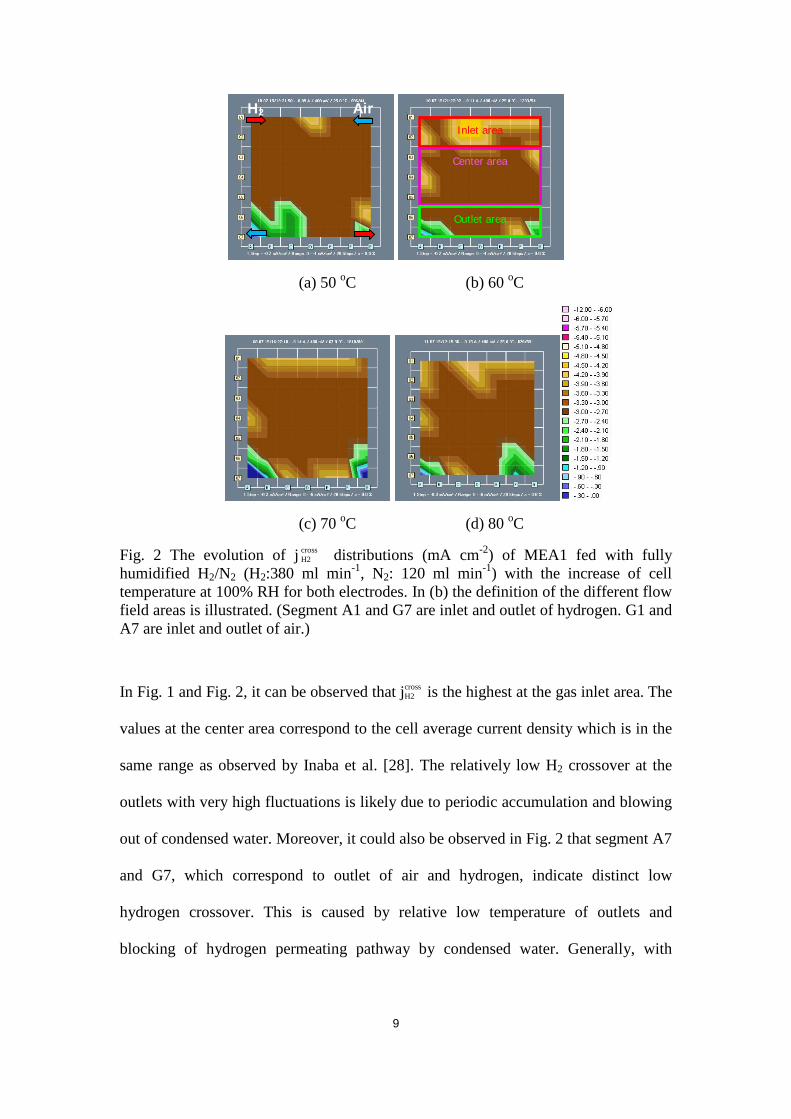
Fig. 2 The evolution of j cross H2 distributions (mA cm-2) of MEA1 fed with fully
humidified H2/N2 (H2:380 ml min-1, N2: 120 ml min-1) with the increase of cell temperature at 100% RH for both electrodes. In (b) the definition of the different flow field areas is illustrated. (Segment A1 and G7 are inlet and outlet of hydrogen. G1 and A7 are inlet and outlet of air.)
In Fig. 1 and Fig. 2, it can be observed that jcross H2 is the highest at the gas inlet area. The
values at the center area correspond to the cell average current density which is in the
same range as observed by Inaba et al. [28]. The relatively low H2 crossover at the
outlets with very high fluctuations is likely due to periodic accumulation and blowing
out of condensed water. Moreover, it could also be observed in Fig. 2 that segment A7
and G7, which correspond to outlet of air and hydrogen, indicate distinct low
hydrogen crossover. This is caused by relative low temperature of outlets and
blocking of hydrogen permeating pathway by condensed water. Generally, with
Air H2
Inlet area
Center area
Outlet area
10
increasing cell temperature the crossover rate increases but the H2 crossover
distribution remains largely unchanged.
3.2 Effects of back pressure on H2 crossover
The main permeating path of hydrogen molecules is the aqueous phase that constructs
the proton conducting water channels [33]. The pressures applied in PEMFC are
smaller than the capillary pressures in the water channels, which are estimated by
Eikerling [34] to be in the order of 100 bars. Hence, the transport of gases through the
water channels of Nafion is not driven by differential pressure but by diffusion.
A concentration difference Δc of molecules over a distance d, here d is the membrane
thickness, yields a molar permeation flux density j, as described by Fick’s law [30]
cDd
j D= − (3)
where D represents the diffusion coefficient of the gas in the considered medium. The
permeated hydrogen molecules will be oxidized instantaneously as soon as it reaches
the cathode catalyst layer at the applied voltage. So in our study, Δc is approximated
to be the concentration in the anode side, eq (4) could be modified as
anodecDd
j = − (4)
According to Henry’s law, the H2 concentration at anode is proportional to the
pressure in our considered pressure range. So the canode here is approximated to be
proportional to the anode hydrogen partial pressure PH2
2 *HP SDd
j = − (5)
11
where S is the scale factor that is independent of the pressure in our considered
pressure range. In our study, the feeding gas was 100% humidified at 80 oC before
introducing into the anode so the total anode inlet pressure Pinlet (the inlet pressure
was assumed to be equal to the back pressure) is the sum of hydrogen partial pressure
and water vapor partial pressure Pvapor
2inlet H vaporP P P= + (6)
Combined eq (5) with eq (6), the following equations could be obtained
( )*inlet vaporP P S
Dd
j−
= − (7)
inlet vaporDS DSP Pd d
j = − + (8)
With a constant Pvapor at 80 oC and DSd
independent of pressure in our considered
pressure range, the hydrogen permeating flux j is approximately proportional to
anode inlet pressure Pinlet.
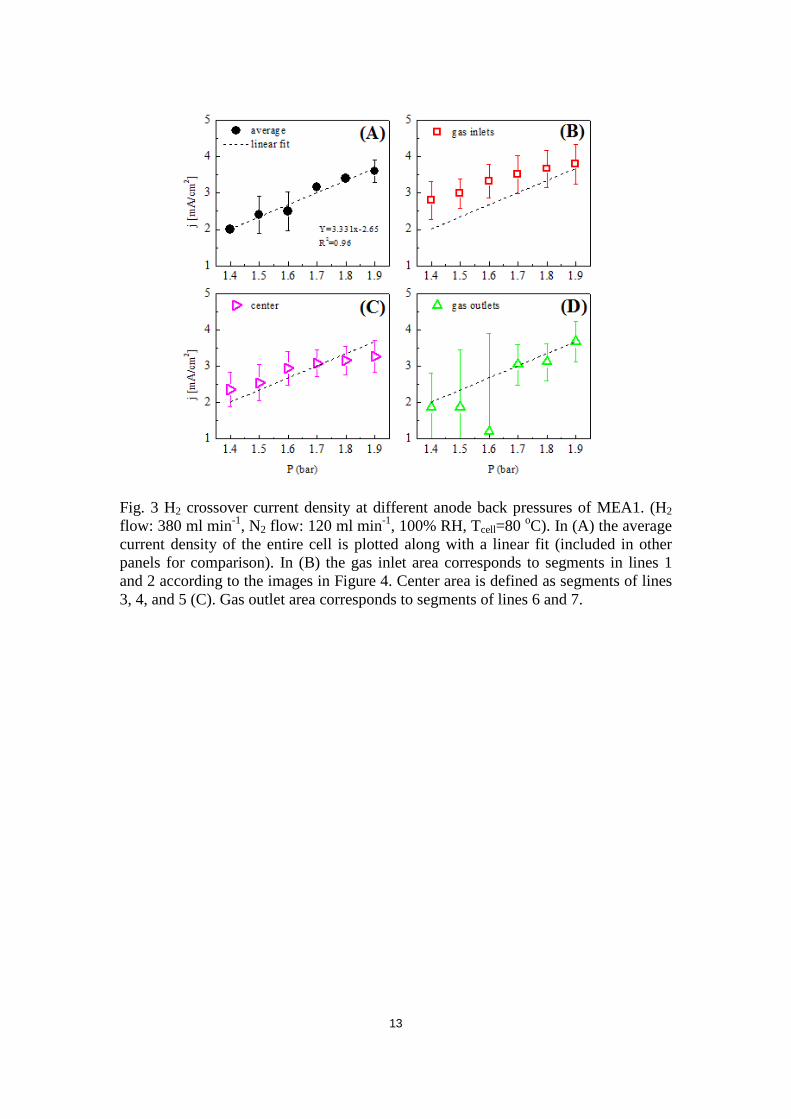
The effects of anode back pressure on jcross H2 is demonstrated in Fig. 3. By linear fitting,
the average jcross H2 of the entire cell in Fig. 3 (A) shows a goodness of fit R2 = 0.96 and a
slope of 3.331 mA cm-2 bar-1. The measurement results confirmed our assumption of a
close linear relationship between anode hydrogen partial pressure and hydrogen
crossover rate. However, in literature a deviation from the linear behavior was
observed when further decreasing the pressure down to ambient pressure [28].
According to Fig. 3 (B) and (C) that the jcross H2 in gas inlet area is always above the
average fit curve and the jcross H2 in center area is above the average fit curve below 1.7
absolute bars and lower than average value when anode back pressure is higher than
12
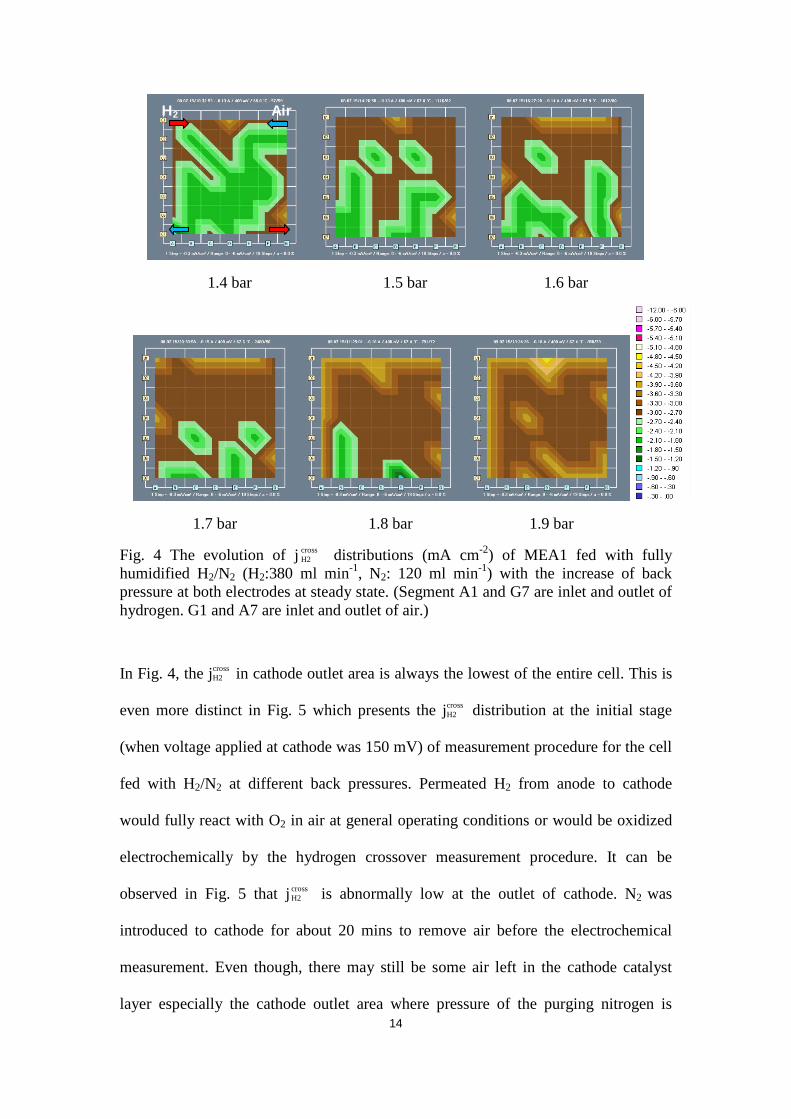
1.7 absolute bars. This could also be observed in Fig. 4 which shows the local jcross H2
distribution at different anode back pressures. Moreover, the jcross H2 increasing rate in
inlet and center area slows down starting from 1.7 absolute bars. The jcross H2 in outlet
area is always below the average fit curve but the increasing rate bounces back
starting from 1.7 absolute bars. This could be attributed to the pressure loss along the
flow field which means the local hydrogen pressure decreases from inlet area to outlet
area. However the absolute pressure loss is almost constant in this pressure range
which means the relative pressure loss decreases with increasing anode back pressure
from inlet area to outlet area. So the jcross H2 points approach average fit curve in outlet
area at high back pressure level and the jcross H2 homogeneity of the entire cell increases
which could be indicated by the decreased standard deviation in Fig. 3(A). The
abnormal value in Fig. 3(D) at 1.5 and 1.6 absolute bars could be caused by the
flooding water which blocks the hydrogen permeating pathway.
13
Fig. 3 H2 crossover current density at different anode back pressures of MEA1. (H2 flow: 380 ml min-1, N2 flow: 120 ml min-1, 100% RH, Tcell=80 oC). In (A) the average current density of the entire cell is plotted along with a linear fit (included in other panels for comparison). In (B) the gas inlet area corresponds to segments in lines 1 and 2 according to the images in Figure 4. Center area is defined as segments of lines 3, 4, and 5 (C). Gas outlet area corresponds to segments of lines 6 and 7.
14
1.4 bar 1.5 bar 1.6 bar
1.7 bar 1.8 bar 1.9 bar
Fig. 4 The evolution of j cross H2 distributions (mA cm-2) of MEA1 fed with fully
humidified H2/N2 (H2:380 ml min-1, N2: 120 ml min-1) with the increase of back pressure at both electrodes at steady state. (Segment A1 and G7 are inlet and outlet of hydrogen. G1 and A7 are inlet and outlet of air.)
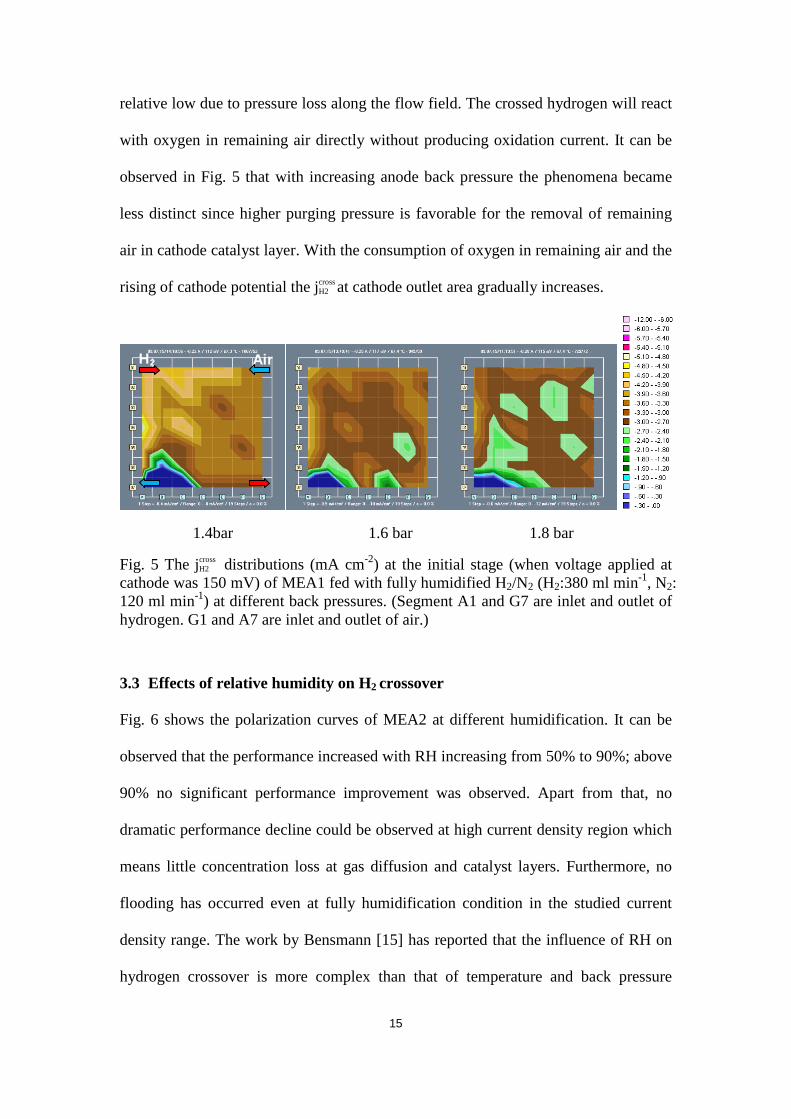
In Fig. 4, the jcross H2 in cathode outlet area is always the lowest of the entire cell. This is
even more distinct in Fig. 5 which presents the jcross H2 distribution at the initial stage
(when voltage applied at cathode was 150 mV) of measurement procedure for the cell
fed with H2/N2 at different back pressures. Permeated H2 from anode to cathode
would fully react with O2 in air at general operating conditions or would be oxidized
electrochemically by the hydrogen crossover measurement procedure. It can be
observed in Fig. 5 that j cross H2 is abnormally low at the outlet of cathode. N2 was
introduced to cathode for about 20 mins to remove air before the electrochemical
measurement. Even though, there may still be some air left in the cathode catalyst
layer especially the cathode outlet area where pressure of the purging nitrogen is
H2 Air
15
relative low due to pressure loss along the flow field. The crossed hydrogen will react
with oxygen in remaining air directly without producing oxidation current. It can be
observed in Fig. 5 that with increasing anode back pressure the phenomena became
less distinct since higher purging pressure is favorable for the removal of remaining
air in cathode catalyst layer. With the consumption of oxygen in remaining air and the
rising of cathode potential the jcross H2 at cathode outlet area gradually increases.
1.4bar 1.6 bar 1.8 bar
Fig. 5 The jcross H2 distributions (mA cm-2) at the initial stage (when voltage applied at
cathode was 150 mV) of MEA1 fed with fully humidified H2/N2 (H2:380 ml min-1, N2: 120 ml min-1) at different back pressures. (Segment A1 and G7 are inlet and outlet of hydrogen. G1 and A7 are inlet and outlet of air.)
3.3 Effects of relative humidity on H2 crossover
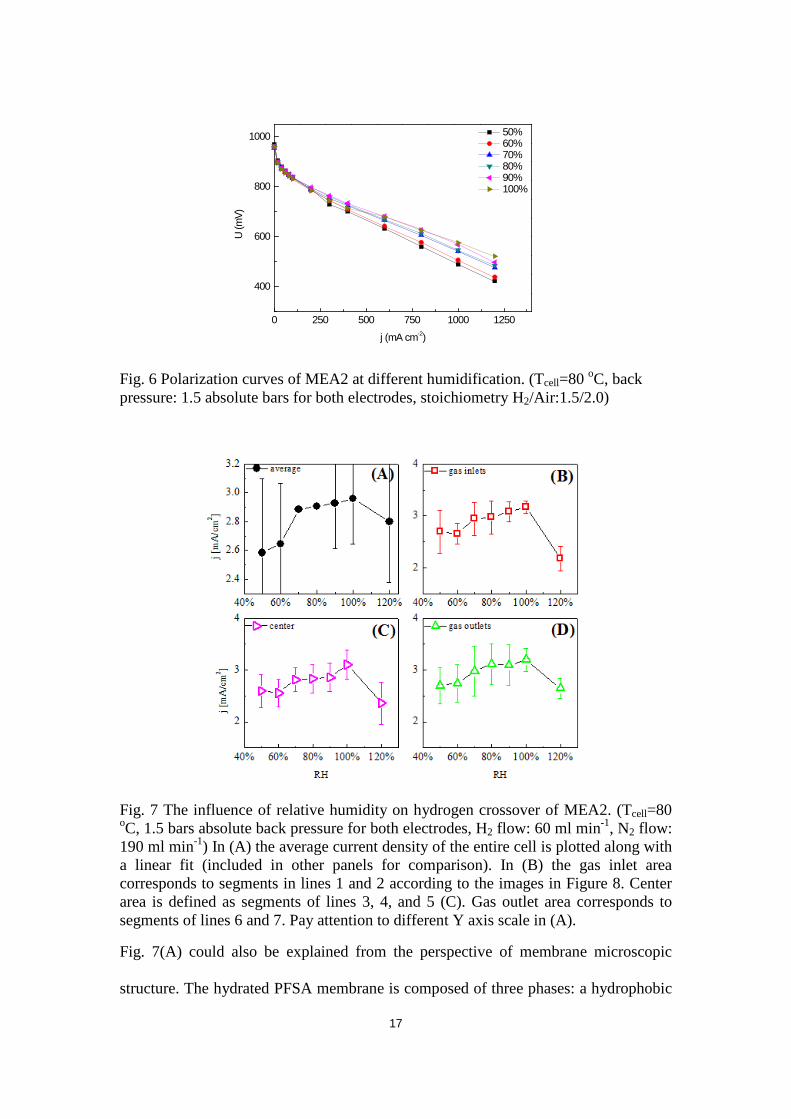
Fig. 6 shows the polarization curves of MEA2 at different humidification. It can be
observed that the performance increased with RH increasing from 50% to 90%; above
90% no significant performance improvement was observed. Apart from that, no
dramatic performance decline could be observed at high current density region which
means little concentration loss at gas diffusion and catalyst layers. Furthermore, no
flooding has occurred even at fully humidification condition in the studied current
density range. The work by Bensmann [15] has reported that the influence of RH on
hydrogen crossover is more complex than that of temperature and back pressure
Air H2
16
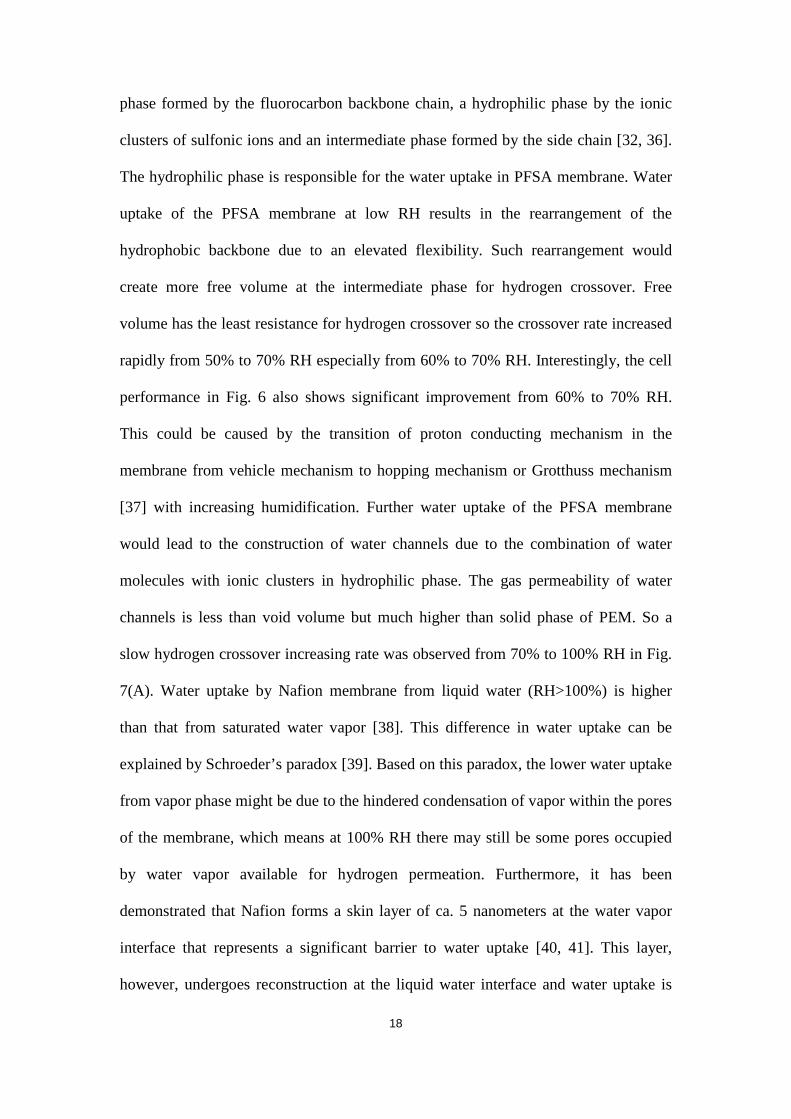
where approximate linear dependencies are observed. According to Fig. 7(A) H2
crossover current density increased non-linearly when RH was increased from 50% to
100% and then jcross H2 decreased when RH exceeded 100%. The behavior for RH < 100%
is consistent with the study by Inaba et al. [28] which covers the RH range 40 – 80%.
For the sake of completeness it is noted that at dry conditions an increased H2
crossover rate is observed due to reduced membrane tightness which becomes
subsequently reduced with slightly increasing humidification [35]. In our experiment,
starting at RH=50%, increasing RH will increase the water content in the membrane,
which may increase both H2 solubility and diffusion coefficients thus increase H2
crossover. However, based on eq (6), for a controlled anode inlet pressure and
constant cell temperature, the increase in RH would lead to the increase of vapor
partial pressure Pvapor and decrease of hydrogen partial pressure PH2. As has been
studied in 3.2, a reduced hydrogen partial pressure would lead to a reduced jcross H2 . So
from 50% to 100% RH the effect of increasing H2 solubility and diffusion coefficient
was bigger than that caused by PH2 reduction, resulting in increased hydrogen
crossover. With the H2 solubility and diffusion coefficient approaching saturation, the
PH2 reduction began to slow the jcross H2 increasing rate down when RH increased from
70% to 100%. jcross H2 began to decline at excessive humidification most likely due to
flooding of gas diffusion and catalyst layers which hinders hydrogen crossover.
17
0 250 500 750 1000 1250
400
600
800
1000 50% 60% 70% 80% 90% 100%
U (m
V)
j (mA cm-2)
Fig. 6 Polarization curves of MEA2 at different humidification. (Tcell=80 oC, back pressure: 1.5 absolute bars for both electrodes, stoichiometry H2/Air:1.5/2.0)
Fig. 7 The influence of relative humidity on hydrogen crossover of MEA2. (Tcell=80 oC, 1.5 bars absolute back pressure for both electrodes, H2 flow: 60 ml min-1, N2 flow: 190 ml min-1) In (A) the average current density of the entire cell is plotted along with a linear fit (included in other panels for comparison). In (B) the gas inlet area corresponds to segments in lines 1 and 2 according to the images in Figure 8. Center area is defined as segments of lines 3, 4, and 5 (C). Gas outlet area corresponds to segments of lines 6 and 7. Pay attention to different Y axis scale in (A).
Fig. 7(A) could also be explained from the perspective of membrane microscopic
structure. The hydrated PFSA membrane is composed of three phases: a hydrophobic
18
phase formed by the fluorocarbon backbone chain, a hydrophilic phase by the ionic
clusters of sulfonic ions and an intermediate phase formed by the side chain [32, 36].
The hydrophilic phase is responsible for the water uptake in PFSA membrane. Water
uptake of the PFSA membrane at low RH results in the rearrangement of the
hydrophobic backbone due to an elevated flexibility. Such rearrangement would
create more free volume at the intermediate phase for hydrogen crossover. Free
volume has the least resistance for hydrogen crossover so the crossover rate increased
rapidly from 50% to 70% RH especially from 60% to 70% RH. Interestingly, the cell
performance in Fig. 6 also shows significant improvement from 60% to 70% RH.
This could be caused by the transition of proton conducting mechanism in the
membrane from vehicle mechanism to hopping mechanism or Grotthuss mechanism
[37] with increasing humidification. Further water uptake of the PFSA membrane
would lead to the construction of water channels due to the combination of water
molecules with ionic clusters in hydrophilic phase. The gas permeability of water
channels is less than void volume but much higher than solid phase of PEM. So a
slow hydrogen crossover increasing rate was observed from 70% to 100% RH in Fig.
7(A). Water uptake by Nafion membrane from liquid water (RH>100%) is higher
than that from saturated water vapor [38]. This difference in water uptake can be
explained by Schroeder’s paradox [39]. Based on this paradox, the lower water uptake
from vapor phase might be due to the hindered condensation of vapor within the pores
of the membrane, which means at 100% RH there may still be some pores occupied
by water vapor available for hydrogen permeation. Furthermore, it has been
demonstrated that Nafion forms a skin layer of ca. 5 nanometers at the water vapor
interface that represents a significant barrier to water uptake [40, 41]. This layer,
however, undergoes reconstruction at the liquid water interface and water uptake is
19
improved. Hence, a decrease in hydrogen crossover was observed at excessive
humidification [32]. Fig. 7(B), (C), (D) show similar evolving trend of hydrogen
crossover with increasing RH which indicate largely homogeneous humidification
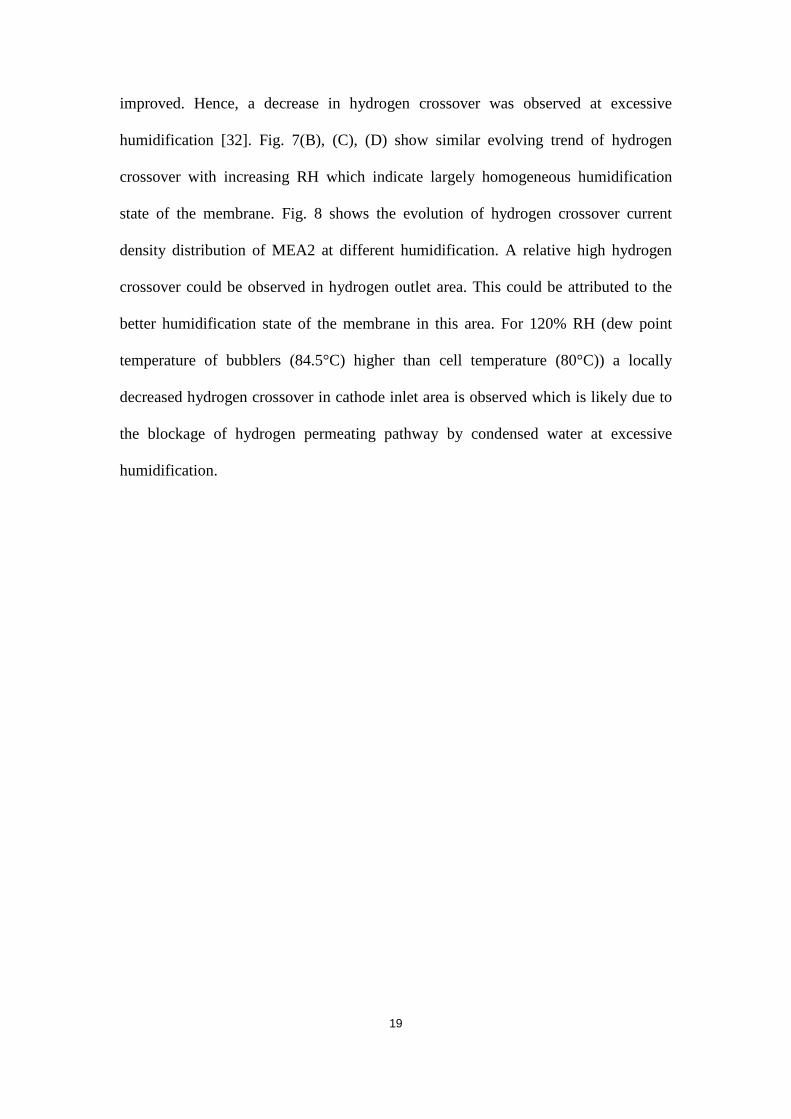
state of the membrane. Fig. 8 shows the evolution of hydrogen crossover current
density distribution of MEA2 at different humidification. A relative high hydrogen
crossover could be observed in hydrogen outlet area. This could be attributed to the
better humidification state of the membrane in this area. For 120% RH (dew point
temperature of bubblers (84.5°C) higher than cell temperature (80°C)) a locally
decreased hydrogen crossover in cathode inlet area is observed which is likely due to
the blockage of hydrogen permeating pathway by condensed water at excessive
humidification.
20
50% 60% 70% 80%
90% 100% 120%
Fig. 8 The evolution of hydrogen crossover current density distribution of MEA2 at different reactant gases humidification. (Tcell=80 oC, 1.5 bars absolute back pressure for both electrodes, H2 flow: 60 ml min-1, N2 flow: 190 ml min-1, segment A1 and G7 are inlet and outlet of hydrogen. G1 and A7 are inlet and outlet of air.).
In previous studies [24] segmented cell measurements have been used to study H2
crossover of defected MEAs in which a pinhole has emerged due to a sudden pressure
drop of reactant gases. Bodner et al. used segmented cells to study the localization of
artificial pinholes in MEAs [42]. In the case of membrane defects jcross H2 reached values
up to 300 mA cm-2 which are substantially higher than the crossover values of intact
membranes shown in this paper. Therefore, our results show that local j cross H2
distribution of different intact membranes can be positively analyzed using the
segmented cell technology under different conditions.
Air H2
21
4 Conclusions
In this study, the segmented cell technology was applied for the first time to study
local H2 crossover of intact MEAs versus cell temperature, gas pressure and humidity.
From the measurements following conclusions have been drawn:
– A linear increase of H2 crossover with increasing temperature and hydrogen
back pressure was observed. Thereby, H2 crossover was higher in the gas inlet
area than cell average.
- RH has a smaller effect on H2 crossover than that of temperature or pressure.
The dependence of H2 crossover rate is non-linear increasing for RH
increasing up to 100 % and decreasing at excessive humidification: The
measured H2 current density distribution is homogeneous at all studied RH
values.
- The effect of RH on H2 crossover is explained by taking into account the H2
partial pressure, H2 solubility and diffusion coefficients in the membrane as
well as microscopic structure of the membrane at different humidification
levels.
Acknowledgements
This work was supported by the National Natural Science Foundation of China (No.
21276199), The Young Talents "Climbing" Program of Tongji University, The
Fundamental Research Funds for the Central Universities and 111 Project (No.
B08019).
The research leading to these results has received funding from the European Union's
Seventh Framework Programme (FP7/2007-2013) for Fuel Cell and Hydrogen Joint
Technology Initiative under Grant No. 303452 (Impact)
22
References
[1] L. Guétaz, S. Escribano, O. Sicardy, Journal of Power Sources, 212 (2012) 169-178.
[2] C. Bao, W.G. Bessler, Journal of Power Sources, 278 (2015) 675-682.
[3] R. Lin, B. Li, Y.P. Hou, J.M. Ma, International Journal of Hydrogen Energy, 34 (2009)
2369-2376.
[4] A. Alaswad, A. Baroutaji, H. Achour, J. Carton, A. Al Makky, A.G. Olabi, International
Journal of Hydrogen Energy, 41 (2016) 16499-16508.
[5] S. Enz, T.A. Dao, M. Messerschmidt, J. Scholta, Journal of Power Sources, 274 (2015)
521-535.
[6] Y.-H. Lai, G.W. Fly, Journal of Power Sources, 274 (2015) 1162-1172.
[7] S. Zhang, X.-Z. Yuan, J.N.C. Hin, H. Wang, K.A. Friedrich, M. Schulze, Journal of Power
Sources, 194 (2009) 588-600.
[8] R.N. Carter, S.S. Kocha, F. Wagner, M. Fay, H.A. Gasteiger, Ecs Transactions, 11 (2007).
[9] I.A. Schneider, D. Kramer, A. Wokaun, G.G. Scherer, Electrochemistry Communications,
9 (2007) 1607-1612.
[10] I.M. Kong, A. Jung, B.J. Kim, K.D. Baik, M.S. Kim, Energy, 93 (2015) 57-66.
[11] P. Sayadi, S. Rowshanzamir, M.J. Parnian, Energy, 94 (2016) 292-303.
[12] C. Francia, V.S. Ijeri, S. Specchia, P. Spinelli, Journal of Power Sources, 196 (2011)
1833-1839.
[13] S. Takaichi, H. Uchida, M. Watanabe, Electrochemistry Communications, 9 (2007)
1975-1979.
[14] J. Zhang, Y. Tang, C. Song, J. Zhang, H. Wang, Journal of Power Sources, 163 (2006)
532-537.
[15] B. Bensmann, R. Hanke-Rauschenbach, K. Sundmacher, International Journal of
Hydrogen Energy, 39 (2014) 49-53.
[16] F. Wang, H. Tang, M. Pan, D. Li, International Journal of Hydrogen Energy, 33 (2008)
2283-2288.
[17] T. Kinumoto, M. Inaba, Y. Nakayama, K. Ogata, R. Umebayashi, A. Tasaka, Y. Iriyama,
T. Abe, Z. Ogumi, Journal of Power Sources, 158 (2006) 1222-1228.
[18] V.A. Sethuraman, J.W. Weidner, A.T. Haug, S. Motupally, L.V. Protsailob, Journal of
the Electrochemical Society, 155 (2008) B50-B57.
[19] L. Ghassemzadeh, T.J. Peckham, T. Weissbach, X. Luo, S. Holdcroft, Journal of the
American Chemical Society, 135 (2013) 15923-15932.
[20] X. Cheng, J. Zhang, Y. Tang, C. Song, J. Shen, D. Song, J. Zhang, Journal of Power
Sources, 167 (2007) 25-31.

23
[21] H. Ito, T. Maeda, A. Nakano, H. Takenaka, International Journal of Hydrogen Energy,
36 (2011) 10527-10540.
[22] W. Tang, R. Lin, Y. Weng, J. Zhang, J. Ma, International Journal of Hydrogen Energy,
38 (2013) 10985-10991.
[23] M. Schulze, E. Gülzow, S. Schönbauer, T. Knöri, R. Reissner, Journal of Power Sources,
173 (2007) 19-27.
[24] R. Lin, E. Gülzow, M. Schulze, K.A. Friedrich, Journal of The Electrochemical Society,
158 (2011) B11.
[25] C. Yin, J. Gao, X. Wen, G. Xie, C. Yang, H. Fang, H. Tang, Energy, 113 (2016) 1071-
1089.
[26] Q. Zhang, R. Lin, L. Técher, X. Cui, Energy, 115 (2016) 550-560.
[27] J. Shan, R. Lin, S. Xia, D. Liu, Q. Zhang, International Journal of Hydrogen Energy, 41
(2016) 4239-4250.
[28] M. Inaba, T. Kinumoto, M. Kiriake, R. Umebayashi, A. Tasaka, Z. Ogumi,
Electrochimica Acta, 51 (2006) 5746-5753.
[29] C.E. Rogers, Permeation of Gases and Vapours in Polymers, in: J. Comyn (Ed.) Polymer
Permeability, Springer Netherlands, Dordrecht , ISBN 978-94-009-4858-7, 1985, pp. 11-73.
[30] M. Schalenbach, T. Hoefner, P. Paciok, M. Carmo, W. Lueke, D. Stolten, Journal of
Physical Chemistry C, (2015).
[31] S.S. Kocha, J. Deliang Yang, J.S. Yi, AIChE Journal, 52 (2006) 1916-1925.
[32] H. Zhang, J. Li, H. Tang, Y. Lin, M. Pan, International Journal of Hydrogen Energy, 39
(2014) 15989-15995.
[33] Y. Wang, N.A. Lane, C.N. Sun, F. Fan, T.A. Zawodzinski, A.P. Sokolov, Journal of
Physical Chemistry B, 117 (2013) 8003-8009.
[34] M.H. Eikerling, P. Berg, Soft Matter, 7 (2011) 5976.
[35] D. Gerteisen, N. Zamel, C. Sadeler, F. Geiger, V. Ludwig, C. Hebling, International
Journal of Hydrogen Energy, 37 (2012) 7736-7744.
[36] E.J. Roche, M. Pineri, R.D. †, Journal of Polymer Science Polymer Physics Edition, 20
(1982) 107–116.
[37] S.J. Paddison, Annual Review of Materials Research, 33 (2003) 289-319.
[38] J.T. Hinatsu, M. Mizuhata, H. Takenaka, J.T. Hinatsu, H. Takenaka, Journal of the
Electrochemical Society, 141 (1994) 1493-1498.
[39] T.A. Zawodzinski, C. Derouin, S. Radzinski, R.J. Sherman, V.T. Smith, T.E. Springer, S.
Gottesfeld, Journal of the Electrochemical Society, 140 (1993) 1041-1047.
[40] K.-D. Kreuer, Solid State Ionics, 252 (2013) 93-101.

24
[41] R. Hiesgen, S. Helmly, T. Morawietz, X.-Z. Yuan, H. Wang, K.A. Friedrich,
Electrochimica Acta, 110 (2013) 292-305.
[42] M. Bodner, C. Hochenauer, V. Hacker, Journal of Power Sources, 295 (2015) 336-348