NACCHO Operational Definition - Local Public Health Information

Local Public Health Workforce Benchmarks
[ REPORT ]
May 2011

Local Public Health Department Workforce � 2
Executive Summary
This report offers a blueprint for the development of benchmarks to assist local
health departments (LHDs) in meeting current staffing standards and inform
workforce development activities by facilitating the identification of local public
health practice workforce needs and gaps. Commissioned by the National
Association of County and City Health Officials (NACCHO), this project was
guided by NACCHO’s Workforce and Leadership Development Committee.
A review of historical and currently available measures of the local public health
workforce provides context for the assessment of LHD characteristics and other
factors that may affect staffing levels and composition. Included in this review
were Emerson’s landmark examinations of the national public health system in
the 1940s, ongoing surveys of government employment levels and standard
occupational categories conducted by federal agencies, and recommendations
of public health professional organizations. NACCHO’s series of National Profile
of Local Health Departments (Profile) studies emerged as the most
comprehensive and appropriate foundation for local public health workforce
benchmarking applications. Preliminary analyses of Profile data identified
governance pattern and the provision of specific clinical services as major
influences on the number and types of public health workers in LHDs serving
populations of all sizes. Other possible influences merit further investigation.
An initial benchmarking strategy for two applications is proposed. One
application compares an LHD’s existing staffing, in terms of all staff and 13
occupations, to benchmarks specific for key LHD characteristics. Initially these
benchmarks reflect the median full-time equivalent (FTE) worker to population
ratios for LHDs with similar population, governance, and clinical service
characteristics. After a sufficient number of LHDs are accredited, these
benchmarks will reflect the median FTE worker to population ratios for
accredited LHDs with similar population, governance, and clinical service
characteristics. As other influences are identified, these would be incorporated
into the initial model described in this report.
A second benchmarking application allows for comparing the existing U.S. local
public health workforce, including specific occupations, to levels consistent with
those for fully accredited LHDs. The benchmarks for this application reflect the
number of FTE local public health workers needed if the total U.S. population
were served by an accredited LHD.
Four recommendations to further develop and refine this benchmarking
initiative are offered: (1) develop and deploy an initial LHD staffing application;
(2) proceed toward the development of a U.S. local public health workforce
adequacy application; (3) plan revisions of future Profile survey questions
related to the local public health workforce data sources and identify beneficial
enhancements of existing federal data systems in order to advance these
benchmarking applications; and (4) increase public health systems research in
this area.

Local Public Health Department Workforce � 3
Local Public Health Workforce Benchmarks
I. Introduction: Issue and Relevance
espite the public health workforce’s
central role in protecting and promoting
the health of the public, it has received
little attention in efforts to establish local public
health practice standards. Although the
workforce is universally considered a key
component of the public health infrastructure,
little guidance exists as to the appropriate size,
composition, and skill sets of the workforce for
local health departments (LHDs). Conventional
wisdom within the public health community has
viewed public health agencies, especially LHDs,
as more different than alike in their activities.
For too long, some people believed that “If
you’ve seen one local health department, you’ve
seen one local health department”—a view
suggesting that local public health staffing
standards are neither useful nor feasible.
Across public and private sector organizations,
benchmarks serve as reference points for
measurement and comparison and as vital tools
in efforts to improve performance and results.
Benchmarks could potentially contribute to
strengthening the local public health workforce
in several ways. At one level, staffing
benchmarks can inform and guide LHDs in
organizing and structuring the programs and
services offered in the communities they serve.
Such benchmarks can identify staffing gaps and
facilitate recruitment, retention, and career
development activities. At another level,
benchmarks would allow for the identification of
local, regional, state, or national gaps and
shortages for specific public health occupations
and the national public health workforce. At yet
another level, benchmarks serve as standards
that promote consistent quality in practice and as
a template for performance improvement and
more effective workforce development
strategies. Greater consistency in staffing
patterns can facilitate more meaningful research
into the relationship between staffing patterns
and the policies, programs, and services that are
developed by LHDs to improve population
health within their jurisdictions. Elucidating the
links between inputs (such as staffing), outputs
(programs and services), and outcomes in the
community remains the central challenge for the
public health systems research agenda.
Yet, staffing benchmarks are only proxy
measures for the capacity of workers to carry out
the important work of their organization.
Quantitative benchmarks—such as the number
of full-time equivalent employees (FTEs) or the
number of nurses, health educators,
epidemiologists, environmental health
specialists, etc. or ratios of FTE workers to
population—may not fully convey key aspects
of human resource capacity. Measures of
proficient performance—such as skill and
competency levels for entry-, mid-, and
advanced-level workers—can augment
quantitative benchmarks but remain elusive to
identify and apply in the real world. Ultimately,
systems of work-doing must focus on three key
elements: the worker, the work, and the work
organization with staffing benchmarks
conveying important information for all three.
For local public health practice, the scope and
content of the work to be performed, as well as
strategies for delegating duties and roles, are
continuously evolving. In this light, benchmarks
become moving targets.
Benchmarks are not merely standards (either
minimal or optimal) to be met; rather they serve
as a basis for comparisons that serve specific
purposes. An early set of benchmarks for LHD
staffing is apparent in the work of the American
Public Health Association’s (APHA) Committee
on Administrative Practice (CAP) in the 1930s
and 1940s. CAP’s landmark report1 in 1945
(often called the Emerson Report because of the
influence of the committee’s chair, Haven
Emerson) provided a blueprint for the
establishment of a national network of LHDs.
The Emerson report also projected LHD
workforce staffing needs for its proposed
national network based on an assessment of
actual LHD staffing patterns in 1942 (Table 1).
1 Emerson, H. and Luginbuhl, M. American Public Health
Association, Committee on Administrative Practice,
Subcommittee on Local Health Units. (1945). Local Health
Units for the Nation. New York, NY: The Commonwealth
Fund.
D

Local Public Health Department Workforce � 4
Table 1. Existing and Suggested Personnel and Expenditures for Local Health Services1
The benchmarks offered in the Emerson report
may not be applicable to modern public health
practice due to several considerations. One is
that the scope of local public health practice in
the 1940s was more limited than it is today.
Local public health practice at the time was
organized around six basic services (vital
records, sanitation, communicable disease
control, maternal and child health, health
education, and laboratory services). Also,
Emerson envisioned a network of LHDs
nationally, with each serving a minimum
population of 50,000. Within this framework,
Emerson compared the number of existing local
public health workers with what he and the
Committee on Administrative Practice
determined would be necessary to offer the
Basic Six Services nationwide. The benchmarks
derived from this examination readily translate
into public health worker/population ratios. For
example, in 1942 there were 30 LHD workers
(or about 24 FTEs) per 100,000. The Emerson
report determined that 47 workers (or about 42
FTEs) per 100,000 were needed. Notably, public
health nurses comprised almost 50 percent of the
number of full-time LHD staff, whether existing
or recommended, in Emerson’s report.
The Emerson report identified several
occupation-specific benchmarks:
• Public health nurses (1 per 5,000);
• Environmental health workers (1 per
25,000 population);
• Clerical staff (1 per 15,000); and
• Part-time clinicians, dentists, dental
hygienists, lab workers, health
educators, and others “required by local
conditions.”

Local Public Health Department Workforce � 5
Despite this early attempt at LHD staffing
benchmarks, the spotlight on local public health
practice dimmed after APHA began to focus on
broader public health issues beginning in the
1950s and 1960s and the activities of CAP came
to an end. In subsequent decades, the scope of
local public health practice expanded to include
the following:
• Analysis and recording of health data;
• Health education and information;
• Supervision and regulation of various
activities;
• Provision of direct environmental health
services;
• Administration of personal health
services, including comprehensive
primary care;
• Operation of health facilities;
• Area-wide planning and coordination,
including assessing the adequacy of
health services;
• Behavioral health, substance abuse, and
mental health services;
• Injury and violence prevention; and
• Emergency preparedness and response.
Only since the 1988 IOM Report on the Future
of Public Health has attention on the
governmental public health practice at the local
level resurfaced, and only in the past few years
has this reemergence included LHD staffing
benchmarks. Current standards of local public
health practice reflect the IOM report’s
formulation of three core functions—
assessment, policy development, and
assurance—as operationalized through the
essential public health services (EPHS)
framework and several panels of practice
performance standards. These include the local
standards component of the National Public
Health Performance Standards initiative,
NACCHO’s standards for the operational
definition of a functional LHD, and the LHD
accreditation standards soon to be finalized by
the Public Health Accreditation Board. Together
these frameworks and standards offer a common
composite job description for LHDs.
Unfortunately this new job description cannot be
translated into units of work that can be assigned
to individual workers such that specific staffing
patterns and benchmarks become true markers
of effective local public health practice.
II. Dimensions of the Local Public
Health Workforce
his section provides background
information on the classification of
occupations within the overall economy,
with a special focus on occupations that
characterize the local public health workforce.
Sources of data on occupations and employment
compiled by government agencies and
professional organizations are identified, to be
examined in subsequent sections as to their
relevance for possible LHD staffing
benchmarking applications.
More than half (57%) of the public health
workers in the United States are classified as
professionals, similar to the proportion of
professionals among all 15 million health
workers in the United States today. Workers in
technical occupations (19%), administrators
(5%), and administrative support staff (19%)
comprise the remaining 43 percent of public
health workers.2 Registered nurses (RNs)
continue to be the largest single professional
category within the public health workforce.
Environmental health workers in both
professional and technical categories constitute
another large subset of the public health
workforce.
The Department of Labor compiles information
on occupations throughout the economy,
including the public sector. An official
taxonomy for occupations allows the
Department of Labor’s Bureau of Labor
Statistics (BLS) to track information on more
than 800 standard occupational categories
(SOCs) in over 1,000 industrial categories. BLS
also develops projections for the number of
future positions for these occupational categories
based on economic and employment trends.
Most SOCs are not specific to any single
industry, making it difficult to pinpoint trends
and needs specific to the public sector or
governmental public health system. For
2 Gebbie, K., Merrill, J., B’toush, R., Cortazal, M. et al.
(2000). The Public Health Workforce Enumeration 2000.
Washington, DC; Health Resources and Services
Administration (HRSA), Bureau of Health Professions,
National Center for Health Workforce Information and
Analysis and Center for Health Policy.
T

Local Public Health Department Workforce � 6
example, registered nurses are the largest health-
related occupational category employed in the
overall economy (2.6 million workers), with
most registered nurses working in the healthcare
industry. Relatively few registered nurses work
for government (considered a separate industry)
and only a tiny percentage of all registered
nurses (fewer than 50,000) work in
governmental public health agencies at the local
level. Physicians, health services administrators,
health educators, nutritionists, and many other
occupations demonstrate similar employment
profiles. Government and its governmental
public health agencies, however, are the largest
employers of several public health-related
SOCs, such as environmental health specialists
and epidemiologists.
The North American Industry Classification
System (NAICS) is the standard used by federal
agencies in classifying business establishments
for the purpose of collecting, analyzing, and
publishing statistical data related to the national
business economy. Section 92 of NAICS covers
Public Administration and within Section 92,
subsection 92312 covers public health programs.
NAICS category 923120 (Administration of
Public Health Programs) is the industry
classification that comprises government
establishments primarily engaged in the
planning, administration, and coordination of
public health programs and services, including
environmental health activities, mental health,
categorical health programs, health statistics,
and immunization services. Government
establishments primarily engaged in conducting
public health-related inspections are also
included in this category. Notably, this category
does not include government or military
hospitals, ambulatory healthcare services, or the
inspection of food, plants, animals, and other
agriculture products.
In addition, the BLS Occupational Employment
Statistics (OES) system has developed an
industry sector (Sector 99) specifically for
federal, state, and local government with eight
subcategories (see Table 2). OES data tracks the
number of workers in each SOC for each of
these industry subcategories.
Table 2. Governmental Industry Categories for which SOC Data are Available
Code Level of Government
99000 Federal, State, and Local Government
99001 Public Sector (Federal, State, and Local Government, including
schools and hospitals)
99100 Federal Government
99101 Federal Government, including U.S. Postal Service
99200 State Government
99201 State Government, including schools and hospitals
99300 Local Government
99301 Local Government, including schools and hospitals

Local Public Health Department Workforce � 7
Selected SOCs relevant for public health are
identified in the first column of Table 3. These
occupational categories do not encompass all
positions found in public health organizations;
nor do they capture the entire scope of work
undertaken by public health workers. BLS OES
surveys conducted annually provide estimates of
the total number of employed workers in each
SOC (column 2) and the number employed in
each industry, including the various levels of
government. Column 3 provides the number
employed by federal, state, and local
government (excluding schools and hospitals)
for each of these SOCs, while column 4
indicates the number employed only by local
government. For comparison purposes, estimates
derived from NACCHO’s 2008 Profile survey
for the number of FTE workers in selected
occupational categories are provided in
column 5.
The measures included in Table 3 represent
potential benchmarks for various components of
the governmental public health workforce,
including local public health. One such potential
benchmark is the number or ratio of workers in a
particular standard occupational category (such
as RNs, epidemiologists, or health educators)
who work for agencies of local government
(column 4). The form of this benchmark could
compare, for example, the LHD’s ratio of
epidemiologists (or any of the other
occupational title) to population to the national
average ratio of epidemiologists employed by
local government to population. One limitation
of such a general benchmark is that some
occupational titles used by LHDs may also be
used by other agencies of local government,
such as mental health, substance abuse,
emergency management, environmental
protection, and emergency medical services
agencies. Registered nurses, social workers,
counselors, and health educators are examples of
occupational titles likely to be used by multiple
local agencies. On the other hand, some
occupational titles, such as epidemiologists,
environmental health specialists, and
nutritionists, may be primarily used by the LHD.
Table 3 offers several findings of note that
afford insights as to the possible use of OES data
for LHD staffing benchmarks. These are
apparent in some of the comparisons between
the number of workers in selected SOCs
employed by local government (column 4) and
Profile survey data from 2008 (column 5).
Notably, the estimates for several SOCs are
quite close (<10% difference) for titles
employed by local government that would be
expected to be found mainly in the LHD as
opposed to other agencies of local government.
These estimates suggest that a benchmark
derived from the national average ratio of
workers per population may be feasible for
several of these occupations, especially
epidemiologists, environmental health
specialists, nutritionists, and health
administrators. Adjustments would likely be
necessary for other occupations such as
registered nurses and health educators.

Local Public Health Department Workforce � 8
Table 3. Selected Bureau of Labor Statistics Standard Occupational Categories Relevant for
Local Public Health and NACCHO 2008 Profile Best Estimates for Selected Occupations
Standard Occupational Category Total
Number
of
Workers
Employed
in this
SOC
Number
Employed
by Federal,
State, and
Local
Govern-
ment
(99,000)
Number
Employed
by Local
Govern-
ment
(99,300)
NACCHO
2008 Profile
Best
Estimate for
All LHDs
(FTEs)
Health services managers/administrators 271,710 23,820 9,130 9,500
Emergency management specialists 13,060 8,240 6,870 1,400
Statisticians 21,370 6,240 420 N/A
Environmental engineering technicians 20,630 3,420 2,280 N/A
Environmental engineers 50,610 14,540 4,190 N/A
Occupational health and safety specialists 51,850 19,530 7,060 N/A
Occupational health and safety technicians 10,070 2,700 1,800 N/A
Microbiologists 16,260 4,690 610 N/A
Epidemiologists 4,610 2,750 1,260 1,200
Environmental scientists and specialists, incl. health 83,530 37,010 11,200 12,000
Environmental science and protection technicians 30,870 11,570 6,800 N/A
Substance abuse and behavioral disorder counselors 78,470 10,100 6,360 N/A
Mental health counselors 106,920 12,940 9,360 N/A
Medical and public health social workers 133,510 16,570 9,660 N/A
Mental health and substance abuse social workers 127,140 17,310 12,860 N/A
Health educators 63,320 13,550 7,030 4,400
Public relations specialists 242,670 20,780 10,270 430
Dentists, general 86,270 1,980 620 N/A
Dieticians and nutritionists 53,220 8,630 4,050 4,300
Pharmacists 267,860 8,900 940 N/A
Physicians and surgeons 575,490 37,290 5,810 2,000
Registered nurses 2,583,770 149,610 45,940 33,000
Veterinarians 54,130 2,000 220 N/A
Medical and clinical laboratory technologists 166,860 7,350 890 N/A
Medical and clinical laboratory technicians 152,420 5,210 870 N/A
Licensed practical and vocational nurses 728,670 47,940 17,990 N/A
Note: NACCHO’s 2008 Profile also provided FTE “best estimates” for other environmental health scientists (3,200) that may include the
following: SOCs such as environmental engineers and occupational health and safety specialists; behavioral health professionals (7,100) that may
include SOCs such as substance abuse and behavioral disorder counselors, mental health counselor, medical and public health social workers, and
mental health and substance abuse social workers; information system specialists (430), and clerical staff (36,000).

Local Public Health Department Workforce � 9
An especially important resource for
understanding key dimensions of the public
health workforce is The Public Health
Workforce: Enumeration 20003 commissioned
by the Health Resources and Services
Administration (HRSA). This enumeration
collected information on workers of federal,
state, and local public health agencies in the year
2000 based on existing data, reports, and
surveys. This enumeration study focused on
occupational titles commonly used by
governmental public health agencies, many of
which were not consistent with the BLS SOCs.
As such, it is as much a qualitative and
descriptive enumeration as a quantitative one.
The year 2000 public health workforce
enumeration identified a total of 448,000 public
health workers. Occupational categories could
not be established for 112,000 public health
workers, making it difficult to determine with
any precision the actual number of workers in
specific categories, such as public health nurses
or epidemiologists. This study identified
152,500 local public health workers, but a
disproportionate number of local public health
workers lacked occupational information
because many states were unable to report this
information. This enumeration did not attempt to
estimate state employees working in local health
units of the state health agency, a number that
could be in the 25,000–50,000 range.
The inattention paid to the public health
workforce throughout the fourth quarter of the
20th century partly explains the dearth of
information on the public health workforce prior
to the 2000 enumeration report. One often cited
reference placed the total number of public
health workers in the United States at 500,000 in
1980. When compared with the 448,000 figure
reported by the 2000 public health workforce
enumeration study, it appears that the public
health workforce shrank during the final two
decades of the 20th century. Substantial
differences in assumptions and methodologies
between the 1980 and 2000 studies limit
3 Gebbie, K., Merrill, J., B’toush, R., Cortazal, M. et al.
(2000). The Public Health Workforce Enumeration 2000.
Washington, DC; Health Resources and Services
Administration (HRSA), Bureau of Health Professions,
National Center for Health Workforce Information and
Analysis and Center for Health Policy.
comparisons and provide little insight into actual
public health workforce trends over these two
decades. For example, the 1980 study provides
absolutely no information on the number of
public health workers at the local level. National
public health organizations, however, continue
to cite the 1980 study as evidence of a shrinking
workforce and an impetus for renewed interest
and increased resources for public health
workforce development initiatives. Other
sources argue that no such decline occurred and
that the state and local public health workforce
has actually grown faster than the overall
population between 1980 and 2008, as illustrated
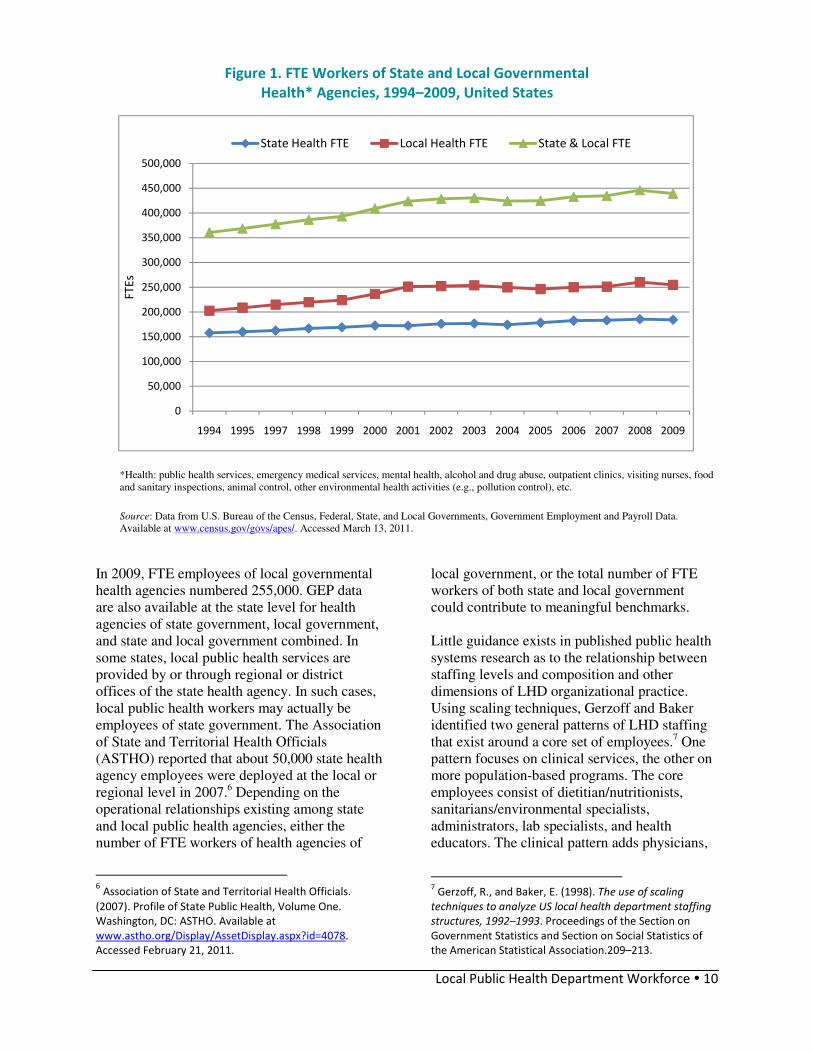
in Figure 1. A longitudinal study of LHDs
responding to both the 2005 and 2008 Profile
surveys documented a 4.5 percent increase in
FTE workers during this three-year period.4
Notably, this trend reversed beginning in 2009
(see Figure 1).
The source of the data in Figure 1 is the U.S.
Census Bureau, which conducts government
employment and payroll (GEP) surveys of
federal, state, and local governmental agencies.
Estimates of the number of FTE workers of
health agencies of local government (Table 3,
column 4) are derived from GEP data.5 This
category (health agencies of local government)
includes LHDs captured in the Profile studies
and other local governmental agencies providing
emergency medical services, mental health,
alcohol and drug abuse, outpatient clinics,
visiting nurses, food and sanitary inspections,
animal control and pollution control, and other
environmental health activities.
4 National Association of County and City Health Officials.
(2010). The Local Health Department Workforce: Findings
from the 2008 National Profile of Local Health
Departments. Washington, DC: NACCHO. 5 U.S. Bureau of the Census, Federal, State, and Local
Governments, Public Employment and Payroll Data.
Available at www.census.gov/govs/apes/. Accessed
February 8, 2011.
Local Public Health Department Workforce � 10
Figure 1. FTE Workers of State and Local Governmental
Health* Agencies, 1994–2009, United States
*Health: public health services, emergency medical services, mental health, alcohol and drug abuse, outpatient clinics, visiting nurses, food
and sanitary inspections, animal control, other environmental health activities (e.g., pollution control), etc. Source: Data from U.S. Bureau of the Census, Federal, State, and Local Governments, Government Employment and Payroll Data.
Available at www.census.gov/govs/apes/. Accessed March 13, 2011.
In 2009, FTE employees of local governmental
health agencies numbered 255,000. GEP data
are also available at the state level for health
agencies of state government, local government,
and state and local government combined. In
some states, local public health services are
provided by or through regional or district
offices of the state health agency. In such cases,
local public health workers may actually be
employees of state government. The Association
of State and Territorial Health Officials
(ASTHO) reported that about 50,000 state health
agency employees were deployed at the local or
regional level in 2007.6 Depending on the
operational relationships existing among state
and local public health agencies, either the
number of FTE workers of health agencies of
6 Association of State and Territorial Health Officials.
(2007). Profile of State Public Health, Volume One.
Washington, DC: ASTHO. Available at
www.astho.org/Display/AssetDisplay.aspx?id=4078.
Accessed February 21, 2011.
local government, or the total number of FTE
workers of both state and local government
could contribute to meaningful benchmarks.
Little guidance exists in published public health
systems research as to the relationship between
staffing levels and composition and other
dimensions of LHD organizational practice.
Using scaling techniques, Gerzoff and Baker
identified two general patterns of LHD staffing
that exist around a core set of employees.7 One
pattern focuses on clinical services, the other on
more population-based programs. The core
employees consist of dietitian/nutritionists,
sanitarians/environmental specialists,
administrators, lab specialists, and health
educators. The clinical pattern adds physicians,
7 Gerzoff, R., and Baker, E. (1998). The use of scaling
techniques to analyze US local health department staffing
structures, 1992–1993. Proceedings of the Section on
Government Statistics and Section on Social Statistics of
the American Statistical Association.209–213.
0
50,000
100,000
150,000
200,000
250,000
300,000
350,000
400,000
450,000
500,000
1994 1995 1997 1998 1999 2000 2001 2002 2003 2004 2005 2006 2007 2008 2009
FT
Es
State Health FTE Local Health FTE State & Local FTE

Local Public Health Department Workforce � 11
nurses, and dental health workers. The
population-based pattern includes
epidemiologists, public health nurses, social
workers, and program specialists. Associations
between staffing and core function-related
performance have not been identified. Logic
suggests that staffing patterns will differ among
similar sized LHDs that offer personnel-
intensive services such as primary care and
behavioral health services and those that do not.
The lack of available evidence from public
health systems research underscores the need to
advance a research agenda that would inform
efforts to develop public health workforce
benchmarks.
III. Benchmarking Opportunities
ata and information available from
federal agencies, especially the
occupational employment statistics
(OES) system from BLS and government
employment census data from the U.S. Census
Bureau, could be used for benchmarking
purposes. For example, national-level data on
the total number of epidemiologists employed
by local government is readily available,
allowing for the calculation of a national average
of epidemiologists per 100,000. A similar
benchmark could be calculated for RNs
employed by local government. Data from the
government employment census allows for the
calculation of the number of FTE workers of
health agencies of local government per
100,000. State-specific data from this same
source would provide a state-specific ratio of
FTE workers of health agencies of local
government per 100,000. Table 4 demonstrates
examples of LHD staffing benchmarks that
could be derived from these sources and from
the landmark reports generated by Emerson in
1945 and HRSA in 2000. Included is a
benchmark advocated by the Association of
State and Territorial Directors of Nursing
(ASTDN) calling for a ratio of one public health
nurse per 5,000,8 virtually the same benchmark
recommended in the Emerson report some 63
years earlier.
8 Association of State and Territorial Directors of Nursing.
(2008). Report on a Public Health Nurse to Population
Ratio. Washington, DC: ASTDN.
A significant limitation of the potential
benchmarks identified in Table 4 is their
congruence with and applicability for local
public health practice. National or state averages
may not be relevant to many LHDs due to the
wide variation in size and structure apparent
among LHDs in the United States. For example,
consider the differences demonstrated among
states in the ratio of FTE workers of health
agencies of local government to population.
Table 4 demonstrates an almost five-fold
difference between Florida (37.86 per 100,000)
and North Carolina (171.81 per 100,000).
Florida’s public health system differs from that
of North Carolina in that many local health
departments are units of the state health agency
and these LHD employees are actually
employed by state government. Considering
FTE workers of health agencies of both state and
local government together provides a somewhat
different picture (Florida: 150.61 per 100,000;
North Carolina: 226.92 per 100,000), narrowing
the differential from 500 percent to about 50
percent. This smaller differential may be
explained, in part, to different duties and
services offered through state and local health
departments in these two states. Differences in
these states in the proportion of the population in
urban versus rural settings, and the number and
size of LHDs serving these populations may also
influence these comparisons. The obvious
implication is that some refinement and tailoring
of the government employment census
information will be needed for this source to be
used for benchmarking applications that specify
staffing levels for different types of LHDs.
NACCHO’s series of surveys profiling LHD
structure and activities over the past 20 years
represents a unique source of information that
facilitates an understanding of the various
influences on LHD staffing patterns and
generate meaningful benchmarks.
Estimates derived from both NACCHO’s 2005
and 2008 Profiles9 pegged the number of LHD
workers at about 155,000 FTEs. Both surveys
also provided information on FTEs for a dozen
or more common public health occupational
9 National Association of County and City Health Officials.
(2006). 2005 National Profile of Local Health Departments.
Washington, DC: NACCHO. National Association of County
and City Health Officials. (2009). 2008 National Profile of
Local Health Departments. Washington, DC: NACCHO.
D

Local Public Health Department Workforce � 12
titles in LHDs serving different population sizes.
Tables 5 through 7 from the 2008 Profile study
demonstrate the importance of jurisdiction size,
documenting an increase in the number of staff
and occupational titles employed as the size of
the population served by the LHD increases. The
variability within population size categories in
Table 7 is noteworthy, however, with a three- to
four-fold difference in the interquartile range
(25th–75th percentiles) for virtually all
population categories.
Table 4. Potential Local Public Health Workforce Benchmarks
Potential Benchmarks Workers per
100,000
population
Population per
Worker
Public Health Nurses
LHD public health nurses—actual (Emerson 1942)
LHD public health nurses—needed (Emerson 1945)
Public health nurses—needed (ASTDN 2008)
LHD FTE registered nurses (NACCHO Profile Best Estimate 2008)
Registered nurses employed by local government (OES 2009)
10.59
19.58
20.00
10.75
14.97
9,443
5,107
5,000
9,302
6,680
Public Health Administrators
LHD managers—actual (Emerson 1942)
LHD managers—needed (Emerson 1945)
LHD FTE managers (NACCHO Profile Best Estimate 2008)
Health services managers employed by local government (OES 2009)
4.88
1.53
3.09
2.97
20,492
65,359
32,362
33,670
Epidemiologists
LHD FTE epidemiologists (NACCHO Profile Best Estimate 2008)
Epidemiologists employed by local government (OES 2009)
0.39
0.41
256,410
243,902
Environmental Health Workers
LHD environmental health workers—actual (Emerson 1942)
LHD environmental health workers—needed (Emerson 1945)
LHD environmental health professionals—actual (Emerson 1942)
LHD environmental health professionals—needed (Emerson 1945)
LHD FTE environmental specialists (NACCHO Profile Best Estimate 2008)
Environmental specialists employed by local government (OES 2009)
4.08
4.31
0.43
1.41
3.91
3.65
24,510
23,202
232,558
70,921
25,575
27,397
Total Local Public Health Workers
Local health department workforce—actual (Emerson 1942)
Local health department workforce—needed (Emerson 1945)
Local public health workforce (PH Enumeration 2000)
LHD FTE workers (NACCHO Profile Best Estimate 2008)
FTE workers of local government health agencies (GEP 2009)
30.25
47.20
54.16
50.49
82.73
3,306
2,119
1,846
1,980
1,209
Total State Public Health Workers (selected states)
FTE workers of AL local government health agencies (GEP 2009)
FTE workers of FL local government health agencies (GEP 2009)
FTE workers of IL local government health agencies (GEP 2009)
FTE workers of MA local government health agencies (GEP 2009)
FTE workers of MD local government health agencies (GEP 2009)
FTE workers of MO local government health agencies (GEP 2009)
FTE workers of NC local government health agencies (GEP 2009)
FTE workers of OH local government health agencies (GEP 2009)
FTE workers of VA local government health agencies (GEP 2009)
FTE workers of WA local government health agencies (GEP 2009)
FTE workers of WI local government health agencies (GEP 2009)
115.61
37.86
63.18
48.62
86.19
63.48
171.81
154.50
67.13
61.02
112.33
865
2,641
1,583
2,057
1,160
1,575
582
647
1,490
1,639
891

Local Public Health Department Workforce � 13
Table 5. Percentage of LHDs with Employees in Selected Occupational Categories
by Size of Population Served (Source: 2008 NACCHO Profile of LHDs)
Population Served
All
LHDs
<10,000 10,000–
24,999
25,000–
49,999
50,000–
99,999
100,000–
249,999
250,000–
499,999
500,000–
999,999 >999,999
Health Service
Manager/Director
91% 79% 89% 94% 96% 97% 100% 97% 100%
Registered Nurse 94% 82% 94% 96% 97% 98% 100% 97% 100%
Physician 42% 15% 24% 41% 52% 69% 79% 85% 94%
Environmental Health (EH)
Specialist
80% 54% 78% 86% 90% 92% 93% 88% 88%
Other EH
Scientist/Technician
27% 7% 17% 24% 32% 41% 6% 69% 70%
Epidemiologist 23% 4% 7% 11% 19% 50% 78% 91% 100%
Health Educator 56% 25% 40% 57% 70% 78% 87% 96% 97%
Nutritionist 51% 15% 24% 41% 52% 69% 79% 85% 94%
Information Systems
Specialist
24% 4% 9% 16% 24% 49% 69% 86% 88%
Public Information
Specialist
19% 6% 7% 12% 20% 30% 50% 80% 88%
Emergency Preparedness
Coordinator
57% 38% 43% 52% 66% 77% 94% 96% 100%
Behavioral Health
Professional
33% 6% 22% 26% 47% 49% 68% 80% 71%
Administrative/Clerical 95% 85% 95% 97% 97% 100% 100% 100% 100%
Table 6. Median FTEs in Selected Occupational Categories Employed by LHDs
by Size of Population Served (Source: 2008 NACCHO Profile of LHDs)
Population Served
<10,000 10,000–
24,999
25,000–
49,999
50,000–
99,999
100,000–
249,999
250,000–
499,999
500,000–
999,999
>999,999
All LHD Staff 3 8 15 31 66 147 305 585
Health Service Manager/Director 1 1 1 1 4 7 12 18
Registered Nurse 1 3 5 8 14 25 52 86
Physician 0 0 0 0 1 1 1 7
Environmental Health (EH)
Specialist
0 1 2 3 8 16 20 31
Other EH Scientist/Technician 0 0 0 0 0 1 3 6
Epidemiologist 0 0 0 0 0 1 2 5
Health Educator 0 0 1 1 1 4 5 9
Nutritionist 0 0 0 1 2 4 8 19
Information Systems Specialist 0 0 0 0 0 1 3 5
Public Information Specialist 0 0 0 0 0 0 1 1
Emergency Preparedness
Coordinator
0 0 0 1 1 1 1 1
Behavioral Health Professional 0 0 0 0 0 3 8 11
Administrative/Clerical 1 2 4 7 16 31 67 136

Local Public Health Department Workforce � 14
Table 7. Percentiles for Number of Workers (FTEs) by Size of Population Served
(Source: 2008 NACCHO Profile of LHDs)
Population Served
Percentile All
LHDs
<25,000 25,000–
49,999
50,000–
99,999
100,000–
249,999
250,000–
499,999
500,000–
999,999
>999,999
90th 111 22 45 85 160 314 705 2,634
75th 43 12 27 55 108 200 500 1,221
50th (median) 15 6 15 32 66 147 305 584
25th 6 3 9 18 37 88 149 377
10th 2 1 6 10 19 45 58 224
The influence of population size is also apparent
in Table 8 and Figure 2, which track the median
FTE worker/population ratio rather than the
number of FTEs. Table 8 suggests that the ratio
of total workers to population is fairly consistent
(within 10%) for LHDs serving populations of
between 25,000 and 1 million. LHDs serving
populations under 25,000 have worker to
population ratios about 35 percent greater than
LHDs serving larger populations.
Figure 2 again shows considerable variability
within the interquartile range for LHDs in each
population size category, although the worker to
population ratios for the 10th, 25th, 75th, and
90th percentiles are consistent across all
population size categories. Despite this
consistent pattern (except for LHDs serving
populations under 25,000), the mix of
occupational titles differs for LHDs serving
different size populations. For example, the ratio
of nurses, environmental health specialists, and
emergency preparedness coordinators decreases
with increasing population size. Some
occupational titles, such as epidemiologists,
information system specialists, public
information officers, and behavioral health
professionals, are found only in the largest
LHDs. Larger LHDs appear to use a greater
number of occupational titles, perhaps reducing
the need to rely on professional occupations
such as nurses and sanitarians. For LHDs
serving smaller jurisdictions, available personnel
are likely called upon for professional expertise
in areas outside their occupational specialty. For
example, a portion of a nurse’s time may be
devoted to activities that a health educator or
epidemiologist or nutritionist would perform if
one were employed by that agency. In effect, the
delegation and deployment of work likely differs
in LHDs that have only a few employees.

Local Public Health Department Workforce � 15
Table 8. Median FTE workers per 100,000 in Selected Occupational Categories
Employed by LHDs by Size of Population Served (Source: 2008 NACCHO Profile of LHDs)
Population Served
Occupation <25,000 25,000–
49,999
50,000–
99,999
100,000–
249,999
250,000–
499,999
500,000–
999,999
>999,999
All LHD staff 59.81 43.81 44.54 43.43 43.52 41.49 34.98
Health service
managers/directors
6.37 2.95 1.90 2.67 2.25 1.73 1.07
Registered nurses 19.21 13.26 12.00 9.48 7.78 7.53 5.07
Physicians 0.00 0.00 0.00 0.42 0.28 0.20 0.44
Environmental health
(EH) specialists
4.59 4.50 4.67 4.82 4.39 2.99 2.29
Other EH scientists and
technicians
0.00 0.00 0.00 0.00 0.34 0.38 0.56
Epidemiologists 0.00 0.00 0.00 0.00 0.33 0.25 0.29
Health educators 0.00 1.30 1.34 0.95 1.15 0.80 0.72
Nutritionists 0.00 0.00 1.27 1.50 1.18 1.30 1.15
Information systems
specialists
0.00 0.00 0.00 0.00 0.35 0.51 0.28
Public information
specialist
0.00 0.00 0.00 0.00 0.00 0.15 0.08
Behavioral health
professional
0.00 0.00 0.00 0.00 0.72 1.33 0.75
Emergency preparedness
coordinator
0.00 0.24 0.78 0.56 0.32 0.17 0.08
Clerical staff 16.67 11.42 9.72 10.67 8.61 9.19 8.35
Figure 2. Percentiles for Number of Workers (FTEs) per 100,000 by Size of Population Served
(Source: 2008 NACCHO Profile of LHDs)
0
20
40
60
80
100
120
140
160
180
200
<25,000 25,000-49,999 50,000-99,999 100,000-249,999 250,000-499,999 500,000-999,999 >999,999
FT
Es
pe
r 1
00
,00
0
Population Served by LHD
90th percentile
75th percentile
50th (median)
25th percentile
10th percentile

Local Public Health Department Workforce � 16
As important as population size may be, there
are other LHD characteristics that may influence
the number and types of workers needed. For
example, although there are no standard
performance expectations that are required for
all LHDs, the Centers for Disease Control has
promoted a national Public Health Performance
Standards Program, NACCHO has developed
standards for an Operational Definition of a
Local Health Department, and the Public Health
Accreditation Board is rolling out a national
voluntary accreditation program for LHDs in
late 2011. It is likely that LHDs perform at
various levels relative to these standards and
conceivable that these different performance
profiles influence the number and types of staff
employed. Ideally, LHD staffing benchmarks
should characterize staffing patterns appropriate
to meet current public health performance
standards. This ideal, however, may prove
difficult to achieve at least over the short term.
Figure 3. Median FTEs per 100,000 for LHDs with
Selected Governance and Clinical Service Characteristics
An initial examination of median FTEs per
100,000 for selected LHD characteristics is
provided in Figure 3. Two types of measures
appeared to impact median FTEs per population:
governance type and specific clinical services. In
situations in which the LHD is a unit of the state
health agency, or even when governance is
shared between the state and local authorities,
the LHD may take on expanded duties or roles
that require staffing patterns that differ from
LHDs governed only by local government. A
significant proportion (27%) of LHDs falls into
the state or shared governance category.
Similarly, not all LHDs provide the same
package of services in their jurisdictions. Only
about one in 10 LHDs provides personal health
services such as primary care, behavioral health,
or substance abuse services and one in four
provides home health services. The staffing
pattern for LHDs that offer one or more of these
services will likely differ from those that do not.
Small LHDs are less likely than large LHDs to
provide primary care and behavioral health
services, but small LHDs are more likely to offer
home health services. As a result, small LHDs
would likely employ relatively fewer physicians
and behavioral health professionals than larger
LHDs. On the other hand, small LHDs that
47.4
73.7
37.033.4
43.9
53.6
0
10
20
30
40
50
60
70
80
All LHDs LHDs - Any
Clinical Service
LHDs - No
Clinical Services
LHDs - Local
Gov/No Services
LHDs - State
Gov/No Services
LHDs - Shared
Gov/No Services
FT
Es
pe
r 1
00
,00
0

Local Public Health Department Workforce � 17
provide home health services may well have
higher ratios of total workers and nurses per
100,000 population than similar sized LHDs that
do not provide this service. Table 9 illustrates
considerable variability across population
categories for the mix of characteristics
discussed in this section. This may partly
explain the variability noted within the various
population categories.
Table 9. Percentages of LHDs with Selected Characteristics
by Size of Population Served (Source: 2008 NACCHO Profile of LHDs)
Population Served
LHD Characteristic All
LHDs
<25,000 25,000–
49,999
50,000–
99,999
100,000–
499,999
>499,999
Local Governance 73% 75% 73% 74% 69% 73%
Completed CHA in past three years 63% 53% 66% 67% 73% 80%
Completed CHIP in past three years 49% 43% 51% 53% 53% 60%
Provide Home Health Services 25% 28% 25% 26% 18% 11%
Provide Primary Care Services 11% 7% 9% 16% 16% 25%
Provide Mental/Behavioral Health Services 9% 5% 9% 12% 13% 27%
Provide Substance Abuse Services 7% 4% 7% 8% 9% 24%
Provide Laboratory Services 25% 16% 21% 24% 42% 64%
In addition to governance, services, and overall
performance, extrinsic factors may impact LHD
staffing patterns. As previously noted, FTE
worker to population ratios are highest for the
smallest LHDs and there is especially great
variability within this group. This variability
may in part be related to population density
differences. An LHD serving a rural or frontier
population of 5000 in a large geographic area
with a low population density may well have
different staffing needs than an LHD serving
5000 residents in small town or township
setting. Yet another consideration may be
population risk status. For LHDs serving similar
sized populations, the staffing needs for an inner
city LHD may differ from that of LHD serving
an affluent suburban community. Little formal
research has elucidated these relationships,
although merging Profile data with other data
sets may offer some initial insights.
Table 10 tracks median FTE workers per
100,000 for several of these potential influences
based on 2008 Profile data.10
This composite
10
The use of the median (50th percentile) in Table 10 is
arbitrary and is intended to demonstrate the possible use
of some agreed upon level in a benchmarking application.
This benchmarking application could conceivably use a
different level, such as the 60th or 75th percentile, that
table demonstrates a consistent median worker
to population ratio for LHDs in all size
categories except the smallest (<25,000) and the
largest (one million and over). It is possible that
these extreme size categories are affected by
somewhat different influences than the other
categories. With 43 percent of LHDs serving
populations under 25,000 (18% percent serve
populations under 10,000), but only a few
percent serving populations of one million or
more, a better understanding of the influences on
the smallest LHDs will be especially important
for the development of staffing benchmark
applications. Table 10 offers additional insights
as to how LHD characteristics relate to LHD
staffing for total workers as well as for specific
occupations.
All LHD Staff
Both governance and clinical services emerge
from the data in the All LHD Staff section of
Table 12 as characteristics that likely influence
the total FTEs employed by LHDs. The median
total FTE worker to population ratios are higher
for LHDs in the state and shared governance
categories than for those in the local governance
category. For each of the three governance
may be determined to be more appropriate for the
objectives of the benchmarking application.

Local Public Health Department Workforce � 18
categories, LHDs that provide clinical services
have higher FTE worker to population ratios
than those that do not offer these services.
Comparisons of LHDs providing a single
clinical service (whether primary care, home
health, or behavioral health) with all other LHDs
also indicates that these services increase the
median FTE to population ratios. Provision of
either primary care or home health has a
substantial impact on staffing for LHDs serving
populations under 500,000. These findings
suggest that governance and service profiles
strongly influence LHD staffing and should be
considered in benchmarking models.
On the other hand, controlling for services
delivered and using completion of community
health assessments (CHAs) and community
health improvement plans (CHIPs) within the
past three years as a proxy definition of high
performing LHDs does not uncover differences
in median FTE to population ratios, except for
LHDs serving populations under 25,000. The
comparison of non-clinical service providing
LHDs that have completed community health
assessments and community health highlights
with those that have not also demonstrates lower
median FTE worker to population ratios than for
all LHDs. Additional influences, such as the
degree of population density or population risk
characteristics merit further investigation. A
series of further analyses and research questions
are identified in the recommendations section of
this report.
Table 10. Median FTE Workers per 100,000 in Selected Occupations Employed by LHDs
with Selected Service and Governance Characteristics by Size of Population Served
(Source: 2008 NACCHO Profile of LHDs Dataset)
Population Served
Occupation <25,000 25,000–
49,999
50,000–
99,999
100,000–
249,999
250,000–
499,999
500,000–
999,999
>999,999
All LHD staff
All LHDs (n=2205)
Local governance (n=1619)
State governance (n=374)
Shared governance (n=212)
No clinical services (n=1276)
CHA/CHIP completed (n=497)
CHS/CHIP not completed (n=719)
Local governance (n=1020)
State governance (n=139)
Shared governance (n=117)
Any clinical service (n=883)
Primary care only service – yes (n=145)
Primary care only service – no (n=2060)
Home health only service – yes (n=407)
Home health only service – no (n=1798)
MH &/or SA only service – yes (n=157)
MH &/or SA only service – no (n=2048)
59.81
49.65
66.41
72.96
43.97
58.15
39.57
36.91
60.53
62.68
97.53
71.81
58.15
96.77
51.21
90.71
59.26
43.81
38.74
55.51
99.16
35.67
39.26
32.18
31.13
40.07
52.43
67.82
69.55
41.90
66.76
41.32
51.22
42.74
44.54
42.43
53.02
65.24
32.32
26.69
36.85
29.98
37.94
40.38
73.04
67.91
42.46
82.06
40.69
49.10
44.53
43.43
42.72
39.84
78.51
35.90
36.46
35.73
35.29
39.74
34.93
65.91
61.62
42.21
61.55
41.63
54.41
42.21
43.52
35.61
43.33
59.64
32.24
32.77
32.57
27.99
40.36
51.53
60.97
71.42
39.97
60.97
39.92
39.97
43.60
41.49
38.62
30.61
59.75
24.18
22.79
28.65
28.09
21.16
29.68
56.55
42.56
39.90
53.61
41.40
55.17
37.29
34.98
42.97
4.51
37.92
25.57
24.53
31.20
26.91
4.46
34.68
58.02
54.38
34.68
*
34.98
35.26
34.98
Health service managers/directors
All LHDs
No clinical services
CHA/CHIP completed
CHS/CHIP not completed
Local governance
State governance
Shared governance
Primary care only service
Home health only service
MH and/or SA only service
6.37
5.89
6.30
5.51
6.11
3.87
5.32
5.03
9.37
7.01
2.95
2.91
2.84
3.05
2.90
2.81
3.23
2.88
3.54
2.72
1.90
1.83
1.90
1.81
1.88
1.73
1.07
1.76
1.89
2.71
2.67
2.47
2.61
2.48
2.67
1.65
1.87
2.66
4.84
1.86
2.25
1.69
2.28
1.11
1.36
1.69
2.98
3.32
2.32
2.71
1.73
1.26
1.13
1.29
1.34
0.58
1.20
1.79
1.59
3.23
1.07
0.65
0.64
0.65
0.71
0.13
0.81
1.29
*
1.13

Local Public Health Department Workforce � 19
Population Served
Occupation <25,000 25,000–
49,999
50,000–
99,999
100,000–
249,999
250,000–
499,999
500,000–
999,999
>999,999
Registered nurses
All LHDs
No clinical services
CHA/CHIP completed
CHS/CHIP not completed
Local governance
State governance
Shared governance
Primary care only service
Home health only service
MH and/or SA only service
19.21
14.58
18.08
12.96
11.94
17.87
22.66
22.82
34.84
18.07
13.26
10.03
10.83
8.67
8.75
11.93
17.36
17.97
23.33
16.33
12.00
7.91
8.25
7.76
7.07
9.64
11.60
16.92
20.67
10.81
9.48
7.13
8.08
6.39
6.71
9.64
7.01
12.01
16.31
9.53
7.78
5.37
5.24
5.51
4.05
10.02
9.19
14.16
9.63
8.47
7.53
4.67
4.62
5.24
3.56
6.53
6.99
8.28
12.51
9.96
5.07
3.03
3.18
2.54
3.03
2.61
4.30
7.33
*
8.46
Physicians
All LHDs
No clinical services
CHA/CHIP completed
CHS/CHIP not completed
Local governance
State governance
Shared governance
Primary care only service
Home health only service
MH and/or SA only service
0.00
0.00
0.00
0.00
0.00
0.00
0.00
2.76
0.00
0.00
0.00
0.00
0.00
0.00
0.00
0.00
0.09
2.07
0.00
0.00
0.00
0.00
0.00
0.00
0.00
0.00
0.00
1.48
0.00
0.18
0.42
0.24
0.05
0.29
0.26
0.45
0.00
1.31
0.00
0.55
0.28
0.22
0.22
0.21
0.18
0.33
0.74
1.01
0.17
0.28
0.20
0.15
0.10
0.19
0.16
0.12
0.11
0.73
0.25
0.26
0.44
0.24
0.25
0.24
0.26
0.02
0.37
1.19
*
0.67
EH specialists
All LHDs
No clinical services
CHA/CHIP completed
CHS/CHIP not completed
Local governance
State governance
Shared governance
Primary care only service
Home health only service
MH and/or SA only service
4.59
4.57
5.08
4.24
4.29
1.78
6.20
4.95
4.44
4.73
4.50
4.18
4.00
4.05
4.35
2.25
6.10
4.48
4.55
3.15
4.67
4.62
4.07
4.68
4.83
1.89
4.89
4.87
4.52
5.24
4.82
4.80
4.74
5.04
4.81
4.48
4.82
3.50
5.96
5.68
4.39
3.46
3.19
3.91
2.94
4.87
2.60
5.86
6.33
5.76
2.99
1.87
1.54
1.87
1.74
2.34
3.78
3.94
4.39
3.75
2.29
0.87
0.56
2.81
2.47
0.12
0.39
^
*
2.92
Other EH scientists/technicians
All LHDs
No clinical services
CHA/CHIP completed
CHS/CHIP not completed
Local governance
State governance
Shared governance
Primary care only service
Home health only service
MH and/or SA only service
0.00
0.00
0.00
0.00
0.00
0.00
0.00
0.00
0.00
0.00
0.00
0.00
0.00
0.00
0.00
0.00
0.00
0.00
0.00
0.00
0.00
0.00
0.00
0.00
0.00
0.00
0.00
0.00
0.00
0.00
0.00
0.00
0.00
0.00
0.00
0.00
0.00
0.44
0.00
0.00
0.34
0.34
0.54
0.09
0.35
0.28
0.37
0.62
0.00
0.27
0.38
0.32
0.48
0.00
0.34
0.00
1.58
0.29
1.55
0.76
0.56
0.18
0.06
0.56
0.56
0.00
3.41
0.19
*
0.49
Epidemiologists
All LHDs
No clinical services
CHA/CHIP completed
CHS/CHIP not completed
Local governance
State governance
Shared governance
Primary care only service
Home health only service
MH and/or SA only service
0.00
0.00
0.00
0.00
0.00
0.00
0.00
0.00
0.00
0.00
0.00
0.00
0.00
0.00
0.00
0.00
0.00
0.00
0.00
0.00
0.00
0.00
0.00
0.00
0.00
0.00
0.00
0.00
0.00
0.00
0.00
0.24
0.40
0.00
0.00
0.54
0.00
0.00
0.00
0.29
0.33
0.34
0.36
0.29
0.35
0.29
0.35
0.30
0.21
0.55
0.25
0.21
0.20
0.21
0.23
0.15
0.52
0.29
0.28
0.50
0.29
0.29
0.28
0.30
0.31
0.06
1.91
0.14
*
0.19

Local Public Health Department Workforce � 20
Health educators
All LHDs
No clinical services
CHA/CHIP completed
CHS/CHIP not completed
Local governance
State governance
Shared governance
Primary care only service
Home health only service
MH and/or SA only service
0.00
0.00
0.00
0.00
0.00
1.72
0.00
3.72
0.00
2.19
1.30
0.73
1.99
0.00
0.36
1.85
0.00
2.75
0.00
2.00
1.34
1.09
1.50
0.85
1.20
0.00
0.00
2.02
1.22
1.41
0.95
0.94
1.04
0.63
1.04
0.58
0.00
1.11
0.96
0.84
1.15
1.03
1.14
0.62
1.06
0.29
1.22
2.18
2.10
1.18
0.80
0.58
0.47
0.79
0.79
0.26
0.69
0.50
0.75
1.32
0.72
0.43
0.33
0.47
0.52
0.06
0.66
1.90
*
0.88
Nutritionists
All LHDs
No clinical services
CHA/CHIP completed
CHS/CHIP not completed
Local governance
State governance
Shared governance
Primary care only service
Home health only service
MH and/or SA only service
0.00
0.00
000
0.00
0.00
0.82
0.00
0.00
0.00
1.18
0.00
0.00
0.68
0.00
0.00
2.79
0.00
2.89
0.00
1.03
1.27
0.42
1.04
0.00
0.00
1.67
2.45
1.79
1.78
0.50
1.50
1.41
1.15
1.51
1.03
1.76
1.65
1.61
1.90
0.94
1.18
1.14
1.16
1.26
0.41
1.14
2.79
1.54
1.96
0.95
1.30
0.73
0.52
1.36
0.55
0.89
2.20
2.25
1.35
0.94
1.15
1.09
0.74
1.41
1.41
0.00
1.29
1.86
*
1.11
Information systems specialists
All LHDs
No clinical services
CHA/CHIP completed
CHS/CHIP not completed
Local governance
State governance
Shared governance
Primary care only service
Home health only service
MH and/or SA only service
0.00
0.00
0.00
0.00
0.00
0.00
0.00
0.00
0.00
0.00
0.00
0.00
0.00
0.00
0.00
0.00
0.00
0.00
0.00
0.00
0.00
0.00
0.00
0.00
0.00
0.00
0.00
0.00
0.00
0.00
0.00
0.00
0.00
0.00
0.00
0.00
0.76
0.66
0.00
0.00
0.35
0.26
0.36
0.24
0.10
0.24
1.04
0.61
0.84
0.36
0.51
0.25
0.35
0.19
0.31
0.17
0.79
1.01
0.64
0.67
0.28
0.12
0.09
0.16
0.16
0.06
0.66
^
*
0.72
Public information specialists
All LHDs
No clinical services
CHA/CHIP completed
CHS/CHIP not completed
Local governance
State governance
Shared governance
Primary care only service
Home health only service
MH and/or SA only service
0.00
0.00
0.00
0.00
0.00
0.00
0.00
0.00
0.00
0.00
0.00
0.00
0.00
0.00
0.00
0.00
0.00
0.00
0.00
0.00
0.00
0.00
0.00
0.00
0.00
0.00
0.00
0.00
0.00
0.00
0.00
0.00
0.00
0.00
0.00
0.00
0.00
0.00
0.00
0.00
0.00
0.00
0.03
0.00
0.03
0.00
0.30
0.24
0.00
0.21
0.15
0.13
0.15
0.13
0.16
0.00
0.16
0.14
0.16
0.17
0.08
0.07
0.05
0.09
0.08
0.00
0.10
0.01
*
0.08
Behavioral health professionals
All LHDs
No clinical services
CHA/CHIP completed
CHS/CHIP not completed
Local governance
State governance
Shared governance
Primary care only service
Home health only service
MH and/or SA only service
0.00
0.00
0.00
0.00
0.00
0.00
0.00
0.00
0.00
3.65
0.00
0.00
0.00
0.00
0.00
0.00
0.00
0.00
0.00
2.50
0.00
0.00
0.00
0.00
0.00
0.00
0.00
2.11
1.37
1.81
0.00
0.00
0.00
0.00
0.00
0.00
0.00
0.74
0.89
1.95
0.72
0.00
0.36
0.00
0.00
0.89
2.08
1.96
1.92
1.50
1.33
0.28
0.29
0.17
0.28
0.17
0.32
0.90
2.42
3.80
0.75
0.11
0.09
0.75
0.32
0.00
3.49
1.29
*
3.97
Emergency preparedness coordinators
All LHDs
No clinical services
CHA/CHIP completed
CHS/CHIP not completed
Local governance
0.00
0.00
0.00
0.00
0.00
0.24
0.00
0.00
0.71
0.61
0.78
0.72
0.81
0.68
0.75
0.56
0.54
0.58
0.52
0.54
0.32
0.33
0.32
0.31
0.35
0.17
0.16
0.16
0.16
0.17
0.08
0.08
0.07
0.09
0.11

Local Public Health Department Workforce � 21
State governance
Shared governance
Primary care only service
Home health only service
MH and/or SA only service
0.00
0.00
0.00
0.00
1.54
0.00
0.37
0.00
0.90
0.00
0.00
0.13
1.03
0.95
0.66
0.57
0.00
0.66
0.58
0.46
0.29
0.35
0.30
0.36
0.34
0.16
0.16
0.19
0.20
0.17
0.06
0.17
0.14
*
0.28
Clerical staff
All LHDs
No clinical services
CHA/CHIP completed
CHS/CHIP not completed
Local governance
State governance
Shared governance
Primary care only service
Home health only service
MH and/or SA only service
16.67
12.41
15.13
10.18
8.94
19.77
22.85
24.22
21.42
21.27
11.42
8.81
9.68
7.99
7.98
11.27
20.45
17.66
15.00
14.23
9.72
6.46
6.70
5.45
5.82
9.08
15.66
17.35
16.72
8.24
10.67
8.54
8.99
8.39
7.30
12.85
13.15
15.38
13.84
13.57
8.61
6.48
6.85
6.32
4.68
9.82
17.51
18.07
13.83
9.62
9.19
5.60
2.44
6.86
5.28
6.27
16.92
17.83
14.90
10.60
8.35
6.98
6.30
7.30
7.30
1.08
12.30
5.28
*
11.71
Notes: * = no LHDs serving populations >999,999 provided home health as only clinical service; ^ data not available
Key Occupations Profile data allow for analysis of 13 occupations
commonly employed by LHDs. Table 10
includes a section for each of these occupations.
Data as to median FTE workers per 100,000
(worker to population ratios) are provided for
each occupation further categorized by size of
population served and LHD governance and
service profiles.
Health service managers/directors: The median
FTE worker to population ratio declines as the
size of the population served increases. This is
consistent with administrative practice in both
the public and private sectors. As the size of an
organization’s workforce increases, the
proportion of administrative staff or overhead
generally declines. The provision of clinical
services appears to have only a modest impact
on the need for additional managers across the
various population categories. LHDs providing
only home health services have a notably higher
manager to population ratio for LHDs in the
under 50,000 population categories. The
manager to population ratio is also somewhat
lower for state governed LHDs. Overall the
factors that influence total LHD staffing appear
to have only a slight influence on managers and
directors.
Registered nurses: As the largest category of
professional staff, influences on nurse to
population ratios are especially important for
local public health practice. The nurse to
population ratio declines substantially and
steadily as the size of the population served
increases. This occurs for LHDs that do not offer
clinical services and those that do. As would be
expected, clinical services have a substantial
impact on nurse to population ratios, more than
doubling the nurse to population ratio in
virtually all population categories. Notably,
among LHDs that do not provide clinical
services, locally governed LHDs employ fewer
nurses than LHDs in the state or shared
governance categories. Overall, the presence or
absence of specific clinical services has a
substantial impact on the size of LHD nursing
staffs, often increasing the nurse to population
ratio by 5–20 per 100,000.
Physicians: In comparison to nurses, few
physicians are employed by LHDs. Physicians
are generally not found in LHDs serving
populations under 100,000 unless primary care
services are provided. LHDs in the state and
shared governance categories employ more
physicians than LHDs that are locally governed.
Physician presence in an LHD appears to be
very much related to primary care. For LHDs
not providing clinical services the physician to
population ratio is steady for LHDs serving
100,000 people or more.
Environmental health specialists (sanitarians)
and other environmental health scientists and
technicians: The environmental health specialist
to population ratio is consistent for small and
medium-sized LHDs serving populations under
500,000. There is little difference in the
environmental health specialist to population
ratio between LHDs providing clinical services
and those that do not. Smaller LHDs in the
shared governance category that do not provide

Local Public Health Department Workforce � 22
clinical services and some LHDs providing
clinical services have higher environmental
health specialist to population ratios for
unknown reasons. On the other hand, state-
governed LHDs appear to have fewer
environmental health specialists. The differences
noted across these categories may require
modest adjustment in a benchmarking process.
The category for other environmental health
scientists and technicians shows no clear pattern
and actually has very few workers, indicating
this category may not require any adjustments in
a benchmarking activity.
Epidemiologists: Although an important public
health professional category, epidemiologists are
scarce in LHDs serving populations under
250,000. There is a consistent ratio of
epidemiologists to population in the larger LHD
categories. LHDs in the shared governance
category have higher ratios while state governed
LHDs have lower ratios.
Health Educators: Except for LHDs serving
populations less than 25,000, health educators
are found in all LHD size categories with a
declining ratio of health educators to population
noted as population size increases. LHDs that
are locally governed have somewhat higher
ratios, although the highest ratios are noted for
LHDs providing primary care and mental
health/substance abuse services. Health educator
to population ratios are low for LHDs in the
state or shared governance categories. The
differences across categories suggest that modest
adjustments may be needed for health educators
in a benchmarking activity.
Nutritionists: A reasonably steady ratio of
nutritionists to population is noted for LHDs in
the 50,000 to one million or more categories,
somewhat higher for LHDs in the state and
shared governance categories, and for larger
LHDs offering primary care. The differences
indicate that some adjustments may be necessary
in a benchmarking activity.
Information System Specialists and Public
Information Specialists: Neither of these
occupations is found in smaller LHDs.
Information system specialists are not found in
LHDs serving populations under 250,000 and
public information specialists are rare in LHDs
serving populations under 500,000. Small
numbers and no apparent relationship to
governance or services suggest these
occupations require little consideration in
adjustments for a benchmarking activity.
Behavioral Health Professionals: An emerging
component of the LHD workforce, behavioral
health professionals are scarce in LHDs serving
populations under 250,000 unless mental
health/substance abuse services are offered. The
behavioral health professional to population
ratio is highly related to the provision of these
services and to the provision of primary care and
home health. The differences across categories
suggest that adjustments for this occupation may
be important in a benchmarking application.
Emergency Preparedness Coordinators: Similar
to the pattern for managers, the ratio of
emergency preparedness coordinators to
population steadily declines for LHD population
categories at the 50,000 level and above. The
highest ratios are noted for LHDs providing
clinical services; the lowest for LHDs in the
shared and state governed categories. Minimal
differences across categories suggest that
adjustments for this occupation may also be
minimal.
Clerical Staff: Along with nurses, the
occupational grouping for clerical staff has the
highest worker to population ratios for LHDs of
all sizes. As with managers and emergency
preparedness coordinators, the clerical worker to
population ratio steadily declines from the
smallest through the largest LHD population
categories. The highest ratios are found where
clinical services, especially primary care
services, are offered. The lowest ratios are noted
for locally governed LHDs that provide no
clinical services. Significant differences suggest
that adjustments for this occupation may be
necessary in a benchmarking model.
These findings suggest that one possible
approach would be to develop LHD staffing
benchmarks based initially on values (median
FTEs/100,000) for LHDs in the appropriate
three governance category (local, state, shared)
that offer no clinical services. These values
(median FTEs/100,000) for all workers and each
occupational category would then be adjusted
based on which clinical services (home health,
primary care, behavioral health) are provided.

Local Public Health Department Workforce � 23
The adjustment for each clinical service is the
difference between the values for LHDs in the
population/governance subcategory that provide
a specific service and LHDs in the same
subcategory not providing any clinical services.
In effect, the values for a reference group are
adjusted based on the additional staffing
necessary to provide specific services such as
home health, primary care, or behavioral health
services. Table 11 illustrates this adjustment
process for a locally governed LHD serving a
population of 38,000 and providing home health
(but not primary care or behavioral health
services). Additional illustrations of this
benchmarking application for small, mid-sized,
and large LHDs using different governance and
service package combinations are provided in
the Appendix.
One potential limitation of this strategy is the
small number of LHDs in the larger population
size categories for LHDs that are either state or
shared governed and provide no clinical
services. For example, for the 250,000–499,999
category, there are only 10 state-governed LHDs
and eight that have shared governance. For the
500,000–999,999 category, only six are state
governed and two have shared governance. For
LHDs serving populations of one million or
more, four are state governed and only one has
shared governance. The usefulness of this
benchmarking strategy may be limited in these
instances. Fortunately, only two percent of all
LHDs serve populations greater than 250,000
and have either state or shared governance.
Table 11. Staffing Benchmark Illustration for Locally Governed LHD “X”
Serving Population of 38,000; Scenario 2: LHD “X” Provides Home Health Services
Occupation Reference
Group*
Median FTEs
per
100,000
Home
Health
Adjustment
(FTEs per
100,000)
Adjusted
FTEs per
100,000
Benchmark
FTEs
Health service managers/directors 2.90 0.63 3.53 1.34
Registered nurses 8.75 13.30 22.05 8.38
Physicians 0.00 0.00 0.00 0.00
Environmental health (EH) specialists 4.35 0.00 4.35 1.65
Other EH scientists/technicians 0.00 0.00 0.00 0.00
Epidemiologists 0.00 0.00 0.00 0.00
Health educators 0.36 0.00 0.36 0.14
Nutritionists 0.00 0.00 0.00 0.00
Information systems specialists 0.00 0.00 0.00 0.00
Public information specialists 0.00 0.00 0.00 0.00
Behavioral health professionals 0.00 0.00 0.00 0.00
Emergency preparedness coordinators 0.61 0.90 1.51 0.57
Clerical staff 7.98 6.19 14.17 5.39
Staff in these 13 occupations 24.94 21.02 45.96 17.47
All LHD staff 31.13 31.09 62.22 23.64 *Reference Group = LHDs with local governance serving populations between 25,000 and 49,999; n=226

Local Public Health Department Workforce � 24
Tables 12, 13, and 14 further demonstrate how
this approach establishes LHD staffing
benchmarks for three hypothetical LHDs with
five different service package scenarios
examined for each: (1) providing no clinical
services; (2) providing only home health
services; (3) providing only primary care
services; (4) providing home health and primary
care services; and (5) providing home health,
primary care, and behavioral health services. A
locally governed small LHD serving a
population of 38,000 is examined in Table 12.
Table 13 provides similar information for a
state-governed mid-size LHD serving a
population of 175,000, and Table 14 examines a
large LHD with shared governance serving a
population of 750,000. Adjustments to the table
for specific occupations are derived from the
difference between the median FTE workers to
population ratio for LHDs providing a specific
service minus the ratio for LHDs not providing
any clinical services. This approach
demonstrates that much of the difference in
staffing size and configuration is due to the
provision of specific services and involves
relatively few occupational categories. All data
used in these scenarios are derived from Table
10. The calculations summarized in Tables 12
through 14 are available in Appendix tables.
Table 12. Staffing Benchmark Illustration for Local Governance LHD “X” Serving Population
of 38,000; Comparison of FTE Workers in Selected Occupations for Five Service Scenarios
Occupation Scenario 1:
No Clinical
Services
Scenario 2:
Home
Health Only
Scenario 3:
Primary
Care Only
Scenario 4:
Home
Health and
Primary
Care
Scenario 5:
Home
Health,
Primary
Care, and
Behavioral
Health
Health service managers/directors 1.10 1.34 1.10 1.34 1.34
Registered nurses 3.32 8.38 6.34 11.40 13.79
Physicians 0.00 0.00 0.79 0.79 0.79
Environmental health (EH) specialists 1.65 1.65 1.65 1.65 1.65
Other EH scientists/technicians 0.00 0.00 0.00 0.00 0.00
Epidemiologists 0.00 0.00 0.00 0.00 0.00
Health educators 0.14 0.14 0.90 0.90 1.39
Nutritionists 0.00 0.00 1.10 1.10 1.49
Information systems specialists 0.00 0.00 0.00 0.00 0.00
Public information specialists 0.00 0.00 0.00 0.00 0.00
Behavioral health professionals 0.00 0.00 0.00 0.95 0.95
Emergency preparedness
coordinators
0.23 0.57 0.23 0.57 0.57
Clerical staff 3.03 5.39 6.40 8.75 10.81
Staff in these 13 occupations 9.48 17.47 18.51 26.50 32.78
All LHD staff 11.83 23.64 24.70 36.52 42.43

Local Public Health Department Workforce � 25
This benchmarking illustration results in
different staffing levels and patterns for these
three hypothetical LHDs across these five
scenarios. For small LHDs (Table 12), registered
nurses and clerical staff are the largest
occupational categories in all five service
scenarios and the categories most affected by
different service package options. Provision of
home health services has an especially large
impact on the number of nursing positions in an
LHD. The number of FTEs employed in the 13
categories doubles if one clinical service is
offered and more than triples when all three
clinical services are provided. The numbers of
health educators, nutritionists, and behavioral
health professionals are only modestly affected.
As would be expected, the need for managers,
environmental health specialists, and emergency
preparedness coordinators is not greatly affected
by the different service scenarios. Behavioral
health professionals are added only when
behavioral services are offered in the LHD’s
jurisdiction. Physicians are hired only when
primary care services are offered. Small LHDs
seldom employ epidemiologists.
Table 13. Staffing Benchmark Illustration for State Governance LHD “X” Serving Population of
175,000; Comparison of FTE Workers in Selected Occupations for 5 Service Scenarios
Occupation Scenario 1:
No Clinical
Services
Scenario 2:
Home Health
Only
Scenario 3:
Primary Care
Only
Scenario 4:
Home Health
and Primary
Care
Scenario 5:
Home
Health,
Primary
Care, and
Behavioral
Health
Health service managers/directors 2.89 7.04 3.22 7.37 7.37
Registered nurses 16.87 32.94 25.41 41.48 45.68
Physicians 0.79 0.79 2.66 2.66 3.22
Environmental health (EH) specialists 7.84 9.87 7.84 9.87 11.41
Other EH scientists/technicians 0.00 0.00 0.77 0.77 0.77
Epidemiologists 0.95 0.95 0.95 0.95 1.03
Health educators 1.02 1.05 1.31 1.35 1.35
Nutritionists 3.08 3.97 3.43 4.32 4.32
Information systems specialists 0.00 0.00 1.16 1.16 1.16
Public information specialists 0.00 0.00 0.00 0.00 0.00
Behavioral health professionals 0.00 1.56 1.30 2.85 6.27
Emergency preparedness coordinators 1.00 1.07 1.21 1.28 1.28
Clerical staff 22.49 31.76 34.46 43.73 52.54
Staff in these 13 occupations 56.91 90.98 83.70 117.78 136.36
All LHD staff 69.55 114.43 114.56 159.44 191.84
A similar pattern is evident for the hypothetical
mid-sized LHD as demonstrated in Table 13.
Registered nurses and clerical staff are the
primary categories that are affected by different
service scenarios. The number of FTE nurses
again doubles if one service is offered and
nearly triples when all three are provided. The
provision of clinical services only slightly
increases the number of nutritionists and health
educators employed by the LHD. The need for
managers increases especially when two or more
services are provided. The various service
scenarios do not affect the number of
epidemiologists, environmental health
specialists, or emergency preparedness
coordinators but do impact the need for
information system specialists and behavioral
health professionals. In terms of all workers in
these 13 occupational categories, offering one
service increases FTE workers by about 50
percent and offering two or three services results
in a doubling of FTEs.

Local Public Health Department Workforce � 26
Table 14. Staffing Benchmark Illustration for Shared Governance LHD “X” Serving Population
of 750,000; Comparison of FTE Workers in Selected Occupations for Five Service Scenarios
Occupation Scenario 1:
No Clinical
Services
Scenario 2:
Home
Health Only
Scenario 3:
Primary
Care Only
Scenario 4:
Home
Health and
Primary
Care
Scenario 5:
Home
Health,
Primary
Care, and
Behavioral
Health
Health service managers/directors 9.00 11.48 12.83 15.30 30.08
Registered nurses 52.43 111.23 79.50 138.30 177.98
Physicians 0.83 1.58 5.18 5.93 6.75
Environmental health (EH) specialists 28.35 47.25 43.88 62.78 76.88
Other EH scientists/technicians 11.85 22.08 11.85 21.08 24.38
Epidemiologists 3.90 4.43 4.50 5.03 7.20
Health educators 5.18 6.45 5.18 6.45 12.75
Nutritionists 16.50 21.15 27.90 32.55 34.13
Information systems specialists 5.93 8.85 11.63 14.55 17.70
Public information specialists 1.20 1.43 1.28 1.50 1,80
Behavioral health professionals 2.40 19.50 4.70 23.25 50.25
Emergency preparedness coordinators 1.20 1.50 1.43 1.73 1.80
Clerical staff 126.90 189.15 218.63 280.88 318.38
Staff in these 13 occupations 265.67 444.00 430.80 609.15 760.05
All LHD staff 222.60 443.33 360.45 561.18 813.60
Many of the trends identified for the
hypothetical mid-sized LHD are even more
pronounced for the hypothetical large LHD
examined in Table 14. The number of clinical
services offered by the LHD results in a
doubling and tripling the FTE workers in the
registered nurse and clerical staff categories.
When clinical services are provided, the number
of FTES for virtually all other categories also
increases. The number of FTEs in these 13
categories for large LHDs offering all three
clinical services is nearly three times the number
needed by LHDs that provide no clinical
services. The discrepancy between the number
of all LHD staff and the staff in the 13
occupations is likely due to the small number of
LHDs (n=2) in this reference group. Notably,
several other reference groups are also subject to
this small number problem. These are the larger
population categories for the state and shared
governance groups.
Figure 4 illustrates the considerable differences
in the size of the reference groups should this
benchmarking application use standard
population categories. Reference groups would
include 10 or fewer LHDs for state governed
and shared governance LHDs serving
populations above 250,000. Only 2.8 percent of
LHDs responding to the 2008 Profile survey had
this combination of population, governance, and
clinical service characteristics. Instead of using
specific population categories (such as the seven
categories used throughout this report), it may
be desirable to use equal intervals, such as
deciles, in developing reference groups for this
benchmarking application.

Local Public Health Department Workforce � 27
Figure 4. Number of LHDs in Benchmarking Application Reference Group
by Size of Population Served (Source: 2008 NACCHO Profile of LHDs)
These examples demonstrate that some of the
variability among LHDs in FTEs per 100,000 is
related to governance type and clinical service
profile. Figure 5 provides information on the
25th and 75th percentiles (components of the
interquartile range ) for FTEs per 100,000 for all
LHDs, LHDs providing any clinical service, and
LHDs that provide not clinical services and are
locally governed. The interquartile range for all
LHDs is 54 per 100,000 but is 72 per 100,000
for LHDs providing any clinical service and
only 37 for locally governed LHDs that provide
no clinical services. Although the precise
contribution of these influences has not been
determined, and the influence of other factors
has not been established, controlling for
governance and services appears to be an
important component of an LHD staffing
benchmarking application.
0
50
100
150
200
250
300
350
400
450
500
<25,000 25,000-49,999 50,000-99,999 100,000-249,999 250,000-499,999 500,000-999,999 >999,999
Population Served by LHD
No Clinical Services/Local Governance (n=1020)
No Clinical Services/State Governance (n=139)
No Clinical Services/Shared Governance (n=117)
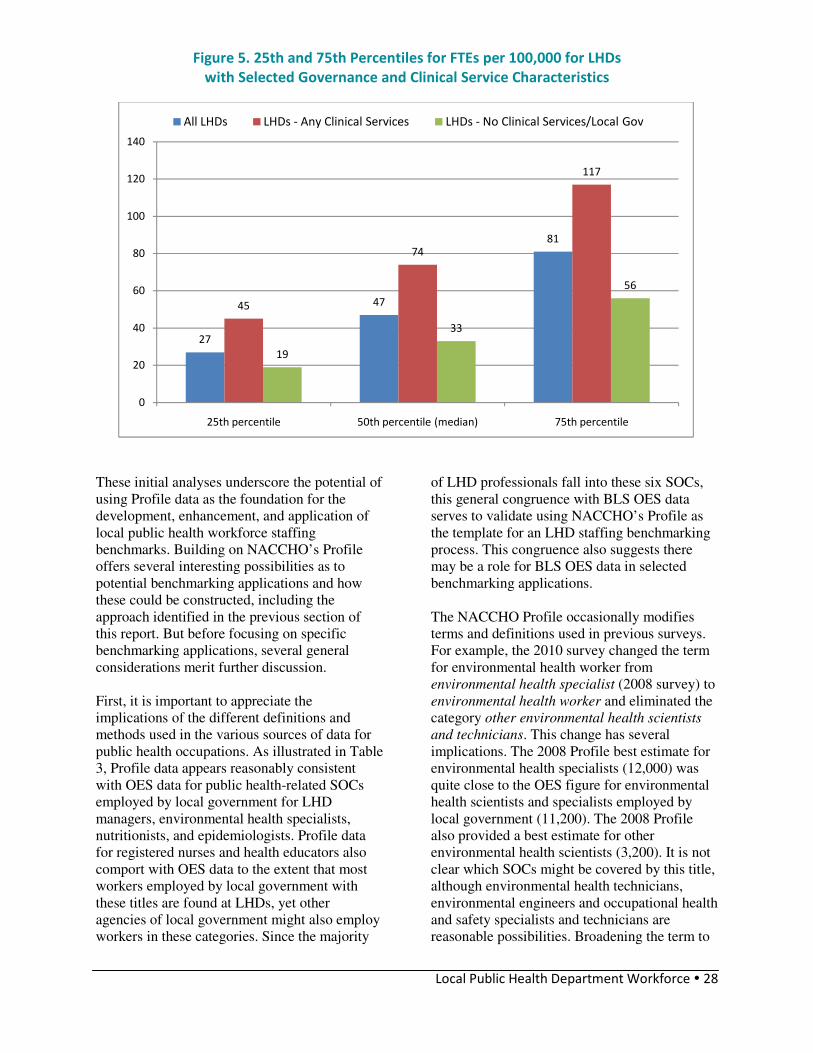
Local Public Health Department Workforce � 28
Figure 5. 25th and 75th Percentiles for FTEs per 100,000 for LHDs
with Selected Governance and Clinical Service Characteristics
These initial analyses underscore the potential of
using Profile data as the foundation for the
development, enhancement, and application of
local public health workforce staffing
benchmarks. Building on NACCHO’s Profile
offers several interesting possibilities as to
potential benchmarking applications and how
these could be constructed, including the
approach identified in the previous section of
this report. But before focusing on specific
benchmarking applications, several general
considerations merit further discussion.
First, it is important to appreciate the
implications of the different definitions and
methods used in the various sources of data for
public health occupations. As illustrated in Table
3, Profile data appears reasonably consistent
with OES data for public health-related SOCs
employed by local government for LHD
managers, environmental health specialists,
nutritionists, and epidemiologists. Profile data
for registered nurses and health educators also
comport with OES data to the extent that most
workers employed by local government with
these titles are found at LHDs, yet other
agencies of local government might also employ
workers in these categories. Since the majority
of LHD professionals fall into these six SOCs,
this general congruence with BLS OES data
serves to validate using NACCHO’s Profile as
the template for an LHD staffing benchmarking
process. This congruence also suggests there
may be a role for BLS OES data in selected
benchmarking applications.
The NACCHO Profile occasionally modifies
terms and definitions used in previous surveys.
For example, the 2010 survey changed the term
for environmental health worker from
environmental health specialist (2008 survey) to
environmental health worker and eliminated the
category other environmental health scientists
and technicians. This change has several
implications. The 2008 Profile best estimate for
environmental health specialists (12,000) was
quite close to the OES figure for environmental
health scientists and specialists employed by
local government (11,200). The 2008 Profile
also provided a best estimate for other
environmental health scientists (3,200). It is not
clear which SOCs might be covered by this title,
although environmental health technicians,
environmental engineers and occupational health
and safety specialists and technicians are
reasonable possibilities. Broadening the term to
27
47
81
45
74
117
19
33
56
0
20
40
60
80
100
120
140
25th percentile 50th percentile (median) 75th percentile
All LHDs LHDs - Any Clinical Services LHDs - No Clinical Services/Local Gov

Local Public Health Department Workforce � 29
environmental health worker would likely cover
these SOCs. As a result, this category will likely
include both professional and technical SOCs
when 2010 data is reported. A similar change
took place as the occupational category for
emergency preparedness coordinators (2008
Profile) was replaced by emergency
preparedness staff in the 2010 Profile survey.
Indeed the 2010 data may better characterize the
number of workers devoted to environmental
health and emergency preparedness activities.
This gain may come, however, at the cost of
reduced comparability with data from previous
surveys.
The 2008 Profile survey also includes some
subtler changes that merit scrutiny. The category
physicians became public health physicians and
registered nurses was changed to public health
nurses. It is not clear how LHDs will respond to
these revisions. It is possible that some
physicians will not be considered public health
physicians and that some registered nurses will
be counted as public health nurses. Whether and
where these physicians and nurses will be
reported merits attention and could generate
additional revisions in future Profile survey
instruments.
A related consideration is whether other key
SOCs are being missed. Recent NACCHO
Profile surveys have not included laboratory
workers and have only in 2008 begun to collect
information on behavioral health professionals.
In 2008, 25 percent of LHDs reported providing
laboratory services although BLS data indicates
that only 890 and 870 lab technologists and
technicians were employed by local government
in 2009. These low numbers suggest that
inclusion of laboratory workers among the LHD
staffing categories may not be productive. On
the other hand, about two-thirds of LHDs
serving populations of 500,000 or more provide
lab services and may comprise a significant part
of the workforce for these large LHDs.
Behavioral health professionals appear to have
become a prominent subset of the LHD
workforce, now ranking only behind registered
nurses, environmental health specialists, and
managers—and ahead of health educators and
nutritionists. This has occurred despite the
relatively small percentage (<10%) of LHDs
offering mental, behavioral, and substance abuse
services. In order to ensure more complete
reporting of behavioral health professionals, it
may be desirable for future Profile surveys to list
representative SOCs (substance abuse and
behavioral disorder counselors, mental health
counselors, public health and medical social
workers, mental health and substance abuse
social works) in defining the behavioral health
professional category.
Benchmarking physicians in the local public
health workforce also presents major challenges.
Table 3 aggregates the figures for the various
SOCs that BLS uses for different physician
specializations (family and general practitioners,
general internists, obstetricians/gynecologists,
general pediatricians, psychiatrists, surgeons,
and all other physicians and surgeons). If
physicians employed by LHDs fell mainly were
mainly family and general practitioners and
general pedestrians, the Profile 2008 best
estimate of 2000 FTEs might be reasonably
close to the 2660 figure derived from OES data.
As some of these physicians would be part-time
workers, the difference between the two
indicators shrinks.
A few other occupations tracked in the Profile
surveys also merit a brief discussion. It is not
clear whether an LHD public information
specialist fits the BLS SOC for public relations
specialist. Similarly, it is not clear into which
SOC the title of public health informatics
specialist best fits. The number of FTE positions
for each of these titles (fewer than 500) appears
to be quite small in comparison with the other
titles tracked by NACCHO, but these may
emerge as categories that merit attention for
longitudinal tracking efforts in the future. As
with behavioral health professionals, it may be
desirable to more closely align Profile survey
terms and instructions with appropriate SOC
definitions.
An overarching issue is the role of population
size in benchmarking design. It is not surprising
that the number of LHD FTEs is highly
correlated with the size of a local health
jurisdiction’s population, although there is
considerable variability even within population
size categories, as demonstrated in Table 8. The
worker to population ratio, however,
demonstrates a different pattern. Table 8
suggests that, except for the smallest and largest

Local Public Health Department Workforce � 30
LHD population categories, the worker to
population ratio is reasonably consistent across
the other five population size categories,
although each category again varies
considerably (Figure 2). The consistency in
median FTE worker to population ratios for
LHDs in all but the smallest and largest LHD
population categories, and in the interquartile
range for these categories, implies that these
population size categories may be influenced by
some common factors. An initial examination
suggests that the provision of clinical services
and governance structure are two such factors
and that performance levels, population density,
and population risk status could possibly be
others.
As indicated in prior sections, evidence of the
influence of performance of public health core
functions and essential public health services is
currently lacking. NACCHO surveys do not
directly measure different performance levels,
and proxy definitions based on recent
completion community health assessment and
community health improvement plans have not
identified differences in staffing levels.
Additional insights and information may be
available from states currently developing or
enhancing state-based LHD accreditation
initiatives. Some may have already examined
LHD staffing standards or analyzed staffing
issues related to achieving accreditation status.
The experiences of these states could well
inform the development of national LHD
staffing benchmarks.
IV. Possible LHD Staffing
Benchmark Applications
mong possible applications involving
LHD staffing benchmarks, two emerge
from this analysis as especially feasible.
One application would facilitate comparisons of
current or proposed staffing with that
appropriate for a well-functioning LHD serving
a jurisdiction of similar size and offering a
similar array of services. A second application
of LHD staffing benchmarks would facilitate
determination of the number and types of local
public health workers needed to serve a state or
national population, which could then be
compared with existing or projected levels. Data
and sources are currently in place to initiate the
development of both benchmarking applications,
although consensus around basic principles and
implementation strategies will be necessary in
order to move forward.
1. LHD Staffing Application (“My LHD” app)
A benchmarking application that facilitates
comparisons of current or proposed staffing with
a standard or desired staffing pattern can be
established based on the following principles:
• NACCHO’s Profile should serve as the
foundation and template
• Staffing benchmarks should be
consistent with those derived from high
functioning LHDs as defined by
accreditation standards and/or other
standards related to the essential public
health services (EPHS) or operational
definition of a functional local health
department
• Benchmarks should incorporate
adjustments for factors that have a
demonstrated influence on LHD staffing
(such as governance type and service
packages) and possibly other influences
(such as population density and health
risk characteristics) based on further
investigations.
A
BENCHMARK 1
Initially, median FTE worker to population
ratios for LHDs with similar governance and
clinical service characteristics. After a
sufficient number of LHDs are accredited,
median FTE worker to population ratios for
accredited LHDs with similar governance and
clinical service characteristics.

Local Public Health Department Workforce � 31
NACCHO Profile data from recent national
surveys of LHDs (especially 2008 and 2010)
offer a solid foundation for developing a
framework for LHD staffing benchmarks. The
2008 Profile report provides data on the
percentage of LHDs, stratified by size of
population served, with employees in selected
occupations and the median number of FTEs
employed in selected occupations for these
same LHD categories.11
A companion report
focusing specifically on the LHD workforce
tracks changes in selected occupations between
2005 and 2008, provides information on the
demographics of the local public health
workforce, and identifies interquartile ranges for
LHD FTEs and FTEs to population ratios.12
Profile data also allow for a comparison of the
racial and ethnic composition of the LHD
workforce with that of the jurisdiction that it
serves, a measure of workforce diversity,
another possible staffing benchmark for future
consideration.
The data underlying these measures, together
with the Profile’s extensive information on
programs and services provided by LHDs, allow
for an examination of the relationship between
staffing (FTE worker to population ratios for
specific occupational titles or groupings of these
titles) and the scope of public health programs
and services provided in their jurisdictions.
Several Profile questions address the
performance of core functions and essential
public health services in the community,
compatible with concepts measured in the
national voluntary accreditation program for
state and local health agencies. Analysis of
staffing patterns alongside performance of key
public health functions, programs, and services
can contribute to the development of preliminary
staffing benchmarks. The key question
underlying this analysis is whether employment
of specific occupational titles (or the level of
workers employed in these specific occupational
titles) is associated with overall LHD
performance and or the provision of specific
11
National Association of County and City Health Officials.
(2009). 2008 National Profile of Local Health Departments.
Washington, DC: NACCHO. 12
National Association of County and City Health Officials.
(2010).The Local Health Department Workforce: Findings
from the 2008 National Profile of Local Health
Departments. Washington, DC: NACCHO.
public health services. Or stated from a systems
perspective, what types, levels or patterns of
human resources as inputs will affect these
organizational outputs relative to current
expectations and standards of practice?
Profile data can be merged with other available
data sets to examine other possible influences on
LHD staffing patterns. LHDs serving primarily
rural and frontier populations may have special
staffing needs based on distance and population
density considerations. Merging information on
rural status and population density with Profile
staffing data may allow for an initial assessment
of this possible association. LHDs serving
populations with different health risk profiles
may experience different staffing needs. This
could be assessed by merging data from the
county health profiles13
with NACCHO Profile
data, although a substantial number of LHDs are
not organized at the county level. Incorporating
measures that have been identified as major
overall influences on population health status
such as poverty, smoking, and high school
graduation rates14
represents another option.
13
Robert Wood Johnson Foundation and the University of
Wisconsin Population Health Institute. County Health
Rankings. Available at www.countyhealthrankings.org/
Accessed February 22, 2011. 14
Muennig, P., Fiscella, K., Tancredi, D., and Franks, P.
(2010). The relative health burden of selected social and
behavioral risk factors in the United States: implications
for policy. Am J Public Health, 100:1758–1764.

Local Public Health Department Workforce � 32
Table 15. My LHD App—Benchmark Strategy
(Using LHD example from Table 11 and Table 12, Scenario 2)
Input Questions
(using 2008 Profile categories)
Input Data* Relevant
Benchmarks**
(FTEs)
1. Total workers (FTEs)?
2. Health service managers/directors?
3. Registered nurses?
4. Physicians?
5. Environmental health (EH) specialists?
6. Other EH scientists/technicians?
7. Epidemiologists?
8. Health educators?
9. Nutritionists?
10. Information system specialists?
11. Public information specialists?
12. Behavioral health professionals?
13. Emergency preparedness coordinators?
14. Administrative support / clerical?
15. Population served?
16. Governance type?
17. Primary care services?
18. Home health services?
19. Behavioral health (MH and/or SA) services?
20. Accredited (to be added after 2013)?
1. 15
2. 1
3. 5
4. 0
5. 2
6. 0
7. 0
8. 1
9. 0
10. 0
11. 0
12. 0
13. 0
14. 4
15. 38,000
16. Local
17. No
18. Yes
19. No
20. NA
LHD inputs for Total
Workers and Occupations
converted to FTE workers
per 100,000 population
����������������
Benchmarks developed
from worker/population
ratio for population size
and governance,
adjusted for services
provided, and then
converted back to FTEs.
1. 23.64
2. 1.34
3. 8.38
4. 0.00
5. 1.65
6. 0.00
7. 0.00
8. 0.14
9. 0.00
10. 0.00
11. 0.00
12. 0.00
13. 0.57
14. 5.39
Total for worker
categories
2–14 = 17.47
Notes: * Input data for questions 1–14 represents 25–50k category values from Table 7; **Benchmark data reflect Table 11 and Table 12
Scenario 2 example (only home health services provided).
An advantageous facet of NACCHO’s Profile is
that future surveys can be modified to
incorporate refined indicators such as additional
or more precise occupational classifications,
service delivery packages and performance
measures (such as accreditation status) in order
to refine local public health workforce staffing
benchmarks over time. The NACCHO Profile
program carries a high level of visibility and
credibility among LHDs, as well as among
public health researchers, suggesting the public
health community would likely understand,
support, and use benchmarks derived from this
effort.
The exact form or format of an LHD staffing
application will depend on the specific variables
incorporated, but at least conceptually, could
allow an LHD administrator to plug in data at a
designated website, or even into a hand-held
device using an iPhone or Android operating
system app (My LHP app). Table 15 illustrates
how such an application could identify
appropriate staffing benchmarks for an LHD
based on the size of the jurisdiction’s
population, form of governance, and whether
clinical services are provided by that LHD. In
concept, key data elements could be entered into
a simple program that would then compute the
desirable size and staffing composition (i.e.,
benchmarks) for that LHD using the approach
demonstrated in Tables 12 through 14. When a
substantial number of LHDs are accredited by
the Public Health Accreditation Board (perhaps
by 2014), the subset of accredited LHDs could
be used as the basis for this benchmarking
application. One strategy to promote the “My
LHD” application would be for future Profile
surveys to provide immediate feedback after the
LHD enters its workforce information. This
feedback could be in the form of a simple report
such as that suggested in Table 16.
2. Local Public Health Workforce Adequacy
Application (“U.S. Local Public Health
Workforce” app) A second benchmarking application that would
facilitate determination of the number and types

Local Public Health Department Workforce � 33
of public health workers needed to serve a state
or national population will likely require more
time and effort for implementation. More time
will be needed because it will be several years
until a substantial number of LHDs successfully
complete the national LHD accreditation process
so that this group of LHDs can be used as the
basis for desirable FTEs to population ratios.
Additional effort will also be required to modify
existing data systems to support this application.
Nonetheless, a local public health workforce
adequacy application can be established based
on the following principles:
• For national-level public health
workforce assessments, NACCHO
Profile data should serve as the
foundation and template, with BLS OES
and U.S. Census Bureau government
employment data serving as ancillaries
measures, although some important
modifications are needed in order to
make these sources more specific and
useful.
• Benchmarks developed at a state or sub-
national level should incorporate
adjustments for factors that have a
demonstrated influence on local public
health workforce staffing (possible
influences include state to state
differences, limitations of current
definitions and categories, as well as
governance types and service packages ,
and possibly population risk
characteristics and population density
features).
Key to the development of the LHD staffing
benchmark application described in the previous
section is the distribution of worker to
population ratios for LHDs with various
characteristics, including population size,
governance type, and service packages. These
characteristics reflect current local public health
practice, rather than a desired level such as that
associated with demonstrated superior
performance. The roll out of the Public Health
Accreditation Board’s national program for
LHD accreditation begins in the second half of
2011 with perhaps 50 percent or more of all
LHDs likely to seek accreditation between 2011
and 2014. Should this occur, the pool of
accredited LHDs can serve as the basis for
identifying FTE to population ratios to be used
as national benchmarks for comparison with
current levels. This second benchmarking
application could use these national or state-
level desirable levels in comparisons with
existing national or state-level measures derived
from Profile data, perhaps validated with
ongoing federal government survey activities.
The recommended option would rely primarily
on Profile data but would use adjustments to the
federal government survey activities for
validation or for tracking between Profile
surveys, which may take place only every two or
three years.
In addition to NACCHO’s Profile surveys,
several official sources of useful information on
the public health workforce can potentially
contribute to a U.S. local public health
workforce benchmarking application. The U.S.
Census Bureau conducts an ongoing survey of
government employment that includes
information on the number of FTE workers of
health agencies of federal, state, and local
governments. The Bureau of Labor Statistics
conducts ongoing surveys of employers in order
to track changes in SOCs. Although only a few
SOCs are public health-specific, SOCs for
several may be useful in establishing
benchmarks. These include epidemiologists,
environmental health specialists, managers,
educators, nutritionists, and possibly even
registered nurses, nutritionists, and emergency
management coordinators. Information from
these government sources may contribute to the
development of population-based benchmarks,
such as the number of epidemiologists employed
by local government per 100,000 or the number
BENCHMARK 2
Number of FTE local public health workers
needed if total U.S. population were served
by an accredited LHD.

Local Public Health Department Workforce � 34
of FTE workers of local governmental health
agencies per 100,000. The use of the latter as
measures of the current local public health
workforce within states should be approached
cautiously as some state employees provide
local public health services in some states.
Further, additional investigations are needed in
order to better understand other factors that may
account for the substantial differences in state
rates (Table 5) identified previously.
Completeness and accuracy of the Profile
information on the local health workforce is yet
another important issue for this benchmarking
application. There should be efforts to increase
the number of LHDs that respond fully and
accurately to workforce-related survey
questions. Perhaps immediate feedback via the
My LHD app would serve as an incentive.
Notwithstanding these considerations, an
application that assesses gaps or needs for
specific public health-related occupations
appears feasible. The framework or strategy for
such an application is outlined in Table 16.
Basically, national-level measures, with
necessary adjustments, would characterize
current workforce levels, while desired levels
would be established based on Profile survey
data for the group of accredited LHDs. Table 16
illustrates this benchmarking application using a
fabricated panel of worker to population ratios
as proxies for accredited LHDs (since these will
not be available for several years). The
hypothetical reference group used for illustration
purposes in Table 16 raises the question of
whether the benchmarks should be developed
from mean, rather than median, values and
whether the benchmark should be constructed by
summing the median worker to population ratios
across seven population categories.
This general approach allows for consideration
of the impact of different benchmark standards,
such as using only accredited LHDs serving
populations greater than 50,000 (or some other
threshold) in order to identify workforce gaps
under different scenarios. This discussion about
comparing existing with desired levels, and the
apparent resource implications that differ based
on whether less efficient staffing levels for small
LHDs are carried forward, draws parallels with
Emerson’s work in the 1940s.
Ideally, this benchmarking application would
also use available data from federal data sources
such as the Census Bureau’s Government
Employment Census and the Bureau of Labor
Statistics’ Occupational Employment data. It
might appear that one advantage of this strategy
would be that annual tracking would be possible.
Unfortunately, these data systems would require
adjustments and modifications to be used for this
purpose. For example, the timeliness of reports
from these sources is a potential problem.
Government employment data from the Census
Bureau for any given year is not published until
20 months after the year ends, and not finalized
for another five months. Similarly, BLS
occupational employment statistics (OES) are
published each year with data available
approximately 12 months after the survey is
completed. In addition, government employment
data as to the number of FTE workers employed
by health agencies of local government would
need be adjusted to (1) include only workers of
public health agencies at the local level and (2)
add in workers of health agencies at the state
level who provide local public health services.
This adjusted figure could then be used as the
existing number of local public health workers.
This could perhaps be more easily done at the
state level especially for the large number of
states that do not use state employees to provide
local public health services. The same
limitations exist in trying to use BLS OES data
for standard occupational categories instead of
Profile data for occupations. As a result, these
obstacles would limit the usefulness of
government survey data for these benchmarking
applications, other than to possibly serve as an
early warning system for changes in a few
public health-specific SOCs.

Local Public Health Department Workforce � 35
Table 16. Local Public Health Workforce Adequacy Benchmark Illustration (Notes: This table is only an illustration of the process; there are no actual benchmark data.
Also, the “gap” refers to the number of FTE local public health workers needed nationally,
rather than the number needed for current LHDs)
Occupation (2008 Profile categories) NACCHO
2008 Profile
Best
Estimate
FTEs
NACCHO
2008 Profile
Best
Estimate
FTEs per
100,000
Hypo-
thetical
Reference
Group*
FTEs per
100,000
Hypo-
thetical
Benchmark*
Gap
[Benchmark
minus Best
Estimates]
All Staff 155,000 50.32 59.98 184,738 29,738
Health service managers/directors 9,500 3.08 6.37 19,620 10,120
Registered nurses 33,000 10.71 19.21 59,167 26,167
Physicians 2,000 0.65 0.44 1,355 (645)
Environmental health (EH) specialists 12,000 3.90 4.82 14,846 2,846
Other EH scientists/technicians 3,200 1.04 0.56 1,725 (1,475)
Epidemiologists 1,200 0.39 0.33 1,016 (184)
Health educators 4,400 1.43 1.34 4,127 (273)
Nutritionists 4,300 1.40 1.50 4,620 320
Information systems specialists 1,600 0.52 0.51 1,571 (29)
Public information specialists 430 0.14 0.15 462 32
Behavioral health professionals 7,100 2.31 1.33 4,096 (3,004)
Emergency preparedness coordinators 1,400 0.45 0.78 2,402 1,002
Clerical staff 36,000 11.69 16.67 51,344 15,344 *Hypothetical reference group used here reflects each occupation’s highest median FTEs per 100,000 across the seven population size categories.
Note: Proposed benchmark to be derived from worker/population ratios for fully accredited LHDs applied to total U.S. population. In this
illustration, benchmark data are fabricated as there are no actual benchmark data.
These two proposed LHD benchmarking
applications are compatible with
recommendations of a recent examination of
staffing benchmarks for community health
centers. This effort identified two potential
benchmarks: the median staffing configuration
for all community health centers and an adjusted
measure reflecting the staffing configurations
utilized by other comparable health care systems
(such as HMOs and the Veterans
Administration).15
An analysis of the
characteristics of these different benchmarks
allowed for the projection of staffing needs
under various scenarios that reflected expansion
of community health centers to serve additional
populations. Although the community health
center benchmarks address only two
15 National Association of Community Health Centers.
Access Transformed: Building a Primary Care Workforce
for the 21st
Century. Available at
http://www.nachc.org/client/documents/ACCESS%20Tran
sformed%20full%20report.pdf Accessed February 22,
2011.
occupational categories, this effort offers
insights into problems and issues likely to arise
in establishing and using benchmarks for LHD
staffing. The use of more than one source of
staffing data is a common feature in both the
community health center and LHD staffing
benchmark activities. Blending the optimal
characteristics from different data systems in
benchmarking initiative requires a thoughtful
and open discussion involving key stakeholders,
including the public health systems research
community. Ultimately, refinement of these two
applications could lead to the identification of an
ideal or recommended staffing pattern based on
best practices as well as the identification of
national gaps and workforce development
priorities.

Local Public Health Department Workforce � 36
V. Pathway to Developing Local Public
Health Staffing Benchmarking
Applications
n sum, powerful arguments exist for building
two benchmarking applications on the
foundation of the NACCHO Profile. This is
an important step that breaks new ground, but it
will need to be approached carefully and
thoughtfully. Several preparatory steps are
necessary to advance these benchmarking
applications. These include a series of research
questions that can be examined incrementally, in
batches, or comprehensively. As many of these
would benefit from use of the most recent
Profile survey data, waiting until 2010 Profile
data become available before proceeding with
some of these research activities may be
desirable. This should not deter efforts to
complete some initial assessments using 2008
Profile data such as that contributing to the
development of this report (especially Table 12).
Four recommendations are offered: (1) develop
and deploy the “My LHD” app; (2) proceed
toward the development of the “U.S. Local
Public Health Workforce” app; (3) plan
revisions of Profile survey questions related to
the local public health workforce data sources
and identify beneficial enhancements of existing
federal data systems in order to advance these
benchmarking applications; and (4) increase
public health systems research in this area.
Recommendation 1:
Develop the “My LHD” app The basic strategy for the “My LHD”
application is to establish benchmarks based on
NACCHO Profile data, stratifying by LHD size,
governance type, and service package for total
FTE and the dozen occupational categories
included in the Profile surveys. Further
increasing the number of occupational categories
may prove unwieldy as the total numbers of
workers in these categories will likely be small
(1,000 or fewer), although some consideration to
the inclusion of laboratory workers appears
warranted. Factors responsible for differences in
the worker to population ratios for very small
and very large LHDs need further investigation.
Variability within current population categories
needs more precise explanation in terms of
which factors may be important for different
LHD population categories. Ultimately,
multivariate analysis may be necessary to
characterize these relationships more precisely.
Little guidance exists in the published public
health systems research literature as to the
relationship between local public health staffing
and other dimensions of LHD organizational
practice. This report incorporates preliminary
investigations for several potential influences on
LHD staffing but does not attempt to definitively
answerthe underlying research questions. One
investigation that may offer additional insights is
the examination of the distribution of FTEs to
population ratios (similar to that in Table 10) for
all workers and for each occupation for each of
the variable options under study.16
Important
research questions include the following:
• Are there differences in staffing patterns
(distribution of FTEs per 100,000
population for total employees and
selected occupational categories) for
LHDs stratified by population size and
(1) governance, (2) personal clinical
services offered, (3) population density,
(4) population risk status, and (5)
performance?
• What combination of variables should
drive the development of LHD staffing
benchmarks?
After the national accreditation program has
been operational for several years, benchmarks
should be derived from LHDs meeting national
accreditation standards. There is no current
evidence that high performing LHDs have
different staffing needs and patterns than low
performing LHDs, although this important
research question merits continuing attention as
developments occur.
Population size and the unequal distribution of
LHDs across the seven commonly used
population categories is another consideration
for further studies. Nearly two-thirds (64%) of
16
Figure 2 illustrates the distribution of median FTEs per
100,000 population for all LHDs. Replicating this
information for the combinations of the key variables
would result in 24 tables for all workers: (two performance
types: high, low) x (three governance types: local, state,
shared) x (four service types: primary care, home health,
behavioral/mental/substance abuse alone, more than one)
and a similar number for each occupational category.
I

Local Public Health Department Workforce � 37
LHDs serve populations less than 50,000 (two of
the seven size categories) and the remaining 36
percent is divided across the remaining five
categories. The number of LHDs in each
category varies widely, from only several dozen
serving populations of one million or more to
nearly 500 serving populations between 10,000
and 24,999. It is not clear whether future
analyses would benefit from using a greater
number of more equally sized LHDs, especially
because the population range for the highest
category would be quite wide.
Recommendation 2: Proceed toward the
development of the “U.S. Local Public Health
Workforce” app
As documented throughout this report,
considerable information is already available on
important aspects of the local public health
workforce at both the national and state level.
Census Bureau data on government employment
and Bureau of Labor Statistics data on SOCs for
occupations employed by LHDs allow for
longitudinal tracking of workforce trends on an
annual basis. Some data elements show
remarkable consistency with NACCHO Profile
data. Others will require adjustments based on
different definitions and contexts for use. It may
prove useful to conduct a full-scale examination
of the comparability of these different data
sources to ensure greater consistency in the
national aggregate data for specific public health
occupations working for units of local (or state
and local) governments. This would promote
more meaningful assessments of workforce
needs and gaps in view of the many different
configurations of service delivery, functional
performance, and state-local and regional
relationship profiles. One component of this
assessment should investigate whether BLS can
develop a composite national picture of the
number of workers in specific SOCs employed
by local government (and possibly state
government) as well as state-specific tallies for
each of the 50 states. Although this information
is useful at the level of “health agencies” of local
or state government, it would be particularly
useful at the level for the NAICS category for
administration of public health programs
(NAICS code 923120). In addition to facilitating
comparisons among existing, projected, and
needed numbers of local public health workers
in selected occupations, a “watch list” could be
generated for national local public health
workforce needs for key occupational categories
(based in part on national data and extrapolated
Profile data) including managers, environmental
health, epidemiologists, health educator,
nutritionists, and emergency preparedness staff.
Better understanding of the nuances and
differences among the current data sources is
needed. Studies comparing data within the same
state would be especially useful. For example,
state by state investigations into the differences
between the number of workers reported by
LHDs in NACCHO Profile surveys and
government employment data within that state
could elucidate new insights. Comparisons of
BLS data for sentinel public health occupations
employed by local government with NACCHO
Profile survey data could allow one source or the
other to contribute to national staffing
benchmarking applications. In addition, the large
variation across states in the government
employment data for the worker to population
ratio for workers of health agencies of local
government merits attention and explanation.
Recommendation 3: Plan revisions to future
NACCHO Profile surveys and identify
beneficial enhancements of existing OES and
Government Employment Census data
reports. Throughout this report, the usefulness of
NACCHO Profile data is documented. Each
Profile survey is carefully planned and executed.
Considerable input goes into the review of
previous survey questions and into revisions and
additions to be included in the next survey cycle.
Possible revisions for future Profile surveys
have been suggested in various sections of this
report. These largely relate to two issues: (1)
capturing information on LHD accreditation
status and other possible measures of overall
LHD performance of LHDs; and (2) enhancing
information on the LHD occupational
categories.
The national Public Health Accreditation Board
(PHAB) plans to initiate a process for
accrediting LHDs in the second half of 2011. It
is not clear how many LHDs will seek PHAB
accreditation, and it is not clear what PHAB’s
capacity will be in terms of being able to review
and accredit LHDs seeking to be accredited. In
any event, it will likely be several years before a
sufficient number of LHDs are accredited and

Local Public Health Department Workforce � 38
workforce data from accredited LHDs can be
captured through Profile surveys. Information
from accredited LHDs will be necessary for both
benchmarking applications proposed in this
report. In the meantime, examining Profile data
for other possible proxies of performance may
be desirable. Although recent completion of
community health assessments and community
health improvement plans does not appear to
affect LHD staffing, this possible relationship
could be further examined using a variety of
measures and definitions. These could be
included in the next iteration of the Profile
survey in 2012 or 2013. Alternatively, the
proposed interim benchmark reflecting existing
worker to population ratios may be sufficient
until a benchmark based on accredited LHDs
becomes available.
Several changes to the 2010 Profile survey
instrument should be noted. Two occupational
categories used in the 2008 Profile survey
(environmental health specialists and other
environmental health scientists) were collapsed
into a new category (environmental health
worker) and a similar change was introduced for
another category (emergency preparedness
coordinator was changed to emergency
preparedness staff). These changes diminish the
compatibility of the Profile workforce categories
with specific BLS SOCs but result in the
inclusion of more LHD staff in the reported
categories. Both professionals and technicians
will likely now be included in the data reported
by LHDs. These changes may result in more
complete information on LHD staffing and more
useful benchmarks. Another change, but one not
expected to affect reporting, was the inclusion of
“public health” before the manager, nurse, and
physician categories. As planning for the next
Profile survey gets underway, it will be
important to consider the workforce information
to be collected in terms of its impact on these
benchmarking applications.

Local Public Health Department Workforce � 39
Table 17. Key Research Questions for Refining LHD Staffing
and U.S. Local Public Health Workforce Benchmarks
Questions Evidence Plan
Does LHD population size
influence staffing (total and
specific occupations)?
• Number and types of staff increase as
population served increases
• Ratio of workers to population shows
consistent pattern except for smallest
and largest LHDs
• Examine distribution of worker
to population ratios for
occupations
Does LHD governance
influence staffing (total and
specific occupations)?
• Local governance LHDs have lower
worker to population ratios than state
or shared governance regardless of
service profile
• Examine distribution of worker
to population ratios for
occupations for the various
governance categories for
insights into different roles and
duties
Do LHD personal health
services profile influence
staffing (total and specific
occupations)?
• LHDs providing one or more personal
health services have higher worker to
population ratios than LHDs that do not
provide personal health services
• Develop additional service
profiles
• Examine distribution of worker
to population ratios for total
workers and occupations
• To what extent do the findings
for specific occupations explain
differences in the number of
total workers, as well?
Does LHD performance
influence staffing (total and
specific occupations)?
• Using CHA and CHIP completion as
proxies for performance, no differences
in worker to population ratios detected
• Develop additional
performance profiles
• Examine distribution of worker
to population ratios for total
workers and occupations
Does LHD population
density influence staffing
(total and specific
occupations)?
• Great variability among smallest LHDs
in worker to population ratios is
suggestive
• Identify data source for
population density for LHD
jurisdictions
• Merge new data source with
Profile data
• Examine distribution of worker
to population ratios for
occupations
Do LHD population risk
characteristics influence
staffing (total and specific
occupations)?
• Variability among largest LHDs in
worker to population ratios is
suggestive
• Identify data source for
population density for LHD
jurisdictions
• Merge new data source with
Profile data
• Examine distribution of worker
to population ratios for
occupations
Using multivariate analyses,
which factors have the
greatest influence the size
and composition of the LHD
workforce?
• Mix of influences varies across LHD
population categories suggesting the
impact of specific influences may also
vary for these categories
• Multivariate analysis could be
incorporated in formal public
health systems research
proposal

Local Public Health Department Workforce � 40
Do states differ in the
distribution of worker to
population ratios for similar
LHD population categories?
• LHD staffing differences among states
may exist but have not yet been
examined
• Government employment data suggest
considerable variability exists across
states
• Profile data allow for examining
similar LHD population
categories across the 50 states
for differences in worker to
population ratios
Are aggregate Profile data
for LHD staffing compatible
with Census Bureau and BLS
data?
• Profile best estimates and OES SOC data
for local government are close for
managers, epidemiologists,
environmental health specialists,
nutritionists
• Further investigation is needed
into the availability of
Government Employment and
OES data at the NAICS 923120
code level
What accounts for the
differences across states in
government employment
and payroll data?
• No information available other than
speculation as to different roles and
duties
• Further investigation is needed
into differences that may exist
from the state to state in (1)
the activities captured in the
government employment data
and (2) the way data are
collected for that state
Are state-specific Profile
data compatible with state-
specific government
employment data?
• No information that such comparisons
have been made
• Further investigation is needed
into this question on a state by
state basis
Are state-specific Profile
data compatible with state-
specific BLS data for
selected SOCs employed by
local government?
• No information that such comparisons
have been made
• Further investigation is needed
into this question on a state by
state basis
Recommendation 4: Increase Public Health
Systems Research Focusing on the Workforce This report identifies the dearth of information
on the relationship of the public health
workforce to other aspects of the public health
infrastructure and to the outputs and outcomes of
local public health practice. NACCHO and other
national public health organizations should
vigorously encourage public and private sector
entities to support and fund public health
systems research focusing on the workforce.
Table 17 summarizes some of the key research
questions, available evidence, and suggested
next steps to inform the further development and
refinement of the two benchmarking
applications proposed in this report.
Limitations The analysis and recommendations offered in
this report have several limitations. NACCO
Profile data are widely recognized as a valuable
resource for public health systems research, but
the data are not perfect. For purposes of local
public health workforce benchmarking
applications, the completeness and accuracy of
reporting clinical services will be important.
Profile survey questions regarding the presence
or absence of these services, and entities
offering them, could be misunderstood,
contributing to variability in the construction of
reference groups for the proposed My LHD app.
In addition, there may be other services that
should be considered in identifying appropriate
reference groups, such as the scope of
environmental health, communicable disease
control, or chronic disease prevention services.
An important caution is the notion of
benchmarks themselves. As previously
discussed, benchmarks are simply arbitrary
reference points for measurement and not
necessarily desired or optimal standards of
practice. The proposed LHD staffing benchmark
uses the typical (median) staffing configuration
for LHDs with similar governance and clinical
service characterizes serving a similar sized
population. This does not assume or imply that
such typical benchmarks are appropriate models
for other LHDs, only that such a typical LHD
offers a reasonable basis for comparison. Other
circumstances could well justify staffing patterns
that differ, with more or less staff or different

Local Public Health Department Workforce � 41
staff, from that of the benchmark. This report
does propose the use of accredited LHDs as the
basis for reference group development after a
substantial number of LHDs receive PHAB
accreditation status. This will make this
benchmarking application more focused on
quality than not distinguishing between LHDs
based on performance as an interim strategy.
VI. Summary
wo new benchmarking applications and
benchmarks are proposed in this report.
One application compares an LHD’s
existing staffing to a benchmark specific for key
LHD characteristics. A second application
allows for comparing the existing local public
health workforce, including specific
occupations, to levels consistent with those for
accredited LHDs. Steps needed to further the
development of these two benchmarking
applications are identified. These benchmarking
activities are feasible through use of data from
the NACCHO Profile series and will be
enhanced with modest revisions to future Profile
survey questions. Although useful for the local
public health practice community in general, and
LHDs in particular, the issues raised in this
benchmark-development process are both
important and longstanding. Ultimately, any
workforce benchmarking activity will be
influenced by what the work of public health is
and how it is organized, deployed, delegated,
and managed. Emerson’s early studies in the
1940s in this area led to recommendations for
minimum LHD population size (>50,000) that
may need to be revisited. Current local public
health resource deployment strategies may be
inefficient in that the many small LHDs (with
43% serving populations under 25,000) have
relatively higher staffing levels (higher worker
to population ratios) than a larger and more
efficiently organized public health system would
require. Benchmarks may ultimately be useful in
helping to rationalize and restructure the
deployment of the public health system’s
increasingly scarce human resources.
Acknowledgments
This study was made possible through the support of
the Centers for Disease Control and Prevention
(CDC), Grant HM08-80503CONT10. NACCHO is
grateful for this support. The views expressed within
do not necessarily represent those of the sponsors.
NACCHO thanks Bernard Turnock, consultant for
this project.
T

Local Public Health Department Workforce � 42
Appendix 1: Tables
Appendix Table 1a. Staffing Benchmark Illustration for Locally Governed LHD “X”
Serving Population of 38,000; Scenario 1: LHD “X” Provides No Clinical Services
Occupation Reference
Group*
Median
FTEs per
100,000
Adjustment
(FTEs per
100,000)
Adjusted
FTEs per
100,000
Benchmark
FTEs
Health service managers/directors 2.90 0.00 2.90 1.10
Registered nurses 8.75 0.00 8.75 3.32
Physicians 0.00 0.00 0.00 0.00
Environmental health (EH) specialists 4.35 0.00 4.35 1.65
Other EH scientists/technicians 0.00 0.00 0.00 0.00
Epidemiologists 0.00 0.00 0.00 0.00
Health educators 0.36 0.00 0.36 0.14
Nutritionists 0.00 0.00 0.00 0.00
Information systems specialists 0.00 0.00 0.00 0.00
Public information specialists 0.00 0.00 0.00 0.00
Behavioral health professionals 0.00 0.00 0.00 0.00
Emergency preparedness coordinators 0.61 0.00 0.61 0.23
Clerical staff 7.98 0.00 7.98 3.03
Staff in these 13 occupations 24.95 0.00 24.95 9.48
All LHD staff 31.13 0.00 31.13 11.83 *Reference Group = LHDs with local governance serving populations between 25,000 and 49,999; n=226
Appendix Table 1b. Staffing Benchmark Illustration for Locally Governed LHD “X”
Serving Population of 38,000; Scenario 2: LHD “X” Provides Home Health Services
Occupation Reference
Group*
Median
FTEs per
100,000
Home
Health
Adjust-
ment
(FTEs per
100,000)
Adjusted
FTEs per
100,000
Benchmark
FTEs
Health service managers/directors 2.90 0.63 3.53 1.34
Registered nurses 8.75 13.30 22.05 8.38
Physicians 0.00 0.00 0.00 0.00
Environmental health (EH) specialists 4.35 0.00 4.35 1.65
Other EH scientists/technicians 0.00 0.00 0.00 0.00
Epidemiologists 0.00 0.00 0.00 0.00
Health educators 0.36 0.00 0.36 0.14
Nutritionists 0.00 0.00 0.00 0.00
Information systems specialists 0.00 0.00 0.00 0.00
Public information specialists 0.00 0.00 0.00 0.00
Behavioral health professionals 0.00 0.00 0.00 0.00
Emergency preparedness coordinators 0.61 0.90 1.51 0.57
Clerical staff 7.98 6.19 14.17 5.39
Staff in these 13 occupations 24.94 21.02 45.96 17.47
All LHD staff 31.13 31.09 62.22 23.64 *Reference Group = LHDs with local governance serving populations between 25,000 and 49,999; n=226

Local Public Health Department Workforce � 43
Appendix Table 1c. Staffing Benchmark Illustration for Locally Governed LHD “X”
Serving Population of 38,000; Scenario 3: LHD “X” Provides Primary Care Services
Occupation Reference
Group*
Median
FTEs per
100,000
Primary
Care
Adjustment
(FTEs per
100,000)
Adjusted
FTEs per
100,000
Benchmark
FTEs
Health service managers/directors 2.90 0.00 2.90 1.10
Registered nurses 8.75 7.94 16.69 6.34
Physicians 0.00 2.07 2.07 0.79
Environmental health (EH) specialists 4.35 0.00 4.35 1.65
Other EH scientists/technicians 0.00 0.00 0.00 0.00
Epidemiologists 0.00 0.00 0.00 0.00
Health educators 0.36 2.02 2.38 0.90
Nutritionists 0.00 2.89 2.89 1.10
Information systems specialists 0.00 0.00 0.00 0.00
Public information specialists 0.00 0.00 0.00 0.00
Behavioral health professionals 0.00 0.00 0.00 0.00
Emergency preparedness coordinators 0.61 0.00 0.61 0.23
Clerical staff 7.98 8.85 16.83 6.40
Staff in these 13 occupations 24.94 23.77 48.71 18.51
All LHD staff 31.13 33.88 65.01 24.70 *Reference Group = LHDs with local governance serving populations between 25,000 and 49,999; n=226
Appendix Table 1d. Staffing Benchmark Illustration for Locally Governed LHD “X” Serving
Population of 38,000; Scenario 4: LHD “X” Provides Primary Care and Home Health Services
Occupation Reference
Group*
Median
FTEs per
100,000
Primary
Care
Adjust-
ment
(FTEs per
100,000)
Home
Health
Adjust-
ment
(FTEs per
100,000)
Adjusted
FTEs per
100,000
Benchmark
FTEs
Health service managers/directors 2.90 0.00 0.63 3.53 1.34
Registered nurses 8.75 7.94 13.30 29.99 11.40
Physicians 0.00 2.07 0.00 2.07 0.79
Environmental health (EH) specialists 4.35 0.00 0.00 4.35 1.65
Other EH scientists/technicians 0.00 0.00 0.00 0.00 0.00
Epidemiologists 0.00 0.00 0.00 0.00 0.00
Health educators 0.36 2.02 0.00 2.38 0.90
Nutritionists 0.00 2.89 0.00 2.89 1.10
Information systems specialists 0.00 0.00 0.00 0.00 0.00
Public information specialists 0.00 0.00 0.00 0.00 0.00
Behavioral health professionals 0.00 0.00 0.00 2.50 0.95
Emergency preparedness coordinators 0.61 0.00 0.90 1.51 0.57
Clerical staff 7.98 8.85 6.19 23.02 8.75
Staff in these 13 occupations 24.94 23.77 21.02 69.73 26.50
All LHD staff 31.13 33.88 31.09 96.10 36.52 *Reference Group = LHDs with local governance serving populations between 25,000 and 49,999; n=226

Local Public Health Department Workforce � 44
Appendix Table 1e. Staffing Benchmark Illustration for Locally Governed LHD “X” Serving
Population of 38,000; Scenario 5: LHD “X” Provides Primary Care, Home Health, and
Behavioral Health Services
Occupation Reference
Group*
Median
FTEs per
100,000
Primary
Care
Adjust-
ment
(FTEs per
100,000)
Home
Health
Adjust-
ment
(FTEs per
100,000)
MH - SA
Adjust-
ment
(FTEs per
100,000)
Adjusted
FTEs per
100,000
Benchmark
FTEs
Health service managers/directors 2.90 0.00 0.63 0.00 3.53 1.34
Registered nurses 8.75 7.94 13.30 6.30 36.29 13.79
Physicians 0.00 2.07 0.00 0.00 2.07 0.79
Environmental health (EH) specialists 4.35 0.00 0.00 0.00 4.35 1.65
Other EH scientists/technicians 0.00 0.00 0.00 0.00 0.00 0.00
Epidemiologists 0.00 0.00 0.00 0.00 0.00 0.00
Health educators 0.36 2.02 0.00 1.27 3.65 1.39
Nutritionists 0.00 2.89 0.00 1.03 3.92 1.49
Information systems specialists 0.00 0.00 0.00 0.00 0.00 0.00
Public information specialists 0.00 0.00 0.00 0.00 0.00 0.00
Behavioral health professionals 0.00 0.00 0.00 2.50 2.50 0.95
Emergency prepare. coordinators 0.61 0.00 0.90 0.00 1.51 0.57
Clerical staff 7.98 8.85 6.19 5.42 28.44 10.81
Staff in these 13 occupations 24.94 23.77 21.02 15.52 86.25 32.78
All LHD staff 31.13 33.88 31.09 15.55 111.65 42.43 *Reference Group = LHDs with local governance serving populations between 25,000 and 49,999; n=226
Appendix Table 2a. Staffing Benchmark Illustration for State Governed LHD “X” Serving
Population of 175,000; Scenario 1: LHD “X” Provides No Clinical Services
Occupation Reference
Group*
Median FTEs
per
100,000
Adjustment
(FTEs per
100,000)
Adjusted FTEs
per 100,000
Benchmark
FTEs
Health service managers/directors 1.65 0.00 1.65 2.89
Registered nurses 9.64 0.00 9.64 16.87
Physicians 0.45 0.00 0.45 0.79
Environmental health (EH) specialists 4.48 0.00 4.48 7.84
Other EH scientists/technicians 0.00 0.00 0.00 0.00
Epidemiologists 0.54 0.00 0.54 0.95
Health educators 0.58 0.00 0.58 1.02
Nutritionists 1.76 0.00 1.76 3.08
Information systems specialists 0.00 0.00 0.00 0.00
Public information specialists 0.00 0.00 0.00 0.00
Behavioral health professionals 0.00 0.00 0.00 0.00
Emergency preparedness coordinators 0.57 0.00 0.57 1.00
Clerical staff 12.85 0.00 12.85 22.49
Staff in these 13 occupations 32.52 0.00 32.52 56.91
All LHD staff 39.74 0.00 39.74 69.55 *Reference Group = LHDs with state governance serving populations between 100,000 and 249,999; n=22

Local Public Health Department Workforce � 45
Appendix Table 2b. Staffing Benchmark Illustration for State Governed LHD “X” Serving
Population of 175,000; Scenario 2: LHD “X” Provides Home Health Services
Occupation Reference
Group*
Median FTEs
per
100,000
Home Health
Adjustment
(FTEs per
100,000)
Adjusted FTEs
per 100,000
Benchmark
FTEs
Health service managers/directors 1.65 2.37 4.02 7.04
Registered nurses 9.64 9.18 18.82 32.94
Physicians 0.45 0.00 0.45 0.79
Environmental health (EH) specialists 4.48 1.16 5.64 9.87
Other EH scientists/technicians 0.00 0.00 0.00 0.00
Epidemiologists 0.54 0.00 0.54 0.95
Health educators 0.58 0.02 0.60 1.05
Nutritionists 1.76 0.51 2.27 3.97
Information systems specialists 0.00 0.00 0.00 0.00
Public information specialists 0.00 0.00 0.00 0.00
Behavioral health professionals 0.00 0.89 0.89 1.56
Emergency preparedness coordinators 0.57 0.04 0.61 1.07
Clerical staff 12.85 5.30 18.15 31.76
Staff in these 13 occupations 32.52 19.47 51.99 90.98
All LHD staff 39.74 25.65 65.39 114.43 *Reference Group = LHDs with state governance serving populations between 100,000 and 249,999; n=22
Appendix Table 2c. Staffing Benchmark Illustration for State Governed LHD “X” Serving
Population of 175,000; Scenario 3: LHD “X” Provides Primary Care Services
Occupation Reference Group*
Median FTEs per
100,000
Primary
Care
Adjustment
(FTEs per
100,000)
Adjusted
FTEs per
100,000
Benchmark
FTEs
Health service managers/directors 1.65 0.19 1.84 3.22
Registered nurses 9.64 4.88 14.52 25.41
Physicians 0.45 1.07 1.52 2.66
Environmental health (EH) specialists 4.48 0.00 4.48 7.84
Other EH scientists/technicians 0.00 0.44 0.44 0.77
Epidemiologists 0.54 0.00 0.54 0.95
Health educators 0.58 0.17 0.75 1.31
Nutritionists 1.76 0.20 1.96 3.43
Information systems specialists 0.00 0.66 0.66 1.16
Public information specialists 0.00 0.00 0.00 0.00
Behavioral health professionals 0.00 0.74 0.74 1.30
Emergency preparedness coordinators 0.57 0.12 0.69 1.21
Clerical staff 12.85 6.84 19.69 34.46
Staff in these 13 occupations 32.52 15.31 47.83 83.70
All LHD staff 39.74 25.72 65.46 114.56 *Reference Group = LHDs with state governance serving populations between 100,000 and 249,999; n=22

Local Public Health Department Workforce � 46
Appendix Table 2d. Staffing Benchmark Illustration for State Governed LHD “X” Serving
Population of 175,000; Scenario 4: LHD “X” Provides Primary Care and Home Health Services
Occupation Reference
Group*
Median
FTEs per
100,000
Primary
Care
Adjust-
ment
(FTEs per
100,000)
Home
Health
Adjust-
ment
(FTEs per
100,000)
Adjusted
FTEs per
100,000
Benchmark
FTEs
Health service managers/directors 1.65 0.19 2.37 4.21 7.37
Registered nurses 9.64 4.88 9.18 23.70 41.48
Physicians 0.45 1.07 0.00 1.52 2.66
Environmental health (EH) specialists 4.48 0.00 1.16 5.64 9.87
Other EH scientists/technicians 0.00 0.44 0.00 0.44 0.77
Epidemiologists 0.54 0.00 0.00 0.54 0.95
Health educators 0.58 0.17 0.02 0.77 1.35
Nutritionists 1.76 0.20 0.51 2.47 4.32
Information systems specialists 0.00 0.66 0.00 0.66 1.16
Public information specialists 0.00 0.00 0.00 0.00 0.00
Behavioral health professionals 0.00 0.74 0.89 1.63 2.85
Emergency preparedness coordinators 0.57 0.12 0.04 0.73 1.28
Clerical staff 12.85 6.84 5.30 24.99 43.73
Staff in these 13 occupations 32.52 15.31 19.47 67.30 117.78
All LHD staff 39.74 25.72 25.65 91.11 159.44 *Reference Group = LHDs with state governance serving populations between 100,000 and 249,999; n=22
Appendix Table 2e. Staffing Benchmark Illustration for State Governed LHD “X” Serving
Population of 175,000; Scenario 5: LHD “X” Provides Primary Care, Home Health, and
Behavioral Health Services
Occupation Reference
Group*
Median
FTEs per
100,000
Primary
Care
Adjust-
ment
(FTEs per
100,000)
Home
Health
Adjust-
ment
(FTEs per
100,000)
Adjusted
FTEs per
100,000
Benchmark
FTEs
Occupation
Health service managers/directors 1.65 0.19 2.37 0.00 4.21 7.37
Registered nurses 9.64 4.88 9.18 2.40 26.10 45.68
Physicians 0.45 1.07 0.00 0.31 1.84 3.22
Environmental health (EH) specialists 4.48 0.00 1.16 0.88 6.52 11.41
Other EH scientists/technicians 0.00 0.44 0.00 0.00 0.44 0.77
Epidemiologists 0.54 0.00 0.00 0.05 0.59 1.03
Health educators 0.58 0.17 0.02 0.00 0.77 1.35
Nutritionists 1.76 0.20 0.51 0.00 2.47 4.32
Information systems specialists 0.00 0.66 0.00 0.00 0.66 1.16
Public information specialists 0.00 0.00 0.00 0.00 0.00 0.00
Behavioral health professionals 0.00 0.74 0.89 1.95 3.58 6.27
Emergency prepare. coordinators 0.57 0.12 0.04 0.00 0.73 1.28
Clerical staff 12.85 6.84 5.30 5.03 30.02 52.54
Staff in these 13 occupations 32.52 15.31 19.47 10.62 77.92 136.36
All LHD staff 39.74 25.72 25.65 18.51 109.62 191.84 *Reference Group = LHDs with state governance serving populations between 100,000 and 249,999; n=22
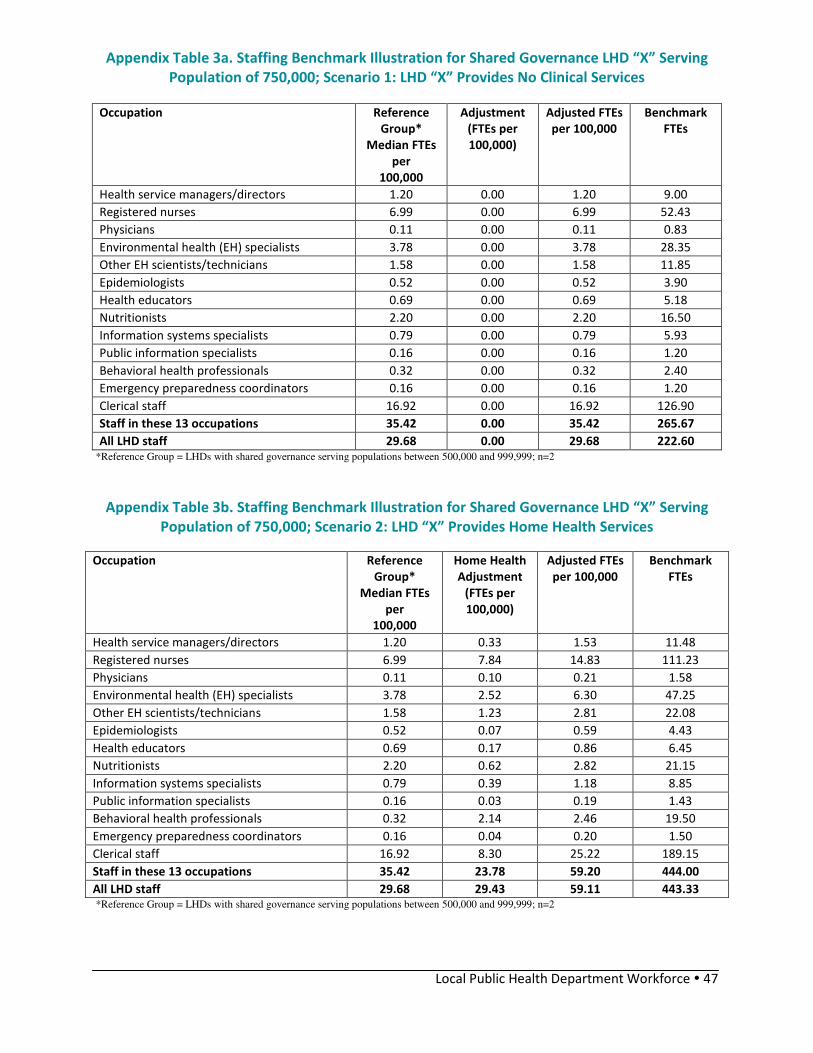
Local Public Health Department Workforce � 47
Appendix Table 3a. Staffing Benchmark Illustration for Shared Governance LHD “X” Serving
Population of 750,000; Scenario 1: LHD “X” Provides No Clinical Services
Occupation Reference
Group*
Median FTEs
per
100,000
Adjustment
(FTEs per
100,000)
Adjusted FTEs
per 100,000
Benchmark
FTEs
Health service managers/directors 1.20 0.00 1.20 9.00
Registered nurses 6.99 0.00 6.99 52.43
Physicians 0.11 0.00 0.11 0.83
Environmental health (EH) specialists 3.78 0.00 3.78 28.35
Other EH scientists/technicians 1.58 0.00 1.58 11.85
Epidemiologists 0.52 0.00 0.52 3.90
Health educators 0.69 0.00 0.69 5.18
Nutritionists 2.20 0.00 2.20 16.50
Information systems specialists 0.79 0.00 0.79 5.93
Public information specialists 0.16 0.00 0.16 1.20
Behavioral health professionals 0.32 0.00 0.32 2.40
Emergency preparedness coordinators 0.16 0.00 0.16 1.20
Clerical staff 16.92 0.00 16.92 126.90
Staff in these 13 occupations 35.42 0.00 35.42 265.67
All LHD staff 29.68 0.00 29.68 222.60 *Reference Group = LHDs with shared governance serving populations between 500,000 and 999,999; n=2
Appendix Table 3b. Staffing Benchmark Illustration for Shared Governance LHD “X” Serving
Population of 750,000; Scenario 2: LHD “X” Provides Home Health Services
Occupation Reference
Group*
Median FTEs
per
100,000
Home Health
Adjustment
(FTEs per
100,000)
Adjusted FTEs
per 100,000
Benchmark
FTEs
Health service managers/directors 1.20 0.33 1.53 11.48
Registered nurses 6.99 7.84 14.83 111.23
Physicians 0.11 0.10 0.21 1.58
Environmental health (EH) specialists 3.78 2.52 6.30 47.25
Other EH scientists/technicians 1.58 1.23 2.81 22.08
Epidemiologists 0.52 0.07 0.59 4.43
Health educators 0.69 0.17 0.86 6.45
Nutritionists 2.20 0.62 2.82 21.15
Information systems specialists 0.79 0.39 1.18 8.85
Public information specialists 0.16 0.03 0.19 1.43
Behavioral health professionals 0.32 2.14 2.46 19.50
Emergency preparedness coordinators 0.16 0.04 0.20 1.50
Clerical staff 16.92 8.30 25.22 189.15
Staff in these 13 occupations 35.42 23.78 59.20 444.00
All LHD staff 29.68 29.43 59.11 443.33 *Reference Group = LHDs with shared governance serving populations between 500,000 and 999,999; n=2

Local Public Health Department Workforce � 48
Appendix Table 3c. Staffing Benchmark Illustration for Shared Governance LHD “X” Serving
Population of 750,000; Scenario 3: LHD “X” Provides Primary Care Services
Occupation Reference
Group*
Median FTEs
per
100,000
Primary Care
Adjustment
(FTEs per
100,000)
Adjusted FTEs
per 100,000
Benchmark
FTEs
Health service managers/directors 1.20 0.51 1.71 12.83
Registered nurses 6.99 3.61 10.60 79.50
Physicians 0.11 0.58 0.69 5.18
Environmental health (EH) specialists 3.78 2.07 5.85 43.88
Other EH scientists/technicians 1.58 0.00 1.58 11.85
Epidemiologists 0.52 0.08 0.60 4.50
Health educators 0.69 0.00 0.69 5.18
Nutritionists 2.20 1.52 3.72 27.90
Information systems specialists 0.79 0.76 1.55 11.63
Public information specialists 0.16 0.01 0.17 1.28
Behavioral health professionals 0.32 0.62 0.94 4.70
Emergency preparedness coordinators 0.16 0.03 0.19 1.43
Clerical staff 16.92 12.23 29.15 218.63
Staff in these 13 occupations 35.42 22.02 57.44 430.80
All LHD staff 29.68 18.38 48.06 360.45 *Reference Group = LHDs with shared governance serving populations between 500,000 and 999,999; n=2
Appendix Table 3d. Staffing Benchmark Illustration for Shared Governance LHD “X” Serving
Population of 750,000; Scenario 4: LHD “X” Provides Primary Care and Home Health Services
Occupation Reference
Group*
Median
FTEs per
100,000
Primary
Care
Adjust-
ment
(FTEs per
100,000)
Home
Health
Adjust-
ment
(FTEs per
100,000)
Adjusted
FTEs per
100,000
Benchmark
FTEs
Health service managers/directors 1.20 0.51 0.33 2.04 15.30
Registered nurses 6.99 3.61 7.84 18.44 138.30
Physicians 0.11 0.58 0.10 0.79 5.93
Environmental health (EH) specialists 3.78 2.07 2.52 8.37 62.78
Other EH scientists/technicians 1.58 0.00 1.23 2.81 21.08
Epidemiologists 0.52 0.08 0.07 0.67 5.03
Health educators 0.69 0.00 0.17 0.86 6.45
Nutritionists 2.20 1.52 0.62 4.34 32.55
Information systems specialists 0.79 0.76 0.39 1.94 14.55
Public information specialists 0.16 0.01 0.03 0.20 1.50
Behavioral health professionals 0.32 0.62 2.14 3.10 23.25
Emergency preparedness coordinators 0.16 0.03 0.04 0.23 1.73
Clerical staff 16.92 12.23 8.30 37.45 280.88
Staff in these 13 occupations 35.42 22.02 23.78 81.22 609.15
All LHD staff 29.68 18.38 29.43 77.47 581.18 *Reference Group = LHDs with shared governance serving populations between 500,000 and 999,999; n=2

Local Public Health Department Workforce � 49
Appendix Table 3e. Staffing Benchmark Illustration for Shared Governance LHD “X” Serving
Population of 750,000; Scenario 5: LHD “X” Provides Primary Care, Home Health, and
Behavioral Health Services
Occupation Reference
Group*
Median
FTEs per
100,000
Primary
Care
Adjust-
ment
(FTEs per
100,000)
Home
Health
Adjust-
ment
(FTEs per
100,000)
Behavioral
Health
Adjust-
ment
(FTEs per
100,000)
Adjusted
FTEs per
100,000
Benchmark
FTEs
Health service managers/directors 1.20 0.51 0.33 1.97 4.01 30.08
Registered nurses 6.99 3.61 7.84 5.29 23.73 177.98
Physicians 0.11 0.58 0.10 0.11 0.90 6.75
Environmental health (EH) specialists 3.78 2.07 2.52 1.88 10.25 76.88
Other EH scientists/technicians 1.58 0.00 1.23 0.44 3.25 24.38
Epidemiologists 0.52 0.08 0.07 0.29 0.96 7.20
Health educators 0.69 0.00 0.17 0.84 1.70 12.75
Nutritionists 2.20 1.52 0.62 0.21 4.55 34.13
Information systems specialists 0.79 0.76 0.39 0.42 2.36 17.70
Public information specialists 0.16 0.01 0.03 0.04 0.24 1,80
Behavioral health professionals 0.32 0.62 2.14 3.62 6.70 50.25
Emergency prepare. coordinators 0.16 0.03 0.04 0.01 0.24 1.80
Clerical staff 16.92 12.23 8.30 5.00 42.45 318.38
Staff in these 13 occupations 35.42 22.02 23.78 20.12 101.34 760.05
All LHD staff 29.68 18.38 29.43 30.99 108.48 813.60 *Reference Group = LHDs with shared governance serving populations between 500,000 and 999,999; n=2