
LOCAL MARKET TRENDS IMPACTING AFFORDABLE HOUSING Portland-Vancouver Metropolitan Area Jerry Johnson...
22
LOCAL MARKET TRENDS IMPACTING AFFORDABLE HOUSING Portland-Vancouver Metropolitan Area Jerry Johnson Principal Johnson Reid, LLC
-
Upload
clifford-douglas -
Category
Documents
-
view
213 -
download
0
Transcript of LOCAL MARKET TRENDS IMPACTING AFFORDABLE HOUSING Portland-Vancouver Metropolitan Area Jerry Johnson...

LOCAL MARKET TRENDSIMPACTING AFFORDABLE
HOUSING
Portland-Vancouver Metropolitan Area
Jerry Johnson
Principal
Johnson Reid, LLC

THE GREAT RECESSION
-8%
-7%
-6%
-5%
-4%
-3%
-2%
-1%
1%
1 3 5 7 9 11 13 15 17 19 21 23 25 27 29 31 33 35 37 39 41 43 45 47 49 51 53 55 57 59 61 63 65 67 69
PERC
ENTA
GE
CHA
NG
E FR
OM
PEA
K
MONTHS SINCE PEAK
1948-50
1953-55
1957-59
1960-61
1969-71
1974-76
1980
1981-83
1990-93
2001-05
2008-12

CURRENT RECESSION RELATIVE TO SIMILAR FINANCIAL CRISIS
RECESSIONS

EMPLOYED POPULATION RATIOAges 25-54 Years

PART TIME EMPLOYMENT

LONG TERM UNEMPLOYED

UNEMPLOYED SHIFTING TO DISABLED

FAMILY INCOME TRENDS BY QUINTILE
Family Income Down
Net Worth Down 40% from 2007

EMPLOYMENT TRENDS BY SECTORPortland Metro Area – 2001-2011
OLMIS and Johnson Reid
-30%
-20%
-10%
0%
10%
20%
30%
2001 2002 2003 2004 2005 2006 2007 2008 2009 2010 2011
PERCENTAGE EMPLOYMENT CHANGE BY INDUSTRY FROM 2001
Construction
Other Durable Goods Manufacturing
Computer and Electronics
Transportation Equipment
Nondurable Goods Manufacturing
Wholesale Trade
Retail Trade
Transportation, Warehousing, and utilities
Information
Financial Activities
Professional and Business Services
Leisure and Hospitality
Other Services
Government

EMPLOYMENT TRENDS BY SECTORPortland Metro Area – 2001-2011
-3% -3% -2% -2% -1% -1% 0% 1% 1% 2%
Construction
Other Durable Goods Manufacturing
Computer and Electronics
Transportation Equipment
Nondurable Goods Manufacturing
Wholesale Trade
Retail Trade
Transportation, Warehousing, and …
Information
Financial Activities
Professional and Business Services
Leisure and Hospitality
Other Services
Government
(15,
000)
(10,
000)
(5,0
00)
-
5,00
0
10,0
00
15,0
00
Construction
Other Durable Goods Manufacturing
Computer and Electronics
Transportation Equipment
Nondurable Goods Manufacturing
Wholesale Trade
Retail Trade
Transportation, Warehousing, and utilities
Information
Financial Activities
Professional and Business Services
Leisure and Hospitality
Other Services
Government
OLMIS and Johnson Reid

GENERAL MARKET TRENDS• REAL ESTATE MARKETS ARE CYCLICAL, NOT
LINEAR

HOMEOWNERSHIP RATENational Trends

PRICE TO RENT RATIONational Trends

CASE SHILLER HOME PRICE INDEX TRENDS
50
100
150
200
250
1990
1991
1992
1993
1994
1995
1996
1997
1998
1999
2000
2001
2002
2003
2004
2005
2006
2007
2008
2009
2010
20 City Composite
Seattle, WA
Portland, OR

POPULATION GROWTH BY TYPE2000-2010
SOURCE: Oregon Office of Economic Analysis, Washington Office of Financial Management, and JOHNSON REID
SHARE OF 10-YEAR POPULATION GROWTH
0
20,000
40,000
60,000
80,000
100,000
120,000
140,000
Popu
latio
n
Natural Increase
Net Migration
22.4%
24.9%14.5%
38.3%
Clackamas Clark Multnomah Washington

MAJOR DEMOGRAPHIC SHIFTS
• AGING BABY BOOMERS– Less affluent than expected– Lost Equity/Negative Positions
• YOUNG BABY BOOMERS– Changing retirement plans– Kids later, high income demands
• CHILDREN OF BABY BOOMERS– Generation Y, Millennials, Echo
Boom– It’s all about them
1,300,000
170,000
1,500,009
4,100,000
5,400,000
5,000,000
3,500,000
(400,000)
(1,900,000)
(1,500,000)
1,000,000
2,600,000
1,600,000
(200,000)
85+
80-84
75-79
70-74
65-69
60-64
55-59
50-54
45-49
40-44
35-39
30-34
25-29
20-24
PROJECTED POPULATION GROWTH BY AGE / 2010-2020

RESIDENTIAL IMPACTS OF DEMOGRAPHIC SHIFTS
• INCREASED INTEREST IN HIGHLY AMENITIZED LOCATIONS– Willingness to swap space and
price for amenities– Urban amenities with a practical
impact
• VALUE ADDED STRATEGY IN PRIME LOCATIONS– Small units carefully sited– No parking?

RENTAL APARTMENT MARKET TRENDSPortland Metro Area
10-Year Average Annual Supply 2,32110-Year Average Annual Absorption 2,54710-Year Average Annual Rental Increase: 3.6%10-Year Average Annual Vacancy Rate: 4.9%
SOURCE: Johnson Reid
-4%
-2%
0%
2%
4%
6%
8%
10%
-3,000
-2,000
-1,000
0
1,000
2,000
3,000
4,000
5,000
6,000
2002 2003 2004 2005 2006 2007 2008 2009 2010 2011 2012 2013 2014
NEW RENTAL SUPPLY
NET ABSORPTION
VACANCY RATE
RENT ESCALATION
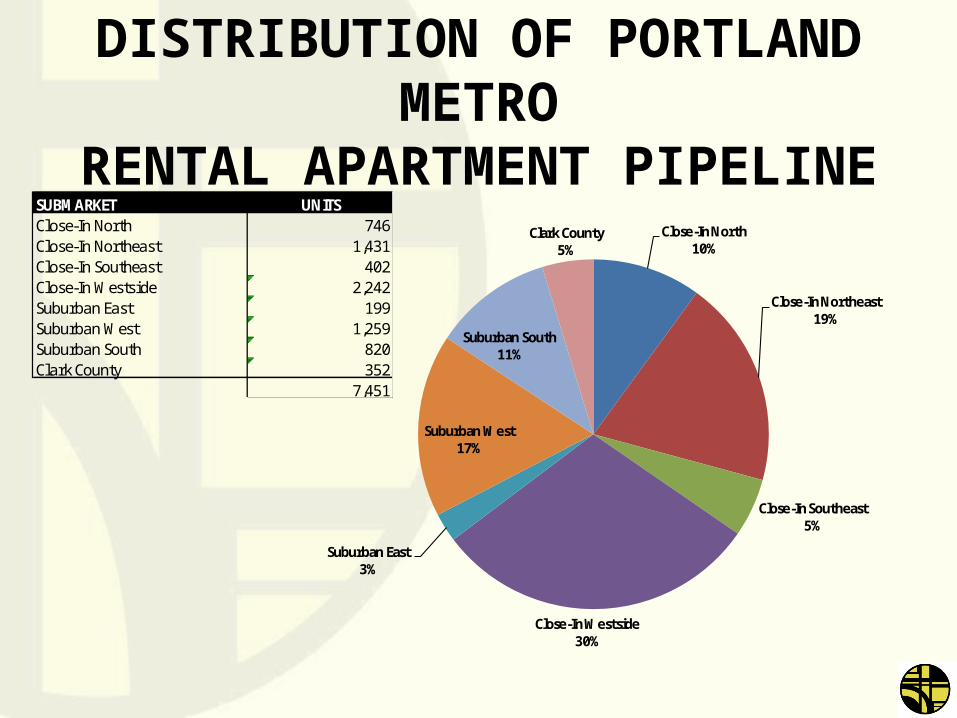
DISTRIBUTION OF PORTLAND METRORENTAL APARTMENT PIPELINE
SUBMARKET UNITSClose-In North 746Close-In Northeast 1,431Close-In Southeast 402Close-In Westside 2,242Suburban East 199Suburban West 1,259Suburban South 820Clark County 352
7,451
Close-In North10%
Close-In Northeast19%
Close-In Southeast5%
Close-In Westside30%
Suburban East3%
Suburban West17%
Suburban South11%
Clark County5%

PIPELINE AS APERCENT OF CURRENT BASE
SOURCE: 2010 Census and Johnson Reid LLC
0% 10% 20% 30% 40%
Close-In North
Close-In Northeast
Close-In Southeast
Close-In Westside
Suburban East
Suburban West
Suburban South
Clark County
EXISTING BASE AND PIPELINEPERCENT OF METRO TOTAL
Existing Base
Pipeline
6.0%
10.6%
1.3%
7.4%
0.2%
1.6%
6.6%
0.7%
0% 5% 10% 15%
Close-In North
Close-In Northeast
Close-In Southeast
Close-In Westside
Suburban East
Suburban West
Suburban South
Clark County
IDENTIFIED PIPELINE AS A PERCENT OF CURRENT RENTER HOUSEHOLD BASE

HOUSING MARKET DYNAMICS• DEMAND INCREASING
– Losses to tenure split ending– Rising rental pricing– Continued low interest rates
• PIPELINE DRY– Very little new construction– Lot supply limited– Pricing must rise to replacement
cost

LOCAL RENTAL APARTMENTS• NO LONGER A CAN’T MISS
MARKET– Production Cycle Well Underway– Attention Needs to be Paid to Pipeline– Infill, Understand Micro Markets– Quality Locations– Urban Amenity Profile– “Sustainable Competitive Position”
• DEATH OF SUBURBS OVERSOLD


![Jeffrey Johnson v Ryan Reid - Supreme Court · Statement of Jeffrey Johnson). [3] The Defendant filed a Defence and in that Defence, it was admitted that there had, on the relevant](https://static.fdocuments.us/doc/165x107/60bcf53a7900a4278700a5d8/jeffrey-johnson-v-ryan-reid-supreme-court-statement-of-jeffrey-johnson-3-the.jpg)