Local Hazard Mitigation Plan v1 - SMUD
128
2018 Local Hazard Mitigation Plan Public Review Draft SUBMITTED BY Sacramento Municipal Utility District 6301 S Street Sacramento, CA 95817
Transcript of Local Hazard Mitigation Plan v1 - SMUD

2018 Local Hazard Mitigation Plan Public Review Draft
SUBMITTED BY
Sacramento Municipal Utility District 6301 S Street
Sacramento, CA 95817

Executive Summary
Natural and human-caused hazards affect the lives of people and its communities, financially, economically, and psychologically. They have the potential to disrupt entire communities. Nationwide, taxpayers pay billions of dollars annually to help communities, organizations, businesses, and individuals recover from disasters.
This Local Hazard Mitigation Plan (LHMP) represents the Sacramento Municipal Utility District’s (SMUD’s) commitment to reduce and eliminate where possible, the potential risks and impacts of natural and human-caused hazards. The LHMP serves to help protect SMUD’s assets, customers, and communities by improving disaster preparedness and increasing resiliency. It also serves as a guide for SMUD decision-makers as they commit resources to reducing the effects of potential hazards on SMUD’s energy infrastructure.
SMUD’s LHMP is a single-jurisdiction plan that geographically covers all areas where SMUD owns assets and operates critical infrastructure (hereinafter referred to as the plan area).
The 2018 LHMP is organized as follow:
Section 1 – Introduction
Section 2 – Local Hazard Mitigation Plan Overview
Section 3 – SMUD Goals and Objectives
Section 4 – SMUD Facilities
Section 5 – Hazard Identification and Analysis
Section 6 – Capability Assessment
Section 7 – Mitigation Strategies
Section 8 – Plan Review and Implementation
Section 9 – Plan Adoption and Maintenance
A draft of this plan will be posted on smud.org for public comments in advance of the October 2, 2018 SMUD Finance and Audit Committee meeting and will be considered for approval by the SMUD Board of Directors within eight weeks of receipt of approval from California Governor’s Office of Emergency Services (Cal OES) and the Federal Emergency Management Agency (FEMA).

i | Local Hazard Mitigation Plan 2018
Table of Contents
Section 1 Introduction ............................................................................... 1
Purpose ................................................................................................................. 1
Background ........................................................................................................... 1
Section 2 Local Hazard Mitigation Plan Overview .................................. 2
Plan Development Process Overview .................................................................... 2
Organize Resources .............................................................................................. 3
2.2.1 Build the Planning Team .................................................................................... 3
2.2.2 Organizational Involvement ................................................................................ 6
2.2.3 Public Involvement ............................................................................................. 2
2.2.3 Regional Participation ........................................................................................ 3
2.2.4 Review and Incorporate Existing SMUD Information/Documents ...................... 4
Assess Risks ......................................................................................................... 7
Develop Mitigation Plan ......................................................................................... 7
Plan Maintenance .................................................................................................. 8
Section 3 SMUD Goals and Objectives .................................................... 8
SMUD Profile ......................................................................................................... 8
The Service Area ................................................................................................... 9
The Electric System ............................................................................................... 9
Purpose and Vision .............................................................................................. 10
Goal and Objectives ............................................................................................ 10
SMUD Capital Projects ........................................................................................ 11
ii | Local Hazard Mitigation Plan 2018
SMUD Priorities ................................................................................................... 11
Section 4 SMUD Facilities ....................................................................... 11
General Facilities ................................................................................................. 11
Power Generation ................................................................................................ 12
4.2.1 Hydroelectric .................................................................................................... 12
4.2.2 Rancho Seco Dam ........................................................................................... 18
4.2.3 Wind Energy ..................................................................................................... 19
4.2.4 Solar Photovoltaic ............................................................................................ 20
4.2.5 Local Gas-Fired Plants ..................................................................................... 20
Transmission ....................................................................................................... 21
Distribution ........................................................................................................... 22
Gas Pipeline ........................................................................................................ 22
Other Interest ....................................................................................................... 23
Section 5 Hazard Identification and Analysis ........................................ 24
Hazard Risk Assessment ..................................................................................... 24
Results and Methodology .................................................................................... 24
Likelihood of Identified Hazards ........................................................................... 25
Fire Hazards ........................................................................................................ 27
5.4.1 Wildfire Hazards ............................................................................................... 27
5.4.2 Urban Structural Fire Hazards .......................................................................... 38
Flood Hazards ..................................................................................................... 41
5.5.1 Riverine, Stream and Alluvial Flood Hazards ................................................... 44
5.5.2 Sea Level Rise, Coastal Flooding, and Erosion Hazards ................................. 44
5.5.3 Tsunami ........................................................................................................... 44

iii | Local Hazard Mitigation Plan 2018
5.5.4 Levee Failure ................................................................................................... 44
5.5.5 Dam Failure ...................................................................................................... 47
Earthquakes and Geological Hazards ................................................................. 52
5.6.1 Fault Rupture ................................................................................................... 52
5.6.2 Subsidence ...................................................................................................... 53
5.6.3 Liquefaction ...................................................................................................... 54
5.6.4 Landslides ........................................................................................................ 54
5.6.5 Volcanoes ........................................................................................................ 63
Threat and Disturbance Hazards ......................................................................... 66
5.7.1 Terrorism .......................................................................................................... 66
5.7.2 Cyber Threats................................................................................................... 68
Climate Change and Meteorological Hazards ..................................................... 70
5.8.1 Air Pollution ...................................................................................................... 73
5.8.2 Avalanches ....................................................................................................... 74
5.8.3 Droughts and Water Shortages ........................................................................ 74
Energy Reliability and Resiliency ......................................................................... 81
Severe Weather and Storms.............................................................................. 82
5.10.1 Extreme Heat ................................................................................................. 83
5.10.2 Freeze ............................................................................................................ 88
5.10.3 Fog ................................................................................................................. 89
5.10.4 Severe Thunderstorms, Hail, and Lighting ..................................................... 89
5.10.5 Winds, Tornadoes, and Hurricanes ................................................................ 90
5.10.6 Tree Mortality ................................................................................................. 95
Technological Hazards ...................................................................................... 97

iv | Local Hazard Mitigation Plan 2018
5.11.1 Hazardous Materials Release ........................................................................ 97
5.11.2 Oil Spills ......................................................................................................... 99
5.11.3 Natural Gas Pipeline Hazards ...................................................................... 100
5.11.4 Nuclear Hazards ........................................................................................... 101
Bird Strike ........................................................................................................ 102
Section 6 Mitigation Strategies ............................................................. 103
Overview of SMUD’s Mitigation Strategies ........................................................ 103
Mitigation Goals and Objectives ........................................................................ 103
6.2.1 Risk Prioritization ............................................................................................ 104
6.2.2 Existing Mitigation Strategies ......................................................................... 104
6.2.3 Mitigation Plan ................................................................................................ 105
Section 7 Plan Review and Implementation ........................................ 106
Reviewing Progress on Mitigation Goals ........................................................... 106
Implementation .................................................................................................. 107
Section 8 Plan Adoption and Maintenance .......................................... 107
Plan Adoption .................................................................................................... 107
Plan Maintenance .............................................................................................. 107
8.2.1 Continued Public Involvement ........................................................................ 108
8.2.2 Plan Maintenance Evaluation Process ........................................................... 108
Incorporation into Existing Business Planning Process ..................................... 108
Section 9 Mitigation Plan Point of Contact .......................................... 109
Section 10 Appendices .......................................................................... 109
v | Local Hazard Mitigation Plan 2018
Appendix A SMUD Board of Directors Adoption Resolution .................................... 109
Appendix B Planning Process Documentation ........................................................ 109
B.1 Planning Committee Meetings Documentation.................................................. 109
B.2 Public Notices and Press Releases ................................................................... 109
Appendix C Mitigation Action Implementation Plans................................................ 110
C.1 Mitigation Action Implementation Plans ............................................................ 110
Appendix D Table of Acronyms ............................................................................... 114

1 | Local Hazard Mitigation Plan 2018
Section 1 Introduction
Purpose The LHMP represents the SMUD’s commitment to reduce the potential risks and impacts of natural and human-caused hazards. The LHMP serves to help protect SMUD’s assets, customers, and communities by improving disaster preparedness and increased resiliency. It also serves as a guide for SMUD decision-makers as they commit resources to reducing the effects of potential hazards on SMUD’s energy infrastructure. The scope of this LHMP is limited to the geographic areas of Sacramento, El Dorado, Solano, Colusa, Yolo, Sutter, Alameda, Contra Costa, Glenn, Modoc, San Joaquin, Shasta, Siskiyou, and Tehama counties where SMUD owns and operates numerous facilities. These facilities include, but are not limited to, dams, powerhouses, transmission lines, distribution lines, roads, wind turbines, and gas pipelines. Each of these facilities is critical to maintaining the flow of power from generating facilities through the transmission lines into Sacramento County. The proper maintenance of these facilities protects the community from dam failure, blackouts, fire and road closures.
SMUD’s resiliency can be improved through the proper identification, analysis, planning, evaluation, mitigation and monitoring of the hazards to which SMUD is most vulnerable. This LHMP provides a framework to conduct such an analysis.
The LHMP is required to be eligible for funding from certain Stafford Act grant programs such as FEMA’s Hazard Mitigation Grant Program (HMGP), the Pre-Disaster Mitigation Assistance (PDM) Program, the Flood Mitigation Assistance (FMA) Program, the Fire Management Assistance Grant (FMAG), and Public Assistance (PA). Mitigation projects and programs identified in the 2018 LHMP may be given priority for funding and technical assistance by State and/or Federal governments.
Background FEMA defines “hazard” as “any event or physical condition that has the potential to cause fatalities, injuries, property damage, infrastructure damage, agricultural losses, damage to the environment, interruption of business, or other types of harm or loss.” Additionally, hazard mitigation is any sustained action taken to reduce or eliminate the long-term risk to human life and property from hazards (44 CFR §201.2). The purpose
of hazard mitigation is to reduce potential losses from future disasters.
Hazard mitigation is most effective when a long-term plan is developed before a disaster occurs. Mitigation plans identify the hazards that impact communities, identify actions to reduce losses from those hazards, and establish a coordinated process to implement the plan. (44 CFR §201.1(b)) A hazard mitigation plan identifies the hazards
2 | Local Hazard Mitigation Plan 2018
a community or region faces, assesses its vulnerability to the hazards, and identifies specific actions that can be taken to reduce the risk from the hazards. The Federal Disaster Mitigation Act of 2000 (Public Law 106-390) (DMA 2000) outlines a process that cities, counties, and special districts can follow to develop a LHMP.
On September 21, 2017, through resolution no. 17-09-09, SMUD’s Board of Directors adopted the El Dorado County LHMP Annex (Annexation Plan). The Annexation Plan focused on SMUD’s assets located in El Dorado County and addressed wildland fire, severe storms, and dam/levee failure hazards.
SMUD is developing this LHMP as a single-jurisdiction plan that geographically covers all areas where SMUD directly owns and/or has an ownership and/or operational share of critical infrastructure. A number of stakeholders, including public and private agencies, participated in the planning process.
In addition to those hazards and assets addressed in the Annexation Plan, this LHMP is expanded to include additional natural and human-caused hazards, assets, and facilities with the intent to meet the requirement of the DMA 2000.
Information in this plan will be used to help guide and coordinate mitigation activities for SMUD. Proactive mitigation planning will help reduce the cost of disaster response and recovery to communities and their residents by protecting critical facilities, reducing liability exposure, and minimizing overall customer and community impacts and disruptions.
Section 2 Local Hazard Mitigation Plan Overview
Plan Development Process Overview SMUD has participated in various El Dorado and Sacramento County LHMP workshops and meetings. The meetings entail providing comments on the respective Multi-Jurisdictional LHMP (MJ-LHMP) work products, including reviewing draft priorities and providing input for reaching consensus on priorities for mitigation.
SMUD staff met in October 2017 to determine the framework and key processes for developing the LHMP. It was determined that the creation of the LHMP would occur in four phases: organize, assess, develop, and maintain (See Figure 1).

3 | Local Hazard Mitigation Plan 2018
Figure 1: Four Phases of Creating the LHMP
Organize Resources This section describes the first step of the LHMP planning process - organize resources. Organizing resources includes building the core planning team, determining the outreach plan, and documenting review.
To create the LHMP, key SMUD representatives first convened in October 2017 as a part of the LHMP grant process, to identify natural and human-caused hazards that could potentially affect SMUD, its customers, and/or communities. Working meetings were held occasionally until the LHMP was completed in October 2018.
2.2.1 Build the Planning Team The Planning Team consisted of a SMUD project team, a Hazard Mitigation Planning Committee (HMPC), Regional Stakeholders, and the public.
•Build the planning team•Determine the planning area and resources•Establish outreach plan
Organize Resources
•Identify/profile hazards•Assess the vulnerabilitiesAssess Risks
•Identify and set goals•Review past/current mitigation measures•Draft an action plan
Develop a Mitigation Strategy
•Adopt the plan•Implement, evaluate, and revise plan
Plan Maintenance
Co
mm
un
icat
e

4 | Local Hazard Mitigation Plan 2018
Project Management Team
The project management team is the core team responsible for ensuring the success of the planning process, its implementation, and future maintenance. Members of the project management team included Enterprise Risk Management (ERM), Treasury, Accounting, and Power Generation. Members of the project management team were also a part of the HMPC.
Hazard Mitigation Planning Committee
The planning meetings accomplished several critical LHMP requirements. The requirements included defining general priorities, reviewing the capabilities of the communities within SMUD’s plan area, compiling and prioritizing hazard mitigation strategies, and determining the appropriate departments for implementing mitigation strategies. Strategies in developing the continuity of public participation in plan maintenance were also established, as well as means of properly documenting all future changes and updates to the LHMP.
The HMPC consisted of key decision makers in specific operational functions across SMUD. The HMPC directly contributed to the discussions and decision-making process. This included
Attending meetings; Collecting and providing requested data; Decision on plan process and content; Development of mitigation actions for the LHMP; Review and comment on plan drafts; Coordination of the public input process
The preparation of the LHMP required a series of meetings intended to facilitate discussion and initiate data collection efforts amongst the business areas. More importantly, the meetings and workshops prompted continuous input and feedback throughout the process. Table 1 below provides a list of the LHMP HMPC members.

5 | Local Hazard Mitigation Plan 2018
Table 1: SMUD Hazard Mitigation Planning Committee Name Position Department
Anna Marie Will Senior Risk Management Analyst Treasury Antoinette Benson Business Continuity Planning
Project ManagerFacilities
Brad Jones Gas Pipeline Assets Manager Power Generation ManagementDan Tallman Rancho Seco Assets Manager Nuclear Operations Fuel Daniel Honeyfield T&D Maintenance Planning
ManagerGrid Planning & Operations
Darold Perry Supervisor, Hydro License Implementation
Power Generation Design
David Hanson Project Development Manager Hydro Power Generation David Soule GIS Supervisor Grid Planning & Operations Dudley McFadden Principal Civil Engineer Hydro Generation Design Eric Brown Vegetation Management Program
ManagerGrid Assets
Eric Hull Regulatory Compliance Program Manager
Legal Counsel
Jeff Briggs Emergency Preparedness Program Manager
Facilities
Jennifer Bird Management Analyst Accounting John Larsen Facilities Manager Facilities Jordan Monier Fire Safety Specialist Environmental Services Jose Bodipo-Memba Environmental Protection Manager Environmental Services Josh Kretchman Information Technology Supervisor Information Technology Joy Mastache Senior Attorney Legal Counsel Kathleen Ave Climate Change Program Manager Research and Development Matt Chapman Vegetation Management Manager Grid Assets Matt Giovananni Senior Engineer Power Generation Design Maureen Vowell Principal Financial Accountant Accounting Michael Meeks Manager, Security Operations Security Operations Michelle Ramos Grid Operations Program Manager Grid Planning & Operations Nathan Bowersox Principal Civil Engineer Power Generation Design Parikshat Pathak Principal Distribution Systems
EngineerGrid Planning & Operations
Robert Grill Critical Infrastructure Protection Program Manager
Information Technology
Ron Lehman Real Estate Real Estate Stephanie Lindsay Assistant Controller Accounting Tim Talbert Maintenance Engineering
SupervisorHydro Generation Management
Toni Hoang Enterprise Risk Manager Treasury
Planning Committee Meetings
The HMPC met throughout the development of the LHMP. Table 2 provides a summary of the meetings conducted throughout the planning process. Meeting documentation and other relevant handouts are provided in Appendix B.

6 | Local Hazard Mitigation Plan 2018
Executive Oversight and Direction
The Enterprise Risk Oversight Committee (EROC) is a committee made up of SMUD Executives, chaired by the Chief Financial Officer, responsible for enterprise wide risk oversight. During the LHMP process, the EROC is responsible for the oversight and direction of the LHMP.
The scope and strategy of the LHMP were reviewed during two regular EROC monthly meetings. The EROC provided its support of, and direction for the development of the LHMP.
Table 2: Meetings Conducted Throughout the Planning Process
Date Meeting Type Topics
February 2018 EROC
Mitigation plan defined Background LHMP planning process Objectives
March 2018 EROC Input on LHMP scope
May 2018 HMPC Meeting #1
Purpose and scope of LHMP Background Project schedule LHMP process Gathering existing documents
July 2018 HMPC Meeting #2 Review facilities list and maps Capabilities assessment Review existing mitigations
August 2018 HMPC Meeting #3 Review new mitigation actions Prioritize mitigation actions
September 2018 Plan Review Meetings
Plan review and refinement Public plan review Board plan review
2.2.2 Organizational Involvement An original draft of the LHMP will be posted online in August 2018. SMUD staff works closely with local jurisdictions and regulatory bodies in which infrastructure critical to SMUD’s operations exist. In August, Toni Hoang, Enterprise Risk Manager, sent an email to related organizations with a link to the plan, requesting for their review and comments (See Table 3).

1 | Local Hazard Mitigation Plan 2018
Table 3: Participating Organizations1 Alameda Community Development
Agency Alameda County Fire Department
Alameda County Medical Center
Alameda General Services Agency
Alameda Public Works Agency
America River Flood Control
Arcade Creek Recreation and Park District
CalFire
Cal OES
California Department of Water Resources
California Department of Water Resources Maintenance Area 9
California Environmental Protection Agency
California State University Sacramento
Carmichael Recreation and Park District
Carmichael Water District
Center Unified School District
City of Citrus Heights
City of Colusa
City of Elk Grove
City of Folsom
City of Galt
City of Placerville
City of Rancho Cordova
City of Sacramento
City of South Lake Tahoe Fire Department
City of Vacaville
Cosumnes Fire
County of Sac Water Resources
County Office of Emergency Services
Courtland Fire Dept
Del Paso Manor Water District
EDCFSC
El Dorado County
El Dorado Irrigation District
1 See Appendix D for acronyms
Elk Grove Police Department Elk Grove Water District
Elverta Joint Unified School District
Fair Oaks Recreation and Park District
Fair Oaks Water District
FFSC
Folsom Fire Department
Fruitridge Vista Water District
Glenn County
Golden State Water
Herald Fire Department
Live Oak
Los Rios School District
Modoc County Office of Emergency Services
Modoc Sheriff
Natomas Water District
NWS
Placer County Office of Emergency Services
Rancho Cordova
Reclamation District #1000
Reclamation District #1002
Reclamation District #1601
Reclamation District #2110
Reclamation District #2111
Reclamation District #3
Reclamation District #317
Reclamation District #341
Reclamation District #349
Reclamation District #369
Reclamation District #407
Reclamation District #551
Reclamation District #554
Reclamation District #563
Reclamation District #744
Reclamation District #755
Reclamation District #800
Reclamation District #9
Regional Water Authority
Roseville Fire
Sacramento County

2 | Local Hazard Mitigation Plan 2018
Sacramento County Airports
Sacramento County Department of Transportation
Sacramento County Department of Waste Management
Sacramento County Department of Water Resources
Sacramento County Sheriff
Sacramento Fire Department
Sacramento Metro Fire
Sacramento Metropolitan Air Quality Management District
Sacramento Police Department
Sacramento Suburban Water District
SAFCA
San Joaquin
Sewer District
Shasta County
SMUD
Solano County
South Lake Tahoe Fire Department
South Placer Fire Department
Southgate Parks and Recreation
State Fire Marshall
Stockton Fire Department
Sutter Buttes Flood Control Agency
Sutter County Emergency Management
Sutter County Fire Department
Sutter County Public Works
Tehama County Public Works
Tehama County Sheriff's Office
Twin Rivers Unified School District
USFS
Vacaville City Fire
Vacaville City Utilities
Vacaville Community Development / City Planning
Valley Vision
Walnut Grove Fire Department
Yolo Fire Department
Yuba City Fire Department
Yuba City Public Works
2.2.3 Public Involvement In addition to the above listed organizations, a draft copy of the LHMP was made available to the public for comment. The public was given opportunity to comment on the draft LHMP.
The draft LHMP was made available on SMUD’s website (www.smud.org) for public review from August 20, 2018 to September 20, 2018. Public comments are addressed in the final LHMP.
SMUD also provided an opportunity for public comments on the draft LHMP at a regularly scheduled Finance and Audit Committee Board Meeting2. Public comments received at the meeting are addressed in the final LHMP.
SMUD Board Committee meetings are open and accessible to the public. Meeting notices and agendas are posted, at minimum, 72 hours in advance at the SMUD office and on SMUD’s website. Those who are unable to attend the meeting in-person are able to livestream the meeting or view a recording on SMUD’s website.
2 The Finance and Audit Committee Board Meeting was held on (October 2, 2018) at 5:30 P.M. at 6301 S Street, Sacramento, CA 95817

3 | Local Hazard Mitigation Plan 2018
2.2.3 Regional Participation SMUD regularly participates in regional and local forums to collaborate on mitigation planning and information sharing. The following are examples of this participation.
California Utilities Emergency Association (CUEA) SMUD is a member of the Board of Director’s for the CUEA. Established in 1952, CUEA is the largest utility emergency association in California.
CUEA is located inside the State Operations Center (SOC) in Mather, California. CEUA serves as the point of contact for critical infrastructure utilities, Cal OES, and
other Governmental Agencies, before, during and after an event to facilitate communications and cooperation between member utilities and public agencies and with non-member utilities.
CEUA provides emergency response support whenever necessary for electric, petroleum pipeline, telecommunications, gas, water and wastewater utilities.
CUEA supports utility emergency planning, mitigation, training, exercises, and education.
Under an established Memorandum of Understanding (MOU), CUEA both staffs and manages the State of California Utility Operations Center (UOC). CUEA is intended to provide support to the state. It serves as an active operational component of the State Operations Center (SOC) and Regional Emergency Operations Centers (REOCs) acting in the capacity of the Utilities Branch within the Operations Section. The SOC and REOC activate under the authority of California Standardized Emergency Management System (SEMS).
Capital Region Climate Readiness Collaborative (CRC) SMUD is the Board Chair of CRC. CRC is a multidisciplinary network of local and regional agencies, organizations,
businesses and associations working together to advance climate mitigation and adaptation efforts in each of their own communities throughout California’s Capital Region (El Dorado, Placer, Sacramento, Sutter, Yolo and Yuba communities).
The goal of the CRC is to assist in the creation of an environment in which stakeholders from across different markets and jurisdiction boundaries can come together for regional cooperation in finding solutions to address shared challenges of drought, extreme heat, extreme weather events, wildfires, and more.
El Dorado County Fire Safe Council (EDCFSC)
SMUD is a member of the Board of Directors for the EDCFSC.

4 | Local Hazard Mitigation Plan 2018
Established in 2001, the mission of EDCFSC is to protect the people of El Dorado County and their property from the effects of catastrophic wildfire with education, cooperation, innovation and action.
Folsom Fire Safe Council (FFSC) SMUD is a member of the FFSC. The FFSC assists in bringing awareness of potential wildland fire impacts to the
Folsom community. Objectives include mobilizing neighborhoods to discuss and share concerns,
providing a forum for homeowners, fire departments, insurance companies and others to discuss and implement incentives to cooperate in measures to reduce fire loss, and creating a group with a common goal to save lives and property.
North American Transmission Forum (NATF) SMUD is a member of NATF and currently leads the vegetation management core
team. NATF members include investor-owned, state-authorized, municipal, cooperative,
U.S. federal and Canadian provincial utilities. NATF members share timely information, including lessons learned, to help improve
the reliability and resiliency of the electric transmission system.
California Public Utility Commission (CPUC) Fire Threat Map
SMUD participated as a member of the Peer Development Panel (PDP). The CPUC initiated a proceeding to develop a statewide map depicting areas of
elevated and extreme fire risk in Californi—the “High Fire Threat District.” A multistep process was used to develop the statewide CPUC High Fire Threat
District, including input from investor owned and publicly owned electric utilities, communications infrastructure providers, public interest groups, and local public safety agencies, California Department of Forestry and Fire Protection (CalFire), and other stakeholder. The map areas were available to the public for review and comment prior to approval. Primary responsibility for the development of the CPUC Fire Threat Map was delegated to PDP, a group of utility fire planning experts, and the Independent Review Team led by CalFire
2.2.4 Review and Incorporate Existing SMUD Information/Documents The LHMP includes a range of recommended action items that, when implemented, could reduce the plan area’s vulnerability to natural hazards. Many of these recommendations are consistent with the goals and objectives of the area’s existing plans and policies. Linking existing plans and policies to the LHMP helps to identify

5 | Local Hazard Mitigation Plan 2018
which resources already exist that can be used to implement the action items identified in the plan. The following accounts for the plans and policies already in place in SMUD’s plan area that were reviewed or incorporated as a part of the LHMP planning process: El Dorado County LHMP Annex Author/Owner: SMUD Description: The Annexation Plan is a supplement to the 2017 El Dorado MJ-LHMP. The purpose of the Annexation Plan is to identify specific hazards and mitigation
strategies associated with the Upper American River Project (UARP) that may minimize the negative effects of such hazards on residents and property in the county, including SMUD’s critical energy infrastructure.
El Dorado County Community Wildfire Protection Plan Author/Owner: El Dorado Country Fire Safe Council Description: The El Dorado County Community Wildfire Protection Plan identifies risks, hazards,
and past strategies for wildfire in the El Dorado County area.
Sacramento County LHMP Author/Owner: Sacramento County Description: SMUD participated along with various other Sacramento region stakeholders in the
development of Sacramento County’s LHMP.
SMUD Business Continuity Plan Author/Owner: SMUD Description: The business continuity plan helps to ensure that SMUD’s business processes can
continue during a time of emergency or disaster. Climate Readiness Assessment and Action Plan Author/Owner: SMUD Description: The Climate Readiness Assessment and Action Plan is a continuation of SMUD’s
existing climate change resiliency research and readiness planning.
6 | Local Hazard Mitigation Plan 2018
The purpose of the Plan is to discuss and provide a map of at risk assets due to climate stressors.
The Plan also provides SMUD’s ongoing action plan to address climate risks, including community engagement, enterprise wide programs, capital investments and operational initiatives.
Dam Failure Emergency Action Plan (EAP) Author/Owner: SMUD Description: The Dam Failure EAP safeguards the lives of citizens and reduces damage to
citizen-owned property that would be impacted by the loss of dams in SMUD’s UARP.
The EAP identifies key roles and responsibilities and describes methods used to identify unusual and unlikely conditions that may endanger the dams in time to take mitigating action.
The Federal Energy Regulatory Commission (FERC) Division of Dam Safety and Inspections requires SMUD to verify that the EAP is current and that audits are conducted periodically. The EAP is reviewed periodically and updated every five years.
EAP Rancho Seco Dam Author/Owner: SMUD Description: The EAP Rancho Seco Dam reduces the risk of human life loss and injury and
minimizes property damage in the event of an actual or potential emergency associated with Rancho Seco Dam. Potential situations include: dam instability, felt earthquakes, extreme storm events, major spillway water releases, overtopping of the dam, outlet system failure, abnormal instrument readings, vandalism or sabotage, spillway gate failures, or failure of the dam.
The plan includes a description of, and facts about, the dam, along with other data that would be helpful during an emergency. This plan is reviewed and updated biennially.
Gas Pipeline Operations (GPO) EAP Author/Owner: SMUD Description:
The GPO EAP addresses the delegation of responsibilities and the necessary procedures for safeguarding life and property while maintaining or restoring service in natural gas emergencies.

7 | Local Hazard Mitigation Plan 2018
The GPO EAP covers situations such as free gas detected in or near a building, fire or explosion near or involving the pipeline facilities, facility failures, insufficient pressure, and natural disasters or civil disturbances actually or potentially involving the pipeline facilities. This plan is reviewed and updated biennially.
GPO Preventative and Mitigative Measures Author/Owner: SMUD Description: The GPO Preventative and Mitigative Measures document describes the process for
developing preventative and mitigative measures employed throughout SMUD’s Gas Pipeline Integrity Management Program.
The intent of preventative and mitigative measures are to minimize the impact of a potential pipeline incident and enhance public safety.
Other Related Plans Specific to Fire Hazards United State Forest Service (USFS), Bureau of Land Management (BLM), CalFire,
and other agency land use and resource management plans that may apply to the area
Fire Management, fire prevention, fire response, and fuel management plans prepared for local agencies
Agency management goals for implementation of fire prevention and response actions
Fire prevention and response plans prepared by other utilities to satisfy their FERC license requirements
Fire behavior literature and scientific publications
Assess Risks In accordance with FEMA requirements, the HMPC identified and prioritized a list of natural and human-caused hazards affecting SMUD, its customers, and communities. The vulnerabilities were assessed and the results aided subsequent identification and proper mitigation actions to reduce risks from hazards in specific locations.
Develop Mitigation Plan The HMPC was involved in developing the mitigation strategy for “high” risk hazards. These mitigations were identified and prioritized based on existing authorities, policies, programs, resources, and SMUD’s ability to expand on and improve upon current mitigations.
This phase included the identification of goals, assessing existing capabilities, reviewing existing and identifying new mitigation actions.

8 | Local Hazard Mitigation Plan 2018
Plan Maintenance This phase of the LHMP encompasses the drafting, review, approval, and adoption and implementation of the LHMP.
Section 3 SMUD Goals and Objectives
SMUD Profile Headquartered in Sacramento, California, SMUD owns and operates an electric system that has provided retail electric service since 1946. SMUD generates, transmits and distributes electricity within a 900-square-mile territory that includes the principal parts of Sacramento County, and a small adjoining portion of Placer County (See Figure 2).
Figure 2: Map of SMUD's Operating Area

9 | Local Hazard Mitigation Plan 2018
SMUD is the nation’s sixth-largest community-owned electric utility, recognized internationally for its innovative energy efficiency programs and use of renewable power technologies. As a municipal utility, SMUD is governed by a seven-member popularly elected Board of Directors that determines policy and appoints the Chief Executive Officer and General Manager who is responsible for SMUD’s overall management and operations.
SMUD owns, operates, and has ownership interests that are critical to maintaining the flow of power from generating facilities through the transmission lines to SMUD’s service area. These assets are located in the geographic areas of Sacramento, El Dorado, Solano, Colusa, Yolo, Sutter, Alameda, Contra Costa, Glenn, Modoc, San Joaquin, Shasta, Siskiyou, and Tehama counties.
The Service Area SMUD is the primary distributor of electric power within an area of approximately 900 square miles in central California. The service area includes the State Capital, Sacramento, the populous areas principally to the northeast and south of the City of Sacramento and the agricultural areas to the north and south.
SMUD’s electric system supplies power to a population of approximately 1.5 million with a total annual retail load of approximately 10,776 million kilowatt hours (kWh) for the year ended December 31, 2017. As the capital of the nation’s most populous state, Sacramento benefits from the historically stabilizing influence of a large government sector. Sacramento is home to the State government headquarters, the Sacramento County seat, the City government and various special districts that combine to make government the largest single employment sector in the Sacramento area. Information technology, transportation, education and health services, leisure and hospitality, and construction serve as the other major sectors of employment and industry in the area.
SMUD’s annual peak load has averaged 3,030 Megawatts (MW) over the last three years, with SMUD’s record peak load of 3,299 MW occurring on July 24, 2006. In 2017, SMUD recorded its second highest peak load of 3,157 MW.
The Electric System SMUD owns and operates a vertically integrated electric system that includes generation, transmission, and distribution facilities.
SMUD supplies power to its bulk power substations through 230 kilovolt (kV) and 115 kV transmission systems. This system transmits power from SMUD’s generation plants, other than Solano Wind, and interconnects with Pacific Gas & Electric (“PG&E”) and the Western Area Power Administration (WAPA). Power is distributed throughout Sacramento County via a 69 kV sub-transmission system with the exception of the
10 | Local Hazard Mitigation Plan 2018
City’s downtown area, which is served from the 115 kV transmission systems. The downtown area is served from 115/12 kV and 115/21 kV substations. The distribution system serving the remainder of SMUD’s service territory is comprised of 69/12 kV and 69 kV substations with overhead and underground distribution circuits.
Purpose and Vision SMUD’s Board of Directors has established the following purpose and vision statements: “SMUD’s purpose is to enhance the quality of life for our customers and community through creative energy solutions. SMUD’s vision is to be the trusted partner with their customers and community, providing innovative solutions to ensure energy affordability and reliability, improve the environment, reduce our region’s carbon footprint, and enhance the vitality of our community.”
Goal and Objectives For more than 70 years, SMUD has provided safe, reliable and affordable electricity, excellent customer service, community value, innovation, and environmental leadership to its customers.
The Board has adopted a set of Strategic Directions (SD) with related metrics, which it considers essential in the continued success of the organization and its service to its customers. These include safety, reliability, competitive rates, ERM, access to credit markets, customer relations, environmental leadership, and resource planning. SMUD’s Board SDs guide in the decisions we make about SMUD’s policies and operations. The Board continually reviews and refines these guidelines to make sure it meets its customer’s energy needs both now and in the future.
Some of the general elements in SMUD’s business strategy are: Safe and reliable energy and environmental protection: Developing and
maintaining a sustainable and reliable power supply to meet peak demand growth consistent with State mandates for renewable energy and reduced carbon emissions
Customer and community services: Working closely with customers to provide the information, tools and incentives to assist them to more efficiently manage energy use, which will contribute to meeting greenhouse gas (“GHG”) emission targets and managing peak demand requirements
• Long term financial stability: Managing price, volumetric and credit risks associated with energy and natural gas procurement and SMUD’s finances to meet funding needs and maintain fair and reasonable energy rates
• Workforce planning & development: Attracting, developing and retaining an inclusive, skilled and engaged workforce that reflects SMUD’s values and is committed to achieving SMUD’s mission

11 | Local Hazard Mitigation Plan 2018
• Operational independence and local control: Retaining local decision making authority and operational independence
• Community and Collaboration: Collaborating regionally to attract new businesses and grow existing business to diversify and strengthen the Sacramento economy.
Long-term infrastructure investment: Maintain and improve SMUD’s infrastructure in a cost effective manner to ensure sustainable delivery of reliable energy and address economic and environmental concerns.
Risk management: Maintain an ERM program designed to act as an early warning system to monitor changes in, and the emergence of, risks that could impact SMUD’s business objectives.
SMUD Capital Projects SMUD’s annual budget provides funding for operations, maintenance, and capital programs necessary to meet the Board’s SDs over the year and lays the foundation to ensure continuity into the future.
SMUD’s 2018 capital investment portfolio includes investments in additions and improvements to SMUD’s property, plants, and equipment. The proposed capital investment budget for 2018 is $519.4M for planned investment in generation, transmission, distribution, buildings, vehicles, technology and other assets critical to meeting the energy needs of our customers. Proposed capital expenditures go through a rigorous evaluation and prioritization process, based on value and risk, to ensure SMUD prioritizes those that have the highest contribution to the Board’s SDs.
SMUD Priorities Multiple risks and hazards have the potential to affect SMUD’s operations. SMUD addresses these risks and hazards as a part of its ongoing ERM Program activities and includes them in the capital investment prioritization process. Historical data indicates that wildfire, storms, floods, and earthquakes account for the greatest losses incurred by SMUD, and should be designated as priority threats. In addition, climate change has the potential to increase the impacts of these hazards as well as others.
Section 4 SMUD Facilities
SMUD owns and operates an integrated electric system that includes generation, transmission, and distribution facilities.
General Facilities The SMUD Downtown Headquarters Campus is located in Sacramento’s East Sacramento Neighborhood, bordered by 59th Street to the west, 65th Street to the east, Folsom Blvd. to the north and S Street to the South; Sacramento Regional Transit District’s Light Rail Line bisects the site. The Headquarters Campus serves as a basis

12 | Local Hazard Mitigation Plan 2018
for daily operations. The total site area is approximately 35 acres. The Headquarters Campus includes the original historic Headquarters building, all parking areas, currently, undeveloped Kramer property, child care center, 59th Street Corporate Yard, Energy Management Center, Customer Services Center and Field Reporting Facility (including Folsom Blvd. frontage property) and all appurtenant structures.
SMUD also operates out of additional general facilities located in and around Sacramento County: East Campus Operating Center, Rancho Seco Switchyard, Hedge Training Facility, and Fresh Pond Facility.
Power Generation SMUD delivers energy to its customers from a variety of sources. The sources include large hydropower, natural-gas-fired generators, renewable energy (solar, wind, small hydro, and biomass), and power it purchases on the wholesale market. The largest single source of power for SMUD is the Cosumnes Power Plant (described below). SMUD’s UARP is its cleanest and most economical power source.
4.2.1 Hydroelectric On August 28, 1957, FERC issued a license to SMUD (FERC No. 2101) for construction of the UARP. SMUD began construction in September 1957, and first produced electricity at the Jaybird Powerhouse on May 1, 1961. The UARP now includes reservoirs and dams.
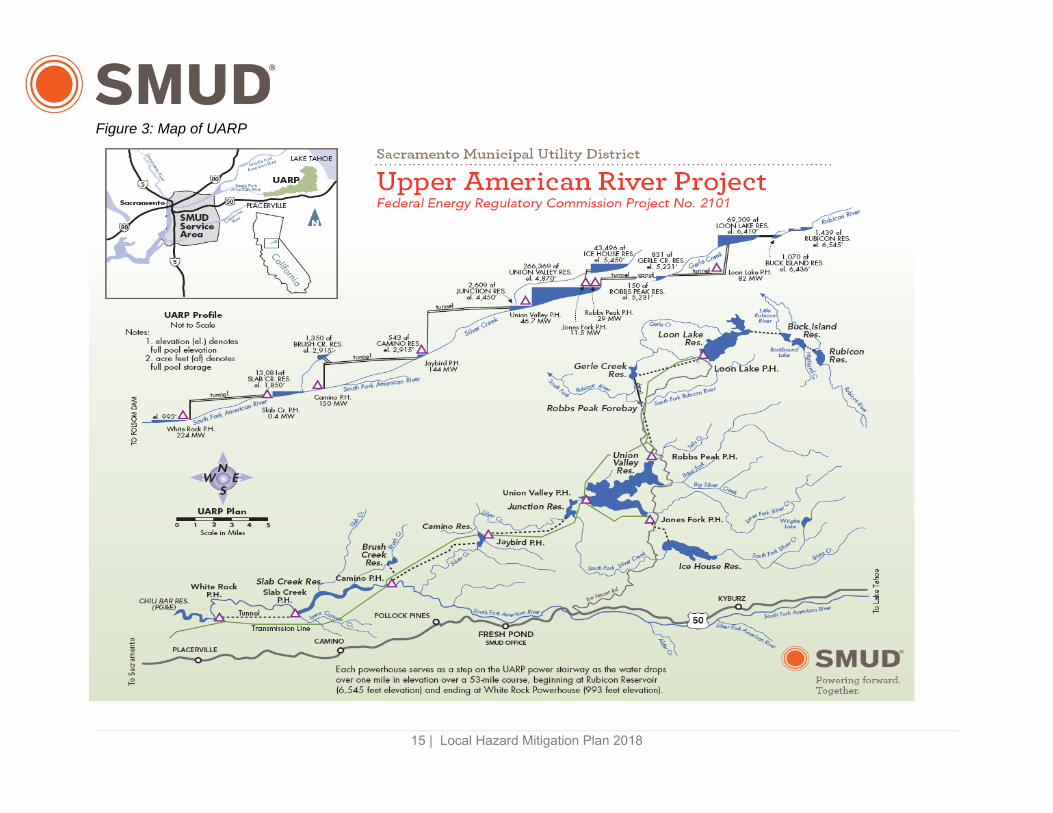
The UARP diverts and regulates water in portions of the Rubicon River, Silver Creek and South Fork American River watersheds. The general linear alignment of powerhouses has led to the name "Stairway of Power," referring to the multiple steps of power generation, that combined, constitute a one-mile drop in elevation over 53 miles of river (see figure 3). The project also includes about 180 circuit miles of transmission lines that transport electricity from the project powerhouses into Sacramento County. With a total installed capacity of 688 MW, and a total gross reservoir storage capacity of over 400,000 acre-feet, the UARP typically enables SMUD to store water during winter and spring months, then generate electricity during summer and other months when demand and/or wholesale market prices are at their highest levels and natural flows are low. Operating in this manner, the UARP provides about 20 percent of SMUD's customer demand during peak load hours. In a typical year, the UARP produces approximately 1.8 billion kWh of electricity, enough energy to power 180,000 households. The UARP’s three large storage reservoirs (Union Valley, Loon Lake and Ice House) have an aggregate water storage capacity of approximately 400,000 acre-feet. The UARP facilities also include eight tunnels with a combined length of over 26 miles and

13 | Local Hazard Mitigation Plan 2018
eight powerhouses containing 11 turbines. In addition to providing clean hydroelectric power and operating flexibility for SMUD, the UARP area provides habitat for fish and wildlife and a variety of recreational opportunities, including camping, fishing, boating, hiking, horseback riding, mountain biking and cross-country skiing, 47 developed recreation sites include campgrounds, day use facilities, boat launches, trails and a scenic overlook. Many of these developed recreation sites, as well as dispersed recreation areas within or immediately adjacent to the Project Boundary facilities, are accessed via one lane rural roads.
The SMUD electrical transmission network connects the UARP with a junction facility in the City of Folsom. The combined capacity of the UARP is approximately 673 MW at SMUD’s load center in Sacramento. Under current licensing and mean water conditions, these facilities are expected to generate approximately 1,600 Gigawatt hours (GWh) of electric energy annually, which represents approximately 15 percent of SMUD’s current average annual retail energy requirements.
Rubicon and Buck Island Reservoirs
The most upstream watershed is the (Upper) Rubicon River; at elevations, ranging between 6,500 and 10,000 feet (ft.) Water is diverted from the Rubicon River at the Rubicon Diversion via the Rubicon-Rockbound Tunnel to Rockbound Lake and Buck Island Lake on a tributary of the Rubicon River. Water is conveyed from Buck Island Lake to Loon Lake Reservoir through Buck-Loon Tunnel with a maximum capacity of approximately 1,200 (cubic feet per second) cfs.
The Rubicon Reservoir is made of two structures. One is a 36 ft.-high by 644 ft.-long concrete gravity main diversion dam located on the Rubicon River. The second is a concrete gravity auxiliary dam that is 29 ft.-high by 553 ft.-long. Rockbound Tunnel is a 0.2 mile-long, 13 ft.-diameter unlined horseshoe tunnel that diverts water from Rubicon Reservoir to Buck Island Reservoir via Rockbound Lake (a non-project facility) located on Highland Creek. Buck Island Reservoir is made up of two structures, a concrete gravity diversion dam located on the South Fork Rubicon River that is 23 ft.-high by 293 ft.-long, and a 15 ft.-high by 244 ft.-long concrete gravity auxiliary dam.
Gerle Dam
Gerle Creek Reservoir tributary area is 23.35 square miles in addition to the tributary area of the Loon Lake Reservoir, making a total of 31.45 square miles. Reservoir surface area is approximately 60 ac at the maximum capacity of 831 acre feet (ac-ft.) An ungated overflow spillway structure discharges directly over the 58 ft. high concrete gravity dam into Gerle Creek. The major portion of inflow to Gerle Creek Reservoir, including Loon Lake Powerhouse releases, is diverted into Gerle Canal through a

14 | Local Hazard Mitigation Plan 2018
control structure consisting of two 6.5 ft. wide by 10 ft. high slide gates. The canal is 9,950 ft. long and can convey up to 1,100 cfs. The canal was built above the left bank of Gerle Creek and conveys water to the South Fork Rubicon River at Robbs Peak Reservoir.
15 | Local Hazard Mitigation Plan 2018
Figure 3: Map of UARP

16 | Local Hazard Mitigation Plan 2018
Robbs Peak Dam
Robbs Peak Dam and Tunnel portal are located on South Fork Rubicon River, diverting South Fork flows and water from Gerle Canal. Robbs Peak Reservoir is commonly known as Robbs Forebay. All flow diverted from the Rubicon River basin, which is in the Middle Fork American River drainage, passes through the Robbs Peak Tunnel to the Robbs Peak Powerhouse and into the Union Valley Reservoir in the Silver Creek drainage, which is tributary to the South Fork American River. Capacity of Robbs Peak Powerhouse is approximately 1,250 cfs when Union Valley Reservoir and Robbs Forebay are both at spillway elevation. Average annual diversion from Rubicon River basin into Silver Creek Basin is approximately 172,700 ac-ft.
Loon Lake Main and Auxiliary Dams
Loon Lake watershed has a total direct area of 8.1 square miles (not including Buck-Loon Diversion), of which 1,450 ac, or about 29 percent, is lake-surface when the reservoir is full. The reservoir is formed by a 108 ft. high earth core and rock fill dam on Gerle Creek, a major auxiliary dam, and a dike of similar construction, all of which impound 69,309 ac-ft. There is an ungated overflow spillway on the north end of the dam that discharges into an unlined channel, which flows into Gerle Creek. The major release is through the Loon Lake Powerhouse, an underground facility that discharges into a tunnel leading into Gerle Reservoir on Gerle Creek downstream from Loon Lake. Maximum powerhouse capacity is approximately 1,000 cfs.
Union Valley
Union Valley Reservoir, SMUD’s largest storage reservoir, is located on Silver Creek, with a tributary area of 84.5 square miles. The reservoir is formed by a 0.3 miles-long and 427 ft.-high earth fill dam with rock facing. Reservoir capacity is 266,369 ac-ft. with a reservoir surface area of 2,860 ac at spillway elevation. The spillway is controlled by two radial gates, 15.0 ft.-high by 42.5 ft.-wide, which discharge into concrete lined spillway channel or chute, which returns to Silver Creek below Union Valley Powerhouse. Gates are locked open during the winter flood season. The dam, spillway, and gates have been altered since original construction of the reservoir to increase spillway capacity. Alterations at Union Valley were made in 1971. Union Valley Powerhouse, located immediately below the dam, has a maximum discharge capacity of 1,577 cfs when both Union Valley and Junction Reservoir are near spillway elevation.
Ice House Main Dam and Dikes
Ice House Reservoir is located on the South Fork of Silver Creek, with a tributary area of approximately 27.2 square miles. The reservoir, with a maximum capacity of 43,496 ac-ft. and surface area of 678 ac, is formed by an earth core, rock fill dam 154 ft.-high

17 | Local Hazard Mitigation Plan 2018
on the South Fork of the Silver Creek near the small resort and historical site of Ice House. The spillway of the main dam is located on the left abutment, and is controlled by two radial gates, 14.0 ft. high by 40 ft. wide. The gates are locked open during the winter season. Stream flow maintenance releases and spills from Ice House Reservoir are made to South Fork Silver Creek and flow downstream to Junction Reservoir. In addition to the main dam, there are two rock fill and earthen dikes on the reservoir’s northern shore adjacent to Northwind and Strawberry Point Campgrounds. The drainage downstream of these dikes is tributary to the Jones Fork Silver Creek, which drains into Union Valley Reservoir. Ice House Reservoir diverts water from the South Fork Silver Creek to Jones Fork Powerhouse, located on the shore of Union Valley Reservoir. Jones Fork Powerhouse has a maximum discharge capacity of approximately 300 cfs.
Junction Dam
Junction Dam and Reservoir have been constructed below the confluence of the Silver Creek and South Fork Silver Creek. The reservoir is utilized as the forebay to Jaybird Powerhouse. The tributary area is approximately 31.4 square miles, which in addition to the tributary areas of Union Valley and Ice House Reservoirs totals 143 square miles. Junction Dam is a concrete arch, 168 ft.-high and 525 ft.-long. Reservoir capacity is approximately 2,609 ac-ft. The spillway is an ungated over-pour structure on the dam that discharges directly into Silver Creek. The major diversion from Junction Reservoir is the tunnel to Jaybird Powerhouse, with a maximum discharge capacity of about 1,345 cfs.
Camino Dam
Camino Reservoir, also known as Camino Forebay, is located immediately below Jaybird Powerhouse. Camino Dam is a concrete double curvature arch dam, 110 ft.-high and 470 ft.-long. It is located on Silver Creek and has three integral bulkhead gates. The reservoir capacity is 543 ac-ft. Flow is diverted by tunnel from the forebay to Camino Powerhouse, discharging almost directly into Slab Creek Reservoir on the South Fork American River. The tunnel to Camino Powerhouse intercepts flows from Brush Creek, a tributary to the South Fork American River. The major portion of Silver Creek flows, including diversions from Rubicon River, pass through Camino Powerhouse.
Brush Creek Dam
Brush Creek Dam and Reservoir are located on Brush Creek, a small tributary of the South Fork American River, which discharges directly into Slab Creek Reservoir. Brush Creek Reservoir has a tributary area of about 8 square miles. The dam is a concrete variable radius arch, 213 ft.-high and 780 ft.-long. It forms a reservoir of 1,350 ac-ft. with

18 | Local Hazard Mitigation Plan 2018
a surface area of 20 ac at maximum operating pool. The dam has a central over pour spillway. Brush Creek Reservoir is located on an extension of Camino Tunnel, which feeds Camino Powerhouse. The elevations of Camino Dam and Brush Creek Dam are approximately the same. Water drawn by Camino Powerhouse may come from either reservoir. Brush Creek Reservoir not only provides for utilization of water from Brush Creek watershed, but also acts as off-stream storage for water for Camino Powerhouse.
Slab Creek Dam
Slab Creek Reservoir is the most downstream impoundment of the project. Slab Creek Reservoir, on the South Fork American River below Camino Powerhouse, acts as a forebay to the lowest SMUD powerhouse, White Rock. Maximum hydraulic capacity of the White Rock Powerhouse is approximately 4,000 cfs. The tributary area of Slab Creek Reservoir is 509 square miles with approximately 366 square miles of incremental area entering the system below Junction Reservoir. The reservoir is formed by a variable radius concrete arch dam 250 ft.-high with a crest length of 817 ft. Total capacity is 13,081 ac-ft. with a surface area of only 280 ac. The reservoir is about 4.75 miles long and is very narrow, making it more of a conveyance than storage at extremely high inflows. Stream releases to the river are made through a small powerhouse below the dam. The spillway is an ungated over-pour type structure on the dam with a length of 450 ft. Downstream from Slab Creek Reservoir is the Chili Bar Dam and Reservoir, built concurrently with the UARP, but owned and operated by the Pacific Gas and Electric Company (PG&E). Chili Bar Reservoir is the after bay for SMUD’s White Rock Powerhouse. The dam is a concrete gravity structure approximately 111 ft.-high with a crest length of 380 ft. and a storage capacity of 3,140 ac-ft. The surface area is 124 ac. This is the last dam on the South Fork American River before it enters Folsom Lake approximately 20 miles below Chili Bar.
4.2.2 Rancho Seco Dam The Rancho Seco Dam was built in 1970. The spillway discharges near the base of the dam; the dam outlet normally releases to a tributary of Hadselville Creek approximately 7,000 ft. from the dam. Floodwater from a dam failure would pass westward toward Sacramento River without affecting the nearby Cosumnes Power Plant and the decommissioned Rancho Seco Nuclear Generating Station.
Rancho Seco Lake is an off-stream reservoir, filled using water pumped from the Sacramento and American Rivers via the Folsom South Canal. Rainfall runoff from the 1,240-acre catchment area upstream from the dam contributes little water.

19 | Local Hazard Mitigation Plan 2018
Figure 4: Rancho Seco Dam
4.2.3 Wind Energy Solano Wind Project
SMUD owns and operates a 230 MW wind project, located in Solano County, known as The Solano Wind Project. The project consists of 107 wind turbine generators (WTG) spanning five miles southwest of Rio Vista. Energy from the project’s Phases 1 and 2 are collected at 21 kV and transmitted over a dedicated 3-mile overhead and underground system to Russell substation (See Figure 5). At Russell substation, the energy is stepped up to 230 kV and interconnected to PG&E’s Birds Landing Switching Station.
In 2011 and 2012, SMUD constructed an additional 128 MW wind project adjacent to Solano Phases 1 and 2, known as Solano 3. The Solano 3 project consists of 55 WTGs collected at 35 kV and transmitted over a dedicated overhead and underground system to Russell substation (See Figure 5).

20 | Local Hazard Mitigation Plan 2018
Figure 5: Solano Wind Project
4.2.4Solar Photovoltaic SMUD owns and operates approximately three MW of solar photovoltaic generating facilities. These facilities include installations at the Hedge Substation property, the Customer Service Center, the East Campus Operations Center, and other smaller photovoltaic systems throughout the service area on parking lots.
4.2.5 Local Gas-Fired Plants SMUD owns five local natural gas-fired plants in its service area: the CVFA Project, the SCA Project, the SPA Project, SPA McClellan and the SFA Project (each defined below). These five plants are referred to collectively as the “Local Gas-Fired Plants.” These plants are a strategic component of SMUD’s resource mix. In addition to providing SMUD a total capacity of approximately 1,012 MW, the Local Gas-Fired Plants provide SMUD with needed voltage support, operational and load following capability, and the reliability inherent in having power resources located close to loads. The following is a brief description of the five Local Gas-Fired Plants:

21 | Local Hazard Mitigation Plan 2018
The Cosumnes Power Plant (the “SFA Project”)
The SFA Project is a 495 MW natural gas-fired, combined cycle plant located in the southern portion of Sacramento County. It is adjacent to SMUD’s decommissioned Rancho Seco Nuclear Power Plant.
The CVFA Carson Cogeneration Project (the “CVFA Project”)
The CVFA Project, a 103 MW natural-gas-fired cogeneration project consisting of separate combined cycle and peaking plants, provides steam to the Sacramento Regional County Sanitation District (“SRCSD”) wastewater treatment plant adjacent to the site.
The SCA Procter & Gamble Cogeneration Project (the “SCA Project”).
The SCA Project, a 182 MW natural gas-fired cogeneration facility, is located in an established industrial area of Sacramento. The SCA Project produces steam for use in Procter & Gamble Manufacturing Company’s oleo chemical manufacturing processes and electricity for sale to SMUD.
The SPA Campbell Soup Cogeneration Project (the “SPA Project”)
The SPA Project, a 160 MW natural gas-fired cogeneration project, was completed and began commercial operations on December 4, 1997. Upgrades were implemented in 2000 that increased the plant’s peaking capacity to 180 MW, well above its net demonstrated capacity of 159.8 MW. The plant is located in South Sacramento, adjacent to the Capital Commerce Center (formerly the Campbell Soup Company food processing facility).
The SPA McClellan Gas Turbine (“SPA McClellan”)
SPA McClellan is a 72 MW natural gas-fired simple cycle combustion turbine generating plant at McClellan Business Park in Sacramento. The turbine is connected to SMUD’s electric system and is operated to meet SMUD’s peak-load requirements. SPA McClellan is aligned for remote starting and operation with both black start and fast start capabilities. SMUD constructed the McClellan unit in 1986 as a 50 MW emergency power source for the McClellan Air Force Base. In 2001, following the Air Force Base closure, McClellan was upgraded to 72 MW and converted for SMUD use.
Transmission The transmission system carries electricity from generation to the distribution system over long distances at high voltages. SMUD supplies power to its bulk power substations through a 230 kV and 115 kV transmission systems. This system transmits power from SMUD’s generation plants, other than Solano Wind Project, and interconnects with PG&E and the WAPA. Power is distributed throughout Sacramento

22 | Local Hazard Mitigation Plan 2018
County via a 69 kV sub-transmission system with the exception of the City’s downtown area, which is served from the 115 kV transmission systems. The downtown area is served from 115/12 kV and 115/21 kV substations.
Distribution Distribution systems move power from transmission to end use customers. The distribution assets consist of thousands of unique parts that are customary and usual for the operation of electric distribution systems. The distribution system serving the remainder of SMUD’s service territory is comprised of 69/12 kV and 69/4 kV substations with overhead and undergrounds distribution circuits. A list of some key distribution assets can be found in table 4 below.
Gas Pipeline SMUD has an equity interest in two PG&E backbone gas transmission lines and contracts with existing interstate natural gas transmission lines to satisfy its obligation to deliver natural gas to its power plants.
SMUD’s diversified portfolio of gas transmission arrangements allow for the purchase of gas from a variety of suppliers and locations, and the opportunity to capitalize on regional price differentials where possible. SMUD’s ownership interest in the SMUD/PG&E backbone and Local Pipeline enhances the reliability of SMUD’s gas supply.
The Local Pipeline
SMUD constructed and owns a 20 inch (in.), 50-mile natural gas pipeline in the greater Sacramento area (the “Local Pipeline”) that transports gas to all of the Local Gas-Fired Plants except SPA McClellan (See Figure 6). The Local Pipeline is interconnected with PG&E’s major California gas transmission lines 400 and 401. Additionally, it may be interconnected with one or more private gas gathering pipelines located in the area, and/or other FERC approved pipelines that may be built in the local area. In conjunction with the construction of the SFA Project, SMUD extended the Local Pipeline to the plant site. The 26-mile extension was completed in 2004. The extension is 24 in. in diameter and was designed to serve both the SFA Project and an additional second phase, if constructed.

23 | Local Hazard Mitigation Plan 2018
Figure 6: SMUD Local Pipeline
PG&E Backbone Gas Transmission Lines 300 and 401
In 1996, SMUD purchased an equity interest in PG&E’s backbone gas transmission lines 300 and 401 (referred to as the PG&E backbone). The total capacity acquired was approximately 85,000 Dth/day. It consisted of approximately 43,600 Dth/day of firm gas transport from the California–Oregon border at Malin, Oregon and 44,700 Dth/day from the California–Arizona border at Topock, Arizona, to SMUD’s interconnection with the PG&E backbone near Winters, California. SMUD is also entitled to a share of non-firm capacity, which is approximately 4,360 Dths/day, making the total capacity potentially available to SMUD almost 90,000 Dths/day. This purchase made SMUD a co-owner of the PG&E backbone gas transmission lines 300 and 401. It obligated SMUD to pay PG&E to operate the pipelines on its behalf, subject to the terms of the purchase agreement and operating protocols.
Other Interest Gas Storage
SMUD also employs gas storage as part of its overall fuel supply strategy. Gas storage is useful in helping to balance gas supply, mitigate market price volatility, and provide a reliable supply to meet peak day delivery requirements.

24 | Local Hazard Mitigation Plan 2018
TANC California-Oregon Transmission Project
The California-Oregon Transmission Project (COTP) is one part of a three part 500 kV-line coordinated system known as the California-Oregon Intertie or (COI). The COTP is allocated one-third of the 4,800 MW capability of the COI system. SMUD is a member of the Transmission Agency of Northern California (TANC) and is entitled to 378 MW of the COTP capacity. As of December 31, 2016, SMUD was entitled to approximately 528 MW of TANC’s transfer capability. SMUD relies on its COTP rights to purchase power and obtain renewable resources to supplement its own resources to serve its load.
Other
In addition to those assets listed in section 4, there are other assets, equipment, and appurtenances usual and customary for electric utility operations that are included in the scope of this LHMP.
Section 5 Hazard Identification and Analysis
Hazard Risk Assessment Hazard risk assessment is the process of measuring the potential impact to life or property, as well as economic impacts, resulting from the hazard. Its intent is to identify from available data, the vulnerabilities of a community. The results provide a foundation on which to develop and prioritize mitigation actions to reduce damage from hazards by improving preparedness and response times and allocating resources to areas with the greatest vulnerability.
Results and Methodology SMUD maintains an ERM program which provides a framework and repeatable and consistent methodologies to identify, assess, manage, plan and respond to risks and hazards to which SMUD is most vulnerable. The ERM program methodology takes into consideration impacts to six different areas (financial, legal, regulatory and compliance, workforce, reputation, operations and strategy), as well as the likelihood and velocity of the risk occurrence.

25 | Local Hazard Mitigation Plan 2018
Implementing this framework and methodology, SMUD has identified the following list of hazards that will be addressed in this LHMP.
Fire Hazards • Wildland fire hazards • Urban structural fire hazards Flood Hazards • Riverine, stream and alluvial flood
hazards • Sea level rise, coastal flooding and
erosion hazards • Tsunami and seiche hazards • Levee failure and safety • Dam failure and safety Earthquakes and Geological Hazards • Earthquake hazards • Landslides and other earth
movements • Volcanoes Threat and Disturbance Hazards • Terrorism • Cyber threats
Climate Change and Weather-Influenced Hazards • Air pollution • Avalanches • Droughts and water shortages • Energy shortage and energy
resiliency • Extreme heat • Freeze • Severe weather and storms • Tree mortality Technological Hazards • Hazardous materials release • Oil spills • Natural gas pipeline hazards • Nuclear hazards • Bird strike
Likelihood of Identified Hazards SMUD has reviewed the hazards identified and ranked the hazards based on past disasters and expected future impacts. Table 5 below provides a summary of the probability of the identified hazards.

26 | Local Hazard Mitigation Plan 2018
Table 4: Likelihood of Hazards in SMUD Plan Area
Identified Hazards Remote1 Unlikely2 Possible3 Likely4 Highly Likely5
Wildland fire hazards xUrban structural fire hazards xRiverine, stream and alluvial flood hazards
x
Sea level rise, coastal flooding and erosion hazards
x
Tsunami and seiche hazards x Levee failure and safety x Dam failure and safety x Earthquake hazards x Landslides and other earth movements
x
Volcanoes x Terrorism x Cyber threats xAir pollution xAvalanches x Droughts and water shortages x Energy shortage and energy resiliency
x
Extreme heat xFreeze x Severe weather and storms xTree mortality xHazardous materials release x Oil spills x Natural gas pipeline hazards x Nuclear hazards x Bird strike xNotes:
1. Remote chance with 0-5% probability of occurrence. 2. Extremely rare with no documented history of occurrence or events. 6-20%
probability of occurrence. Annual probability is less than 1 in 1,000 years. 3. Rare occurrences with 21-50% probability of occurrence. Annual probability of
between 1 in 100 years and 1 in 1,000 years. 4. Occasional occurrences with 51-80% probability of occurrence. Annual probability
of between 1 in 10 years and 1 in 100 years. 5. Frequent events with a well-document history of occurrence. Annual probability of
greater than 1 every year. 81-100% probability of occurrence.

27 | Local Hazard Mitigation Plan 2018
Fire Hazards
5.4.1 Wildfire Hazards A wildland fire is an uncontrolled fire in a natural setting that is associated with combustible vegetation, and/or fuel. The State Board of Forestry and Fire Protection 2010 Strategic Fire Plan defines a wildfire event as an unwanted wildland fire including unauthorized human-caused fires, escaped wildfire use events, escaped prescribed wildfire projects, and all other wildfires. Conditions in which wildfires are prevalent include those of high temperatures, low moisture content in the air, increased fuel accumulation, and high winds.
Climate change has the potential to exacerbate conditions ripe for wildfire. Jason Funk, senior climate scientist with the Union of Concerned Scientists (UCS) says that “there is very well documented scientific evidence that climate change is increasing the length of the fire season, the size of the area burned each year and the number of wildfires3.” The severity of wildland fires is generally a function of the condition of the combustible vegetation material involved, terrain or setting, and weather conditions. Tree stress and mortality, including damage due to insect infestations such as the bark beetle exacerbate fire hazards.
Fire season extends from early spring through the late fall, due to the dry and hot nature of these months in SMUD’s geographic region. If a fire occurs along an urban or rural interface, there is a high potential to destroy structures, cause damage to critical infrastructure, injure people, and could result in the loss of life.
According to CalFire’s website, the five-year average between January - July time period is 2,507 fires and 23,989 acres burned. In 2017, the state endured 7,117 fires covering 505,956 acres. For the periods from January 1, 2018 to July 1, 2018, California endured 2,626 fires spanning 53,024 acres.4 This number continues to grow. These numbers are almost twice the five-year averages. There are a multitude of factors contributing to the increased quantity and size of wildfires plaguing the state. These factors include increased fuel loading, an increase in human-caused ignition capabilities, increased winds, climate change which is influencing drought, longer, hotter stretches of weather and increased tree mortality. Steep slopes also contribute to fire hazards by intensifying the effects of wind and making fire suppression difficult.
3 Brandlin, Anne-Sophie, How Climate Change is Increasing Forest Fires Around the World. https://www.dw.com/en/how-climate-change-is-increasing-forest-fires-around-the-world/a-19465490 4 Source: CalFire

28 | Local Hazard Mitigation Plan 2018
Recognizing this trend, the CPUC adopted a new statewide fire map depicting the highest fire threat areas in California. Figure 6 below depicts the CPUC’s High Fire Threat District, developed through a public collaborative process involving several levels of peer and expert review (including CalFire). SMUD actively participated in the peer review process. This map shows areas of extreme vulnerability in red and areas of elevated vulnerability in yellow, designated as Tiers 3 and 2 respectively. For each Tier, there are a set of electric facility construction and maintenance activities that the CPUC requires investor owned utilities (IOU) to meet. SMUD is a publicly owned utility, therefore, it is not regulated by the CPUC. However, SMUD either meets or exceeds the CPUC requirements.
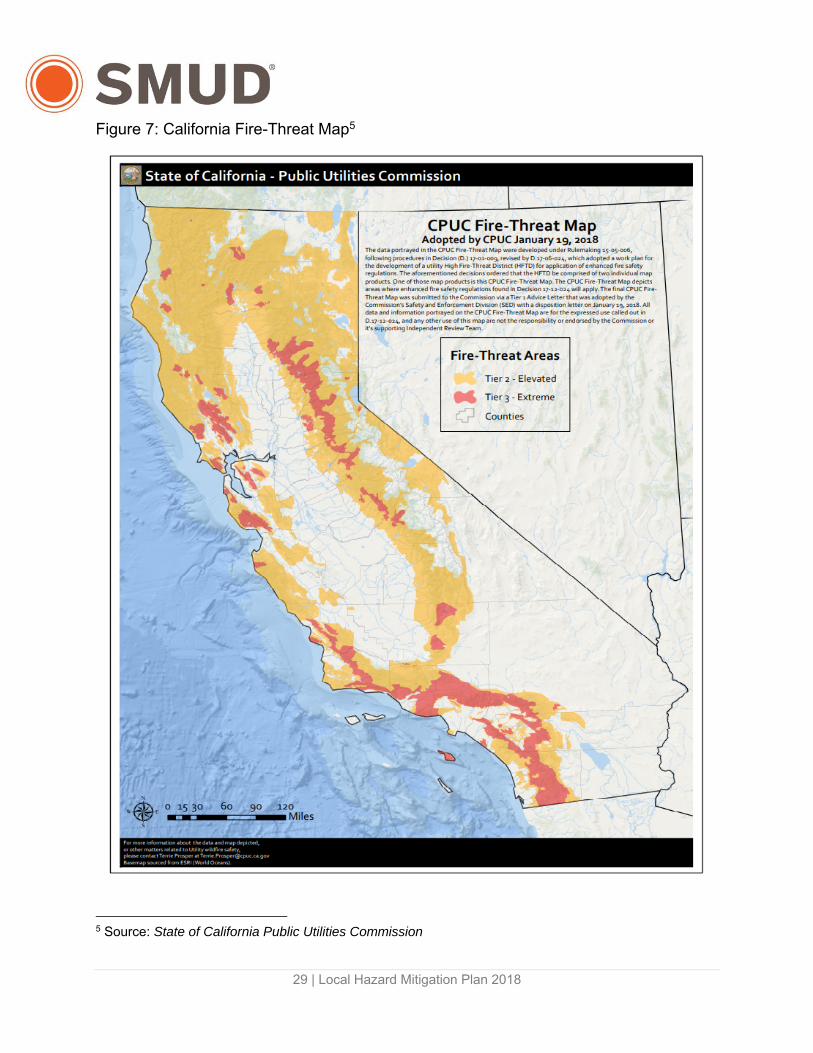
29 | Local Hazard Mitigation Plan 2018
Figure 7: California Fire-Threat Map5
5 Source: State of California Public Utilities Commission

30 | Local Hazard Mitigation Plan 2018
Assessment of Vulnerability and Potential Loss
SMUD’s plan area has a high susceptibility to wildfires specifically due to the Mediterranean climate that facilitates regular drought conditions, the natural plant communities that produce excess fuel, and the natural and anthropogenic ignition sources. In SMUD’s plan area, the most vulnerable area to wildland fire is the UARP. Within the UARP, vegetation adjacent to electrical infrastructure (powerhouses, transmission lines, switchyards, etc.) is a major source of fuel. Extended periods of warm temperatures could increase the possibility of wildfires occurring in SMUD’s generation and service territories. Greater numbers of diseased and dead trees also increase this possibility. Figure 8 below shows the area of the CPUC Fire Threat Map specific to SMUD’s UARP.
SMUD imports a large portion of the energy needed to serve its customers from out of its service area over Western Area Power Authority transmission lines. These lines traverse many areas susceptible to wildfires. Actual destruction of such lines does happen but this is not the most common threat. When a fire threatens long distance transmission lines, grid operators will derate the line. This means that less than the scheduled amount of power will be allowed to be carried by the line. This is done to reduce the amount of power which would be suddenly lost if the line were to be damaged. During heavy load periods, SMUD may not be able to obtain enough power from other sources to make up for the power lost from the derated line.

31 | Local Hazard Mitigation Plan 2018
Figure 8: UARP Facilities in the CPUC designated High Fire Threat District

32 | Local Hazard Mitigation Plan 2018
In addition to the UARP, open lands where SMUD’s assets lie also pose a risk related to grass fires. Grass fires can travel very fast and threaten nearby residential areas as well as critical infrastructure.
Large fires have been a part of the landscape history of the State of California, specifically, El Dorado County for centuries. Table 6 lists the most significant fires that have occurred near the plan area.
It is known from 1900, and earlier, that large fires occurred in this part of the Sierra Nevada Mountains, and frequent fire return intervals (2-20 years in lower montane zone areas around Camino, Placerville and Pollock Pines). Foothill regions of such as where the UARP is located burn frequently with mixed severity.
The most notable recent wildfires are the King Fire in 2014, the Freds Fire in 2004, and the Cleveland Fire in 1992. Historically, areas above 5,000 feet were less likely to see a major fire (between Robbs Peak and Loon Lake), with one major fire, Bottle Hill, in 1917 near Gerle Creek Reservoir. Several large fires have periodically burned in the lower elevation canyon areas near White Rock Powerhouse, the most recent being the Chili Bar Fire in 1979. Although the King Fire did not substantially damage hydroelectric infrastructure, it did do major damage to the forest and watersheds around the UARP. According to the U.S. Forest Service in El Dorado County, it is unlikely for any treatments or post fire timber harvesting to be conducted in the steep canyons where much of the hydroelectric infrastructure is located. A recent study indicates that without post fire logging or surface fuel treatments, woody fuels accumulate at a rate that exceeds the decomposition rate.6 As fuel accumulates, so does the fire hazard in the UARP area.
SMUD electric systems includes a number of energized features that inherently possess the risk of wildland fire hazard, with the potential to affect other infrastructure as well as structures in the surrounding areas. Even with little change in their frequency, the wildfires that California sees on an annual basis can still pose a threat to electricity infrastructure for SMUD. Physical infrastructure in the direct path of a fire can see extensive damage, especially smaller lines that are often fitted with wooden poles. Soot collecting on equipment and ionized particulate matter in the air can cause leakage currents or arcing. Firefighting measures can foul lines, requiring extensive cleanup or repair after the fire is cleared. Transmission lines are affected by high heat, smoke and particulate matter of the fire, therefore lines may be shut down as a safety measure.
6 Peterson, David, Richy J. Harrod, 2010 (May) Fuel Succession, Post-Fire Logging, and Future fire Behavior: Addressing the “Reburn Problem,” Final report to the Joint Fire Sciences Program, Project Number: 06-3-4-16

33 | Local Hazard Mitigation Plan 2018
Much of SMUD’s electricity is imported using transmission lines through wildfire-prone lands. Due to multiple climate factors, critical transmission lines will be operating near their limits in the future. Wildfire events will further strain the system and its ability to deliver reliable power to SMUD customers.
The aftermath of wildfires can see increases in debris runoff as infiltration capacity of soil is reduced in the wildfire area, especially during rain events within the two years following a significant fire. Heavy rain events following a fire may also allow water to infiltrate the loose ground soil, increasing the potential for landslides. Large swings in rainfall from season to season can encourage vegetation growth in rainy periods, leaving more fire feedstock during subsequent dry seasons and priming conditions for the spread of wildfires.
Runoff from heavy rain events also affects the production of hydropower systems that are downstream from fire prone areas, as wildfire soot and residue collects in the waterways that feed the plant. This silt and particulate matter can reduce production or even damage the turbines. 7 As precipitation patterns change in the coming decades, the aftereffects of wildfires could increase concerns for the impact on SMUD infrastructure from runoff, vegetation growth, and landslides.
SMUD is using Unmanned Aerial Systems (UAS), or drone technology, to identify drought-related dead or dying vegetation under or near transmission lines for priority removal before it can cause a wildfire.
Rural communities within El Dorado County that are situated in heavily forested areas are particularly vulnerable to wildfire. Fire can also impact the general community by damaging infrastructure such as roads, telecommunication systems, and community buildings. Community adoption of fire safe measures, such as creating evacuation routes and defensible space around homes and transportation corridors, can help mitigate potential wildfire damages.
7 CEC. (2016). Cal-Adapt Climate Tools. Retrieved from CEC: http://cal-adapt.org/tools/

34 | Local Hazard Mitigation Plan 2018
Table 5: Large Wildfires near SMUD Plan Area from 1916 to Present
Fire Name Year Acres Burned Unnamed 1916 2,131Unnamed 1916 4,306Bottle Hill 1917 1,326Badger Hill 1924 638Camp 7 1959 10,225Ice House 1959 19,099Unnamed 1960 11,212Kelsey Mill 1961 11,815Pilliken 1973 10,313Chili Bar 1979 6,927Cleveland 1992 22,518Freds 2004 7,560King 2014 97,717County and Pawnee 2018 60,000
Fire also can damage the UARP infrastructure, which includes transmission lines, powerhouses, project roads, and penstocks. Recreationalists at UARP campgrounds are particularly vulnerable if access routes are destroyed or blocked during fires. Fuel reduction treatments, including thinning, brushing, removal of forest slash and mastication along the project corridors and around powerhouses can reduce such risks. Fire also creates indirect impacts on UARP operations. Land erosion associated with denuded hillslopes, for example, can increase sedimentation of reservoirs and degrade water quality.
Recreation facilities associated with the UARP can be damaged directly by the fire, requiring lengthy periods of reconstruction. The loss of the aesthetic value of surrounding forests can also depress recreation during the long process of forest regeneration, which can have a negative effect of the economy for a number of years.
Current Mitigation Efforts
As a condition of the FERC fifty-year license authorizing SMUD to operate the UARP, SMUD is required to file with FERC, a Fire Prevention and Response Plan (FPRP) developed in consultation with appropriate State and local fire agencies and approved by the USFS. SMUD’s FPRP filed with FERC was developed in consultation with the USFS, U.S. BLM, and CalFire. The FPRP provides in depth fire risk analysis of SMUD’s most fire vulnerable regions as well as historical data, roles and responsibilities and prevention/preparedness activities.

35 | Local Hazard Mitigation Plan 2018
SMUD continues to meet or exceed vegetation clearance requirements and other industry standards. SMUD has also identified a series of measures for its entire electric system intended to prevent wildfires from occurring, minimize the spread of any fire that does occur, and improve the resiliency of its system. These measures include the installation of Cal-Fire approved exempt material to reduce the risk of sparking; the strengthening of equipment exposed to strong wind conditions, and the increased monitoring of, and identified response8 to, fire conditions.
SMUD uses Geographic Information Systems (GIS) mapping of wildfire hazard areas to analyze and plan infrastructure development. It also addresses and continuously reevaluates its assets for the density and quantity of developments, emergency access, landscaping, and water supply. SMUD performs regular patrols of vegetation and obstruction around SMUD facilities in areas that are specifically designated by CalFire as hazardous. SMUD has cyclical weed clearing and tree-trimming programs for all of its equipment, regardless of the area’s fire risk.
SMUD practices fuel management activities that are essential in establishing the desired levels of fire protection, while also minimizing the detrimental impacts of vegetation removal on the local terrain. Fuel management activities include grazing, prescribed burns, firewood collection of hazardous fuels, mechanical vegetation removal, and limited chemical vegetation control. SMUD has recently gained special approval from local agencies to remove vegetation with increased “fuel ladder” potential that exist outside SMUD’s right of way. A “fuel ladder” is any vegetation that would allow fire to climb into the tree canopy. See figure 8 below for vegetation management clearing of distribution right of ways.
8 The identified responses include operational procedures for the de-energization of lines during high fire threat conditions, and operational protocols for disabling the use of reclosing functionality on our transmission lines within the high fire threat areas and on our distribution lines during fire season in areas of high vegetation.

36 | Local Hazard Mitigation Plan 2018
Figure 9: SMUD Vegetation Management
Table 6: Current Wildfire Risk Mitigation
Mitigation Description
Vegetation Management Program
SMUD maintains a vegetation management program. Trees are trimmed on a three-year reoccurring cycle for most trees within SMUD’s plan area, and 18 months for those trees identified as fast growing. SMUD also removes trees with high fuel ladder potential (vegetation that allows fire to climb up into the tree canopy). This may include the elimination of hazard trees outside of SMUD’s right-of-way.
Supplier Joint Response Coordination
Since much of SMUD’s critical assets and replacement parts are unique or made to order and the lead-time for manufacturing and delivery of these materials could take up to a year. It is important for the continued operation of the power grid to maintain the health and safety of our community, to participate in a supplier joint response coordination. The coordination allows SMUD to borrow from participating utilities and suppliers, key assets for immediate use.
Transmission and Distribution Line Patrol
SMUD performs transmission and distribution line patrols, whereby staff physically inspects transmission and distribution corridors and lines, by either land or air,
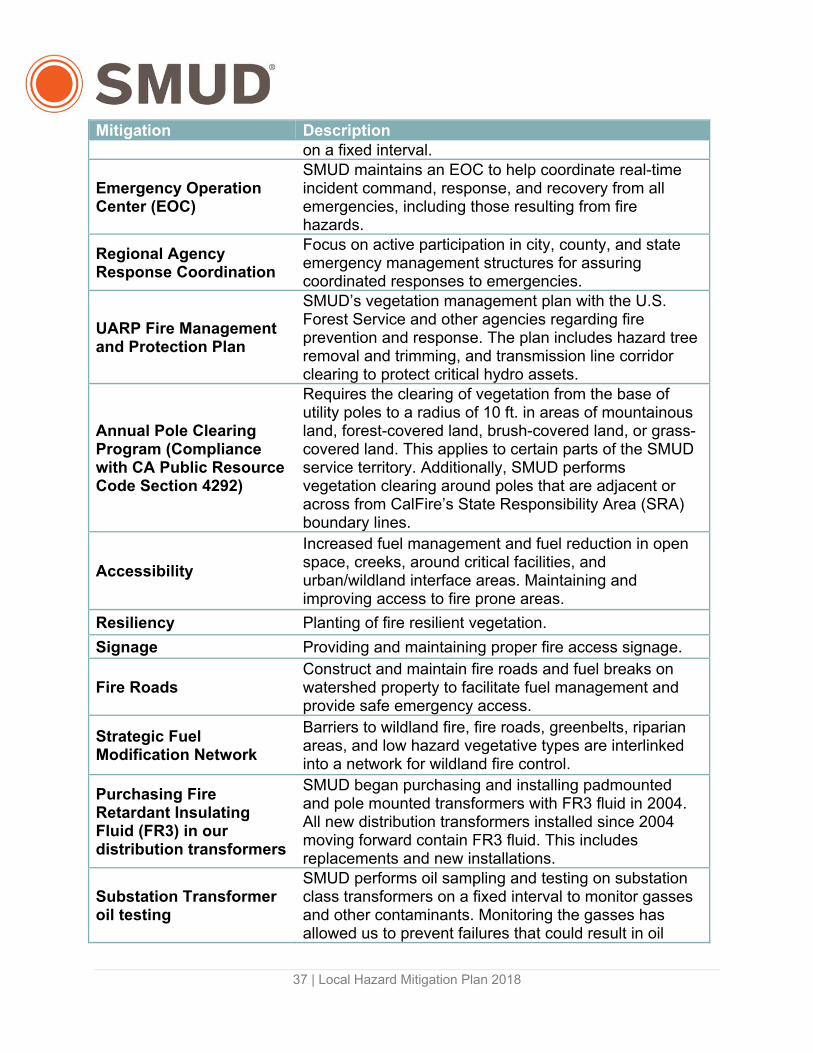
37 | Local Hazard Mitigation Plan 2018
Mitigation Descriptionon a fixed interval.
Emergency Operation Center (EOC)
SMUD maintains an EOC to help coordinate real-time incident command, response, and recovery from all emergencies, including those resulting from fire hazards.
Regional Agency Response Coordination
Focus on active participation in city, county, and state emergency management structures for assuring coordinated responses to emergencies.
UARP Fire Management and Protection Plan
SMUD’s vegetation management plan with the U.S. Forest Service and other agencies regarding fire prevention and response. The plan includes hazard tree removal and trimming, and transmission line corridor clearing to protect critical hydro assets.
Annual Pole Clearing Program (Compliance with CA Public Resource Code Section 4292)
Requires the clearing of vegetation from the base of utility poles to a radius of 10 ft. in areas of mountainous land, forest-covered land, brush-covered land, or grass-covered land. This applies to certain parts of the SMUD service territory. Additionally, SMUD performs vegetation clearing around poles that are adjacent or across from CalFire’s State Responsibility Area (SRA) boundary lines.
Accessibility
Increased fuel management and fuel reduction in open space, creeks, around critical facilities, and urban/wildland interface areas. Maintaining and improving access to fire prone areas.
Resiliency Planting of fire resilient vegetation.
Signage Providing and maintaining proper fire access signage.
Fire Roads Construct and maintain fire roads and fuel breaks on watershed property to facilitate fuel management and provide safe emergency access.
Strategic Fuel Modification Network
Barriers to wildland fire, fire roads, greenbelts, riparian areas, and low hazard vegetative types are interlinked into a network for wildland fire control.
Purchasing Fire Retardant Insulating Fluid (FR3) in our distribution transformers
SMUD began purchasing and installing padmounted and pole mounted transformers with FR3 fluid in 2004. All new distribution transformers installed since 2004 moving forward contain FR3 fluid. This includes replacements and new installations.
Substation Transformer oil testing
SMUD performs oil sampling and testing on substation class transformers on a fixed interval to monitor gasses and other contaminants. Monitoring the gasses has allowed us to prevent failures that could result in oil

38 | Local Hazard Mitigation Plan 2018
Mitigation Descriptionexpulsion and spills. The intervals are shortened where certain thresholds are met.
Visual and Infrared (IR) Inspections on Substation Equipment
SMUD performs Visual and IR inspections on substation equipment on a fixed interval. The inspections allow crews to identify potential hazards and problems. Issues found are corrected based on severity of the problem and nature of the equipment
Automatic reclosing
Disable automatic reclosing for all transmission level faults in the Valley Disable automatic reclosing on the distribution circuits between 69 kV in the SRA
De-energization De-energization of lines based on pre-determined conditions
Purchase Larger Substation Plots
Land for new substations is purchased large enough to allow transformers to be installed with adequate space around them to allow for fire breaks. The extra space also allows the transformers to be installed far enough away from potential structures on adjacent property to minimize the risk of urban structure fires.
5.4.2 Urban Structural Fire Hazards Urban structural fires refer to the fire potential of development interspersed within, or adjacent to, landscapes that support wildland fire. Urban is defined as an area with greater than one housing unit per acre. Urban fires are regarded as the most detrimental hazard within SMUD’s plan area. They have the greatest effect in locations where development has expanded into rural areas. Urban fires pose an increased threat to that of standard wildfires, as they can spread quickly between structures that are placed within close vicinity of one another. The community, critical infrastructure, and public safety are each affected by urban fires damages.
The severity of urban fires is influenced by a multitude of components, including the vegetative fuel in the area of the fire, the weather conditions, and the slope of the land. California and local agencies have adopted building codes that reduce the risk of embers from a fire igniting buildings. The codes assist with reducing the frequency and severity of urban fires.
SMUD owns and operates critical infrastructure that is surrounded by encroaching urban interface of the Sacramento Regional communities. Urban structural fires account for 12% of all reported hazard-related incidents. It is the third most commonly occurring hazard in SMUD’s plan area over the trailing 31 years.
39 | Local Hazard Mitigation Plan 2018
Assessment of Vulnerability and Potential Loss
An urban fire to a SMUD owned and operated structure could result in much more than structural damage. Communication systems, energy delivery systems, critical medical services, transportation infrastructure, and all other crucial societal functions powered by energy have potential to be damaged by urban structural fires.
Sacramento County is not at high risk, relative to other counties in California, of urban fire hazard (See Figure 10). However, the surrounding counties of Yolo, Solano, San Joaquin, Costa, Placer, and Sutter are all “high” ranked wildfire hazard areas.9 A wind event combined with a wildfire event in a bordering county would put SMUD at an increased risk for an urban fire hazard event.
9 Source: 2018 California State Hazard Mitigation Plan

40 | Local Hazard Mitigation Plan 2018
Figure 10: Fire Hazard Levels in Sacramento County10
10 Source: Department of Forestry and Fire Protection
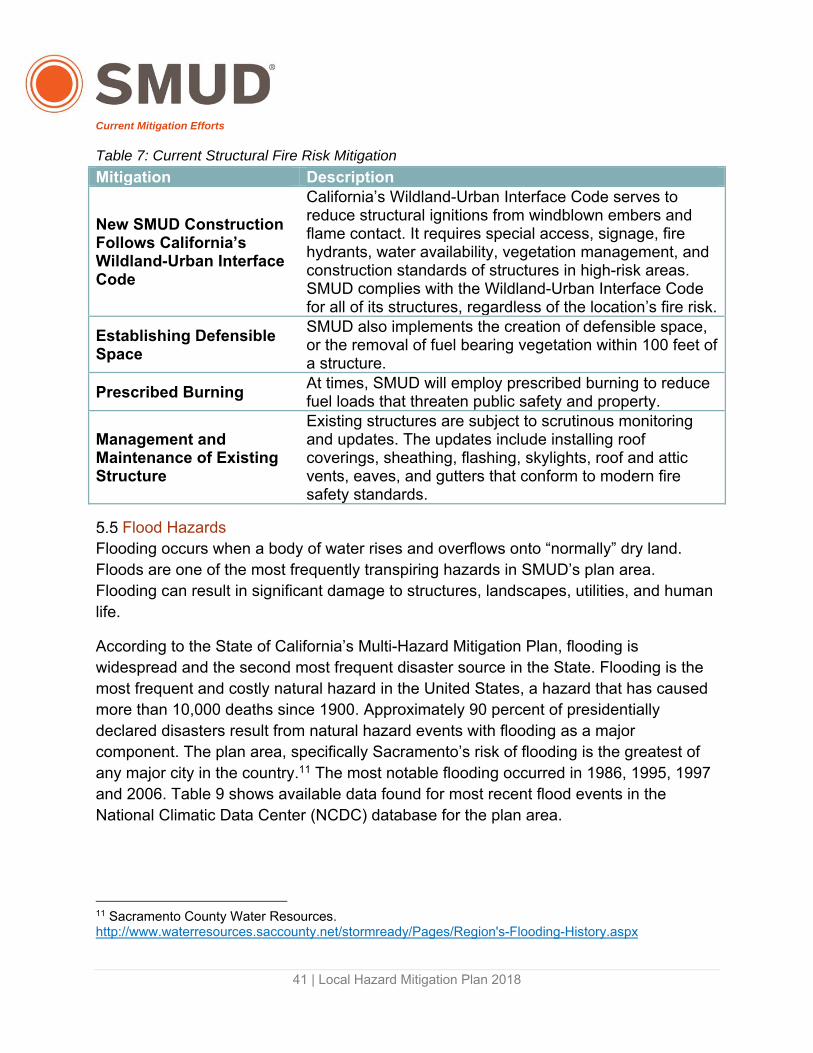
41 | Local Hazard Mitigation Plan 2018
Current Mitigation Efforts
Table 7: Current Structural Fire Risk Mitigation
Mitigation Description
New SMUD Construction Follows California’s Wildland-Urban Interface Code
California’s Wildland-Urban Interface Code serves to reduce structural ignitions from windblown embers and flame contact. It requires special access, signage, fire hydrants, water availability, vegetation management, and construction standards of structures in high-risk areas. SMUD complies with the Wildland-Urban Interface Code for all of its structures, regardless of the location’s fire risk.
Establishing Defensible Space
SMUD also implements the creation of defensible space, or the removal of fuel bearing vegetation within 100 feet of a structure.
Prescribed Burning At times, SMUD will employ prescribed burning to reduce fuel loads that threaten public safety and property.
Management and Maintenance of Existing Structure
Existing structures are subject to scrutinous monitoring and updates. The updates include installing roof coverings, sheathing, flashing, skylights, roof and attic vents, eaves, and gutters that conform to modern fire safety standards.
Flood Hazards Flooding occurs when a body of water rises and overflows onto “normally” dry land. Floods are one of the most frequently transpiring hazards in SMUD’s plan area. Flooding can result in significant damage to structures, landscapes, utilities, and human life.
According to the State of California’s Multi-Hazard Mitigation Plan, flooding is widespread and the second most frequent disaster source in the State. Flooding is the most frequent and costly natural hazard in the United States, a hazard that has caused more than 10,000 deaths since 1900. Approximately 90 percent of presidentially declared disasters result from natural hazard events with flooding as a major component. The plan area, specifically Sacramento’s risk of flooding is the greatest of any major city in the country.11 The most notable flooding occurred in 1986, 1995, 1997 and 2006. Table 9 shows available data found for most recent flood events in the National Climatic Data Center (NCDC) database for the plan area.
11 Sacramento County Water Resources. http://www.waterresources.saccounty.net/stormready/Pages/Region's-Flooding-History.aspx

42 | Local Hazard Mitigation Plan 2018
Table 8: Selected List of Flood Events in SMUD Plan Area
County/Zone Date Deaths InjuriesProperty Damage $
Crop Damage $
Motherlode Camptonville
12/12/1996 0 0 0 0
Southern Sacramento Valley
12/12/1996 0 0 0 0
Northern Sacramento Valley
12/29/1996 0 0 20K 0
Southern Sacramento Valley
02/02/1998 0 0 4.3M 7.8M
Northern Sacramento Valley
02/02/1998 1 0 0 0
Carquinez Strait and Delta
02/02/1998 1 0 0 0
Central Sacramento Valley
02/02/1998 0 0 0 0
Northern Sacramento Valley
02/02/1998 0 0 20.8M 6.5M
Yolo West, North East Solano, Sacramento
01/23/2000 0 0 0 0
Sutter 01/01/2006 0 0 900K 0Solano 01/01/2006 1 1 15M 0Sacramento 01/01/2006 0 0 4.5M 0El Dorado 01/01/2006 0 0 3.2M 0 If flooding were to occur in the plan area, impacts could include loss of life, reduction of grid reliability, damaged infrastructure and increased safety risks.
Flooding, erosion, and debris flows commonly occur in California during periods following large, hot fires. Wildfires greatly reduce the amount of vegetation and affect the soils, which in turn reduces the capabilities for the terrain to absorb rainwater. This effect allows for excessive water runoff that will often carry large amounts of debris. Structures located in the vicinity of a major burn area are most susceptible to flooding.
SMUD’s plan area has experienced flooding periodically during and following major storms. This is a natural incident, given that the City of Sacramento is located at the confluence of two major rivers. It was commonly believed prior to 1986 that the levees containing the Sacramento River and the American River were of sufficient height and stability to protect the City of Sacramento from 100-year or greater storms. However, the storms that occurred in February 1986 demonstrated that those levees are not

43 | Local Hazard Mitigation Plan 2018
sufficient. Not only was the City of Sacramento at risk from the water flowing through the Sacramento and American Rivers, but also from the tributaries and streams that flow into those rivers, particularly Natomas East Main Drainage Canal, Arcade, and Magpie Creeks in the north and Morrison Creek stream group in the south that eventually flows into Beach Lake and returns to the Cosumnes watershed. As a result, the Sacramento Area Flood Control Agency (SAFCA) was formed to work with State and Federal authorities to identify and construct levee improvements and other facilities to provide 200-year level of protection for the City of Sacramento on the American River system. This work is still ongoing.
SMUD will likely encounter direct and indirect impacts from sea level rise and flooding in the next several decades. While sea level rise and flooding are each a concern of climate change in their own right, the impacts compound in the Sacramento region due to the interconnected nature of snowmelt from the Sierras and ocean access from the Sacramento-San Joaquin Delta (the Delta). SAFCA suggests that Sacramento has the greatest risk of flooding when compared to all other cities in the United States.12
Sea level along California’s coast has risen approximately 7 in. in the last century,13 and this rate is expected to accelerate south of Cape Mendocino 5 – 24 in (5 in – 2 ft.) by 2050 and 17 – 66 in (1.4 - 5.5 ft.) by 2100 relative to a 2000 baseline dependent on specific carbon emissions scenarios.14 With current sea-level rise conditions, the Risky Business Project predicts that roughly $8-$10 billion of existing property in California could be flooded by 2050 with an additional $6-$10 billion susceptible to flooding in 2100.15 Combined with Sacramento’s particular vulnerability to flooding, sea level rise could have major implications to assets and infrastructure on which SMUD is dependent.
Section 5.5 covers flood and other water rise hazards as a whole. These other water rise hazards include
12 SAFCA. Flood History – Sacramento Flood Threat. Accessed on July 11, 2014. http://www.safca.org/floodhistory/floodthreat.html 13 California Climate Change Center. 2012. Our Changing Climate 2012 Vulnerability & Adaptation to the Increasing Risks from Climate Change in California – Brochure. Publication # CEC-500-2012-007. Retrieved from http://climatechange.ca.gov/climate_action_team/reports/third_assessment/ 14 NRC (National Research Council). 2012. Sea-Level Rise for the Coasts of California, Oregon, and Washington: Past, Present, and Future. Washington, DC: The National Academies Press. Retrieved from http://dels.nas.edu/resources/static-assets/materials-based-on-reports/reports-in-brief/sea-level-rise-brief-final.pdf 15 Risky Business Project. 2015. The Economic Risks of Climate Change in the United States: From Boom to Bust? Climate Risk in the Golden State. Retrieved from: http://riskybusiness.org/report/from-boom-to-bust-climate-risk-in-the-golden-state/
44 | Local Hazard Mitigation Plan 2018
Riverine, stream and alluvial flood hazards; Sea level rise, coastal flooding, and erosion hazards; Tsunami and seiche hazards; Levee failure; and Dam failure
5.5.1 Riverine, Stream and Alluvial Flood Hazards Riverine flooding happens when a watercourse exceeds its “bank-full” capacity. The causation of such an event is generally a result of prolonged rainfall, or a combination of rainfall and snowmelt. In SMUD’s plan area, riverine flooding will occur most often between the months of November and April. The intense storms that happen during these months can overwhelm local waterways and compromise the integrity of flood control structures.
5.5.2 Sea Level Rise, Coastal Flooding, and Erosion Hazards Coastal erosion is a natural geomorphic process. Coastal erosion is accelerated by factors such as winter storms, tidal action, wind-generated high surf, wave action, and rising sea levels. Periods of heavy rain have resulted in the highest sea level readings along California’s coast. Climate change plays a significant role in rising sea levels, and may increase the frequency of severe weather and winter storms.
Sea level rising has a significant impact on the environment. If coastal habitats are unable to migrate inland due to rising sea levels, they may become inundated by salt-water intrusion. This will result in land subsidence, a loss of habitat for fish and wildlife, and loss of aesthetic, recreational, and commercial uses.
5.5.3 Tsunami A tsunami is a wave triggered by any form of land displacement along the edge or bottom of an ocean or lake. Tsunamis are rare and can quickly put the lives of coastal residents, business, and visitors in jeopardy. California is vulnerable to local and distant tsunamis, but a local tsunami is typically more disastrous and threatening because they affords at-risk populations only a few minutes to safety.
A seiche is a standing wave in an enclosed or partially enclosed body of water. Seiches have been observed on lakes, reservoirs, bays, harbors and at sea. Seiches have the ability to cause damage to wildlife and could result in flooding in the surrounding areas and destruction of port facilities.
5.5.4 Levee Failure A levee failure or breach is classified where a levee partially or completely releases the previously contained water to flood the land behind the levee. The two main reasons for

45 | Local Hazard Mitigation Plan 2018
levee breaches are erosion and overtopping. Erosion can be caused by natural elements such as the wind and water, which can create new or worsen existing damage of the levee. A majority of the urban center of Sacramento is dependent on the presence of levees (See Figure 11). A levee failure would be detrimental to SMUD’s plan area.
Folsom Dam provides primary flood management for much of Sacramento County. The dam is operated in concert with other major dams on the Yuba, Bear, Feather, and smaller rivers to protect various areas from flooding. One way levees protecting Sacramento would fail is if water were released from Folsom Dam or other dams which caused the American River or Sacramento River to rise above the top of the levees. The release capacity of Folsom Dam substantially exceeds the capacity of American River levees, and Sacramento could be forced to be flooded in order to protect the safety of Folsom Dam or other areas. This flood operation decision making is the responsibility of the US Army Corps of Engineers.
For example: Major flooding of downtown Sacramento would present great challenges for SMUD. Much of the California government would be without electrical power for many weeks, first while floodwaters receded and then later repairing the damage to the underground distribution system. Many thousands of downtown employees would not be able to work and would suffer economic hardship. SMUD revenues would be impacted since key business and government customers would be unable to purchase electricity.
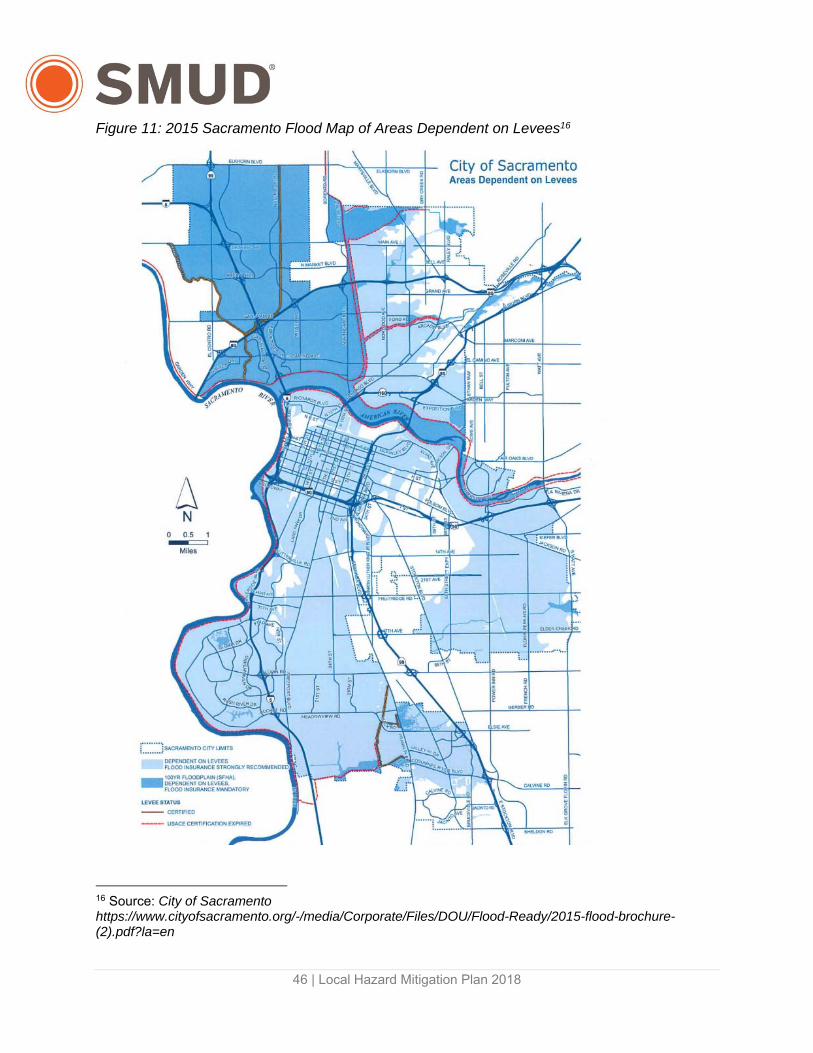
46 | Local Hazard Mitigation Plan 2018
Figure 11: 2015 Sacramento Flood Map of Areas Dependent on Levees16
16 Source: City of Sacramento https://www.cityofsacramento.org/-/media/Corporate/Files/DOU/Flood-Ready/2015-flood-brochure-(2).pdf?la=en
47 | Local Hazard Mitigation Plan 2018
Approximately 150 years ago, the levees of the Sacramento-San Joaquin Delta were raised to prevent flooding on some of the most fertile farmland in the nation. Levee failure is a high risk to SMUD due to SMUD’s plan area being surrounded by a network of 4-miles of levees.
Areas subject to flooding as a result of a levee breach in SMUD’s service area are adjacent to the Sacramento, Cosumnes, Mokelumne, and American Rivers. In addition, various sloughs, creeks and other drainage vehicles are subject to flooding. Other areas that flood periodically are low lying. The Sutter and Yolo bypasses afford an appreciable level of flood protection from Sacramento River overflows during the winter and spring months, leaving the American and Cosumnes River as the major slow-rise flood threat. Water from the Sacramento River overflows into these bypasses over the Tisdale, Fremont, and Sacramento Weirs.
The potential of a major, catastrophic levee failure on a major watercourse are similar to that of a levee overtopping on a secondary stream. The State/Federal River Forecast Center in Sacramento monitors the Sacramento, Cosumnes, Mokelumne, and American Rivers through a series of stations located along the rivers. The system affords a degree of advance flood warning for emergency responders.
5.5.5 Dam Failure Since the 1850's, hundreds of dams and reservoirs have been built in California. They have been built to provide water for populations and agriculture, to allow for flood control, as a source of hydroelectric power, and for recreation. The storage capacity of these reservoirs range from a few thousand acre-feet to 5,000,000 ac-ft. The water from these reservoirs eventually makes its way to the Pacific Ocean through several river systems.
Dam failure is defined as any uncontrolled release of water, and it does not need to be a complete and catastrophic failure of a dam. Depending on the nature of the failure, it can result in a small release of water or it can lead to substantial flooding, often well beyond the normal bank full discharge experienced by the downstream watercourse. Dam failure can be the result of a variety of natural of human-induced factors such as structural failure of the materials constituting the dam and/or spillways, dam overtopping due to flood conditions, earthquakes, sabotage, and inadequate maintenance and monitoring. In the event of a dam failure, the energy of the water stored behind the dam is capable of causing rapid and unexpected flooding downstream, affecting multiple communities and river landscapes, resulting in loss of life and property damage. Secondary effects include loss of water supply or power generation.

48 | Local Hazard Mitigation Plan 2018
SMUD owns the following 12 dams:
• Rubicon Dam • Buck Island Dam • Loon Lake Dam • Robbs Peak Dam • Gerle Creek Dam • Ice House Dam • Union Valley Dam • Junction Dam • Camino Dam • Brush Creek Dam • Slab Creek Dam • Rancho Seco Dam
There are 20 other dams within SMUD’s service area owned by private companies and public agencies. Several of these are significant or high hazard potential. An uncontrolled release of water from any of these dams could impact SMUD electrical system infrastructure or affect SMUD customers in myriad other ways.
Assessment of Vulnerability and Potential Loss
SMUD’s plan area has been subject to periodic flooding. The majority of the flood risk in SMUD’s plan area is a result of heavy rainfall and resulting stream and drainage canal overflows. Figure 12 below is the Flood Insurance Rate Map (FIRM) of SMUD’s plan area, which shows special hazard areas and risk premium zones, as delineated by FEMA. There have not been any flooding related hazards because of SMUD’s operations.

49 | Local Hazard Mitigation Plan 2018
Figure 12: FIRM Map of SMUD's Plan Area
50 | Local Hazard Mitigation Plan 2018
None of SMUD’s dams have failed in the 55 years since the construction of the UARP reservoirs. It is important for SMUD to address dam failure in the plan because a failure, depending on the nature of the failure, may result in a small release of water or can lead to substantial flooding. Secondary impacts include loss of load-serving capability.
In addition, dam failures have the potential to cause loss of life, damage to property, and other ensuing hazards, as well as the displacement of persons residing in or near the inundation path. Damage to electric generating facilities and transmission lines could also affect life support systems in communities outside the immediate hazard areas.
A catastrophic dam failure, depending on size of dam and population downstream, could exceed the response capability of local communities. Damage control and disaster relief support would be required from other local governmental and private organizations, state and federal governments, and other utilities.
Some of the UARP reservoirs impound small volumes of water in the upper reaches of the Crystal Basin that are largely unpopulated. Failure of these dams is less consequential because of the small amounts of water that would be released as well as the fact that larger reservoirs in downstream reaches have the capacity to limit flooding from these high elevation reservoirs on lower elevation communities. However, other UARP dams have more serious consequences that could result from failure scenarios. Slab Creek Dam, for example, lies roughly 10 miles upstream of a stretch of the South Fork American River populated with a number of homes and small communities, including Coloma. Due to the potentially devastating consequences of dam failure, SMUD and other hydroelectric operators throughout the United States must comply with dam safety regulations overseen by State and Federal agencies.
SMUD continues to minimize the impact of dam failure on the local community by complying with the FERC and Cal OES requirements to engage in EAP activities associated with dam failure. An EAP process is a formal procedure that identifies potential emergency conditions at a dam and results in a series of coordinated actions to be taken by a variety of parties to minimize loss of life and property damage in the event of a dam failure. SMUD’s EAP includes
A set of procedures SMUD follows to issue early warning and notification messages to responsible downstream emergency management agencies. El Dorado Sheriff’s Office is responsible for the emergency response. They are well aware of the potential for dam failure in its area. Every few years, most recently April 2016, El Dorado Sheriff’s Office participates in a dam failure response exercise led by SMUD.
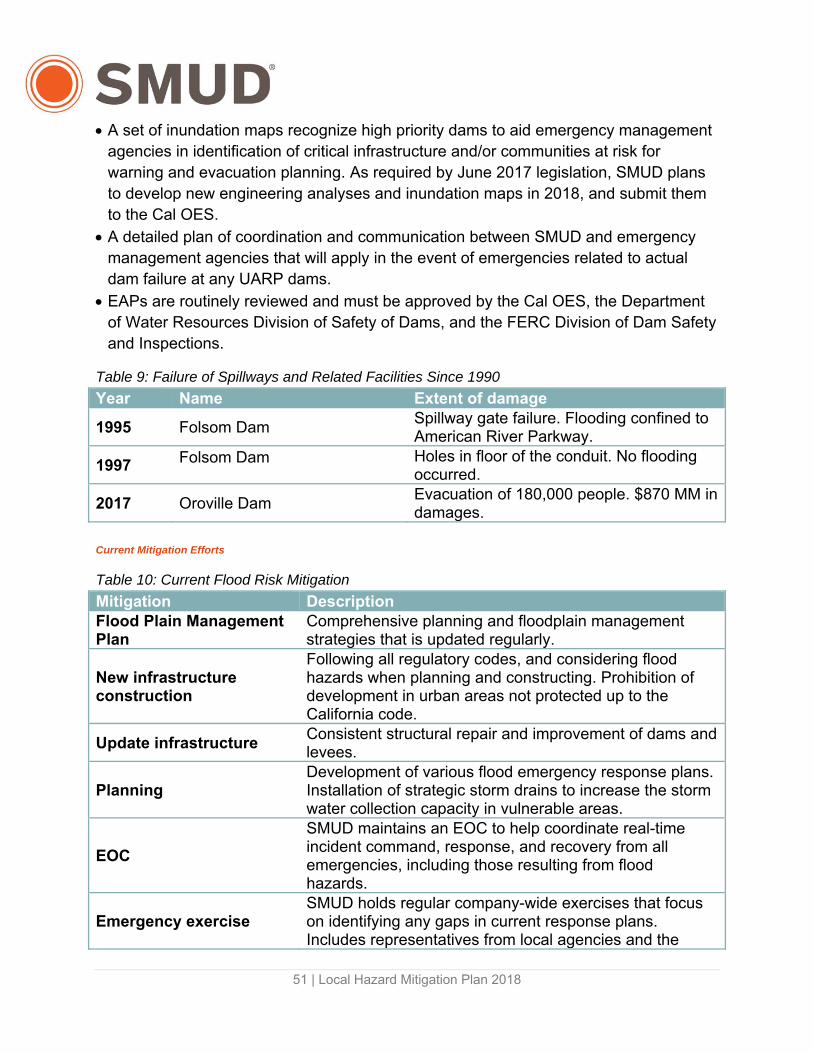
51 | Local Hazard Mitigation Plan 2018
A set of inundation maps recognize high priority dams to aid emergency management agencies in identification of critical infrastructure and/or communities at risk for warning and evacuation planning. As required by June 2017 legislation, SMUD plans to develop new engineering analyses and inundation maps in 2018, and submit them to the Cal OES.
A detailed plan of coordination and communication between SMUD and emergency management agencies that will apply in the event of emergencies related to actual dam failure at any UARP dams.
EAPs are routinely reviewed and must be approved by the Cal OES, the Department of Water Resources Division of Safety of Dams, and the FERC Division of Dam Safety and Inspections.
Table 9: Failure of Spillways and Related Facilities Since 1990
Year Name Extent of damage
1995 Folsom Dam Spillway gate failure. Flooding confined to American River Parkway.
1997 Folsom Dam Holes in floor of the conduit. No flooding occurred.
2017 Oroville Dam Evacuation of 180,000 people. $870 MM in damages.
Current Mitigation Efforts
Table 10: Current Flood Risk Mitigation
Mitigation DescriptionFlood Plain Management Plan
Comprehensive planning and floodplain management strategies that is updated regularly.
New infrastructure construction
Following all regulatory codes, and considering flood hazards when planning and constructing. Prohibition of development in urban areas not protected up to the California code.
Update infrastructure Consistent structural repair and improvement of dams and levees.
Planning Development of various flood emergency response plans. Installation of strategic storm drains to increase the storm water collection capacity in vulnerable areas.
EOC
SMUD maintains an EOC to help coordinate real-time incident command, response, and recovery from all emergencies, including those resulting from flood hazards.
Emergency exercise SMUD holds regular company-wide exercises that focus on identifying any gaps in current response plans. Includes representatives from local agencies and the

52 | Local Hazard Mitigation Plan 2018
Mitigation DescriptionNational Weather Service.
Flood communications coordination guidance
Focuses on internal and external communication during a flood event.
Elevation Elevating structures and facilities in vulnerable areas.
Water Collection Installation of strategic storm drains to increase storm water collection capacity in vulnerable areas.
Diversion Systems Construction of floodwalls and concrete swales as diversion systems.
Earthquakes and Geological Hazards
The United States Geological Survey (USGS) describes an earthquake as both the sudden slip on an active fault and the resulting shaking and radiated seismic energy caused by the slip. The ground shaking can result in liquefaction, differential settlement, dam failures, landslides, tsunamis, and loss of critical infrastructure. Human life is also at high risk during an earthquake event. Earthquakes represent the most destructive source of hazards, risk and vulnerability, in terms of both recent state history and the probability of future destruction of greater magnitudes than previously recorded.
California is vulnerable to earthquakes because the state sits atop the boundary between two of the earth’s tectonic plates, the Pacific Plate and the North American Plate. These two plates are constantly moving at a relative rate of two in. per year. The primary boundary between these two plates is the San Andreas Fault, which is more than 650 miles long and extends to depths of at least 10 miles. Many other small faults such as the Hayward and Calaveras faults branch from, and join the San Andreas Fault zone. According to the most recent information provided by the California Earthquake Authority, there is greater than a 99% chance that a magnitude 6.7 or greater earthquake capable of causing extensive damage and loss of life will occur in California within the next 30 years. Moreover, minor earthquakes not associated with faults occur weekly.
5.6.1 Fault Rupture A fault rupture occurs when one segment of the earth’s crust slides past another and a store of elastic energy is released as an earthquake. The resulting fracture is referred to as a fault. The sliding of the segments of earth on either side of the fault is referred to as the rupture. The fault rupture, aside from releasing an earthquake, can damage any structures or utility infrastructure around it, as the earth’s surface becomes displaced.
No major, active faults traverse SMUD’s plan area. However, there is a multitude of subsurface faults in the Delta. Additionally, active faults do exist near SMUD’s plan area

53 | Local Hazard Mitigation Plan 2018
that could have a detrimental impact on SMUD’s infrastructure if a high intensity earthquake event were to take place (See Table 13).
Table 11: Active Faults in the Area Surrounding SMUD17
Fault Name Approximate Distance from
West Sacramento (miles) Historical Seismicity
Probable Intensity
San Andreas 80 1906 (8.25) 7.5
Vaca 35 1892 (6.5-7) 6.0
Hayward 60 1836, 1868 (7.25)
6.5-7
Calaveras 50 1861 (6.5-7) 6.5-7
Concord-Green Valley
45 1955 (5.4) 6.0
Midland 20 1895 6.9
Dunnigan Hills 18 Unknown 6.0
Foothill Fault 25 1975 6.0
5.6.2 Subsidence Subsidence is a sinking of the ground. More specifically, it is deemed as “movement in which there is no free side and surface material is displaced vertically downward with little or no horizontal component.”
SMUD’s plan area is affected by some unique types of subsidence. The types of subsidence include:
Earthquake induced subsidence. This type of subsidence occurs when earthquake shaking causes compaction of unconsolidated soils.
Subsidence due to compaction by heavy structures. The Delta levees subside, in part, because of their own weight.
Subsidence due to wind erosion of the peat soils in the Delta. Subsidence due to fluid withdrawal. The removal of oil and gas in the Delta has
caused some slight subsidence of soils in the Delta. Water withdrawal has been a much more important problem in Sacramento County.
Subsidence due to peat oxidation in the Delta.
There are no SMUD administrative facilities known to be located in areas of existing, ongoing, or potential subsidence. Earth movement and sinking has developed at some substation sites. These conditions have been corrected.
17 Source: Lighthouse Marina Eir/Eis, by E D A W Inc. November, 1985

54 | Local Hazard Mitigation Plan 2018
Subsidence due to peat oxidation occurs in the Delta. Farmers drain the surface of the soil in order to plant and plow. When the peat dries out, aerobic bacteria are able to feed on the peat and convert it to carbon dioxide and other gaseous substances in a process called peat oxidation. Gradually, the peat is disappearing to the bacteria.
The subsidence in the Delta has caused problems for flood control because it places increasing pressure on the levees. These levees keep the surrounding water from inundating lower areas. The increasing hydrostatic pressure caused by the subsidence weakens the levees, necessitating periodic rebuilding. In terms of economic costs, subsidence makes flood protection increasingly expensive.
5.6.3 Liquefaction Liquefaction is one of the potential hazards that can precede a fault rupture. Liquefaction occurs when seismic ground shaking suddenly, temporarily, causes saturated soil to lose strength and firmness. Material that is normally solid begins to behave as a dense liquid. The effect is similar to that of quicksand for any structure located on it. If the liquefied layer is on the subsurface, structures upon it will begin to move laterally.
Liquefaction is most likely to occur in areas where the groundwater level is shallow. Conditions such as this are most common in areas where alluvial soil is present. Alluvial soil is most prevalent in places where sandy sediments have been deposited by rivers, in moderate to large canyons, and areas in which wave action has deposited sediment along a beach. Bridges, wharves, piers, and underwater utility lines are most susceptible to the negative impacts of liquefaction.
In SMUD’s plan area, the Delta and downtown Sacramento are at the greatest risk to liquefaction. Though SMUD’s plan area has not endured any major earthquake events in recent history, there are at least five faults that lie in the vicinity of the Delta that are capable of generating peak ground acceleration. The 1,100 miles of levees that surround the Delta may become unstable under seismic loading. The presence of sand and silt in the levees make liquefaction a very high possibility. As an additional vulnerability, potential liquefaction risks may exist throughout the downtown area where loose soil is present below the ground water table.
5.6.4 Landslides The plan area is susceptible to landslides. Landslide refers to a variety of slope instabilities that result in the downward and outward movement of slope-forming materials including rocks, soil, and artificial fill. Most landslides occur during rainy months, when soil is saturated with water. Winter storms with intense rainfalls are the most common trigger for landslides. Masses of rock and soils can become detached

55 | Local Hazard Mitigation Plan 2018
from steep slopes or cliffs because of earthquakes, flooding, and/or drought and is strongly influenced by gravity, weathering, undercutting, or erosion. Rotational slides caused by the earth movements create a concaved upward movement of soil. This usually results in a bulging “toe” made of the slid material at the bottom of the slide. These types of land movement could cause significant damage to roads, leaving them unsafe to travel on.
Landslide impacts are limited geographically to the area where the slide occurs and are primarily associated with mountainous regions. The potential for larger slides in SMUD’s plan area exist in the UARP and other mountainous regions. The primary factors that could cause or increase the likelihood of landslides for SMUD are:
Naturally occurring geological movement including rainfall, water action, seismic, and volcanic activities.
Excavation and grading on sloping ground for homes, roads and other structures. Drainage and groundwater alterations or breaches. Change or removal of vegetation located on steep slopes.
Assessment of Vulnerability and Potential Loss
Landslides can occur throughout the Plan area, though more tend to occur in areas with steeper slops, weaker geology and high annual precipitation. Landslides may result from a number of things including natural and human-caused changes in the environment such as heavy rain, rapid snow melt, steepening of slopes due to construction or erosion, earthquakes, changes in groundwater levels and deforestation caused by wildfires. There have been incidents of landslides and general slope failure in isolated portions of El Dorado County, but it is an uncommon occurrence with no defined history of significant damages. There are several faults known to exist within or near SMUD’s plan area that could affect SMUD’s energy system. In the eastern part of the county, the Bear Mountain and Melones Faults are found. They are believed to have been inactive for the past 150 million years. The Bear Mountain Fault passes beneath the west end of Folsom Lake. No faults are currently known to exist within the City of Sacramento portion of the County. It should be noted that significant earthquakes have occurred on previously undetected faults. Although no faults occur, Sacramento does feel residue from ground shaking as a result of radiated seismic energy. The threat of earthquake damage in SMUD’s plan area comes from earthquakes along Northern California's major faults, which are the Green Valley, San Andreas, Calaveras, and Hayward faults. Ground shaking on any of these faults could cause shaking within

56 | Local Hazard Mitigation Plan 2018
the plan area to an intensity of 5 to 8 on the Modified Mercalli Intensity Scale. Assets and operations that lie in areas that are closer to the fault will experience stronger intensity than those located further away. SMUD’s operations depends on infrastructure which is owned and/or operated within the regions of the Delta, Sierra Nevada and Greater Sacramento areas, Greater Bay Area, and the Shasta Cascade as defined by the California Earthquake Authority. Table 15 defines the LHMP counties located within the respective earthquake regions. Table 12: Counties Located Within Corresponding Earthquake Regions
Region County
Delta, Sierra Nevada and Greater Sacramento
Sacramento El Dorado Colusa San Joaquin Sutter Yolo
Greater Bay Area Solano Alameda Contra Costa
Shasta Cascade
Glenn Modoc Shasta Siskiyou Tehama
SMUD’s plan area has experienced small landslides throughout its history. Given the varied topography, the majority of these incidents have occurred in the UARP area. Frequently, these events occur after heavy rainfall and causes roads to either be washed away or unsafe for vehicle use. A more detailed landslide hazard assessment requires a site-specific analysis of the slope, soil, rock, vegetation, and groundwater characteristics. Such assessments are often conducted prior to major development projects in areas with moderate to high landslide potential, to evaluate the specific hazard at the development site.
The plan area has a high risk of a major earthquake (5.0 magnitude or higher) occurring within 50km in the next 50 years (See Table 13).
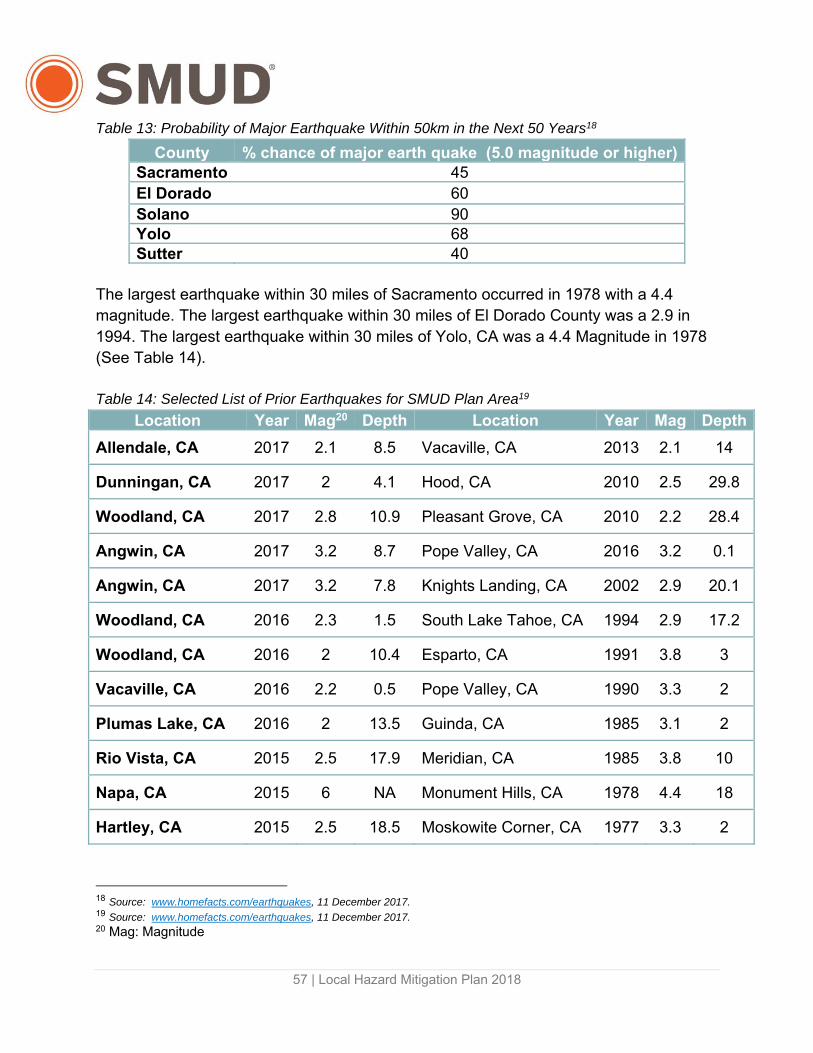
57 | Local Hazard Mitigation Plan 2018
Table 13: Probability of Major Earthquake Within 50km in the Next 50 Years18
County % chance of major earth quake (5.0 magnitude or higher)Sacramento 45El Dorado 60 Solano 90Yolo 68Sutter 40
The largest earthquake within 30 miles of Sacramento occurred in 1978 with a 4.4 magnitude. The largest earthquake within 30 miles of El Dorado County was a 2.9 in 1994. The largest earthquake within 30 miles of Yolo, CA was a 4.4 Magnitude in 1978 (See Table 14). Table 14: Selected List of Prior Earthquakes for SMUD Plan Area19
Location Year Mag20 Depth Location Year Mag Depth
Allendale, CA 2017 2.1 8.5 Vacaville, CA 2013 2.1 14
Dunningan, CA 2017 2 4.1 Hood, CA 2010 2.5 29.8
Woodland, CA 2017 2.8 10.9 Pleasant Grove, CA 2010 2.2 28.4
Angwin, CA 2017 3.2 8.7 Pope Valley, CA 2016 3.2 0.1
Angwin, CA 2017 3.2 7.8 Knights Landing, CA 2002 2.9 20.1
Woodland, CA 2016 2.3 1.5 South Lake Tahoe, CA 1994 2.9 17.2
Woodland, CA 2016 2 10.4 Esparto, CA 1991 3.8 3
Vacaville, CA 2016 2.2 0.5 Pope Valley, CA 1990 3.3 2
Plumas Lake, CA 2016 2 13.5 Guinda, CA 1985 3.1 2
Rio Vista, CA 2015 2.5 17.9 Meridian, CA 1985 3.8 10
Napa, CA 2015 6 NA Monument Hills, CA 1978 4.4 18
Hartley, CA 2015 2.5 18.5 Moskowite Corner, CA 1977 3.3 2
18 Source: www.homefacts.com/earthquakes, 11 December 2017. 19 Source: www.homefacts.com/earthquakes, 11 December 2017. 20 Mag: Magnitude

58 | Local Hazard Mitigation Plan 2018
Location Year Mag20 Depth Location Year Mag Depth
Elverta, CA 2015 2.1 13.8 Guinda, CA 1976 3.3 2
Hartley, CA 2015 2 5.5 Biggs, CA 1975 5.2 5
Vacaville, CA 2014 2 24.5 Esparto, CA 1973 4.2 2.0
Ione, CA 2013 2 0 San Francisco, CA 1906 7.9 NA
Auburn Lake Trails, CA
2013 2.1 0 Vacaville, CA 1892 6.4 NA
Madison, CA 2013 2 5.1 San Francisco, CA 1868 7.0 NA
Pollock Pines, CA 2013 2.3 16.4 San Francisco, CA 1838 6.8 NA
A fault rupture, causing an earthquake event, can lead to many detrimental residual hazards. Relative to the rest of the state of California, SMUD is at a low risk for the likelihood of a fault rupture and its residual effects (See Figure 13). Nonetheless, SMUD still has assets that remain vulnerable to shaking from fault ruptures among active faults in California and Nevada, as well as earthquakes not associated with fault rupture. Failure of these assets could lead to loss of both life and crucial infrastructure in SMUD’s plan area.

59 | Local Hazard Mitigation Plan 2018
Figure 13: California Earthquake Probabilities21
21 Source: USGS
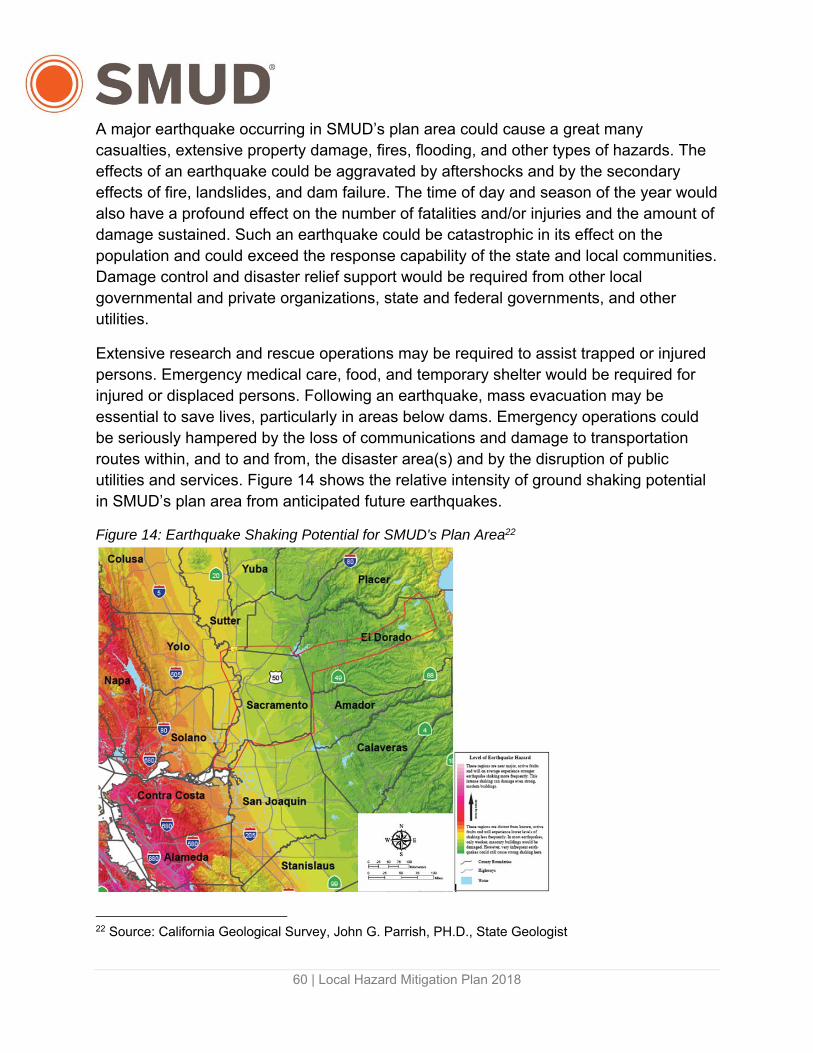
60 | Local Hazard Mitigation Plan 2018
A major earthquake occurring in SMUD’s plan area could cause a great many casualties, extensive property damage, fires, flooding, and other types of hazards. The effects of an earthquake could be aggravated by aftershocks and by the secondary effects of fire, landslides, and dam failure. The time of day and season of the year would also have a profound effect on the number of fatalities and/or injuries and the amount of damage sustained. Such an earthquake could be catastrophic in its effect on the population and could exceed the response capability of the state and local communities. Damage control and disaster relief support would be required from other local governmental and private organizations, state and federal governments, and other utilities.
Extensive research and rescue operations may be required to assist trapped or injured persons. Emergency medical care, food, and temporary shelter would be required for injured or displaced persons. Following an earthquake, mass evacuation may be essential to save lives, particularly in areas below dams. Emergency operations could be seriously hampered by the loss of communications and damage to transportation routes within, and to and from, the disaster area(s) and by the disruption of public utilities and services. Figure 14 shows the relative intensity of ground shaking potential in SMUD’s plan area from anticipated future earthquakes.
Figure 14: Earthquake Shaking Potential for SMUD's Plan Area22
22 Source: California Geological Survey, John G. Parrish, PH.D., State Geologist

61 | Local Hazard Mitigation Plan 2018
The loss of electric power due to earthquake can occur from many related effects of a violent ground shake. Landslides can damage distribution towers, substations, and switchyards. Liquefaction can cause misalignment of the power train of electric plants. Other SMUD assets vulnerable to earthquake damage include natural gas pipelines, oil transmission pipelines, liquid storage facilities, water supply systems, dams, communication systems, transportation systems, and disposal systems. Most of these assets rely on electric power. A disruption in the supply of electric power could have extremely detrimental impacts to SMUD and the community. Damgest to gas pipelines and excessive flooding could lead to loss of life and economic impact.
For example, a major earthquake could cause damage and possible failure of Nimbus and/or Folsom Dam. Evacuation of persons in the inundation area would be necessary.
If such an event were to happen, employees could be stranded either within SMUD facilities, on their way to or from these facilities, or at home. The damage and/or possible failure of either dam could severely damage SMUD’s energy system. It is not feasible to accurately forecast the severity of such an incident
Power outages or power reductions can be expected throughout SMUD’s service area. Downed power lines could be a hazard and complicate emergency response efforts. Substations and other portions of the infrastructure, especially the underground equipment, may be particularly susceptible to damage. Administrative facilities may be subject to damage. In addition, transmission facilities outside the service area may be damaged and limit the import capabilities, thus limiting the total amount of energy available for distribution and other operations. Generation facilities may experience interruptions or may be taken off line due to shaking or loss of load.
The immediate physical, emotional and social impact on the population would be varied and complex. In the hardest hit areas, there could be deaths and many injuries. Many could have their homes destroyed, others driven from their homes by the lack of water, power, leaking gas, flooding and so on. If an earthquake were to occur during business hours, the greatest emotional strain would be caused by separation of family members.
Current Mitigation Efforts
SMUD’s mitigation efforts for earthquake events are uniform with the requirements of the State of California. A list of current earthquake mitigation activities are depicted in Table 16 below.

62 | Local Hazard Mitigation Plan 2018
Table 15: Current Geological Hazards Risk Mitigation
Mitigation Description
Mapping
SMUD has identified all site-specific earthquake hazards, and has created an identification map with emergency processes for the recognized seismic events that could occur.
Adhering to Code
SMUD follows all current building codes and makes regular structural improvements to its facilities. Critical facilities are subject to more scrutinizing and innovative regulations and mitigation measures.
Vulnerability Assessment
SMUD regularly assesses its water supply, oil, and natural gas pipelines for potential failure during an earthquake event. In particular, all of SMUD’s high hazard potential and significant hazard potential dams on the UARP have been evaluated following FERC seismic analysis guidelines; the most recent analysis was made in 2018. All dams were found to not fail according to the guidelines.
EOC
SMUD maintains an EOC to help coordinate real-time incident command, response, and recovery from all emergencies, including those resulting from earthquake hazards.
Supplier Joint-Response Agreement
Since much of SMUD’s critical assets and replacement parts are unique or made to order and the lead-time for manufacturing and delivery of these materials could take up to a year. It is important for the continued operation of the power grid to maintain the health and safety of our community, to participate in a supplier joint response coordination. The coordination allows SMUD to borrow from participating utilities and suppliers, key assets for immediate use.
Gap Analysis SMUD actively practices identification of gaps in current response plans for earthquake events and revises them regularly.
Proper Equipment SMUD utilizes flexible piping, flexible couplings, and above ground fault crossings.
Generators SMUD utilizes generators in case of power failure.
Instruction SMUD trains customers how to manually shutoff utilities.

63 | Local Hazard Mitigation Plan 2018
5.6.5 Volcanoes Volcanic eruptions are one of Earth's most dramatic and violent agents of change. Not only can powerful explosive eruptions drastically alter land and water for tens of kilometers around a volcano, but tiny liquid droplets of sulfuric acid erupted into the stratosphere can change our planet's climate temporarily. Eruptions often force people living near volcanoes to abandon their land and homes, sometimes forever. Those living farther away are likely to avoid complete destruction, but their cities and towns, crops, industrial plants, transportation systems, and electrical grids can still be damaged by tephra, ash, lahars, and flooding.
The plan region is home to a number of cascade volcanoes. The volcanoes, their locations, most recent activity and threat potential are outlined in Table 17. Current volcanic activity alerts are portrayed in Figure 15.
Table 16: Historical Volcanic Activity23
23 Source: Meyers and Driedger, 2008 https://volcanoes.usgs.gov/observatories/calvo/
Volcano County Most Recent Eruption Threat PotentialMt. Shasta Siskiyou 200-300 years ago Very High Lassen Peak Shasta 1914 Very High Medicine Lake Siskiyou &
Modoc 950 years ago High
Brushy Butte Shasta Holocene Low to Very Low Silver Lake Volcanic Field
Shasta Holocene Low to Very Low
Tumble Buttes Shasta Holocene Low to Very Low Twin Buttes Shasta Holocene Low to Very Low
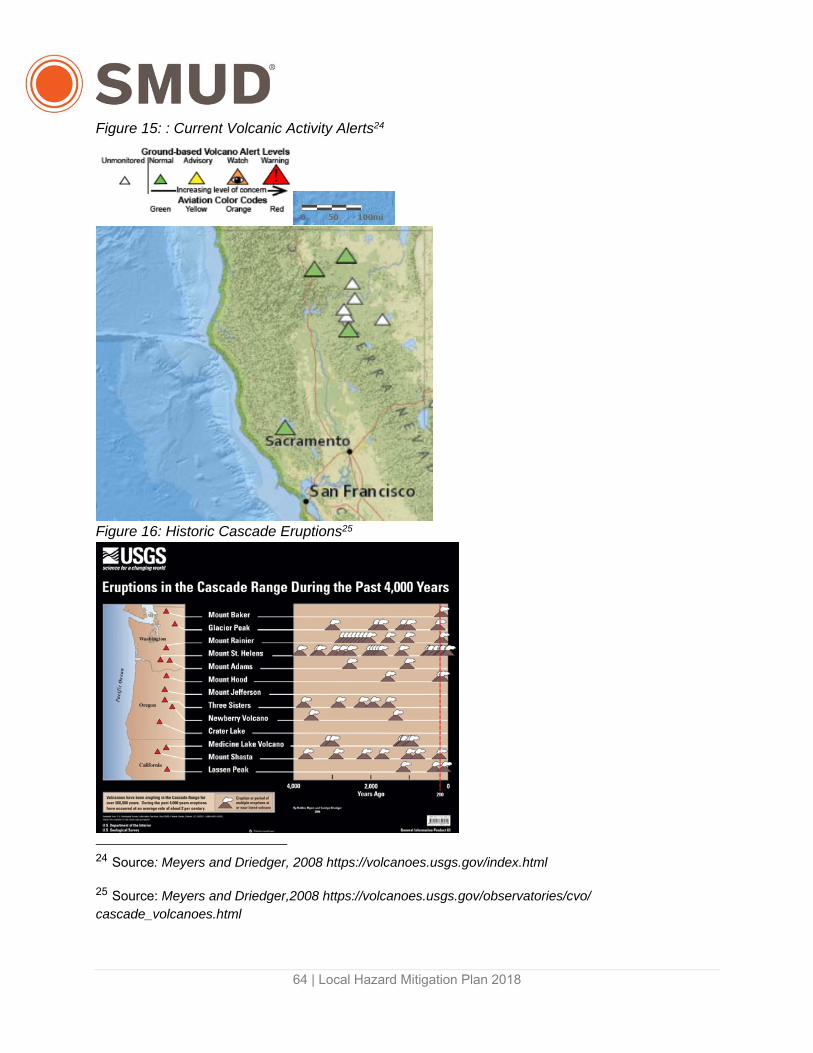
64 | Local Hazard Mitigation Plan 2018
Figure 15: : Current Volcanic Activity Alerts24
Figure 16: Historic Cascade Eruptions25
24 Source: Meyers and Driedger, 2008 https://volcanoes.usgs.gov/index.html 25 Source: Meyers and Driedger,2008 https://volcanoes.usgs.gov/observatories/cvo/ cascade_volcanoes.html
65 | Local Hazard Mitigation Plan 2018
Assessment of Vulnerability and Potential Loss
As population increases in the Pacific Northwest, areas near the volcanoes are becoming developed and more people and property are at risk. The principal hazards to people in the Pacific Northwest are from lahars and ash fall. Lahars (volcanic mudflows) can destroy buildings and infrastructure. Eruptions that include volcanic ash can be especially dangerous for aircraft, even at long distances from the volcano, because volcanic ash can clog and shut down their engines. Explosive eruptions of tephra are followed by effusion of lava flows. High-speed avalanches of hot rock and gas can accompany both of those events—columns of tephra collapse or the fronts of lava flows crumble, both of which can send pyroclastic flows down the volcano's flanks. Finally, when the erupted material mixes with river water or melts snow and ice, volcanic mudflows sweep down valleys and can devastate areas more than 50 miles downstream. Rivers can continue to carry volcanic sediment downstream and force flooding for decades to hundreds of years. The most significant threats are from volcanic ash and from the slurry of mud and debris within lahars. Even in the absence of eruption, the flanks of Cascade volcanoes can collapse, which result in landslides and debris avalanches that can destroy areas downslope from the collapse location.
Volcanoes pose multiple types of hazards and the initiation and duration of eruptions is relatively uncertain. Therefore, authorities and populations at risk, both close to and far from the volcano, must be knowledgeable about volcanic hazards so that they can be flexible and prepared in their response.
Fortunately, volcanoes exhibit precursory unrest that, when detected and analyzed in time, allows eruptions to be anticipated and communities at risk to be forewarned. The warning time preceding volcanic events typically allows sufficient time for affected communities to implement response plans and mitigation measures.
Current Mitigation Efforts
Hazard response and coordination plans are multi-agency efforts that define the responsibilities and actions to take in the event of a restless or active volcano. Scientists from the five regional volcanic observatories of the USGS Volcano Hazards Program participate in developing these plans with state and local governments of at-risk areas. If volcanic unrest or an eruption occurs, scientists from the observatories will keep state and local officials informed of potential hazards so that coordination and response plans can be updated as needed.
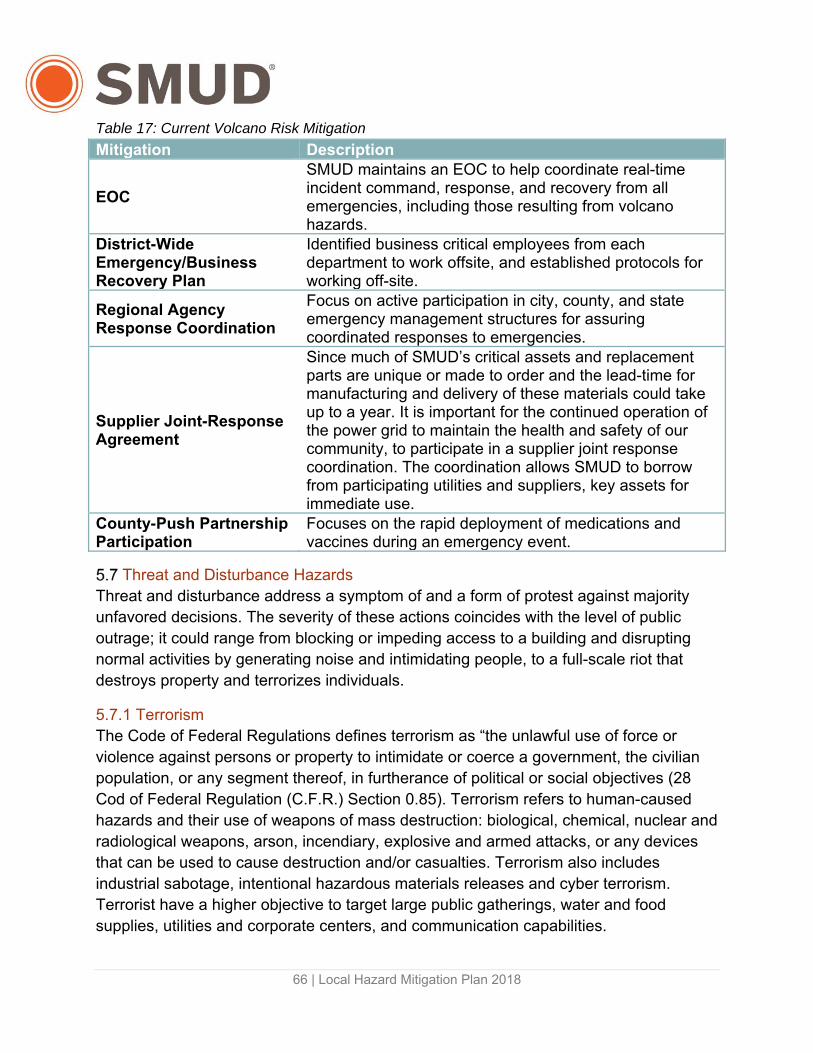
66 | Local Hazard Mitigation Plan 2018
Table 17: Current Volcano Risk Mitigation
Mitigation Description
EOC
SMUD maintains an EOC to help coordinate real-time incident command, response, and recovery from all emergencies, including those resulting from volcano hazards.
District-Wide Emergency/Business Recovery Plan
Identified business critical employees from each department to work offsite, and established protocols for working off-site.
Regional Agency Response Coordination
Focus on active participation in city, county, and state emergency management structures for assuring coordinated responses to emergencies.
Supplier Joint-Response Agreement
Since much of SMUD’s critical assets and replacement parts are unique or made to order and the lead-time for manufacturing and delivery of these materials could take up to a year. It is important for the continued operation of the power grid to maintain the health and safety of our community, to participate in a supplier joint response coordination. The coordination allows SMUD to borrow from participating utilities and suppliers, key assets for immediate use.
County-Push Partnership Participation
Focuses on the rapid deployment of medications and vaccines during an emergency event.
Threat and Disturbance Hazards Threat and disturbance address a symptom of and a form of protest against majority unfavored decisions. The severity of these actions coincides with the level of public outrage; it could range from blocking or impeding access to a building and disrupting normal activities by generating noise and intimidating people, to a full-scale riot that destroys property and terrorizes individuals.
5.7.1 Terrorism The Code of Federal Regulations defines terrorism as “the unlawful use of force or violence against persons or property to intimidate or coerce a government, the civilian population, or any segment thereof, in furtherance of political or social objectives (28 Cod of Federal Regulation (C.F.R.) Section 0.85). Terrorism refers to human-caused hazards and their use of weapons of mass destruction: biological, chemical, nuclear and radiological weapons, arson, incendiary, explosive and armed attacks, or any devices that can be used to cause destruction and/or casualties. Terrorism also includes industrial sabotage, intentional hazardous materials releases and cyber terrorism. Terrorist have a higher objective to target large public gatherings, water and food supplies, utilities and corporate centers, and communication capabilities.

67 | Local Hazard Mitigation Plan 2018
Assessment of Vulnerability and Potential Loss
SMUD owns critical infrastructures as defined by the Department of Homeland Security. These critical infrastructures are more vulnerable to terrorist attacks. Since September 11, 2001, the number of threats involving the use of chemical, nuclear, or biological agents by individuals and terrorist groups wishing to instill fear and disrupt communities within the United States has escalated. However, to date, SMUD has not experienced a high profile attack by groups or individuals associated with international terrorist organizations. Nor has SMUD experienced an incident involving a biological, chemical, radiological, or nuclear weapon. Nevertheless, domestic terrorist incidents such as the April 15, 2013, Boston Marathon Bombing have led to heightened security efforts for the Plan area. A detonation occurring anywhere in California could have a critical impact on SMUD’s energy system and/or its ability to maintain continuity in electric service. A targeted attack on SMUD could result in catastrophic damages to its electric system as well as its staff, customers and the community. Damages could include casualties, extensive property damage, fires, flooding, and other ensuing hazards. Such a detonation could be catastrophic in effect on the electrical system and could exceed SMUD’s response capability. Emergency operations may be seriously hampered by the loss of communications and damage to transportation routes within the disaster area as well as the disruption of other public utilities and services. Extensive mutual aid and State/Federal assistance could be required and could continue for an extended period.
Damage to SMUD’s power plants and ancillary facilities in affected areas can be expected to reduce generating capacity significantly. The potential impact of this reduction in local output is lessened by the availability of power from other sources outside the affected area and by relational reduction in consumer demand. Immediate concerns will focus on repairs necessary to restore power to areas of greatest need. Major restoration problems include repairs necessary to route power through the major substations, restoration of damaged and collapsed transmission line towers, re-activation of equipment at local substations, replacement of fallen poles, burned transformers, etc.

68 | Local Hazard Mitigation Plan 2018
Current Mitigation Efforts
Table 18: Current Terrorism Risk Mitigation
Mitigation Description
24/7 Security Patrols
Compensatory checks and alarm responses occur 24/7.SMUD staffing include a 24/7 fully staffed security force responsible for monitoring all closed circuit television systems, responding to security alarms, and performing security inspections, investigations, etc.
Remote Location Monitoring
SMUD has the ability to monitor remotely through a central alarm station manned by SMUD as well as contract services.
Collaboration External Collaboration
SMUD participates with local, state, and federal agencies for terrorism monitoring and notification.
Restrictions Maintain
Fencing, sensors, cameras, and alarms with carefully designed operational procedures and technology applications that remotely monitor facilities and protect critical computerized information resources.
Emergency Operation Plan
SMUD maintains an emergency operation plan which addresses SMUD’s preparedness and response policies and procedures for responding to, and recovering from, extraordinary emergency situations that could adversely affect business continuity and the capacity to safely generate, transmit, and distribute electric power and/or natural gas to its customers.
Nuclear Detonation Response Program
A framework that describes how local, state, and federal partners will respond and coordinate following a nuclear detonation in California.
CES-21
A cyber-information sharing program developed for the California Public Utilities Commission. It provides accurate and fast communication of cyber threats and the development of automated response capabilities to be executed prior to critical infrastructure damage.
5.7.2 Cyber Threats Cyber threats are attempts by criminals to attack a government, organization, or private party by damaging or disrupting a computer or computer network, or by gaining unauthorized access to information on a computer or computer network for malicious use. From 2012 to 2015, 50 million Californians’ records were compromised as a result of physical breaches and security failures with hacking and malware. As technology begins to advance and become more prominent, users are increasingly more vulnerable to cyber threats.

69 | Local Hazard Mitigation Plan 2018
In 2015, a cyberattack on Ukraine’s power grid left their nation’s capital in darkness and greatly impacted their economy. One year later, Russian hackers targeted a transmission substation causing a blackout in part of the capital. In 2017, the UK’s energy sector was targeted; this incident occurred within days of similar instance in both Ireland and the United States. It is speculated that this could be a probe on energy suppliers to identify weaknesses and to steal credentials for future attacks.
A 2018 Experian report predicts that cyberattacks that target and infiltrate critical infrastructure such as electric utilities may increase in 2018 as “hackers look to create chaos and confusion, targeting highly connected U.S. infrastructure.26”
Assessment of Vulnerability and Potential Loss
Cyber based attacks gain access to or intrude on critical infrastructure systems, such as financial services, communications systems, energy, or transportation systems, with the potential to alter their reliable functioning. Disruption to such SMUD’s systems could pose a critical threat to local and national security. Over the past years, the threat from cyber terror has grown exponentially in part due to the rapid growth in the use of the Internet and the rapid growth of technology in general.
SMUD collects employee and customer information on a continuous basis (e.g. job applications, new customer applications, loan forms) for the purpose of business operations. As SMUD’s electric grid and computer systems become more and more interconnected, and with the increased adoption of new technology (including cloud computing, big data and mobile device usage), the risk for cyber breach increases.
Current Mitigation Efforts
SMUD participates in a number of cross-collaborative cyber threat prevention initiatives.
Table 19: Current Cyber Threat Risk Mitigation
Mitigation Description
Mandatory training
SMUD requires completion of the training on cyber security policies, physical access controls, electronic access controls, visitor control program, handling of BCS information and storage, indentification of a cyber security incident and a response plan at least once every 15 calendar months.
Personnel verification Periodic verification of user accounts, user groups, or user role categories and that privileges assgined are correct
Physical security plan Log entry of individuals with authorized physical access to
26 Data Breach Industry Forecast 2018, Experian Data Breach Resolution, experian.com/databreach

70 | Local Hazard Mitigation Plan 2018
Mitigation DescriptionSMUD campus, monitor unauthorized access through physical access points
System security management
Evaluate security patches, protect against the use of unnecessary physical input/output ports, generate alerts for security events SMUD has implemented the Cyber Critical Infrastructure Controls required by NERC Standards and the Cyber Secrity Controls required by the FERC Division of Dam Safety and Inspection standard.
Climate Change and Meteorological Hazards
Climate change is the change in weather conditions and patterns that result from increased greenhouse gas concentrations that trap more of the suns harmful rays within the Earth’s atmosphere. More specifically, it is a change in the average weather conditions such as temperature, rainfall, snow, ocean and atmospheric circulation, or in the distribution of weather around the globe. According to the Intergovernmental Panel on Climate Change, climate change will “increase the likelihood of severe, pervasive, and irreversible impacts for people and ecosystems” if unattended to.
California has already been experiencing the impacts of climate change including prolonged droughts, increased coastal flooding and erosion, and tree mortality. The state has also seen increased average temperatures, more extreme heat days, fewer cold nights, a lengthening of the growing season, shifts in the water cycle with less winter precipitation falling as snow, and both snowmelt and rainwater running off sooner in the year. In addition to changes in average temperatures, sea level, and precipitation patterns, the intensity of extreme weather events is also changing. Extreme weather events and resulting hazards, such as heat waves, wildfires, droughts, and floods are already being experienced.
Meteorological hazards are events that occur as a result of changes in the weather.
Assessment of Vulnerability and Potential Loss
Climate change has not been identified as being directly responsible for any declared disaster. However, recent studies indicate that past flooding, wildfire, levee failure, drought and severe weather damages, have been exacerbated by climate change27. Climate change is an ongoing hazard that has the ability to increase the intensity of the likelihood, velocity and/or impacts of all hazards. The impacts as a result of climate
27 USGS

71 | Local Hazard Mitigation Plan 2018
change generally are long-term effects and may not be realized for sometimes, several decades.
Climate change impacts many hazards and a secondary impact could be land subsistence due to changing geology in the soil. The impacts of land subsidence include damage to buildings and infrastructure such as electrical equipment, substations, etc. Land subsidence in California is attributed to two primary factors, aquifer compaction due to excessive groundwater pumping and decomposition of wetland soils exposed to air after wetland conversion to farmland. According to the US Geological Survey, there have been recorded incidents of land subsidence in the Sacramento-San Joaquin Delta area as in addition to the Sacramento Valley. The Sacramento Valley has suffered elevation losses ranging from 0.73 ft. to 3.9 ft. since 1949.
In SMUD’s plan area, the impacts of climate change will result in frequent and intense storms, floods, droughts, and heat waves. Potential consequences of these weather-related hazards include the loss of life and injury, damaged infrastructure, long-term health effects, loss of agricultural crops, disrupted transport and freight, and much more.
From an operations perspective, climate change means rising energy demand and falling generation and distribution efficiency for the energy sector. Higher ambient temperatures will increase energy demand during the peak summer months by driving use of air conditioning.28 Rising temperatures will also decrease the efficiency of thermal conversions, meaning that more resources are required to produce the same amount of energy. In addition to higher temperatures, climate change may bring increased frequency and severity of major weather events, which pose a threat to infrastructure. Changing weather patterns may also affect solar-, wind-, and hydropower generation.29
Current Mitigation Efforts
SMUD is an industry leader in innovation and progress in California’s effort to reduce greenhouse gases. In 2008, SMUD produced the first targeted climate readiness study and adaptation strategy. The review included a “state of the science” assessment to update scientific findings and incorporate lessons from the California Climate Adaptation Strategy, Adaptation Policy Guide, and numerous other resources. The climate
28 Increased temperatures may also reduce energy demand during winter months, but the reader should note temperature changes in the summer are expected to be larger on a nominal basis then changes in the winter. 29 University of Cambridge. 2014. Climate Change: Implications for the Energy Sector. Available at: https://www.bmz.de/en/publications/type_of_publication/weitere_materialien/Implications_for_Energy_Briefing_WEB_EN.pdf

72 | Local Hazard Mitigation Plan 2018
readiness study and adaptation strategy is an integrated plan for addressing climate change. The analysis gives SMUD an opportunity to critically assess climate change risks and strategy and improve its readiness efforts, while providing a venue for sharing and learning best practices, providing transparency to the community, and building on local efforts with other public and private organizations. The study was updated in 2016 to include a Readiness Action Plan that addresses community engagement, enterprise programs, capital projects, and operational initiatives.
Table 21 below captures SMUD’s existing activities to mitigate climate change risks.
Table 20: Current Climate Change Risk Mitigation
SMUD’s forward-looking mitigation strategies include:
Leveraging the best available climate science to make decisions, updating the “state of the science” assessment every four years.
Continuing to collaborate with multiple local agencies on flood data analysis and preparedness planning.
Mitigation Description
Department of Energy (DOE) Partnership
SMUD continues to partner with the DOE to share information
Long-Term Planning Staff incorporates climate projection scenarios and readiness findings into long-term planning processes at SMUD.
Sacramento Region Adaptation Collaborative
SMUD chairs and participates in the regional adaptation collaborative to leverage existing regional resources to address the impacts of climate change.
Support Research SMUD supports, when appropriate, and helps to fund new research to fill significant gaps in current knowledge about climate change.
Climate Readiness Assessment and Action Plan
Staff reviews and summarizes new scientific conclusions and incorporates them into SMUD’s Readiness Strategy every four years as new methodologies warrant.
EV Incentive 1.5 cents per kilowatt-hour discount for EV owners that charge their vehicles between 12am and 6am.
SMUD and Uber Partnership to improve air quality in Sacramento. Discounts are offered to ride-sharing company Uber drivers utilizing EV’s.

73 | Local Hazard Mitigation Plan 2018
Taking proactive measures to make SMUD more resilient. Conducting research into the impacts of sustainable forest management techniques
on wildfire risk reduction and stream flows. Identifying systematic opportunities to integrate climate change projections in
internal program planning and capital budget development and approval. Investigating opportunities to employ resiliency bonds to finance further readiness
measures. Supporting and participating in the Capital Region Climate Readiness Collaborative
to assist public and private partners in the region improve overall climate readiness.
In June 2018, SMUD collaborated with ride sharing company Uber to offer drivers an increased rate if the driver utilizes a zero-emission vehicle. Drivers are offered free charging as part of the program. SMUD also offers monetary incentives to customers purchasing electric vehicles that include price reductions of the vehicle, and discounts on charging fees.
5.8.1 Air Pollution Air pollution is defined as the air containing any substance that poses harmful or poisonous effects. Air pollution is hazardous to the health of many citizens residing in SMUD’s plan area. Sources of air pollution are grouped into four major categories: stationary, mobile, area-wide, and natural sources.
Stationary sources include fixed facilities such as power plants and landfills. Mobile sources are pollution generated by cars, trucks, ships and airplanes. Area-wide sources of pollution may result from agriculture, construction grading or unpaved roads. Natural sources include plant pollens, biological decay and windblown dust.
Air pollution is a continuing problem with the largest concentration of pollution in the San Francisco Bay Area, San Joaquin Valley, Sacramento Valley, San Diego and the South Coast. Pollutants include smog, soot and toxic air contaminants (TACs). Air pollution in California is on the decline. Table 22 shows the average quantities of emissions in tons per day since 1975. SMUD supports the State’s initiative by reducing air pollutants in its use of equipment as well as its operations.

74 | Local Hazard Mitigation Plan 2018
Table 21: Statewide Emission (tons/day, annual average)
Pollutants 1975 1980 1985 1990 1995 2000 2005 2010 2015 2020
NOx 4,949 5,060 5,011 4,997 4,319 3,844 3,220 2,741 2,359 2,199
ROG 7,026 6,602 6,068 4,737 3,761 3,128 2,430 2,167 2,046 2,004
PM10 1,992 2,026 2,131 2,316 2,200 2,267 2,212 2,254 2,326 2,410
PM25 896 874 884 934 862 877 864 879 903 933
CO 41.8K 38.2K 36.1K 30.2K 22.8K 17.5K 13.8K 11.4K 9.8K 8.8K
5.8.2Avalanches An avalanche is weather-related threat that occurs when a mass of snow mixed with ice and debris travels down a mountainside. Avalanches occur in steep mountainous areas of California that receive significant amounts of snow. Avalanches can occur from one or a combination of these components: overloading, temperature, slope angle, snow pack conditions, and vibrations. The most at risk are mountainous areas that have a slope of 25° to 60°.
Avalanches have caused property damage and loss of life in California. Significant events have damaged or destroyed ski resorts at Mt. Shasta and Lake Tahoe. Avalanches have also blocked and damaged roadways. The Plan area lay amongst the highest regions of the State of California. Avalanches can pose a major threat to the communities and SMUD’s or WAPA transmission lines. Secondary impacts may impact SMUD’s customers residing outside of the regions susceptible to avalanches.
5.8.3Droughts and Water Shortages Drought is a gradual phenomenon, occurring slowly over a period of time, caused by a rainfall deficit, and often combined with other predisposing factors. It is difficult to quantify the beginning and ending of a drought. There are four different categories in which a drought can be categorized based on its effects30 (See Table 23).
30 Can be categorized into one, multiple, or all of these categories.
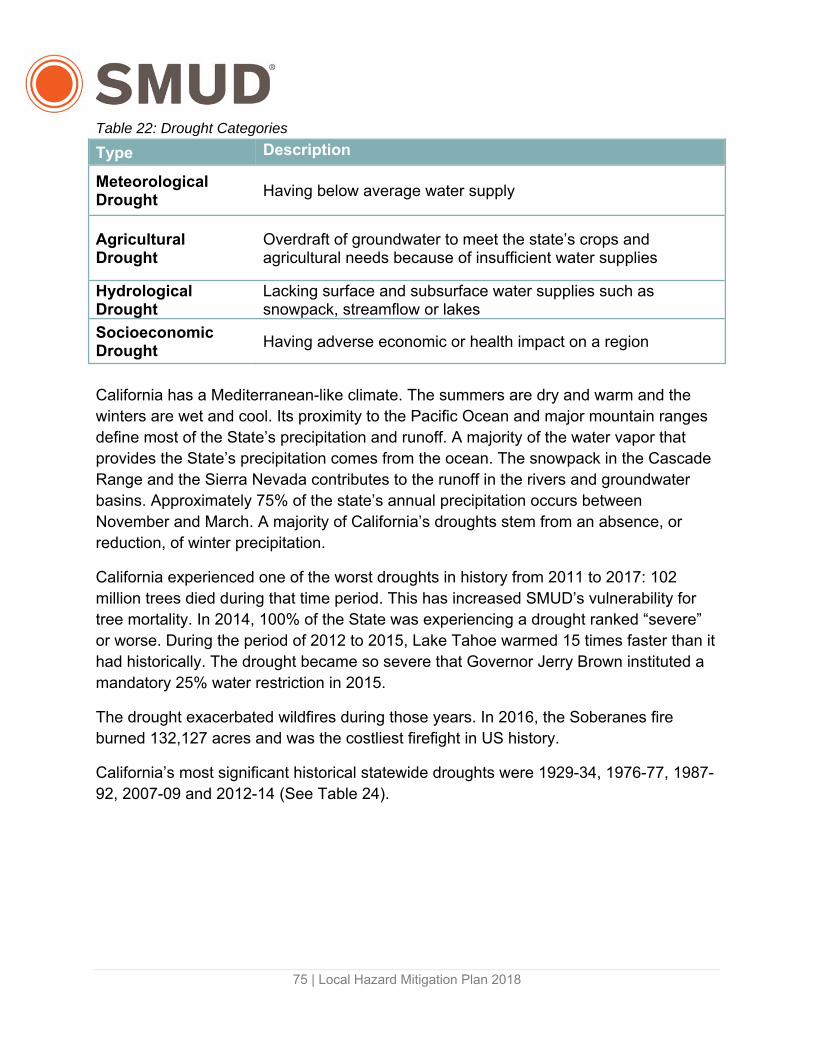
75 | Local Hazard Mitigation Plan 2018
Table 22: Drought Categories
Type Description
Meteorological Drought
Having below average water supply
Agricultural Drought
Overdraft of groundwater to meet the state’s crops and agricultural needs because of insufficient water supplies
Hydrological Drought
Lacking surface and subsurface water supplies such as snowpack, streamflow or lakes
Socioeconomic Drought
Having adverse economic or health impact on a region
California has a Mediterranean-like climate. The summers are dry and warm and the winters are wet and cool. Its proximity to the Pacific Ocean and major mountain ranges define most of the State’s precipitation and runoff. A majority of the water vapor that provides the State’s precipitation comes from the ocean. The snowpack in the Cascade Range and the Sierra Nevada contributes to the runoff in the rivers and groundwater basins. Approximately 75% of the state’s annual precipitation occurs between November and March. A majority of California’s droughts stem from an absence, or reduction, of winter precipitation.
California experienced one of the worst droughts in history from 2011 to 2017: 102 million trees died during that time period. This has increased SMUD’s vulnerability for tree mortality. In 2014, 100% of the State was experiencing a drought ranked “severe” or worse. During the period of 2012 to 2015, Lake Tahoe warmed 15 times faster than it had historically. The drought became so severe that Governor Jerry Brown instituted a mandatory 25% water restriction in 2015.
The drought exacerbated wildfires during those years. In 2016, the Soberanes fire burned 132,127 acres and was the costliest firefight in US history.
California’s most significant historical statewide droughts were 1929-34, 1976-77, 1987-92, 2007-09 and 2012-14 (See Table 24).

76 | Local Hazard Mitigation Plan 2018
Table 23: Historical Droughts in California
Year Duration (years) Description
1929-34 6 Occurred when the state’s urban and agricultural
developments were minimal, therefore the impacts to the economy and community were substantial
1976-77 2 Brief but severe due to the low amounts of precipitation and runoff
1987-92 6 Impacted the entire state of California by almost
completely depleting the State’s major water reserves and projects
2007-09 3 First ever-statewide proclamation of emergency for
drought was issued Water shortages resulted in economic burdens to
agriculture and to rural communities
2012-14 3 Issued California’s second ever-statewide
proclamation of emergency for drought Recorded its lowest annual precipitations in these
three consecutive years In 2015, at the drought’s most severe point, snowpack was estimated to be at 5% of normal levels. The previous lows for snowpack depletion were in 2014 and 1977, each at 25% of normal levels. During a “normal” year, snowpack contributes 30% of California’s water needs31.
Figure 17 below depicts drought intensities from Oct. 2013 to Jul. 2018 compiled by the National Integrated Drought Information System (NIDIS). The drought was at its worst for many months beginning in mid-2014 and extending through the end of 2016. In January of 2017, the multi-year drought abruptly ended with a period of excess rainfall.32
31 Source: California Department of Water Resources 32 This map shows exceptional drought as D4 in dark red, extreme drought as D3 in red, severe drought as D2 in orange, moderate drought as D1 in light orange and abnormally dry as D0 in yellow.

77 | Local Hazard Mitigation Plan 2018
Figure 17: Summary of Drought Intensities in California from 2013 to 2018
Assessment of Vulnerability and Potential Loss
Drought impacts are felt first by people most dependent on annual rainfall – such as ranchers using dryland range or rural residents relying on wells in low-yield rock formations. Drought impacts increase with the length of a drought, as carry-over supplies in reservoirs are depleted and water levels in groundwater basins decline.
The most common secondary effects of drought that is realized by SMUD and those occupants in its plan area are the environmental impacts such as wildfire hazard, increased tree mortality, the reduced availability of surface water, and the loss of biodiversity in the animal and plant species in the area.
The plan area has experienced prior drought conditions in recent years with drought periods recorded in 2007-09, 2000-04, 1987-92, 1975-77 and 1959-61. Table 25 shows

78 | Local Hazard Mitigation Plan 2018
the available data found for most recent drought events available in the NCDC database for the plan area.
Table 24: Selected List of Drought Events in SMUD Plan Area33
County/Zone Date County/Zone Date
Carquinez Strait and Delta
09/01/2015 Carquinez Strait and Delta
06/01/2016
San Joaquin Valley 09/01/2015 Motherlode Camptonville
07/01/2016
Sacramento Valley 09/01/2015 San Joaquin Valley 07/01/2016
Sacramento Valley 10/01/2015 Motherlode Camptonville
08/01/2016
Sacramento Valley 11/01/2015 San Joaquin Valley 08/01/2016
Carquinez Strait and Delta
12/01/2015 Motherlode Camptonville
09/01/2016
Sacramento Valley 12/01/2015 San Joaquin Valley 09/01/2016
Sacramento Valley 04/01/2016 Motherlode Camptonville
10/01/2016
Carquinez Strait and Delta
04/01/2016 Sacramento Valley 10/01/2016
Motherlode Camptonville
04/01/2016 San Joaquin Valley 11/01/2016
Sacramento Valley 05/01/2016 Motherlode Camptonville
11/01/2016
Motherlode Camptonville
05/01/2016 San Joaquin Valley 12/01/2016
San Joaquin Valley 05/01/2016 San Joaquin Valley 01/01/2017
Carquinez Strait and Delta
05/01/2016 San Joaquin Valley 02/01/2017
Sacramento Valley 05/01/2016 Motherlode Camptonville
02/01/2017
San Joaquin Valley 06/01/2016 San Joaquin Valley 03/01/2017
Motherlode Camptonville
06/01/2016 Motherlode Camptonville
03/01/2017
Sacramento Valley 06/01/2016 Intentionally Left Blank
33 Source: NCDC (www.ncdc.noaa.gov) 13 December 2017

79 | Local Hazard Mitigation Plan 2018
Most detrimental to SMUD’s operations and its ability to serve its customers during a drought, is the ability to generate hydroelectric power. A reduction of hydropower generation and water quality deterioration are potential hazards that could affect SMUD during an extended drought period. Droughts have the capacity to affect the following:
Hydropower: lower water levels impact production capacity in hydroelectric plants Biomass: changes in seasonal precipitation patterns can impact vegetation growth,
altering the availability of feedstock for biomass generators.
Table 26 and Figure 18 depict July drought impacts to the SMUD service area and SMUD power plants as defined by the United States drought monitor.34
Table 25: US Drought Monitor Classifications from July 2001-2016 for the SMUD Service Area and SMUD Power Plants
Power Plants Plant Type
2001
2002
2003
2004
2005
2006
2007
2008
2009
2010
2011
2012
2013
2014
2015
2016
SMUD Service Area N/A
Carson Ice‐Gen Project Natural Gas
Cosumnes Natural Gas
McClellan Natural Gas
SCA Cogen 2 Natural Gas
SPA Cogen 3 Natural Gas
Solano Wind Wind
Camino Hydro
Camp Far West Hydro
Jaybird Hydro
Jones Fork Hydro
Loon Lake Hydro
Robbs Peak Hydro
Union Valley Hydro
White Rock/Slab Creek Hydro
No Drought to Abnormally Dry Moderate Drought Severe Drought Extreme Drought Exceptional Drought
*This table provides an overview of the highest drought category that has affected each of the analyzed SMUD assets between
July 2001‐2016. Please note that drought conditions fluctuate from year to year and this table is intended to show the worst
drought conditions that these assets have faced in the past 16 years.
34 Drought shapefiles for July 2001-2016 were downloaded from the U.S. Drought Monitor GIS Data Archive. Available at: http://droughtmonitor.unl.edu/MapsAndData/GISData.aspx

80 | Local Hazard Mitigation Plan 2018
Figure 18: SMUD Plan Area Drought Conditions for July 2016 as Classified by the U.S. Drought Monitor
Current Mitigation Efforts
Based on the results of SMUD’s Climate Readiness Action Plan assessment, SMUD continues to monitor how drought impacts energy generation and commodity costs.
SMUD has a number of initiatives that reduce the risk of water shortages in drought conditions, including the hydro rate stabilization fund that accrues money to purchase replacement power in years with lost hydropower generation and the cooperation of the SPA with the Sacramento Regional County Sanitation District (Regional San) to deliver recycled water from Regional San treatment facilities to be used for cooling and fire protection at the SPA power plant.

81 | Local Hazard Mitigation Plan 2018
Energy Reliability and Resiliency35 Delivery of electricity service has been consistently and highly reliable for most of the century-long development, expansion, and continuous operation of grids across all regions of the Nation. The traditional definition of reliability—based on the frequency, duration, and extent of power outages—may be insufficient to ensure system integrity and available electric power in the face of climate change, natural hazards, physical attacks, cyber threats, and other intentional or accidental damage; the security of the system, particularly cybersecurity, is a growing concern.
Resilience is the ability to prepare for and adapt to changing conditions, as well as the ability to withstand and recover rapidly from disruptions, whether deliberate, accidental, or naturally occurring.36 While resilience is related to aspects of both reliability and security, it incorporates a dynamic response capability to reduce the magnitude and duration of energy service disruptions under stressful conditions. Infrastructure planning and investment strategies that account for resilience typically broaden the range of risk-reduction options and improve national flexibility through activities both pre- and post-disruption, while also focusing on the electricity-delivery outcomes for the consumer.
Vulnerabilities and Assessments
Changes in the climate are expected to bring more frequent and extreme weather conditions. Extreme weather conditions have the potential to decrease the efficiency of thermal power plants and substations, decrease the capacity of transmission lines, render hydropower less reliable, spur an increase in electricity demand, and put energy infrastructure at risk of flooding.
Current Mitigation Efforts
SMUD considers a number of natural hazards during the planning and maintenance stages of its equipment and new infrastructure. This may result in new equipment standards, environmental reviews and risk assessments to help reduce the impacts of the natural hazards of new or existing infrastructure locations.
35 For purposes of this discussion, reliability is the ability of the system or its components to withstand instability, uncontrolled events, cascading failures, or unanticipated loss of system components. Resilience is the ability of a system or its components to adapt to changing conditions and withstand and rapidly recover from disruptions. Security refers specifically to the ability of a system or its components to withstand attacks (including physical and cyber incidents) on its integrity and operations. 36 https://www.energy.gov/sites/prod/files/2017/01/f34/Chapter%20IV%20Ensuring%20Electricity%20System%20Reliability%2C%20Security%2C%20and%20Resilience.pdf
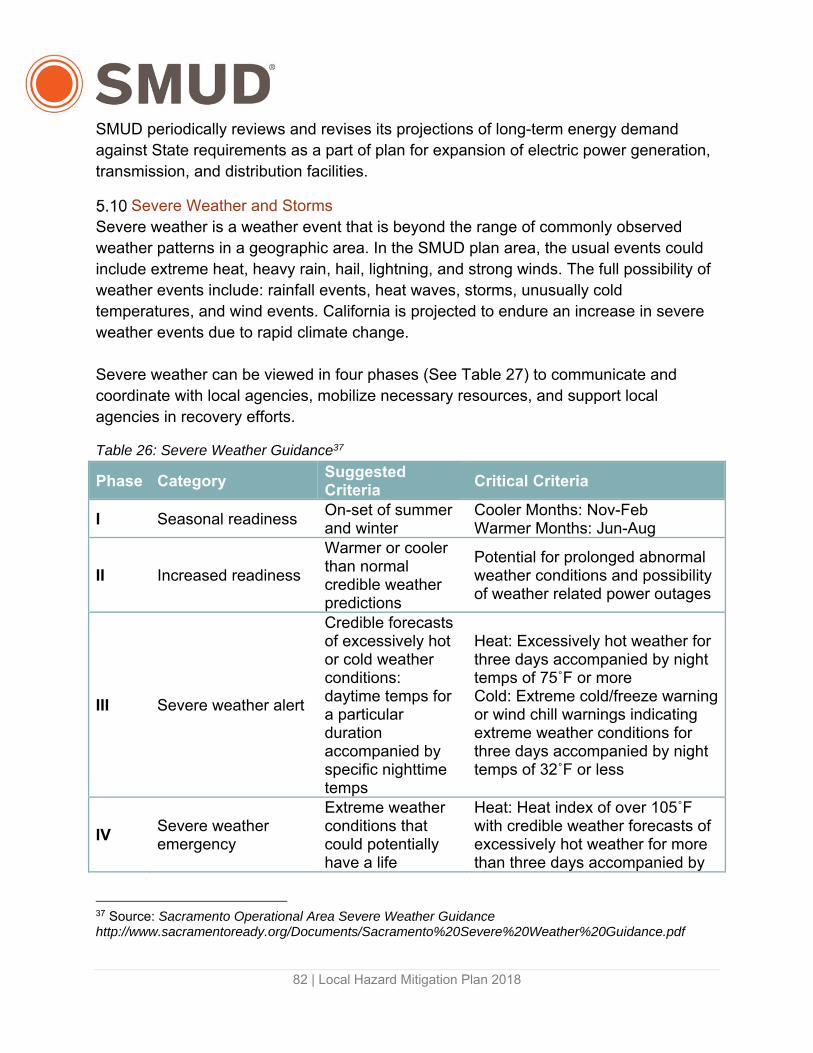
82 | Local Hazard Mitigation Plan 2018
SMUD periodically reviews and revises its projections of long-term energy demand against State requirements as a part of plan for expansion of electric power generation, transmission, and distribution facilities.
Severe Weather and Storms Severe weather is a weather event that is beyond the range of commonly observed weather patterns in a geographic area. In the SMUD plan area, the usual events could include extreme heat, heavy rain, hail, lightning, and strong winds. The full possibility of weather events include: rainfall events, heat waves, storms, unusually cold temperatures, and wind events. California is projected to endure an increase in severe weather events due to rapid climate change. Severe weather can be viewed in four phases (See Table 27) to communicate and coordinate with local agencies, mobilize necessary resources, and support local agencies in recovery efforts.
Table 26: Severe Weather Guidance37
Phase Category Suggested Criteria
Critical Criteria
I Seasonal readiness On-set of summer and winter
Cooler Months: Nov-Feb Warmer Months: Jun-Aug
II Increased readiness
Warmer or cooler than normal credible weather predictions
Potential for prolonged abnormal weather conditions and possibility of weather related power outages
III Severe weather alert
Credible forecasts of excessively hot or cold weather conditions: daytime temps for a particular duration accompanied by specific nighttime temps
Heat: Excessively hot weather for three days accompanied by night temps of 75˚F or more Cold: Extreme cold/freeze warning or wind chill warnings indicating extreme weather conditions for three days accompanied by night temps of 32˚F or less
IV Severe weather emergency
Extreme weather conditions that could potentially have a life
Heat: Heat index of over 105˚F with credible weather forecasts of excessively hot weather for more than three days accompanied by
37 Source: Sacramento Operational Area Severe Weather Guidance http://www.sacramentoready.org/Documents/Sacramento%20Severe%20Weather%20Guidance.pdf

83 | Local Hazard Mitigation Plan 2018
threatening impact on the population, animals, and agriculture
night temps of 75˚F or more Cold: Extreme cold/freeze warnings or wind chill warnings indicating weather conditions that endanger human life with credible weather forecasts of extremely cold/freezing weather for more than three days accompanied by night temps of 32˚F or less
5.10.1 Extreme Heat In the plan area, an extreme heat day is defined as a day between April and October in which the maximum temperature exceeds the historical 98th percentile of maximum temperatures for that given day. Cal-Adapt defines an extreme heat day, specific to SMUD’s plan region as one that exceeds 100˚F. Extreme heat has always plagued Sacramento region and the surrounding areas. However, extreme heat events are now projected to increase in regularity throughout the state of California as a result of climate change. The heat events are projected to be of a greater intensity, longer duration, and have an effect on a broader geographic area.
Extreme heat can also be accompanied by increased humidity. Extreme heat combined with increased humidity can pose a serious threat to human life and the longevity of infrastructure in SMUD’s plan area (See Figure 19). A series of extreme days occurring consecutively is referred to as an extreme heat event. As climate change continues to affect SMUD’s plan area, heat events are becoming more prevalent.

84 | Local Hazard Mitigation Plan 2018
Figure 19: Heat Index Chart and the Potential Effects of Heat on the Body38
Extreme heat ranks as among the deadliest of all natural hazards. Humidity and extreme heat can provoke a quantity of natural hazards such as dust storms and drought. As temperatures increase, it may overload demands for electricity to run air conditioners in homes.
The plan area temperatures could range from moderate to extremely high heat. The warmest times of the year are typically the late summer and early fall. The plan area has suffered occasional heat events. The sudden spike in temperature has great impact to residents inside and outside the plan area and could affect the electric grid. Table 28
38 Source: National Weather Service

85 | Local Hazard Mitigation Plan 2018
depicts available data found for the most recent excess heat events in the NCDC database for the plan area.
Table 27: Recent Extreme Heat Events in SMUD Plan Area39
County/Zone Date Type Death Injuries
Central Sacramento Valley
06/17/2017 Excessive Heat
2 2
Southern Sacramento Valley
06/18/2017 Excessive Heat
6 0
In SMUD’s plan area, Sacramento’s foothill region is at the greatest threat to extreme heat events. The cooling breeze from the California Delta moves the heat from the urban core of the city into the foothills. SMUD has collaborated with the Capital Region Climate Readiness Collaborative to help and identify additional areas suffering from such climate problems, and create a long-term solution.
39 Source: NCDC (www.ncdc.noaa.gov) 13 December 2017

86 | Local Hazard Mitigation Plan 2018
Table 28: Monthly Average and Record Temperatures for Sacramento in Fahrenheit40
Date Average Low
Average High
Record Low
Record High
Average Precipitation
Average Snow
January 41° 55° 19° (1888)
75° (1994) 4.18” N/A
February 45° 62° 21° (1884)
80° (1985) 3.77” N/A
March 47° 67° 29° (1880)
90° (1988) 3.15” N/A
April 50° 74° 34° (1953)
98° (2004) 1.17” N/A
May 54° 82° 26° (1896)
107° (1984) 0.6” N/A
June 58° 89° 43° (1929)
112° (1934) 0.18” N/A
July 61° 94° 47° (1901)
114° (1925) 0.05” N/A
August 61° 93° 48° (1921)
111° (1933) 0.05” N/A
September 59° 89° 44° (1934)
109° (1955) 0.37” N/A
October 54° 79° 34° (1946)
102° (1966) 1” N/A
November 46° 64° 27° (1880)
86° (1966) 2.59” N/A
December 40° 55° 17° (1932)
72° (1979) 2.76” N/A
Due to the impacts of climate change, it is projected that the annual mean temperature for Sacramento will increase by three degrees in the next ten years above the historical average (see figure 20).
40 Source: Intellicast http://www.intellicast.com/Local/History.aspx?location=USCA0967

87 | Local Hazard Mitigation Plan 2018
Figure 20: Historical Annual Mean Temperature for Sacramento41
Assessment of Vulnerability and Potential Loss
Extreme heat has a tendency to not affect infrastructure, as heat events are generally limited in length. Infrastructure gets relief between hot and cool temperature cycles. SMUD’s biggest points of vulnerability are, given an extreme heat event, an overload demand for electricity to run air conditioners in homes and businesses and the safety of its employees in the field.
Extreme heat has a much larger impact on the population and employees in SMUD’s plan area than it does on infrastructure. In California, heat-related events send 4,300
41 Source: Cal-Adapt

88 | Local Hazard Mitigation Plan 2018
people to the emergency room annually, and hospitalize an additional 600 for stays longer than one day. In 2006, 203 deaths were attributed to heat-related events.42
The populations that are most vulnerable to heat-related events include the homeless, infants and children under age five, the elderly, individuals with disabilities, individuals dependent on medical equipment, and individuals with impaired mobility.
5.10.2 Freeze Extreme cold and freeze is most likely to occur during the winter months, and often accompanies a winter storm. Sustained freezes can cause life loss and health risks to vulnerable populations. Economically, freezes can severely affect agriculture in SMUD’s plan area, which affects farmers, farm workers, packers, and shippers of agricultural products. Freezes can also cause significant increases in food prices to the consumer due to shortages.
Table 29:Record Low Temperatures for Sacramento43
Month Temperature Date Month Temperature DateJanuary 19˚ 01/14/1888 July 47˚ 07/03/1901February 21˚ 02/13/1884 August 48˚ 08/30/1887March 29˚ 03/15/1880 September 44˚ 09/18/1882April 34˚ 04/34/1927 October 34˚ 10/30/1935May 37˚ 05/03/1950 November 27˚ 11/28/1880June 43˚ 06/01/1929 December 17˚ 12/11/1932
The NCDC has recorded 22 freeze incidents in SMUD’s plan area since 1993, resulting in $200,000 in property damage and $5MM in crop damage44. In 2013, a six-day freeze event caused more than $440MM in damage to citrus crops throughout the state. Freezes are likely to become less frequent in California as climate change increases average temperatures. According to a California Natural Resources Report from 2009, a significant decrease in freezes could lead to increased incidence of disease as vectors and pathogens do not die off.
Assessment of Vulnerability and Potential Loss
Exposure to extreme cold and freeze can cause frostbite or hypothermia, and be life threatening. The populations most susceptible to the dangers of freeze are infants and the elderly. Regarding infrastructure, pipes may freeze and burst in homes or
42 Source: NRDC https://www.nrdc.org/climate-change-and-health-extreme-heat#/map/detail/CA 43 Source: WRCC 44 Source: NCDC

89 | Local Hazard Mitigation Plan 2018
businesses that have poor insulation. In the most extreme of conditions, freezes can impair communication facilities in SMUD’s plan area. If freeze is intermixed with warm weather cycles, it may result in an increase in avalanche risk. Freezing temperatures are usually coupled with high winds and snow which could cause trees to fall into power lines, leading to damage to the infrastructure, impacting electrical reliability.
5.10.3 Fog Fog is formed when ice crystals and/or water droplets collect, suspended in the air at the earth’s surface. This occurs when the air is cooled to the point that it can no longer contain all of the water vapor it has accumulated. In Sacramento, fog season occurs in the late fall and winter. Fog typically forms in the early morning hours, and it can and will last several days at a time.
Table 30: Fog Events in Sacramento County45
Event Date Deaths Injuries Property Damage
Crop Damage
Dense Fog 12/11/1997 5 26 $1.5MM $0Dense Fog 12/18/1998 1 10 $500,000 $0Dense Fog 12/20/1999 0 2 $120,000 $0Dense Fog 01/3/2001 0 0 $0 $0Dense Fog 12/8/2015 0 0 $0 $0
Total 6 38 $2.1MM $0
It is currently unclear if climate change will have a future effect on fog in the Sacramento area. Winter fog has been on the decline in recent decades.46
Fog in the Sacramento area can reduce visibility to mere feet. This can lead to multi-car accidents and have devastating effects on transportation corridors. Severe fog can close roads, cause accidents, and impair the effectiveness of emergency responders. SMUD’s employees are required to drive heavy equipment in order to conduct work. Increased fog increases risks for drivers and electric workers by limiting visibility.
5.10.4Severe Thunderstorms, Hail, and Lighting A thunderstorm is considered severe when it either contains three-quarters of an in.-sized hail or winds in excess of 57.5 mph (this includes tornadoes). Severe storm events are most prominent during the fall, winter, and spring. The Sacramento County averages 18.15 in. of rainfall per year.
45 Source: NCDC 46 Baldocchi and Waller, 2014. https://doi.org/10.1002/2014GL060018

90 | Local Hazard Mitigation Plan 2018
Hail is created when water droplets are carried upwards, above the freezing level. The droplets freeze, becoming too heavy for the updraft to carry, and fall to the ground. Hail is usually less than two in. in diameter, but it can fall at speeds of 120 mph.
Lightning is a visible electrical discharge cause by a thunderstorm. Lightning can strike as far as five to ten miles from the storm, in areas authorities may not consider to be a direct threat.
Table 31: Severe Weather Events in Sacramento County Since 195047
Event Type Number of
Events Deaths Injuries
Property Damage
Crop Damage
Hail 7 0 0 $11,030 $0 Heavy Rain 18 0 1 $365,000 $50,000Lightning 1 0 0 $150,000 $0 Assessment of Vulnerability and Potential Loss
Severe storms can cause flooding as well as drainage issues in the Sacramento area. Severe storms also put many assets at risk, as flooding combined with strong winds can down very mature trees.
Hailstorms can destroy roofs, buildings, automobiles, vegetation, and SMUD assets.
Lighting can kill or injure employees and people in SMUD’s plan area. Assets and infrastructure can also be struck directly. These strikes could result in a burn, explosion, or total destruction. Lightning can also lead to wildfire if it strikes the surface in a dry region with vegetation high in fuel.
5.10.5 Winds, Tornadoes, and Hurricanes The National Weather Service (NWS) defines “high winds” as sustained wind speeds of 40 miles per hour (mph) or greater lasting for one hour or longer, or winds of 58 mph or greater for any duration. High winds can lead to funnel clouds and tornadoes during severe storms. Damages from tornadoes are a result of high wind velocity and wind-blown debris accompanied by lightning or large hail. Each year, an average of 800 tornadoes occurs nationwide, resulting in an average of 80 deaths and 1,500 injuries (National Oceanographic and Atmospheric Administration, 2002).
47 Source: NCDC

91 | Local Hazard Mitigation Plan 2018
Wind speeds during a tornado can reach 300 mph. Unlike hurricanes, which can also produce such wind speeds over great geographic areas, tornadoes are confined to much smaller areas over short distances. SMUD’s plan area is at a low risk for tornadoes, relative to the rest of the United States. When tornadoes have occurred historically, they have done so at low intensity on the Fujita Tornado Scale48. However, if a tornado were to affect the area, it would be in the late fall or early spring.
Hurricanes have never hit California in recorded history, as tropical storms blow from east to west. Climate change could change this tendency, and whether patterns should be monitored as waters continue to warm off the Pacific Coast.
Assessment of Vulnerability and Potential Loss
SMUD’s plan area is at a low risk of hazardous levels of high winds, relative to other areas of the country (See Figure 21). However, high winds are a seasonal occurrence that will continue to occur annually in the plan area.
48 Official measure in which tornado intensity is classified

92 | Local Hazard Mitigation Plan 2018
Figure 21: Wind Zones in the United States49
Fallen trees from high winds in SMUD’s plan area can damage buildings as well as critical structures, including electrical overhead lines, leading to secondary impacts from fire and power outage. The most recent high wind and storm events occurred in January and February 2017 causing fallen trees and power outages in SMUD service territory. A selection of recorded high wind events can be found in table 33 below.
49 Source: FEMA
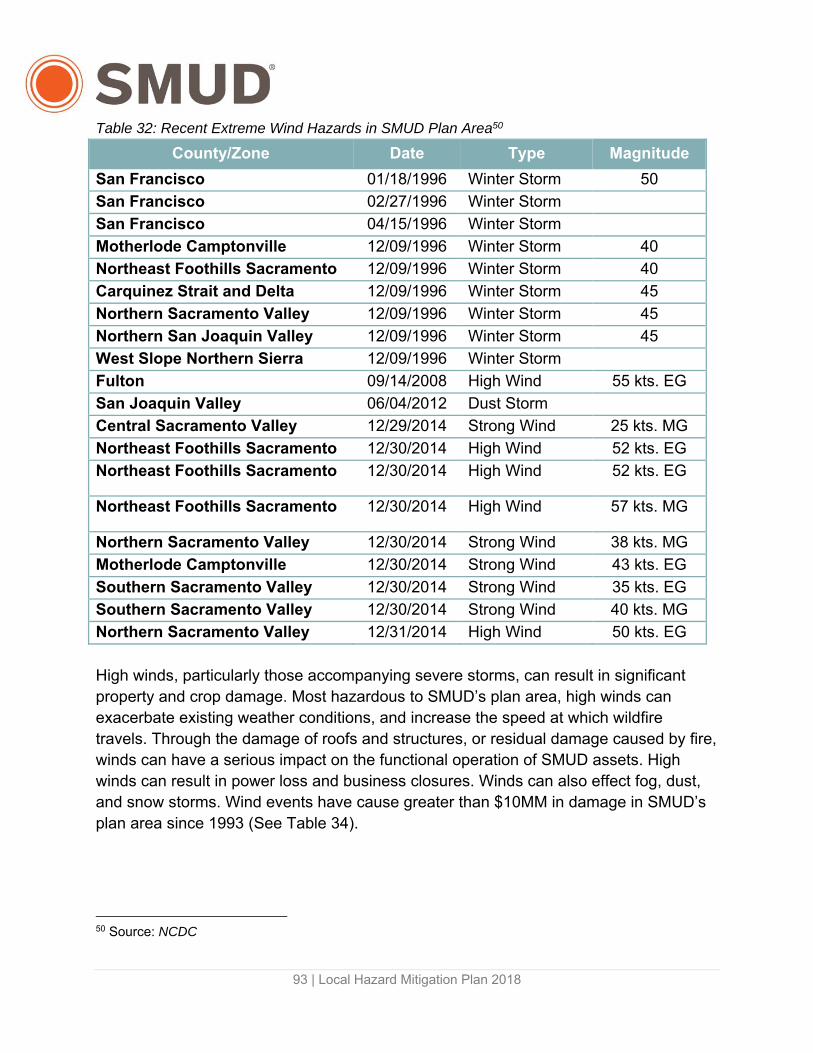
93 | Local Hazard Mitigation Plan 2018
Table 32: Recent Extreme Wind Hazards in SMUD Plan Area50
County/Zone Date Type Magnitude
San Francisco 01/18/1996 Winter Storm 50
San Francisco 02/27/1996 Winter Storm
San Francisco 04/15/1996 Winter Storm
Motherlode Camptonville 12/09/1996 Winter Storm 40
Northeast Foothills Sacramento 12/09/1996 Winter Storm 40
Carquinez Strait and Delta 12/09/1996 Winter Storm 45
Northern Sacramento Valley 12/09/1996 Winter Storm 45
Northern San Joaquin Valley 12/09/1996 Winter Storm 45
West Slope Northern Sierra 12/09/1996 Winter Storm
Fulton 09/14/2008 High Wind 55 kts. EG
San Joaquin Valley 06/04/2012 Dust Storm
Central Sacramento Valley 12/29/2014 Strong Wind 25 kts. MG
Northeast Foothills Sacramento 12/30/2014 High Wind 52 kts. EG
Northeast Foothills Sacramento 12/30/2014 High Wind 52 kts. EG
Northeast Foothills Sacramento 12/30/2014 High Wind 57 kts. MG
Northern Sacramento Valley 12/30/2014 Strong Wind 38 kts. MG
Motherlode Camptonville 12/30/2014 Strong Wind 43 kts. EG
Southern Sacramento Valley 12/30/2014 Strong Wind 35 kts. EG
Southern Sacramento Valley 12/30/2014 Strong Wind 40 kts. MG
Northern Sacramento Valley 12/31/2014 High Wind 50 kts. EG
High winds, particularly those accompanying severe storms, can result in significant property and crop damage. Most hazardous to SMUD’s plan area, high winds can exacerbate existing weather conditions, and increase the speed at which wildfire travels. Through the damage of roofs and structures, or residual damage caused by fire, winds can have a serious impact on the functional operation of SMUD assets. High winds can result in power loss and business closures. Winds can also effect fog, dust, and snow storms. Wind events have cause greater than $10MM in damage in SMUD’s plan area since 1993 (See Table 34).
50 Source: NCDC
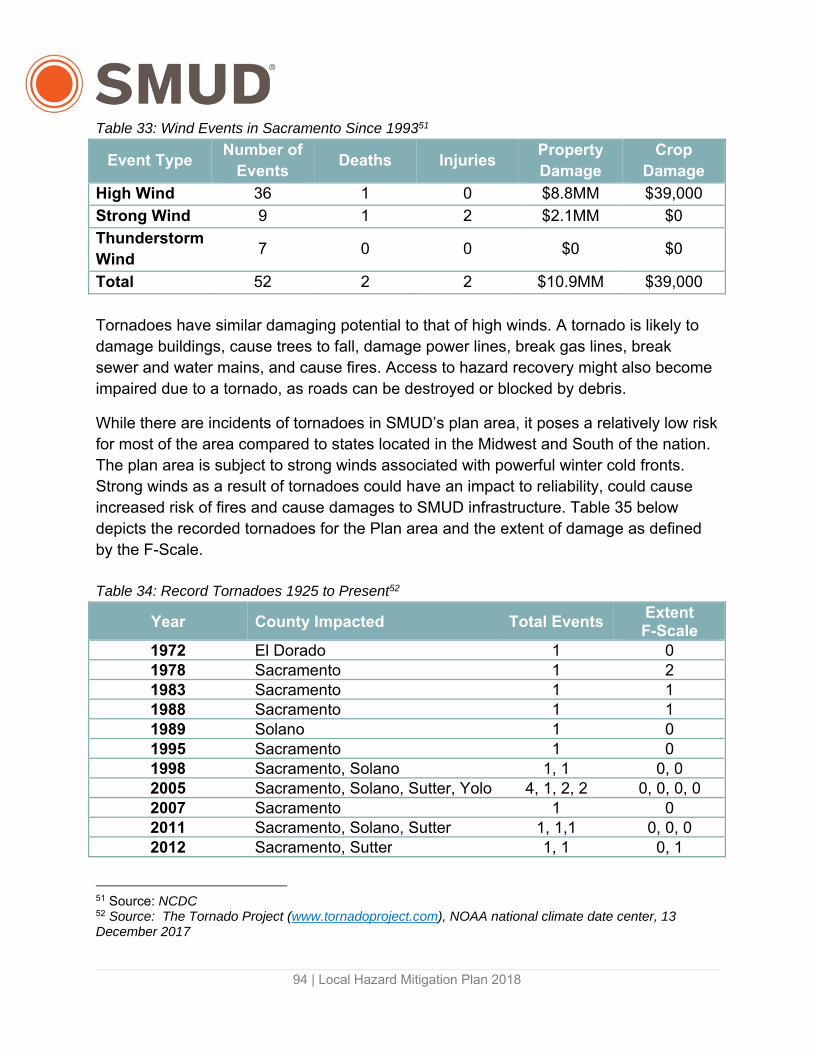
94 | Local Hazard Mitigation Plan 2018
Table 33: Wind Events in Sacramento Since 199351
Event Type Number of
Events Deaths Injuries
Property Damage
Crop Damage
High Wind 36 1 0 $8.8MM $39,000
Strong Wind 9 1 2 $2.1MM $0
Thunderstorm Wind
7 0 0 $0 $0
Total 52 2 2 $10.9MM $39,000
Tornadoes have similar damaging potential to that of high winds. A tornado is likely to damage buildings, cause trees to fall, damage power lines, break gas lines, break sewer and water mains, and cause fires. Access to hazard recovery might also become impaired due to a tornado, as roads can be destroyed or blocked by debris.
While there are incidents of tornadoes in SMUD’s plan area, it poses a relatively low risk for most of the area compared to states located in the Midwest and South of the nation. The plan area is subject to strong winds associated with powerful winter cold fronts. Strong winds as a result of tornadoes could have an impact to reliability, could cause increased risk of fires and cause damages to SMUD infrastructure. Table 35 below depicts the recorded tornadoes for the Plan area and the extent of damage as defined by the F-Scale. Table 34: Record Tornadoes 1925 to Present52
Year County Impacted Total Events Extent F-Scale
1972 El Dorado 1 01978 Sacramento 1 21983 Sacramento 1 11988 Sacramento 1 11989 Solano 1 01995 Sacramento 1 01998 Sacramento, Solano 1, 1 0, 02005 Sacramento, Solano, Sutter, Yolo 4, 1, 2, 2 0, 0, 0, 02007 Sacramento 1 02011 Sacramento, Solano, Sutter 1, 1,1 0, 0, 02012 Sacramento, Sutter 1, 1 0, 1
51 Source: NCDC 52 Source: The Tornado Project (www.tornadoproject.com), NOAA national climate date center, 13 December 2017

95 | Local Hazard Mitigation Plan 2018
Current Mitigation Efforts
SMUD mitigates extreme heat by protecting its outdoor workers. SMUD provides adequate water, shade, rest breaks, training, and emergency procedure to ensure the safety of its employees. Employees are constantly evaluated for signs and symptoms of heat illness, especially in temperatures greater than 95˚F. SMUD also has many demand response programs in place to handle peak load during extreme heat events and the increased use of air conditioning.
SMUD mitigates freeze through the use of warning systems and demand response programs to handle peak load during an increase in the use of electric heating systems.
SMUD mitigates high wind events through wind engineering design and construction of its assets, according to state, federal, and industry standards.
To mitigate severe weather and storm events, SMUD crews assist in maintaining clear channels, canals and creeks by removing weeds and debris that can halt water flow during severe weather incidents. SMUD holds drills to rehearse floodgate closures to ensure a rapid response during an emergency.
5.10.6 Tree Mortality Tree mortality refers to the premature death of trees due to factors such as drought-induced water stress, bark beetles, and high tree density. Increased tree mortality elevates fuel loads, creates hazardous conditions for firefighting personnel, decreases production rates of fire line construction, poses risk of injury and damage from falling branches, and financially impacts property owners. In the trailing seven years, 129 million trees have died in California. This frequency is expected to increase due to continued climate change. A growth in the rate in the rate of tree mortality can affect local, regional, and global carbon budgets53. Table 36 below depicts the estimated number of trees that have died each year since 2010.
53 Living trees take in carbon dioxide while dead trees release carbon dioxide.

96 | Local Hazard Mitigation Plan 2018
Table 35: Estimated Cumulative Number of Dead Trees in California54
Year Estimated Number of
Dead Trees2010 3.1 million2011 1.6 million2012 1.8 million2013 1.3 million2014 3.2 million2015 29 million2016 62 million2017 27 millionTotal 129 million
Figure 22 below depicts the tree mortality per acre in Northern California.
Figure 22: 2017 Aerial Detection of Tree Mortality in Northern California55
54 Source: CalFire 55 Source: Department of Forestry and Fire Protection

97 | Local Hazard Mitigation Plan 2018
Assessment of Vulnerability and Potential Loss
Increased wildfire risk associated with tree mortality has resulted in a major reorganization of the forest’s ecosystem. SMUD’s plan area is expected to see a decline in forest productivity, a change in species composition, a shift to smaller sized trees, and a reduction in forest extent in some regions.
Current Mitigation Efforts
Table 36: Current Tree Mortality Risk Mitigation
Mitigation Description
CalFire Partnership with California Natural Resource Agency, Caltrans and California Energy Commission (CEC)
Identify areas of the state that represent high-hazard zones for falling trees and wildfire Identify potential storage location for removed trees Use the dead trees as biomass energy
Vegetation management program
SMUD trims most trees on a fixed interval, and faster growing trees on a more frequent interval SMUD identifies dead and dying trees, as a part of its vegetation management program, for removal
Technological Hazards Technological hazards originate from dangerous procedures, infrastructure failures or specific human activities that may cause the loss of life or injury, property damage, social and economic disruption or environmental degradation.
Technological Hazards is a blanket term for the proceeding hazards: Hazardous materials spills, oil spills, natural gas pipelines, radiological hazards.
5.11.1 Hazardous Materials Release Hazardous materials have properties that make them potentially dangerous and harmful both to human health and the environment. Hazardous material includes one or more of the following: flammable, corrosive or an irritant, oxidizing, explosive, toxic, thermally unstable or reactive, or radioactive material. An accidental hazardous material release can occur wherever hazardous materials are manufactured, stored, transported or used. There could also be incidents of intentional hazardous release either from terrorist activities or nuisance. Depending on the substance involved, the release may affect nearby population and may contaminate critical or sensitive environmental areas within the Plan area.
98 | Local Hazard Mitigation Plan 2018
The release of hazardous materials to the environment could cause a multitude of problems that can be discussed in a general manner. The significance of the problems to the environment, property, or human health is dependent on the type, location, quantity, concentration, physical, chemical and/or infectiousness of the material released. Although hazardous material incidents can happen almost anywhere, certain areas of the state are at higher risk. Jurisdictions near roadways that are frequently used for transporting hazardous materials and jurisdictions with industrial facilities that use, store, or dispose of such materials all have increased potential for major mishaps, as do jurisdictions crossed by certain railways, waterways, airways, and pipelines.
Releases of explosive and highly flammable materials have been known to cause fatalities and injuries, necessitate large-scale evacuations, and destroy millions of dollars’ worth of property. Toxic chemicals in gaseous form have been known to cause injuries and fatalities among emergency response teams and passersby. When toxic materials have entered either surface or ground water-supplies, serious health effects have resulted. Releases of hazardous chemicals have been especially damaging when they have occurred in highly populated areas or along heavily traveled transportation routes.
Assessment of Vulnerability and Potential Loss
SMUD’s plan area is a mix of urban, suburban, and rural areas. Military bases and former military bases located in SMUD’s plan area must be considered as potential sources for hazardous material releases. When a hazardous material emergency occurs, multiple resources are available, with the local fire departments leading response activities. SMUD’s plan area contains major transportation arteries, such as U.S. 50; Interstates 5, 80, and Capital City Freeway; State Highways 12, 16, 99, 104, and 160; the Union Pacific Railroad; and airports including the Executive and Sacramento International, McClellan and Mather Airfields, and Stockton Metropolitan Airport; each facilitating the transport of hundreds of thousands of tons of hazardous materials through and into SMUD’s plan area each year. SMUD is highly exposed to the effects of a major catastrophic hazardous material emergency due to the proximity of the transportation routes to densely populated areas. Additionally, SMUD must be concerned with the Port of Sacramento, even though it is located in Yolo County, because prevailing winds are from the southwest. Considerations must be made also for the numerous agriculturally related businesses located within the response/mutual aid area.
SMUD’s plan area contains major oil terminals, pumping facilities, and numerous large diameter underground pipelines. Agriculture uses large quantities of pesticides and chemicals that are stored at numerous sites. Fixed facilities are limited to small

99 | Local Hazard Mitigation Plan 2018
industrial parks within or near the incorporated cities. Air transportation of hazardous materials involves the smallest quantities but still poses a potential hazard.
Petrochemicals, pesticides, herbicides, and other toxins are stored in quantity (more than 55 gallons or 500 pounds) for agricultural use at many warehouse, business and farm storage locations in the plan area. There are also numerous underground storage tank facilities for flammable liquids throughout SMUD’s plan area.
Current Mitigation Efforts
SMUD owns and/or operates several potential sources of hazardous materials releases. SMUD follows all Federal and Cal OSHA regulations relating to the use, storage, and disposal of all hazardous materials. SMUD has on file a Material Safety Data Sheet for each hazardous material on site. Employees are trained to respond to leaks, spills, and discharges. All SMUD facilities are addressed in the Business Plans prepared by the Safety, Health & Environmental Department.
5.11.2 Oil Spills An oil spill is a release of liquid petroleum into the environment due to human activity or technological error that results in the pollution of land, water, or air. Oil spills can also occur naturally through oil seeps on land or underwater. Depending on the size, origin, and duration of the release, an oil spill can have serious impacts on air and water quality, public health, plant and animal habit, and biological resources. The cleaning and remediation of a spill can cost millions of dollars and the environmental and social impacts can last for many years. Common causes of oil spills include human-caused mistakes, equipment malfunctions or destruction, natural disasters, terrorism, and illegal dumpers.
Assessment of Vulnerability and Potential Loss
SMUD equipment and facilities utilizes mineral and natural ester oils to operate. These equipment and facilities are located on land and could be near waterways. However, SMUD is at very low-risk for the likelihood of an oil spill event because of existing mitigations.
SMUD’s plan area is land-locked, and not susceptible to underwater seeps or disasters related to drilling. The most likely oil spill hazard that threatens SMUD’s plan area is one in which a human-caused mistake results in a release of oil during transportation.

100 | Local Hazard Mitigation Plan 2018
Current Mitigation Efforts
Table 37: Current Technological Hazards Risk Mitigation
Mitigation Description
Vulnerability Assessment SMUD regularly assesses its water supply, oil, and natural gas pipelines for potential failure during an earthquake event.
EOC SMUD maintains an EOC to help coordinate real-time incident command, response, and recovery from all emergencies, including those resulting from oil spills.
Regional Agency Response Coordination
Focus on active participation in city, county, and state emergency management structures for assuring coordinated responses to emergencies.
5.11.3 Natural Gas Pipeline Hazards SMUD owns and operates 76 linear miles of natural gas pipelines. Natural gas from these pipelines is required to operate SMUD’s thermal power plants and to help SMUD meet its load serving capability (LSC). SMUD’s pipelines are located in or around communities where people work and live. In operating the pipelines, safety is SMUD’s top priority. SMUD is committed in protecting the people, environment and communities along these pipelines.
Assessment of Vulnerability and Potential Loss
SMUD’s gas pipelines are fewer and newer as compared with other utilities. However, in the event of a gas pipeline breach, impacts could result in total loss of assets up to and including loss of life.
Increasing population growth in urban areas is resulting in a greater number of people living and working more closely to existing gas transmission pipelines. The age and gradual deterioration of the gas transmission system, due to natural causes, is further compounding the risk of potential disaster. Causes of and contributors to pipeline failures include: construction errors, material defects, internal and external corrosion, operational errors, control system malfunctions, outside force damage, subsidence, and seismicity.
Current Mitigation Efforts
The Department of Transportation’s Pipeline and Hazardous Materials Safety Administration (PHMSA) is the primary safety regulator of the pipeline system. Its regulations and safety standards address a variety of issues affecting pipeline safety, including pipe and component manufacture, how pipelines are built, operated, maintained and inspected, how personnel are trained, and how companies respond to emergencies, among others.

101 | Local Hazard Mitigation Plan 2018
SMUD meets and exceeds all regulatory requirements. Staff implements detective controls through line patrols and leak detection systems, process controls through participation in the USA North 811 system (call before you dig) and engineering controls such as remote operating valves with line break systems to respond to gas leaks. These controls are implemented to ensure public safety and prevent compromise to SMUD’s gas systems.
SMUD is a member of USA North, the Northern California organization that administers the USA North program for all operators of buried infrastructure and excavators. USA North provides a free damage prevention service to protect citizens, the community, the environment, essential public services, and underground facilities in Central and Northern California and all of Nevada. USA North notifies SMUD of any excavation that may occur on or near our buried infrastructure. SMUD’s participation in this organization helps to reduce the risk of damage to SMUD’s infrastructure and increases public safety.
5.11.4 Nuclear Hazards Nuclear hazard is referred to as the risk or danger to any living species or environment posed by radiation emanating from the atomic nuclei of a given substance. The effects of radioactive pollutants depend upon the properties of the pollutant, but the most significant effect is the potential for long-term health effects to individuals exposed to radioactive effluents.
Assessment of Vulnerability and Potential Loss
SMUD owns the decommissioned Rancho Seco Nuclear Generating Station. Spent fuel is stored onsite in the Independent Spent Fuel Storage Installation (ISFSI) awaiting the DOE direction to move it to an appropriate facility. Rancho Seco is located in Sacramento County, 25 miles southeast of the City of Sacramento and 26 miles northeast of the City of Stockton, the two largest cities within a 50-mile radius of the site. The site occupies approximately 14 ac of the SMUD owned 2480 ac, which is flat to rolling terrain. The nearest population center of 25,000 or more is the city of Elk Grove, which is about 11 miles northwest of the site. State Route 104 runs north of the site in an east-west direction. Route 104 connects with U.S. Route 99 and Interstate 5 to the west and State Routes 88 and 12 to the east.
The area near Rancho Seco is sparsely populated and is used primarily as grazing land and grape vineyards. The only public use facility within a 5 mile radius of the site is the Rancho Seco Reservoir and Recreation Area, which is located approximately 1 mile southeast of the site and is within the land owned by SMUD. There is no indication of geological faulting at the site.

102 | Local Hazard Mitigation Plan 2018
The risk that radiation exposure as a result of long-term storage of nuclear waste at Rancho Seco may result in environmental, health and safety risks is extremely low.
Incidents that lead to a breach of spent fuel canister integrity are unlikely to occur. The ISFSI Safety Analysis Report (SAR) discusses the design criteria and accident analysis criteria for the spent fuel storage system. It identifies potential incidents such as fires associated with combustible materials, loss of contamination control, natural phenomena, and external human caused events such as terrorism. The ISFSI SAR provides an analysis of the following incidents: human caused events, earthquake, fire, tornado, flood, lightning, and snow loads. The result of these analysis state that there are no credible events that would result in the exposure of the general public, outside of the ISFSI licensed area, above the limits stated in the regulation.
Current Mitigation Efforts
Table 38: Current Radiological Risk Mitigation
Mitigation Description
Rancho Seco site-specific emergency plan
In the event of an emergency occurring at Rancho Seco, the site-specific Emergency Plan will be implemented. Response includes activating emergency response facilities; making formal notifications to District management, Nuclear Regulatory Commission, and Sacramento County Office of Emergency Operations; response and recovery activities.
Bird Strike
Bird strike is defined as a collision between an airborne animal and a manmade vehicle or structure such as power lines, towers, wind turbines or aircrafts. A bird strike can cause very serious damage to the structure and they usually occur during low altitude flights, takeoffs, and landings.
Assessment of Vulnerability and Potential Loss
SMUD owns and operates a number of wind turbine facilities located in Solano County. Collisions between wildlife and turbines often occur, causing detriment to the wildlife as well as damages to SMUD facilities. In addition to damages, collisions between wildlife and infrastructure can also be a threat of power disruption. SMUD’s infrastructure traverses the Pacific flyway for migratory birds. Since 1990, 2,812 bird strike incidents have been reported in Sacramento County56. For SMUD, the most common collisions occur between birds and its wind turbines.
56 All reported by the FAA. All aircraft strikes.
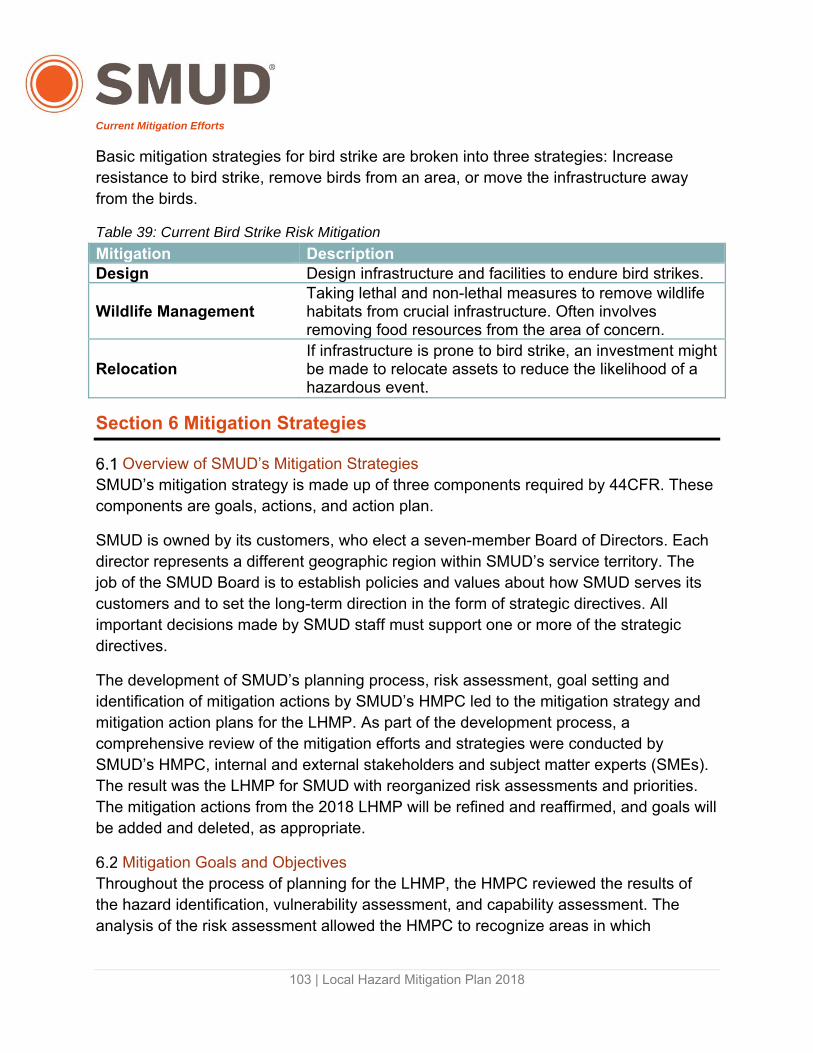
103 | Local Hazard Mitigation Plan 2018
Current Mitigation Efforts
Basic mitigation strategies for bird strike are broken into three strategies: Increase resistance to bird strike, remove birds from an area, or move the infrastructure away from the birds.
Table 39: Current Bird Strike Risk Mitigation
Mitigation DescriptionDesign Design infrastructure and facilities to endure bird strikes.
Wildlife Management Taking lethal and non-lethal measures to remove wildlife habitats from crucial infrastructure. Often involves removing food resources from the area of concern.
Relocation If infrastructure is prone to bird strike, an investment might be made to relocate assets to reduce the likelihood of a hazardous event.
Section 6 Mitigation Strategies
Overview of SMUD’s Mitigation Strategies SMUD’s mitigation strategy is made up of three components required by 44CFR. These components are goals, actions, and action plan.
SMUD is owned by its customers, who elect a seven-member Board of Directors. Each director represents a different geographic region within SMUD’s service territory. The job of the SMUD Board is to establish policies and values about how SMUD serves its customers and to set the long-term direction in the form of strategic directives. All important decisions made by SMUD staff must support one or more of the strategic directives.
The development of SMUD’s planning process, risk assessment, goal setting and identification of mitigation actions by SMUD’s HMPC led to the mitigation strategy and mitigation action plans for the LHMP. As part of the development process, a comprehensive review of the mitigation efforts and strategies were conducted by SMUD’s HMPC, internal and external stakeholders and subject matter experts (SMEs). The result was the LHMP for SMUD with reorganized risk assessments and priorities. The mitigation actions from the 2018 LHMP will be refined and reaffirmed, and goals will be added and deleted, as appropriate.
Mitigation Goals and Objectives Throughout the process of planning for the LHMP, the HMPC reviewed the results of the hazard identification, vulnerability assessment, and capability assessment. The analysis of the risk assessment allowed the HMPC to recognize areas in which

104 | Local Hazard Mitigation Plan 2018
improvements could be made, and provided a framework for the HMPC to create goals and objectives to develop new mitigation strategies for SMUD’s plan area.
Daily operations and decision-making is delegated by SMUD’s Board of Directors to the General Manager and Chief Executive Officer, who along with other members of the Executive Team establish guidelines for SMUD activities. The most prominent guideline set by the Executive Team is the SMUD 3.0 North Star, which contains six priority areas that govern decision-making at SMUD and are the guidelines for our mitigation goals. The top priority area in the star is Be Safe Always, which has a direct relationship to hazard mitigation. The statement attached to this principle is “We make every move a safe one for employees, our customers, and our community”. This commitment at the executive level to safety is critical for a special district such as SMUD whose primary activity is the generation and delivery of electricity. Not only is the generation and transmission of electricity an inherently hazardous activity, but using stored water in mountainous terrain under pressure as the means of electrical generation expands the hazard. Projects must advance one of more of the North Star priority areas, which include:
• Be Safe Always • Value Customers and Community • Financially Fit • Sustainable Future • Operational Excellence • Treasure our Employees SMUD management, departments, and employees recognize, value, and support projects that ensure a well-planned, coordinated, efficient, and rapid response in the event of an emergency to protect the lives, environment, and property of the citizens and communities in communities where our assets and operations reside.
6.2.1Risk Prioritization SMUD’s LHMP leverages its existing ERM framework to identify and determine the hazards that SMUD is most vulnerable to. The ERM framework takes into considerations impacts to SMUD’s finances, legal, regulatory and compliance, operations, reputation, public safety and workforce. All hazards that are addressed in this plan have the capability of damaging SMUD’s assets and operation in the plan area, but wildfire, drought, flood and climate change are the most crucial.
6.2.2Existing Mitigation Strategies In order to identify and select mitigation actions that needed to have additional practices implemented, or changed, the HMPC began by prioritizing hazards that were of high risk to SMUD’s plan area. Hazards of high risk were those in which current mitigation

105 | Local Hazard Mitigation Plan 2018
actions needed to be re-analyzed, and it needed to be decided if additional mitigation actions could be implemented using SMUD’s current technological capabilities. Low-priority hazard risks are often mitigated using mitigation actions of less specificity than those of high-priority hazards.
Once priority was determined, the HMPC analyzed additional actions that supported the identified goals and objectives of the LHMP. The HMPC utilized examples of potential mitigation actions from a variety of other agencies. Preventative mitigation alternatives were discussed for each hazard, and additions were made to the existing strategies as deemed necessary.
6.2.3 Mitigation Plan Planning and prioritization of projects at SMUD is performed through a variety of mechanisms. High level guidance is provided in SMUD’s 5-Year Strategic Plan (Plan), which represents a balance between the strategies, projects, programs, and other initiatives aimed at ensuring SMUD’s success in an evolving energy industry. Goals and initiatives referenced in the Plan translate into more specific, action-oriented policies or projects and thus serve as a framework for achieving the intent of the Plan.
From this and other forms of guidance, individual asset managers, such as the UARP Asset Manager, must prepare a 3-Year Budget Plan that identifies operations and maintenance (O&M) and capital projects that are anticipated over the course of the next three years. The 3-Year Budget Plan is reviewed by the respective business area Directors and is recommended to the Executives, then the Board for final approval.
The priority associated with each project during each budget cycle is dependent on a number of factors that affects the relative importance of a project in any given year. Projects are either mandatory or discretionary and their inclusion in any given year’s plan is based on regulatory requirements or their relationship to SMUD’s guiding principles.
SMUD also evaluates projects across SMUD to ensure Operational Excellence to customers. This essentially translates into our Project Portfolio Management, which seeks to coordinate and align SMUD-wide resource allocation and operations over a 2-3 year planning horizon. A group of leaders from across SMUD, called the Operational Alignment Team (OAT), meets regularly to select the overall portfolio of projects, both mandatory and discretionary, track progress throughout the year, and approve significant changes.
Each of these activities (OAT meetings, departmental planning, and project reviews) employ the same prioritization process that results in the general project classifications

106 | Local Hazard Mitigation Plan 2018
of high, medium, and low priority projects. The criterion for the three priority categories includes the following:
High priority project criteria Needed to promote safety and protect the lives of SMUD workers and the public Needed to protect SMUD infrastructure and public property Risks are tied to recent disasters and expected to worsen under climate change Strong public support Viewed favorably or required by regulatory agencies Strongly tied to the maintenance of electric stability and reliability Clear and concrete long-term and lasting benefits Highly favorable benefit/cost ratio Supported by pilot projects and/or other successful applications
Medium Priority Project Criteria Enhancements to safety and protection of lives, but not absolutely needed Enhancements to the protection of SMUD infrastructure and public property Risks are not strongly tied to recent disasters and climate change Moderate public support Viewed as neutral by regulatory agencies Uncertain and theoretical duration of benefits Neutral benefit/cost ratio No pilot projects or other successful applications
Low Priority Project Criteria Limited relationship to safety and the protection of SMUD workers and the public Limited value in the protection of SMUD infrastructure and public property Minimal to no public support Risk are not associated with historical disasters and not affected by climate change No regulatory requirement Cost does not justify the benefits achieve from project deployment
Section 7 Plan Review and Implementation
Reviewing Progress on Mitigation Goals SMUD’s ERM Office (ERMO) (along with various associated business units) will monitor the implementation of each hazard mitigation, and the progress made towards the goals of the, evolving, LHMP. To standardize the monitoring of the LHMP goals, status updates of its specific goals will be integrated into the existing ERM program activities.

107 | Local Hazard Mitigation Plan 2018
The ERMO is responsible for coordinating periodic discussions with stakeholders to perform a review of mitigations and consider whether mitigations need to be reestablished and/or are still relevant to the corresponding potential hazards.
It is important to note that addressing potential hazards requires viewing hazard mitigation strategies as long-term practices. However, these hazard mitigation strategies have a necessity to constantly evolve and become enhanced due to the growing threat of climate change and the speed of technological advances. Climate change is expected to increase the rate of, and exacerbate hazards. This may require the adoption of new technology and the innovation of new mitigation techniques. SMUD will need to constantly integrate the growing impacts of climate change into the LHMP’s hazard mitigation strategies. It is possible that efforts to reduce risk in the short-term may actually increase risk in the long-term.
Implementation SMUD carries the primary responsibility for implementing and updating hazard mitigation strategies. The LHMP is a living document that will be revised and improved over time to increase its effectiveness in implementing and properly tracking mitigation strategies. Staff will leverage SMUD’s existing planning process in the implementation of this LHMP.
Section 8 Plan Adoption and Maintenance
Plan Adoption SMUD operates under the oversight and guidance of its Board of Director. As part of the process of creating and implementing the LHMP, a preliminary version of this plan was presented to the Board of Directors on (date). Following input from the Board, the LHMP was then submitted to Cal OES and ultimately to FEMA for review and acceptance.
Within approximately eight weeks of FEMA’s pre-approval of the LHMP, the final plan will be presented to SMUD’s Board of Directors during a regularly scheduled meeting for formal adoption.
Plan Maintenance SMUD will update the LHMP, formally, every five years. Additionally, SMUD will be tracking the mitigation efforts at regular, informal, intervals. All of the maintenance of the LHMP will be in accordance with the DMA 2000.
The ERMO is responsible for initiating plan maintenance, and tracking status updates of installed mitigation efforts and changing threats in SMUD’s plan area. Following a hazard event, the ERMO will revisit the plan to ensure mitigation strategies are being implemented as stated and to discuss possible future changes to the LHMP. The next

108 | Local Hazard Mitigation Plan 2018
formal plan update for the SMUD LHMP will occur five years from the date that this LHMP is approved by Cal OES and FEMA.
8.2.1 Continued Public Involvement SMUD is committed to public participation. All SMUD Board meetings are open to the public and the public is invited to comment at these meetings. The public will continue to be involved when the LHMP is updated. Prior to adoption of formal updates, SMUD will provide the opportunity for the public to comment on the updates.
8.2.2 Plan Maintenance Evaluation Process Evaluation of progress will be recognized by monitoring changes in the hazard risk-potentials that have been identified previously in the LHMP. Changes in risk-potential can be denoted as:
Increased hazard risk-potential as a result of a new development57. Increased hazard risk-potential as a result of a changed mitigation strategy. Decreased hazard risk-potential as a result of the success of a mitigation
strategy.
Updates to the LHMP will include the above changes in risk-potential as well as:
Recognizing new hazards that arise in SMUD’s plan area. Utilizing new data or studies on current and/or future hazards. Incorporating new capabilities in mitigating specific hazards. Incorporating newly acquired assets and all growth and development of current
infrastructure.
Updates to the LHMP will also be made to accommodate for actions that have failed or are not considered feasible after a review of their consistency with the established progress markers.
Incorporation into Existing Business Planning Process An important implementation mechanism is to incorporate the recommendation into existing business processes. The hazards outlined in this LHMP will be one factor in risk assessments and review of projects and initiatives for SMUD and will be integrated into the project planning, budget, and risk assessment process.
57 Be it naturally occurring or human-caused.

109 | Local Hazard Mitigation Plan 2018
Section 9 Mitigation Plan Point of Contact
Name: Toni Hoang Title: Enterprise Risk Manager Address: 6301 S Street Sacramento, CA 95817 Telephone: (916) 732-6532 Email: [email protected]
Section 10 Appendices
Appendix A SMUD Board of Directors Adoption Resolution (This section will be updated once the document is adopted by the Board)
Appendix B Planning Process Documentation
B.1 Planning Committee Meetings Documentation (This section will be updated before being sent to Cal OES/FEMA)
1. EROC meeting 1 2. EROC meeting 2 3. May HMPC kick-off meeting agenda, presentation, minutes 4. July HMPC follow up, agenda, presentation, minutes 5. August HMPC final meeting
B.2 Public Notices and Press Releases (This section will be updated before being sent to Cal OES/FEMA)
1. Public notice from Toni Stelling 2. Screen shot of web-page 3. October 2nd FACM agenda and notice

110 | Local Hazard Mitigation Plan 2018
Appendix C Mitigation Action Implementation Plans
C.1 Mitigation Action Implementation Plans
Hazard Title Priority Owner Possible Funding Source
Description Status
Climate change
Capital Region Climate Readiness Collaborative (CRCRC)
High Research and Dev.
Electrical rates
SMUD continues to participate in the CRCRC to develop and grow its memberships to address regional impacts of climate change
On-going
Energy reliability and resiliency
Sacramento Resilient Grid Initiative
High Distribution Operations and Maint.
REDI grant
Installation and commissioning of 12 automated 69 kV swtichecs with reinforced poles and SCADA in selected flood prone areas. The purpose is to improve grid resiliency by implementing smart grid technologies and strategies that increase grid availability, improves grid efficiency and increases reliability.
2017-2019
Energy reliability and resiliency
AB327/More than SmarGrid Modernization Research
High Distribution Operations and Main.
Electrical rates; grants
This boardens distribution planning efforts to consider DER alternatives when cost effective in comparison to traditional projects and includes distribution infrastructure deferral demonstrations using DER
2018-2020
Fire Community Education
High SMUD Electrical rates
Continue to educate private property owners about the dangers of vegetation near distribution lines and service drops
On going
Flood hazards; Dam safety
Dam Safety Project
High Power Gen.
Electrical rates
Two primary activities: (1) a Dam Potential Failure Mode Analysis, and (2) an independent consultant assessment.
2018
Severe storms
UARP Culvert Replacement Project
High Power Gen.
Electrical rates; grant funding
Upsize or replace culverts in UARP
2017-2019
Bird strikes Avian Protection Plan
Medium Env. Services
Electrical rates
A plan and permit that identifies avian risks and mitigation measures with the intent to reduce avian mortality rates from SMUD’s operations.
2018-2019

111 | Local Hazard Mitigation Plan 2018
Hazard Title Priority Owner Possible Funding Source
Description Status
Climate change
Focused Climate Research
Medium Research and Dev.
Electrical rates
Staff are participating in California’s Fourth Climate Assessment, which is producing regional reports for the first time, and the Governor’s Integrated Climate Adaptation and Resiliency Program (I-CARP) Technical Advisory Council to maintain awareness of the latest peer-reviewed research findings.
2018-2019
Climate change; Extreme heat
Regional Urban Heat Island Initiative
Medium CRCRC SB-1 Funding $500,000
Undertake an advance study of heat generation abd movement throughout the region
2018-2020
Env. protection
SMUD Nature Preserve Mitigation Bank
Medium Env. Services
Electrical rates
SMUD continues to monitor a multi-species/multi-habitat mitigation bank that provides for long-term protection of special-status species and habitats found within SMUD's service territory
On going
Extreme heat SMUD Cool Roof Incentive
Medium Customer Electrical rates
Incentive programs for SMUD customers
On-going
Fire hazards; Tree mortality; Energy reliability and resiliency
Forest Thinning, Stream and Revenue Flows and UARP
Medium Vegetation Mgmt.
Electrical rates; grants
This work is to improve the safety of mountain communities expand water resources and reduce smoke and air quality impacts associated with catastrophicwildfires. There is a proposed ten year study to better understand the long-term impact of potential changes in forest management practices.
On-going
Fire, Geological hazards
Wildland Fire Mitigation through Fuels Reduction for Sacramento and El Dorado County
Medium Vegetation Mgmt.
Electrical rates; grant funding
Fuel reduction treatments including thinning, brushing, removal of forest slash and mastication along the full extent of the project corridors
2018-2020

112 | Local Hazard Mitigation Plan 2018
Hazard Title Priority Owner Possible Funding Source
Description Status
Fire; Severe storms
New Services Medium SMUD Electrical rates
Encourage cities in SMUD's plan area to underground key power lines and new developments to include underground power lines.
On going
Flood hazards
Flood Data Climate Exposure Evaluation
Medium Grid Assets Electrical rates
SMUD is conducting a levee breach study to identify assets likely to be affected by a number of breach scenarios updated in the last year by the City and County of Sacramento
2018-2019
Severe storms
Underground Distribution Line
Medium Grid Assets
Electric rates; local funding; grant funding
Convert overhead distribution lines to underground lines
2017-2040
Severe storms
Public Outreach
Medium SMUD Electrical rates
Encourage critical facilities in the SMUD plan area to have backup power and emergency operations plans to deal with power outages.
On going
Tree mortality; Extreme heat; Energy reliability and resiliency; Env. protection
SMUD Shade Tree Program
Medium Customer Electrical rates
Program encouraging residents to strategically plant shade trees around their home to reduce energy consumption.
On-going
Climate change Env. protection
Regional Bio sequestration
Medium Research and Dev.
Electrical rates; private investors
Public-private partnerships (with landtrusts, open space conservatives or private landowners) to leverage carbon offset protocols and create new revenue streams and other incentives to preserve and expand land-based carbon storage
On going
Earthquake Seismic Vulnerability
Low SMUD Electrical rates; grants
Consider seismic vulnerability assessments, and develop mitigation strategies for seismic retrofit of critical utility infrastructure identified as particularly vulnerable.
On going

113 | Local Hazard Mitigation Plan 2018
Hazard Title Priority Owner Possible Funding Source
Description Status
Fire; Severe storms
Systems Upgrade
Low Grid Assets Electrical rates; grant
Upgrade lines and poles to improve wind loading, underground critical lines, and add interconnect switches to allow alternative feed paths and disconnect switches to minimize outage areas.
On going

114 | Local Hazard Mitigation Plan 2018
Appendix D Table of Acronyms Acronym Definition Cal OES California Governor’s Office of
Emergency ServicesFEMA Federal Emergency
Management AgencySMUD Sacramento Municipal Utility
DistrictHMGP Hazard Mitigation Grant
Program PDM Pre-Disaster Mitigation
Assistance Program FMA Flood Mitigation Assistance
Program FMAG Fire Management Assistance
Grant PA Public Assistance DMA 2000 Federal Disaster Mitigation
Action of 2000 Annexation Plan
El Dorado County LHMP Annex
MJ-LHMP Multi-jurisdictional Local Hazard Mitigation Plan
LHMP Local hazard mitigation planHMPC Hazard Mitigation Planning
Committee EROC Enterprise Risk Oversight
Committee CUEA California Utilities Emergency
Association SOC State Operations CenterMOU Memorandum of
understanding UOC Utility Operations CenterREOC Regional Emergency
Operations Center SEMS Standardized Emergency
Management SystemCRC Capital Region Climate
Readiness CollaborativeEDCFSC El Dorado County Fire Safe
Council FFSC Folsom Fire Safe CouncilNATF North American Transmission
Forum CPUC California Public Utility
Commission PDP Peer Development PanelUARP Upper American River ProjectEAP Emergency Action PlanFERC Federal Energy Regulatory
Commission GPO Gas pipeline operations
Acronym Definition USFS United States Forest ServiceBLM Bureau of Land ManagementCalFire California Department of
Forestry and Fire ProtectionkWh Kilowatt hours MW Megawatts kV Kilovolt SD Strategic DirectionsGHG Greenhouse gas GWh Gigawatt hour cfs Cubic feet per secondft. Feetac-ft. Acre feet PG&E Pacific Gas and Electric
Company WTG Wind turbine generatorsSRCSD Sacramento County
Sanitation District SFA SMUD Financing Authority
(Cosumnes Power Plant)CVFA Central Valley Financing
Authority (Carson Cogeneration Project)
SCA Sacramento Cogeneration Authority (Procter & Gamble Cogeneration Project)
SPA Project Sacramento Power Authority (Campbell Soup Cogeneration Project)
SPA McClellan Sacramento Power Authority (McClellan Gas Turbine)
WAPA Western Area Power Administration
Dth Dekatherm COTP California Oregon
Transmission ProjectCOI California-Oregon IntertieTANC Transmission Agency of
Northern California UCS Union of Concerned ScientistsFPRP Fire Prevention and
Response Plan IOU Investor owned utilitiesUAS Unmanned aerial systemsFIS Geographic Information
Systems EOC Emergency Operation CenterSRA State responsibility areaFR3 Fire retardant insulating fluidIR Infrared

115 | Local Hazard Mitigation Plan 2018
Acronym Definition NCDC National Climatic Data CenterSAFCA Sacramento Area Flood
Control Agency in, Inch FIRM Flood Insurance Rate MapUSGS United States Geological
Survey DOE Department of EnergyTACs Toxic air contaminantsNIDIS National Integrated Drought
Acronym Definition Information System
NWS National Weather Servicemph Miles per hour ISFSI Independent Spent Fuel
Storage Installation SAR Safety Analysis ReportERM Enterprise risk managementERMO Enterprise risk management
office