local government Energy efficiency and Renewable Energy ...
54
LOCAL GOVERNMENT ENERGY EFFICIENCY AND RENEWABLE ENERGY STRATEGY STATUS QUO REPORT
Transcript of local government Energy efficiency and Renewable Energy ...

LOCAL GOVERNMENT
ENERGY EFFICIENCY AND
RENEWABLE ENERGY
STRATEGY
STATUS QUO REPORT

2 | P a g e
Prepared by Sustainable Energy Africa (SEA) - Section 21 (not for profit) company on behalf of the South
African Local Government Association (SALGA)
Contact Megan Euston-Brown
Postal address 9B Bell Crescent Close, Westlake, 7945, Cape Town
Physical address 9B Bell Crescent Close, Westlake, 7945, Cape Town
Telephone (021) 702 3622
Facsimile (021) 671 1409
E-mail [email protected]

3 | P a g e
Contents LIST OF ACRONYMS AND ABBREVIATIONS ........................................................................................................ 4
Introduction and background ............................................................................................................................ 6
Part I: Municipal Energy Status Quo Report ...................................................................................................... 8
1. An overview of local level energy work in South African cities and towns ........................................... 8
2. Legal framework and alignment with national policy ......................................................................... 11
3. The municipal energy picture .............................................................................................................. 14
3.1 State of the data and data protocols ................................................................................................. 14
3.2 Local energy demand, supply and related carbon emissions ............................................................ 17
3.3 Sector breakdowns ............................................................................................................................ 19
4. Energy access ....................................................................................................................................... 25
4.1 Universal access to electricity, backlogs in delivery and pro poor policies ....................................... 25
4.2 Household Energy Use Patterns ........................................................................................................ 27
5. Energy efficiency and Demand Side Management .............................................................................. 31
5.1 Potential impact of interventions in terms of energy savings on a Municipal level ......................... 31
5.2 Potential impact of interventions in terms of effective demand management for municipalities .. 32
5.3 Potential impact of efficiency on electricity sales at a Municipal level ............................................. 32
5.4 Municipal ‘own’ consumption ........................................................................................................... 34
5.5 Management of losses....................................................................................................................... 36
6. Renewable Energy ............................................................................................................................... 36
7. Municipal sustainable energy development underway ...................................................................... 37
Conclusion: Strategic Issues to be addressed .................................................................................................. 41
References ....................................................................................................................................................... 43
Appendix 1: Compilation of EE and RE work underway amongst municipalities represented within the
consultation process ........................................................................................................................................ 45
Appendix 2: Objectives, priorities and possible actions or intervention Programmes as emerging from the
municipal consultation process ....................................................................................................................... 48
Appendix 3: Full data sets with data source .................................................................................................... 53

4 | P a g e
LIST OF ACRONYMS AND ABBREVIATIONS
ADAM Approach to Distribution Asset Management AMEU Association of Municipal Electricity Utilities ANC African National Congress BRT Bus Rapid Transit CFL Compact Fluorescent Lamp/Light COGTA National Department of Cooperative Governance and Traditional Affairs DEA National Department of Environmental Affairs DHS National Department of Human Settlements DoE National Department of Energy (formerly known as Department of Minerals and Energy –
DME) DoT National Department of Transport DORA Division of Revenue Act DSM Demand Side Management DTI Department of Trade and Industry DWA National Department of Water Affairs EE Energy Efficiency EEDSM Energy Efficiency and Demand Side Management Programme EPWP Expanded Public Works Programme ERA Electricity Regulation Act (2006) ESCO Energy Savings Company FBAE Free Basic Alternative Energy FBE Free Basic Electricity FET Further Education and Training GBCSA Green Building Council of South Africa GHG Greenhouse Gas GIZ Deutsche Gesellschaft für Internationale Zusammenarbeit (German International
Corporation) GJ Gigajoule GVA Gross Value Added HPS High Pressure Sodium HVAC Heating, Ventilation and Cooling IBT Inclining Block Tariff ICLEI Local Government for Sustainability IDM Integrated Demand Management IDP Integrated Development Plan IMESA Institute of Municipal Engineering of Southern Africa INEP Integrated National Electrification Programme IRP Integrated Resource Plan IRPTN Integrated Rapid Public Transport Network KPI Key Performance Indicator KPA Key Performance Area KSD King Sabata Dalindyebo Municipality LED Light Emitting Diode LED Local Economic Development LG Local Government LPG Liquefied Petroleum Gas M&V Measurement and Verification MCEP Manufacturing Competitiveness Enhancement Programme MFMA Municipal Finance Management Act MIG Municipal Infrastructure Grant

5 | P a g e
MISA Municipal Infrastructure Support Agency NEEAP National Energy Efficiency Action Plan NBI National Business Initiative NCPP National Cleaner Production Programme NGO Non-governmental Organisation NERSA National Energy Regulator of South Africa NLTA National Land Transport Act NMBMM Nelson Mandela Bay Metropolitan Municipality NMT Non-Motorised Transit NRS National Regulatory Standard NT National Treasury NT TAU National Treasury Technical Assistance Unit PFMA Public Finance Management Act PPP Public Private Partnership PSEE Private Sector Energy Efficiency PTIG Public Transport Infrastructure Grant PTNOG Public Transport Network Operations Grant PTOG Public Transport Operations Grant PTSAP Public Transport Strategy and Action Plan PV Photovoltaic RE Renewable Energy REBID Renewable Energy Bids REIPPP Renewable Energy Independent Power Procurement Programme RSA Republic of South Africa RTSSA Rural Transport Strategy for South Africa SABS South African Bureau of Standards SACN South African Cities Network SAGEN South African – German Energy Programme SALGA South African Local Government Association SANEDI South African National Energy Development Institute SANS South African National Standards SAPIA South African Petroleum Industry Association SARPPGC South African Renewable Power Plants Grid Code SDC Swiss Agency for Development and Cooperation SDF Spatial Development Framework SEA Sustainable Energy Africa SEED Sustainable Energy for Environment and Development SETA Services Sector Education and Training Authority SIPS Strategic Integrated Projects SSEG Small Scale Embedded Generation StatsSA Statistics South Africa SWH Solar Water Heater TSA Taxi Scrapping Allowance V-NAMA Vertically Integrated Nationally Appropriate Mitigation Action

6 | P a g e
Introduction and background
The Swiss Agency for Development and Cooperation (SDC) has been supporting the implementation of
energy efficiency interventions in South Africa through the ‘Energy Efficient Building Programme2010 –
2013’. The programme is committed to supporting South Africa to contribute to the reduction of
greenhouse gas (GHG) emissions in South Africa through energy efficiency interventions at policy,
monitoring, research, training and implementation. The South African Local Government Association
(SALGA) has, through agreement, partnered with the SDC to facilitate implementation of the local
government part of the Programme.
The local government component of this programme has involved the development of energy efficiency
strategies and implementation plans in 5 pilot municipalities; institutional capacity assessments in relation
to the pilot municipalities’ role with respect to energy efficiency; knowledge sharing and the development
of communication structures related to energy efficiency between the national and local level. This work
has specifically related to five pilot municipalities, but the intention of this final output, a SALGA Municipal
Energy Efficiency and Renewable Energy Strategy, is to draw together national learnings and experience
towards supporting all municipalities across the country in taking this work forward.
Substantial local level energy work is underway across the country, however this has been predominantly
focussed within the larger cities and towns, and is also currently addressed on a voluntary and ad hoc basis.
There is an expressed need from municipalities for clarification and guidance as to what is required in the
area of energy efficiency and renewable energy development from the local level. This strategy aims to
address this need.
The Draft National Energy Efficiency Action Plan of the Department of Energy (DoE, 2013), notes that
efficiency must be undertaken primarily by end users (residents, businesses) and encourages sectors and
other spheres of governance to develop their own plans towards national efficiency targets1. The National
Climate Change Response Policy (DEA, 2011), Section 10.2.6 recognises the important role of municipal
government in meeting the challenges of climate change, including areas relating to energy service
delivery. This strategy development aims to support these national goals.
Given the call from national government for local government to contribute to climate mitigation and
efficiency targets, it also seems useful and necessary to begin to draw up a clear picture of the potential
contribution that can be made at the local level and assess the support required to realise this potential.
Importantly, this strategy will also ensure that the specific experience of local government, their particular
challenges and opportunities, are brought to the fore, so that support programme can be strategically
directed.
A diagnostic report by the National Treasury Technical Assistance Unit (NT TAU, 2013) on barriers and
challenges to implementing climate change projects at the regional and local level concludes:
1 Development of a first Draft of a National Energy Efficiency Action Plan (NEEAP) for the RSA, Draft 5, DoE, 2013, p 9
and 56: this recognises the role of sub-national government and includes for action the development of an action plan to support municipal action.

7 | P a g e
“The need for change has been acknowledged. Interviewees overwhelmingly agreed that the emergence of
a new geopolitical order and production-consumption system, at the global level has started to expose the
structural rigidities of resource intensive economies. The old resource intensive economic system is
breaking down and a different economic system is emerging; one that values resource efficiency and low
carbon alternatives of production-consumption. It is likely that, in the interim, the socio-economic system
will become increasingly volatile and therefore, it is imperative that local government is empowered to
deliver its service delivery objectives under the changing conditions.”
Section 154(1) of the Constitution of South Africa (1996) tasks both national and provincial government
with supporting and strengthening the capacity of municipalities to manage their own affairs, exercise their
powers and perform their functions. This strategy aims to provide a clear programme of action for local
government, to promote energy efficiency and renewable energy development in line with national policy
direction and within local governance mandates. It is also designed to provide a clear programme of action,
to be led by SALGA, to those tasked with strengthening the capacity of municipalities to undertake this
work.
A cornerstone of the strategy development process has been engagement and consultation with the
country’s municipalities via the SALGA Provincial offices. Despite challenges facing local government, the
commitment, passion and calibre amongst local government officials and leaders working in this newly
unfolding arena must be acknowledged. Valuable, pioneering energy efficiency and renewable energy work
is already underway within South African municipalities. The Strategy development process has drawn
extensively on this work and experience.
Local level consultation also made it clear that energy efficiency and renewable energy, at the local
governance level, cannot simply be seen as a technical issue, but must be addressed in the context of
service provision, in which ensuring sustainability of municipal revenue and electricity service delivery,
addressing poverty and access to energy services, and stimulating local economic development is
paramount. The strategy developed here aims to reflect these municipal priorities.
This Strategic framework document includes:
Part I) a Status Quo Report and
Part II) a Municipal Energy Efficiency and Renewable Energy Strategic Framework/Programme of action
document.
This latter document provides an indication/ outline of key energy efficiency and renewable energy areas
for local government to address as well as an outline of key areas of support work to be taken forward by
SALGA (in partnership with relevant national departments and key stakeholders) in order to enable, and
facilitate, local government ability to address energy efficiency and renewable energy.

8 | P a g e
Part I: Municipal Energy Status Quo Report
1. An overview of local level energy work in South African cities and towns
Since democracy, there has been a substantial shift in energy policy in South Africa, influenced also by new
global forces, that has brought local government into the energy domain. It is useful to trace these shifts in
order to understand the need arising for greater strategic direction and support for local government to
continue to meet its service delivery objectives within these new parameters. It is also important to
recognise and build on pioneering municipal energy work underway, where much has been learnt through
a ‘learning by doing and sharing’ approach.
A period of transition
Historically the energy sector in South Africa focussed almost entirely on the supply side of energy and on
issues of energy security, with little attention being given to demand side and sustainability issues – where
was energy being used, by whom, for what and how could these needs be met in a manner that would
promote social, economic and environmental sustainability.
New thinking across the globe – coming together at the Rio World Summit on Sustainable Development –
began to highlight the enormity of the environmental resource challenges facing the world, along with the
persistence of poverty and inequality in resource allocation. It also noted the primary role of local (and in
particular urban) government, given that world population growth is massively concentrated in the urban
areas of developing countries.
This period coincided with the democratic transition in South Africa and the developmental mandate given
to the new, unified, system of local government (as articulated in the Municipal Systems Act of 2000). This
identified local government as a key platform for redistribution, predominantly through equitable service
delivery.
Sustainability issues began to be brought onto the energy agenda by university research teams, NGOs and
community representatives2. This saw its way into the energy policy of the ANC, and then the new
government, post 1994, in the Energy White Paper (1998) and Energy Act (2008). These policies required
that energy direction in the country address energy poverty, energy security, development and
environmental issues. The major drive of national government in addressing the environment and poverty-
related energy issues has been the globally award-winning Integrated National Electrification Programme
(INEP), the Free Basic Electricity/Alternative energy policies and the development of Energy Efficiency and
Renewable Energy Strategies and related Programme.
Many of these programmes relate to energy demand (on-ground consumption). These new approaches
have brought the issue of energy planning strongly into the domain of local government. This is well
illustrated by unpacking the role of local government within the 8 Key Objectives of the draft National
Integrated Energy Plan, 2013, as illustrated below.
Table 1: Local Government powers and functions relevant to achieving national energy objectives
8 Key National Integrated Energy Objectives Related municipal mandates, or functions (schedules 4
2 Ward, S, The New Energy Book, 2008.

9 | P a g e
(Draft National Integrated Energy Plan, 2012)
and 5, Constitution of RSA 1996; Municipal Systems Act, Municipal Services Act)
1. Ensure the security of supply Electricity reticulation; Free Basic Alternative Energy
2. Minimise the cost of energy Electricity reticulation (tariff setting, cross subsidisation); Human settlements (housing delivery); Public transport (limited); Non-motorised transport;
3. Increase access to energy Electrification; Free Basic Alternative Energy; Human Settlements (thermal efficiency); Public transport; Spatial planning
4. Diversify supply sources and primary sources of energy
Electricity reticulation; Waste management
5. Minimise emissions from the energy sector
Electricity reticulation; Building codes and planning approval
6. Promote energy efficiency in the economy
Manage public facilities; Building codes and development approval; Air quality management; Electricity distribution
7. Promote localisation and technology transfer and the creation of jobs
Local economic development
8. Promote the conservation of water Water service delivery
It is increasingly apparent that national government requires strong support from local government to
meet national objectives in energy and related environment and economic development targets and this
has been recognised in recent policy and plans, such as the Department of Environment’s National Climate
Response White Paper (2011), and the Department of Energy’s National Energy Efficiency Action Plan
(2013) and IRP 2010 Update Report (2013).
Another development that brings energy into the local government domain is market forces that are
rendering rooftop PV to be a financial proposition. This means that households or businesses can produce
electricity to meet a substantial amount of their consumption needs. Although this development is likely to
be slow in reaching sizeable proportions, it requires a radical re-think as to how electricity distribution
businesses, and municipal revenue models, are configured. And while mass take up is likely to be slow,
installations are already underway, with municipalities receiving applications for grid-feed in on a regular
basis. Thus, municipalities have to establish procedures and systems now, or run the risk of dangerous and
illegal connections becoming widespread; and these procedures need to ensure service delivery
sustainability into the future.
Capacity development for local sustainable energy development
A number of organisations and programmes have contributed to the development of local level
engagement with energy efficiency and renewable energy. In 1998 Sustainable Energy Africa (SEA) set up
the SEED (Sustainable Energy for Environment and Development) Programme, which ultimately became the
City Energy Support Unit Programme of SEA. This work pioneered the development of energy data reports
for cities (State of Energy reporting) and Energy and Climate Change Strategy development. It has
supported a learning network amongst municipalities working in this area, for over fifteen years, building
capacity through ‘learning by doing’ and sharing of experience amongst officials, regional and national
departments and stakeholders.
In the early years of 2000, ICLEI ran a three year Cities for Climate Protection Programme, which looked at
internal municipal energy consumption and supported pilot projects with efficient or renewable energy
alternatives. ICLEI Africa is now running the Urban-LEDS Programme, supporting the development of low
carbon strategies amongst ‘secondary’ city partners.

10 | P a g e
The SA Cities Network has always included a sustainability component within its member cities. Energy
indicators form part of the SACN State of Cities reporting and the organisation is also involved in on-ground
studies relating to renewable energy development and energy efficiency and led the 2009 City Renewable
Energy Summit. Recently the SACN have published a Consolidation of Lessons Learnt for EE and RE
Initiatives within Cities: Development of a Roadmap for Future Uptake3.
The South African Local Government (SALGA) has long been a key partner within the INEP Programme, and
has recently included an Energy Efficiency component to its infrastructure/services work. Provincial SALGA
capacity is also developing around this aspect of energy development. With SDC support SALGA has been
actively supporting the development of EE/RE strategies amongst five pilot ‘secondary’ cities.
The Association for Municipal Electricity Utilities (AMEU, established 1915), is an association of municipal
electricity distributors as well as other organisations (academic, state-owned enterprises, commercial) that
have a direct interest in developing quality electricity supply services in Southern Africa.
The Department of Energy (DoE) has worked on the global award-winning Integrated National
Electrification Programme (INEP) with municipal distributors, since the INEP Programme inception, and has
also run local rollout of the ‘Basa Njenga Magogo’ smokeless stove Programme. In 2009 the DoE began its
first efficiency programme with local government with the inception of the DORA-funded Municipal Energy
Efficiency and Demand Side Programme. This provides funding to municipalities to engage with public
lighting, water pumps and water heating efficiency. It has also funded the rollout of local solar water
heating projects.
The Department of Cooperative Governance and Traditional Affairs established the Municipal
Infrastructure Support Programme via the Municipal Infrastructure Support Agency (MISA), in 2011, to
provide technical capacity support to facilitate infrastructure development via the Municipal Infrastructure
Grant, towards improved service delivery in municipalities.
3 SA Cities Network, Consolidation of Lessons Learnt for EE and RE Initiatives within Cities, prepared by Aurecon, 2013.

11 | P a g e
2. Legal framework and alignment with national policy
City governments have a central role to play in managing energy consumption and GHG emissions. They
can incentivize energy efficiency; promote renewable energy use and public transport. Indirectly they can
influence city energy use through urban planning and economic development. Cities are substantial energy
users across civic amenities and services and can provide leadership through reducing their own GHG
emissions. However, the powers and functions of local government set out in the Constitution are not
explicit about the energy dimension of these roles and responsibilities and mandates to act in this regard
have often been reliant on interpretation and political endorsement by a proactive leadership.
Pioneering cities in South Africa believe the mandate to act with regard to energy and climate is implicit in
the objectives of local government and the powers and functions accorded to local government in the
Constitution (1996), the White Paper on Local Government (1998) and Municipal Systems Act (2000). The
most recent legal opinion developed on this is that of Cliffe Dekker Hofmeyr, for the South African Cities
Network4. De Visser, Associate Professor of Community Law, University of Western Cape, has also
developed valuable opinions that draw on the developmental role allocated to local government in the
Constitution5.
South Africa’s supreme law, the Constitution of the Republic of South Africa, 1996, under Section 24, states
that all South Africans have the right to a healthy environment and the right to have the environment
protected. Cliffe Dekker Hofmeyr contend that this can be inferred to include the implementation of clean
renewable energy and energy efficiency projects. This is reinforced in the Constitutional objectives
accorded to local government, namely: the provision of services to communities in a sustainable manner,
promotion of social and economic development and a safe and healthy environment (section 152 (1)).
The Constitution sets out the powers and functions of municipalities (Section 56 (1) and Schedules 4B and
5B), which include aspects relating to air pollution, building regulation, electricity and gas reticulation,
municipal planning and street lighting. Therefore, given that municipalities derive authority to intervene in
these matters, from the Constitution, they are empowered to legislate on energy efficiency and renewable
energy dimensions relating to these powers and functions within their jurisdiction.
The National Energy Act, 1998 specifically mandates renewable energy development and energy efficiency
in that it addresses environmental management considerations and increased generation and consumption
of renewable energy. It also has as objectives the need to diversify our energy supply, effective
management of energy demand and energy conservation.
The Integrated Resource Plan (IRP) of 2010 informs the renewable and energy efficiency interventions on a
national level, which are seen to have a bearing on municipalities. However, although the IRP 2010 Update
Report begins to introduce elements directly within local government jurisdiction, the IRP 2010 still lacks
specific local government energy efficiency or renewable targets. Should the IRP 2010 Report Update
become policy, this would signal a step-change in that it lays the foundation for the development of a local
4 SA Cities Network: Consolidation of Lessons Learnt for EE and RE Initiatives within Cities, 2013. Prepared by Aurecon.
5 Jaap de Visser, UWC Local Government Project, Community Law Centre: LEGAL OPINION: in RE CITY OF CAPE
TOWN’S PROPOSED Solar water heating by-law, 2007; available from Sustainable Energy Africa.

12 | P a g e
government component within national electricity planning. This would substantially address current
difficulties in planning and committing resources for renewable energy and energy efficiency initiatives
within municipalities.
The White Paper on Renewable Energy Policy (2003) seeks to ensure that renewable energy is a significant
part of the country’s energy mix. Energy efficiency is also identified as an important facet of integrated
energy planning and the policy states that the greatest potential for efficiency measures is in the industrial
and household sectors. It further points out that local government can play a large role in improving energy
efficiency by ensuring the existence of applicable laws, education Programme and policies.
The White Paper on National Climate Change Response (2011) presents the country’s vision for an effective
climate change response and the long-term transition to a climate-resilient low carbon economy and
society. Cliffe Dekker Hofmeyr feel that this policy document does not clearly argue for the benefits of
renewable energy and energy efficiency. However, among the identified interventions to mitigate
emissions, the main opportunities consist of energy efficiency measures, demand-side management and
moving to a less emissions-intensive generation mix. It is however unclear how municipalities are
empowered to go about implementing and achieving these goals, although they are identified as key
partners, with SALGA as a key support (Section 10.2.6).
While regulations and policies exist at a national level to promote renewable and energy efficiency, very
little evidence is found of municipalities that utilize their legislative powers to pass bylaws to encourage or
enforce the promotion of these approaches within the municipality. The Municipal Systems Act does
empower municipalities to pass bylaws for energy efficiency and renewable energy, however, the preferred
approach by municipalities has been to develop policies, plans and strategies. It should be noted that
policies, plans and strategies do not impose the same legal obligation as created by bylaws. Municipalities
with detailed energy efficiency and renewable energy strategies, and a clear motivation for initiating
energy efficiency and renewable energy initiatives, have been more successful in implementing these than
municipalities approaching this area of work on an ad hoc basis. It is imperative for detailed action plans to
be developed alongside these strategies.
The national legislative environment also imposes numerous challenges for municipalities to implement
these initiatives. This includes not clearly specifying the role/mandates of municipalities in implementing
energy efficiency and renewable energy measures. For example, some policies might set targets for the
implementation of energy efficiency and renewable energy at a national level, without clearly identifying
the municipal mandate in this regard. If municipalities are expected to contribute, as broadly identified in
policy, these need to be translated into specific Key Performance Areas (KPA’s) within municipal
management systems. The Municipal Financial Management Act (MFMA) is also complex in relation to
municipal procurement abilities for both energy efficiency and renewable energy technologies.
The National Energy Regulator of South Africa’s (NERSA) lack of enforcement of the Dx license conditions,
which empower the regulator to enforce stricter energy efficiency and renewable energy conditions on
municipalities that have specified minimum requirements, is seen as being a barrier, or opportunity missed,
in the implementation of energy efficiency and renewable energy initiatives.
As noted in Section 1 above, the market development that is beginning to see rooftop PV becoming
affordable at a household and business level, and on-ground installation of systems and grid feed-in
applications, also means that local government have to engage with this sector.

13 | P a g e

14 | P a g e
3. The municipal energy picture
3.1 State of the data and data protocols
Energy data is not collated along the lines of municipal geo-political boundaries, making the exercise of
putting together a local energy picture, for individual municipalities, complex. Most metros have done
detailed State of Energy studies and a number of the ‘secondary cities’ are beginning to follow suite.
However, there is limited information for some of the smaller towns. Data collated here comes
predominantly from Sustainable Energy Africa’s State of Energy in SA Cities reports (2006 and 2011), which
in turn have drawn on local state of energy reports and some original data collation, and data recently
compiled through the SALGA SDC and ICLEI Urban-LEDs Programme for secondary cities. Figures therefore
come from different years and are indicative, but cannot be examined comparatively.
The following particular difficulties exist in relation to developing a local level energy picture:
a. Liquid fuel data is made available, as per latest ruling of the Competitions Commission, after a
‘reasonable time period’, which, for annual consumption data, is six months after the period in
question. This is a reasonable time frame and this outcome of the Commission is welcome.
However, data is still measured along magisterial district lines, making local estimations somewhat
clumsy. SEA have provided a national ‘tool’ that makes a broad sweep estimation that can be used
by municipalities, but detailed local level studies should refine this.
b. Municipal electricity departments are happy to make electricity data available. At a high level this is
easily accessible, but sector breakdown becomes difficult due to different billing structures. Eskom
data is not measured according to municipal boundaries. However, they are sometimes able and
prepared to provide high quality data approximating these boundary lines, in other instances they
do not permit this to be made available, or at least published, due to customer confidentiality (for
e.g. where they may supply only one or two large customers in an area the concern is that the
publication of this data would be considered a breach of confidentiality) as well as Municipal-
Eskom competition issues.
c. Coal and LPG is not regulated and data very hard to quantify, or apportion.
d. Harvested fire wood and other biofuel use is hard to quantify.
State of energy reporting for South African cities and towns follows global norms and protocols for local
level energy and GHG emissions reporting. This means that all energy consumed within an area, is
counted within that area. A full set of municipal energy data, should therefore, by definition, add up to
national energy consumption totals. Available local level data6 is presented in Table 2.
6 NOTE: this data is compiled from existing data and is not from a single source year, making any comparisons
between cities and towns difficult. However, the data is able to provide broad strategic indications. A data update exercise, through SEA’s City Energy Support Unit, is scheduled to take place in 2014. A full set of data, with data sources noted, is to be found in Appendix 3.

15 | P a g e
Table 2: Municipal energy overview 2014
NB Figures come from different years and are indicative, but not comparative.
Municipality Code Energy (GJ) Electricity (GJ)
Liquid Fuel (GJ) tCO2 Population
GVA (millions)
GJ/GVA (millions)
GJ/ capita
tCO2/ capita
Data year
METROS
Buffalo City A 21,434,507 4,655,834 14,914,690 2,513,420 724,308 34,357 624 30 3.5 2007
Cape Town A 195,994,461 48,303,379 144,635,091 24,081,610 3,497,097 182,518 1,074 56 6.9 2009
Ekurhuleni A 181,112,506 39,547,868 141,564,637 20,314,662 3,178,470 159,724 1,134 57 6.4 2011
EThekwini A 191,122,738 42,427,468 140,977,007 22,815,537 3,584,680 176,100 1,085 53 6.4 2010
Johannesburg A 142,612,254 52,493,812 85,977,722 21,302,088 3,888,182 285,926 499 37 5.5 2007
Mangaung A 18,163,624 5,042,761 12,870,963 2,360,628 662,063 17,955 1,012 27 3.6 2004
Nelson Mandela Bay A 32,191,176 11,133,645 20,430,591 4,669,993 1,050,934 54,398 592 31 4.4 2007
Tshwane A 104,513,830 42,497,981 52,583,464 16,573,293 2,345,909 169,205 618 45 7.1 2007
SECONDARY CITY
KwaDukuza B2 5,315,012 2,299,023 3,015,990 866,873 231,189 24,358 218 23 3.7 2012
Mbombela B1 11,684,300 1,204,936 10,479,364 1,081,531 527,203 11,544 1,012 22 2.1 2007
Msunduzi B1 25,034,993 6,447,101 10,069,502 3,229,878 616,733 17,057 1,468 41 5.2 2007
Polokwane B1 11,461,953 1,842,075 9,619,878 1,197,410 561,770 18,949 605 20 2.1 2007
Sol Plaatje B1 5,642,450 1,338,037 4,236,374 684,566 243,015 10,772 524 23 2.8 2007
Tlokwe B1 4,332,903 1,393,402 2,919,927 712,768 129,075 3,823 1,133 34 5.5 2004
RURAL
King Sabata Dalindyebo B2 5,055,483 974,635 4,065,745 560,514 451,711 12,301 411 11 1.2 2011
Thulamela B4 2,445,150 911,129 1,534,021 366,073 618,462 No data No data 4 0.6 2011
INDUSTRIAL
Rustenburg B1 57,183,679 39,630,023 11,439,133 12,640,515 549,575 26,620 2,148 104 23.0 2011
Saldanha B2 23,477,790 4,021,563 3,004,343 2,690,743 78,985 4,359 5,386 297 34.1 2007
Sedibeng C1 88,944,560 40,532,772 16,015,511 15,325,469 800,833 22,845 3,893 111 19.1 2007
Steve Tshwete B1 19,782,826 10,988,089 8,794,737 3,771,142 229,831 No data No data 86 16.4 2011
uMhlathuze B1 60,263,447 51,780,470 7,116,064 15,315,773 360,002 13,664 4,410 167 42.5 2004

16 | P a g e

17 | P a g e
3.2 Local energy demand, supply and related carbon emissions
Whilst noting that the data sets are far from comprehensive, the data provides important indications for
the strategy development process. The most concentrated consumption of energy takes place within the
metros: 31% of national electricity consumption and 66% of liquid fuel (petrol, diesel, LPG, HFO, etc.)
consumption takes place within these 8 municipalities. This offers important opportunities for economies
of scale and reduced transaction costs.
Table 3: Municipal vs. national energy consumption
Municipality type
Liquid fuel (GJ)
% of national
Electricity (GJ)
% of national
Ave % contribution municipality type
Metro (data for 8 cities) 613,954,165 65.6% 246,102,749 31.3%
4%
Secondary city (data for 6 city/towns) 40,341,035 4.3% 14,524,574 1.8%
0.3%
Rural (2 municipalities) 5,599,766 0.6% 1,885,764 0.2%
0.1%
Industrial (5 towns) 46,369,788 5.0% 146,952,918 18.7%
3.7%
Remainder 228,988,562 24.5% 375,765,996 47.9% Approx.
0.2%
National* 935,253,316 100.0% 785,232,000 100.0% 1. National electricity figure: Eskom 2007 Annual Report 2. National liquid fuel figure: 2007 SAPIA fuel sales data
A closer analysis of the proportion of transport fuels (petrol and diesel) shows that over half of the
consumption of these fuels takes place within the metros and secondary cities, and close on 60% of
national petrol consumption takes place in dense urban areas, indicating that urban spatial form, urban
management and local transport options may have a major role to play in levels of consumption.
Figure 1: Urban transport fuel consumption as a portion of national (SAPIA, 2007)
Despite the inclusion of some of the important ‘secondary cities,’ such as Mbombela, Polokwane and
Msunduzi, the 13 other municipalities for which data is available account for only 10% of national liquid
fuel consumption and 21% of electricity use. The industrial nature of municipalities such as Rustenburg
(platinum mining), Steve Tshwete (steel production), uMhlathuze (aluminium smelting) and Saldanha (steel
production) account for the relatively high proportion of electricity use in these 13 municipalities.
62%
38%
Petrol and diesel consumption
Metros &large towns
Other

18 | P a g e
While per capita energy consumption is reasonably similar within the metros and ‘secondary cities,’ energy
consumption per capita in the smaller, more rural and/or less developed towns, such as King Sabata
Dalindyebo and Thulamela, is very low. Both of these municipalities fall into former ‘Bantustans’ areas
created by the Apartheid government and, as a result, lags other municipalities in infrastructure
development. As a comparison, whilst Polokwane and Thulamela municipal areas both have a similar-sized
population (roughly 600,000), Thulamela’s energy consumption per capita is drastically lower; almost by a
factor of ten (4 GJ/capita versus Plokwane’s 35 GJ/capita).
The energy picture is fossil fuel dominated: Liquid fuel is derived from imported oil and produced from coal
and natural gas (over 30% of total liquid fuel consumption)7. Electricity is from Eskom generation, of which
final consumption is 90% coal-derived, 5% nuclear and 5% hydro derived (IRP 2010). Renewable energy via
the REIPP comes on line this year (2014) and by 2030 should represent 9% of final consumption. Heavy coal
dependence has implications for GHG emissions and potential carbon taxes.
Within Mpumalanga, where most of South Africa’s coal-fired electricity-generating power plants are
situated, this is also a very local problem: air pollution due to the power stations results in respiratory
illness, and land and water degradation. Coal trucks ferrying coal to the power stations damage roads.
Municipalities within Mpumalanga noted that coal mining has a huge and damaging ‘footprint.’
Considering energy-related carbon emissions per capita, the average amongst the metros is 6 tonnes of CO2
per person. This is equivalent to large cities globally (Paris, London, Berlin). However, these international
cities have far higher levels of development. Amongst secondary and smaller South African municipalities
for which data is available, it is clear that heavy industry pushes per capita carbon emissions to extremely
high levels. Notable is that in a number of secondary cities the per capita emissions falls between 1-3
tonnes CO2. This is low by global standards and close to the global ‘fair share’ of carbon per capita (approx.
2 tonnes/person). While this often represents underdevelopment and poverty, it also offers an
opportunity/challenge to ensure that the required future development enhances and supports these low
emissions averages.
7 US Energy Information Administration: South Africa, January 2013 update

19 | P a g e
Figure 2: Carbon emissions per capita in South African municipalities (SEA, 2013)
The overarching data picture indicates that metros and secondary cities will be crucial partners in meeting
energy-related emission-reduction goals (where intervention transaction costs may be lower). The majority
of the poor, given urbanisation, also live in larger cities and towns, making these important centres for
addressing energy poverty. In municipalities with smaller populations and lower levels of urban
infrastructure, the most vital energy issues may relate to energy access for residential and productive
development and ensuring that the infrastructure development path facilitates a low-carbon trajectory.
Where transaction costs are higher, it makes sense to consider centralising as many interventions as
possible. This must be done through engagement with local government, rather than top-down and not
taking into account local imperatives and systems (e.g. reporting time frames differ from national to local
government).
3.3 Sector breakdowns
Within municipal energy consumption, the transport sector (generally includes, petrol, non-industrial
diesel, aviation gas, international marine fuel and jet fuel consumption) accounts on average for half of
total consumption. Within the metros that house airports and harbours, and towns with limited industry,
this figure is even higher (60-77%). In municipalities with substantial industry, this proportion can be lower
(example: 13% in Rustenburg).
0 10 20 30 40 50
Buffalo City
Cape Town
Ekurhuleni
EThekwini
Johannesburg
Mangaung
Nelson Mandela Bay
Tshwane
KwaDukuza
Mbombela
Msunduzi
Polokwane
Sol Plaatje
Tlokwe
King Sabata
Thulamela
Rustenburg
Saldanha
Sedibeng
Steve Tshwete
uMhlaThuze
tCO2/capita
Carbon emissions per capita

20 | P a g e
Figure 3: Average transport sector related energy across all municipalities with available data (SEA, 2013)
Municipal energy efficiency must, critically address the transport sector. This needs to consider efficient
vehicles, cleaner fuel, public transport, smart/unified transport systems. However, urban form and ‘healthy’
densification, as well as lifestyle changes must form part of this.
Data also indicates that non-motorised transport (walking and cycling) forms a huge proportion of all
mobility in our municipal areas. Within the metros, in 2001, this was on average 43% of all mobility
(Ekurhuleni is the outlier with a much smaller proportion of ‘foot’ transport); and in the ‘secondary’ and
smaller towns this was, on average 53%8. It must be noted that the data is old, as the 2011 StatsSA Census
did not include transport mode-related queries for comparison. Nevertheless, even if substantial
improvement has occurred, these figures are sizeable and, from the perspective of addressing poverty,
inequality and access it is important this this be noted. Non-motorised transport support should be a
cornerstone of any transport/mobility-related municipal strategies.
Figure 4: Mode of transport to work and school, 2001, StatsSA
Of the non-transport related sectors (industry, commerce and residential), the industrial and residential
sectors make up the next-largest chunk of energy consumption, followed by the commercial sector.
Non-metro municipalities follow, broadly, the same pattern, save for slight variations: more rural
municipalities have low levels of industry; and very high industrial energy consumption in industrial towns
throws all other energy consumption proportions out (when industry data is removed, the remaining
consumption exhibits similar characteristics to other towns). See Figure 5 below for illustrative purposes.
8 StatsSA Census 2011
51% 49%
Transport sector energy consumption
Transport
Other
0100000200000300000400000500000600000
Foo
t
Bic
ycle
Mo
torc
ycle
Driver
of…
Passe
n…
Min
ibus/…
Bus
Tra
in
Mode of Transport (no. of people): Johannesburg

21 | P a g e
Figure 5: Average energy consumption by sector across metro cities and typical secondary and more rural
municipalities. Note: excludes international marine fuels
The commercial and residential sectors both largely relate to the built environment. While households
usually comprise some 15-20% of total energy consumption, within electricity consumption they consume
30-40% of the municipal total, and this often during peak load times, thus representing an important
energy efficiency and renewable energy opportunity (with lower load levels, the country can lower its
installed capacity requirements, facilitating renewable energy development). Greater efficiency in the built
environment of a town can also support business in the area. Security of supply is also important for
business development.
Within the residential sector the Integrated National Electrification Programme (INEP) of government has
had a substantial impact on electrification levels across the country: amongst the metros, the average
electrification level amongst households in 89%; and amongst other municipalities within the data study,
87%. Rural electrification levels are lower, with only around 55% of rural population having access to grid-
electricity9. The outstanding households are usually in more rural settings, where it is extremely costly to
extend the grid connection, or amongst informal settlements in the urban context where issues of land
rights, electrification standards, or accessibility inhibit electrification. However, it should also be noted that
the figures for electrification include not only formal electricity connection, but informal, or ‘illegal’
connections. Formal electrification is often far lower and this means that many poor households, while they
have access to electricity for lighting, do not benefit from the national energy poverty subsidy via the Free
9 US Energy Information Administration: South Africa, 2013.
6% 2%
16%
13% 61%
1%
Average metro energy consumption by sector
Agriculture
Commerce
Government
Industrial
Residential
Transport
Losses
11% 1%
11%
15% 56%
5%
KwaDukuza energy consumption by sector
Agriculture
Commerce
Government
Industrial
Residential
Transport
Losses
15%
2% 2%
15%
65%
1%
King Sabata Dalindyebo energy consumption by sector
Agriculture
Commerce
Government
Industrial
Residential
Transport
Losses
1% 1%
49%
4%
44%
1%
Steve Tshwete energy consumption by sector
Agriculture
Commerce
Government
Industrial
Residential
Transport
Losses

22 | P a g e
Basic Electricity Grant, and suffer intermittent access, dangerous connections and often costly electricity
that is paid for through a third party.
Whether formal or not, a positive trend with increasing access to electricity, is the reduction in paraffin
consumption amongst households in South African municipalities10. Figure 6 below provides a visual
overview of change in fuel source for cooking and lighting in South African households from 1996 – 2011.
The increase in electricity is sizeable, particularly from 2001 – 2011. This seems to have directly replaced
paraffin consumption.
Figure 6: Main fuel use for cooking and lighting in households in South Africa 1996-2011 (Source: StatsSA Census 1996,
2001, 2011)
Despite impressive improvements, substantial households still suffer the burden of energy poverty, either
through lack of access to modern, safe forms of energy (and consequent health/safety impacts), through
badly designed housing that has very low thermal performance, or through the increasing proportion of
household income that is spent on meeting energy needs. Addressing the hundreds of thousands of
households suffering in these conditions is a primary task of South African municipalities wishing to address
sustainable energy (EE/RE) issues.
Within mid-high income households in South Africa, the major fuel used for lighting, cooking and heating is
electricity. This offers some scope for the possible expansion of cleaner fuels for cooking, such as LPG or
natural gas. Within electricity consumption, the most sizeable end use is in heating of water. Geyser ripple
control relays have been implemented successfully in a number of municipalities and the potential for the
expansion of solar water heating/heat pumps has long been understood. A national subsidy has been
available to help overcome the major upfront capital cost barrier to uptake of solar water geysers or heat
pumps. Mass rollout of the technology remains elusive and many municipalities have been exploring viable
ways to support this. A challenge is that legal review indicates the difficulty of municipalities installing
SWHs as municipal owned infrastructure within private properties, thus leaving the uptake entirely in
private hands. The City of Cape Town has recently launched a programme of endorsing service providers
who offer sound products with good associated financing options.
Amongst the built environment (commercial, residential and industrial) all new building, including low
income housing, is now subject to the new, energy efficient building regulations captured in SANS 10400-
XA. This requires that a specified efficiency per square meter is met in the building design, and a minimum
of 50% of heating requirements must be met through solar water heating/heat pump. Challenges in
10
StatsSA Census 1996, 2001, 2011
0% 50% 100%
19
96
20
01
20
11
Main fuel use for cooking in households
Electricity
Gas
Paraffin
Wood
Coal 0% 50% 100%1
99
62
00
12
01
1
Main fuel use for lighting in households
Electricity
Gas
Paraffin
Candles
Solar

23 | P a g e
enforcing the new regulations need to be addressed for the full effectiveness of these regulations to be
realised.
Municipalities have some control over industry in their jurisdictions, through building regulation, electricity
supply metering, Air Quality control and business licensing. However, real influence in industrial processing
is usually vertical, through industrial bodies or business associations.
24 | P a g e
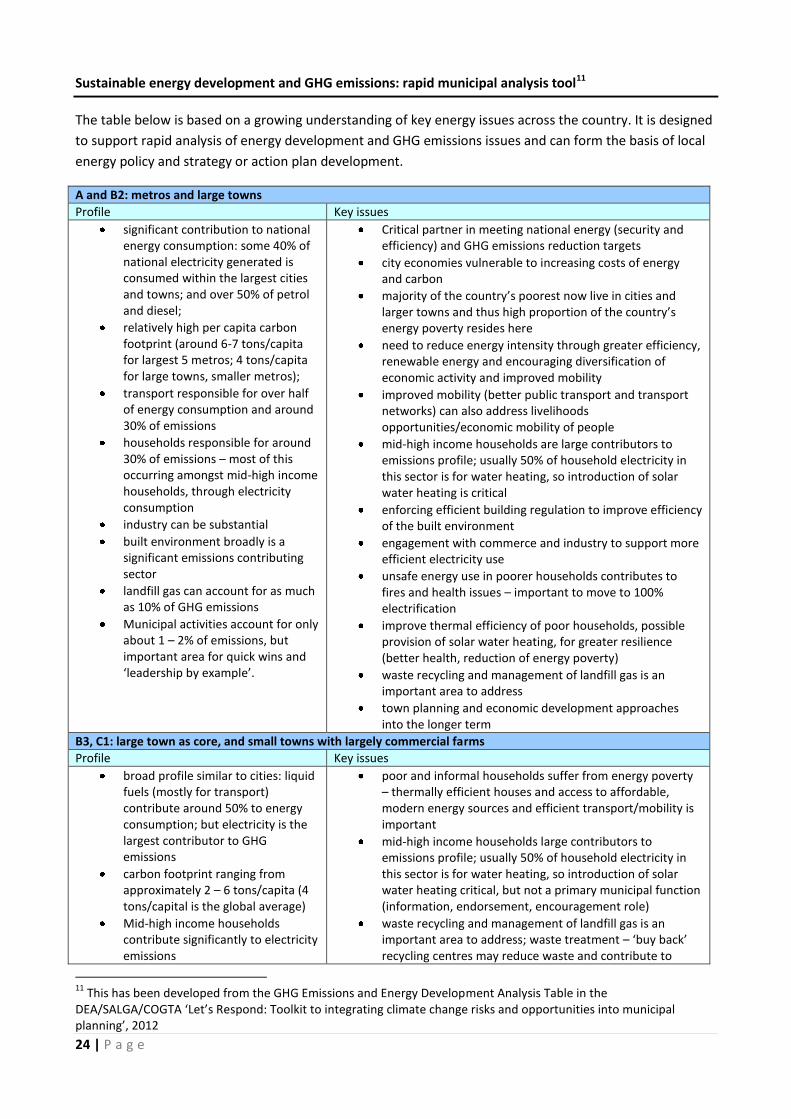
Sustainable energy development and GHG emissions: rapid municipal analysis tool11
The table below is based on a growing understanding of key energy issues across the country. It is designed
to support rapid analysis of energy development and GHG emissions issues and can form the basis of local
energy policy and strategy or action plan development.
A and B2: metros and large towns
Profile Key issues
significant contribution to national energy consumption: some 40% of national electricity generated is consumed within the largest cities and towns; and over 50% of petrol and diesel;
relatively high per capita carbon footprint (around 6-7 tons/capita for largest 5 metros; 4 tons/capita for large towns, smaller metros);
transport responsible for over half of energy consumption and around 30% of emissions
households responsible for around 30% of emissions – most of this occurring amongst mid-high income households, through electricity consumption
industry can be substantial
built environment broadly is a significant emissions contributing sector
landfill gas can account for as much as 10% of GHG emissions
Municipal activities account for only about 1 – 2% of emissions, but important area for quick wins and ‘leadership by example’.
Critical partner in meeting national energy (security and efficiency) and GHG emissions reduction targets
city economies vulnerable to increasing costs of energy and carbon
majority of the country’s poorest now live in cities and larger towns and thus high proportion of the country’s energy poverty resides here
need to reduce energy intensity through greater efficiency, renewable energy and encouraging diversification of economic activity and improved mobility
improved mobility (better public transport and transport networks) can also address livelihoods opportunities/economic mobility of people
mid-high income households are large contributors to emissions profile; usually 50% of household electricity in this sector is for water heating, so introduction of solar water heating is critical
enforcing efficient building regulation to improve efficiency of the built environment
engagement with commerce and industry to support more efficient electricity use
unsafe energy use in poorer households contributes to fires and health issues – important to move to 100% electrification
improve thermal efficiency of poor households, possible provision of solar water heating, for greater resilience (better health, reduction of energy poverty)
waste recycling and management of landfill gas is an important area to address
town planning and economic development approaches into the longer term
B3, C1: large town as core, and small towns with largely commercial farms
Profile Key issues
broad profile similar to cities: liquid fuels (mostly for transport) contribute around 50% to energy consumption; but electricity is the largest contributor to GHG emissions
carbon footprint ranging from approximately 2 – 6 tons/capita (4 tons/capital is the global average)
Mid-high income households contribute significantly to electricity emissions
poor and informal households suffer from energy poverty – thermally efficient houses and access to affordable, modern energy sources and efficient transport/mobility is important
mid-high income households large contributors to emissions profile; usually 50% of household electricity in this sector is for water heating, so introduction of solar water heating critical, but not a primary municipal function (information, endorsement, encouragement role)
waste recycling and management of landfill gas is an important area to address; waste treatment – ‘buy back’ recycling centres may reduce waste and contribute to
11
This has been developed from the GHG Emissions and Energy Development Analysis Table in the DEA/SALGA/COGTA ‘Let’s Respond: Toolkit to integrating climate change risks and opportunities into municipal planning’, 2012
25 | P a g e
Municipal activities account for from 1 – 2% of emissions, and offer important area for quick wins and ‘leadership by example’.
livelihoods
B4, C2: rural villages and largely retail service towns
Profile Key issues
energy consumption constrained – energy for residential and productive development still needed
electrification of rural areas is still major issue
carbon footprint very small (1 – 2 tons/capita) – ‘carbon space’ for development
transport is large energy consumer
households are the major contributors to electricity consumption; with commerce and agriculture following
Municipal activities account for from 1 – 2% of emissions, and offer important area for quick wins and ‘leadership by example’, but this should focus on fairly simple interventions, which should be centrally coordinated (e.g. rollout of efficient municipal lighting).
unsafe energy use (wood and coal fires, paraffin, candles, illegal/poor electricity connections) in poorer households contributes to fires, accidents and poor health which will be worsened by climate change
electricity distribution often 100% in hands of Eskom – need close cooperation to continue with electrification programme
Rollout of off-grid electrification requires intensification as well as information and education amongst recipients
Technical capacity within municipalities is limited
deforestation where wood is used for cooking and heating
economy and welfare held back by intermittent electricity supply and low voltage times
efficiency in lighting and appliances can contribute significantly to energy cost savings
improved thermal quality of housing will reduce need for indoor heating (and related pollution/cost) and improve the health of residents
improved transport networks needed
likely potential for energy from landfill or waste water gas is small; but some emissions savings may be gained through better management and/or technologies deployed in waste management
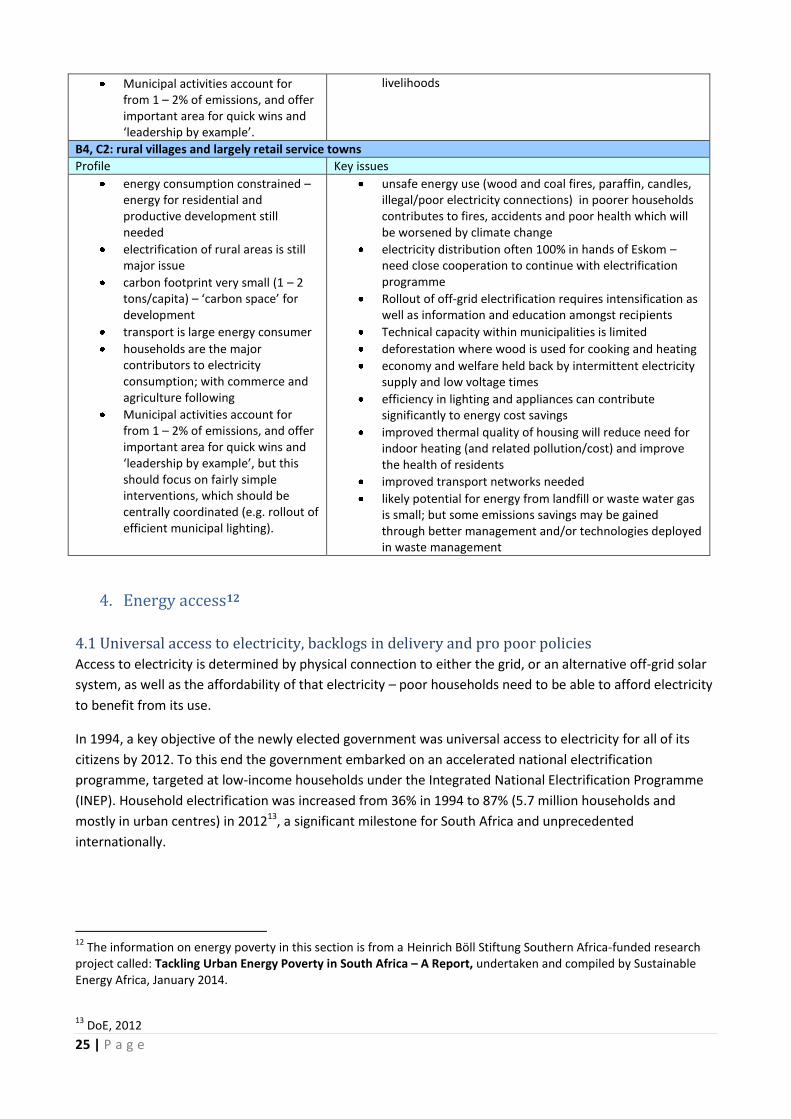
4. Energy access12
4.1 Universal access to electricity, backlogs in delivery and pro poor policies
Access to electricity is determined by physical connection to either the grid, or an alternative off-grid solar
system, as well as the affordability of that electricity – poor households need to be able to afford electricity
to benefit from its use.
In 1994, a key objective of the newly elected government was universal access to electricity for all of its
citizens by 2012. To this end the government embarked on an accelerated national electrification
programme, targeted at low-income households under the Integrated National Electrification Programme
(INEP). Household electrification was increased from 36% in 1994 to 87% (5.7 million households and
mostly in urban centres) in 201213, a significant milestone for South Africa and unprecedented
internationally.
12
The information on energy poverty in this section is from a Heinrich Böll Stiftung Southern Africa-funded research project called: Tackling Urban Energy Poverty in South Africa – A Report, undertaken and compiled by Sustainable Energy Africa, January 2014.
13
DoE, 2012

26 | P a g e
However government recognised that due to infrastructure constraints and increasing growth rates in
household’s electricity demand, that the goal of universal access would need to be adjusted. The DoE’s
Electrification Roadmap commits to reach 97% access by 2025.
Figure 7: Comparison of total number of households and electrified households electrified in South Africa (in millions)
(DoE, 2013)
The current electrification backlog stands at 3.3 million households comprising 1.2 million informal
households and 2.1 million formal households requiring an electricity connection14 and this is expected to
grow at 2% on a national average per annum15. Access to electricity has been slower in rural areas than in
urban centres. South Africa’s electrification programme has been grid focussed due to the INEP programme
out of, and building on, the Eskom grid-electrification projects of the late 1980s. ‘Off grid’ electrification,
although becoming part of the INEP Programme on its establishment in 2000, has lagged. Between 1994
and 2010 some 46 000 households, 3 000 schools and 345 clinics in rural areas were supplied with non-grid
electricity (relative to 5.2 million grid electrified households and 12 000 schools connected during this
time)16.
According to the 2011 census 85% of households have access to electricity based on those using electricity
for lighting. This figure includes approximately 1.2 million households that are not metered, such as
backyard dwellers. If these households are considered ‘unelectrified’ (as INEP figures show), then the
percentage of households with a metered supply of electricity falls to 77%. This has implications in terms of
the actual picture in the country and for government to reach its 2025 target. Resolution of issues relating
to informal/illegal connections vests with municipalities.
Government’s major poverty energy poverty subsidy is the Free Basic Electricity (FBE), which states that
every indigent household should receive 50kWh of free electricity per month in order to meet basic energy
needs. According to the DoE (2013) 69% of poor households are benefitting from free basic energy policies,
however, the indications are that this figure may be lower as the method of measure is unclear – many
municipal indigent registers do not include all poor households (for example, in eThekwini, the figure is as
low as 37% of the extreme indigent and 13% of all poor households17). Some municipalities give FBE based
14
DoE, 2013 15
DME, 2007 16
DoE, 2013 17
Euston-Brown, Durban Climate Change Response Strategy: Sustainable energy report, 2013

27 | P a g e
on electricity consumption and in this case there is leakage of the subsidy to wealthier households and
where two or more poor households are connected to one meter (as is the case with the backyard dweller)
their consumption takes them above the benefit threshold.
Recognising that FBE and electrification will not reach all households in the near future, national
government introduced the Free Basic Alternative Energy (FBAE) policy in 2007 to support indigent
households by providing them with the equivalent of R56.29 per month of alternative fuels/technology
such as paraffin and Liquefied Petroleum Gas (LPG). To date the number of households receiving FBAE is
small. There are significant challenges for municipalities to roll out FBAE as it is very difficult to administer
and monitor.
To address the fact that poor households are spending a far higher proportion of the household income on
electricity18, the National Electricity Regulator of South Africa (NERSA) in 2010 introduced the Inclining
Blocked Tariff (IBT) to help cushion low income electrified households from the particularly sharp
electricity price increases. The system introduces higher per unit charges as the rate of consumption
increases. A secondary goal of the IBT was to promote energy conservation through applying high tariffs in
the upper consumption brackets. PDG have undertaken fairly detailed research into the impact of IBT in
terms of meeting the primary affordability objective. Significant findings include the fact that only some
30% of municipalities have implemented these tariff structures, the rest have continued with other
structures – usually flat rates per unit. This may well relate to the challenges in implementing the IBT:
1. Technical constraints to introducing this within the pre-payment metering system.
2. Multiple households share a single meter such as the case of backyard dwellers, which results in
the benefits of free or below cost allocation defined by the lower first consumption block of the IBT
not being achieved.
3. IBTs may also subsidise wealthier customers with low consumption, as well as irregular users of
electricity, such as wealthy customers who own a holiday home.
4. Municipalities may lose important revenue streams from high use customers who would then
reduce consumption (elastic demand).
The second major finding of the study is that, where it has been applied, the IBT system has had a very
small impact on affordability: the impact on bills compared to the flat rate tariffs applied previously is
marginal and yet a large amount of cost and effort has been required to implement these new tariffs.
Finally, the study concluded that the poor have not been insulated from increases in electricity tariffs. The
way forward would be to allow for flexibility with regard to the IBT tariff structure (those who have applied
it continue to do so, those who have not yet, maybe continue with flat rate) and focus efforts on keeping
the bill for low income consumers as low as possible19.
4.2 Household Energy Use Patterns
According to the survey undertaken by the DoE20 in 2012, 47% of South Africans are energy poor as they
spend more than 10% of their income on energy needs. Energy poverty is also manifest in the persistent
multiple fuel use patterns displayed by poor households across South Africa despite being electrified (see 18
PDG, 2013 19
PDG, 2013 20
This was a nationally representative survey undertaken by the DoE in 2012 to gather information on energy related behaviour and perceptions in South Africa with a particular focus of energy poverty.

28 | P a g e
Figure below). This means that almost 7 million households continue to largely rely on unsafe, unhealthy
forms of energy such as paraffin, coal and biomass, when they cannot afford to buy electricity.
Household energy use patterns emerging over the last 10 years show an increased uptake in electricity to
fulfil basic household energy needs over time particularly with respect to lighting and cooking– see Table 6
below. The use of electricity for cooking has shown the largest increase (23%) relative to other end uses.
Figure 8: Multiple energy sources used by electrified and unelectrified poor households (Source: DoE 2012).
According to the DoE 2012 survey a breakdown of household energy patterns shows:
Lighting:
Electrified households across South Africa almost exclusively use electricity for lighting (97% of the
survey sample) with a small component of households continuing to rely on candles.
Two thirds of unelectrified households rely on candles as the main lighting source while the
remaining third rely mainly on paraffin.
Cooking:
76% of households use electricity for cooking. In formal urban areas this is as high as 91%.
In urban informal settlements two thirds of households use electricity for cooking (68%), while
close to third (27%) of households rely on paraffin.
8% of electrified households continue to rely on firewood for cooking.
Non-electrified households use paraffin and firewood as the dominant energy source for cooking
(50% and 40% respectively).
Space heating:
Two thirds of South African households (65%) utilize an energy source for this end use, the
remaining third keep warm by dressing up warmly and using blankets.
38% of households use electricity as the main source of energy for space heating. In households in
formal urban areas electric heating predominates (50%).
12% of households use paraffin and 9% use firewood. Coal, gas and other sources are utilised by
less than 5% if households.

29 | P a g e
In non-electrified households 40% use firewood, 4% coal and 18% use paraffin.
Urban informal areas tend to use paraffin for heating (20%), while 5% use firewood.
Rural households tend to rely more on biomass resources than those living in towns: an estimated three
quarters of households in rural, traditional authority areas and 60% of rural farm dwellers use firewood as
an energy source, compared to only 11% of households in formal urban areas, and 17% in informal
settlements21.
Urbanisation and informality
South Africa continues to experience rapid urbanisation, with approximately 64% of the country’s
population currently residing in urban areas (Figure 8 below) of which 40% are located in the metropolitan
municipalities, the rest in smaller towns and peri-urban settlements. Urban populations are forecasted to
reach 70% by 2030 and 80% by 205022. The national census data of 2001 and 2011 reveal that the metros
(South Africa’s largest cities) are growing in population size on average at a rate of 2% per annum, and the
number of households is also increasing at a rate of 3%.
Despite national government’s enormous progress in universal access to free and basic services,
municipalities are struggling to keep pace with the increasing demand of their fast growing populations.
Research has pointed to trends in developing countries where urbanisation, if managed well will generate
significant opportunities for growth, poverty reduction and environmental sustainability and if not will lead
to increasing levels of poverty leaving many people without access to basic services.
Figure 9: Urban versus rural population growth in South Africa from 1950-2035 (Source: Institute for Futures Research,
University of Stellenbosch, 2013)
Informality commonly occurs in situations of rapid urbanisation. South Africa has some 1.96 million
households living in informal dwellings23. This equates to approximately 13.6 % of the national population.
Energy poverty is particularly prevalent in informal settlements (usually situated on land unauthorized or
not zoned for residential development), which includes those households living in backyard shacks of
formal properties in overcrowded conditions. The majority of informal settlements are situated on the
21
DOE/HSRC Household Energy Survey, 2012 22
NDP, 2011; SACN, 2011, COGTA, 2013 23
An informal dwelling defined by Statistics South Africa is a “Makeshift structure not approved by a local authority and not intended as a permanent dwelling. Typically built with found materials (corrugated iron, cardboard, plastic, etc.)…”

30 | P a g e
periphery of cities and many do not have formal access to Eskom or Municipal distributed electricity. Those
that are electrified are generally receiving electricity through illegal connections although there is a drive to
electrify informal settlements.

31 | P a g e
5. Energy efficiency and Demand Side Management
Extensive work has been undertaken to explore the energy efficiency potential within municipalities (with a
focus on the dense urban component) in order to understand the role of local level action towards national
and local goals and targets24. Given the frequently raised barrier to efficiency uptake – that it will impact
negatively on revenue in already cash-strapped municipalities – the research has also explored the
implications of efficiency uptake on municipal electricity consumption and related revenue impacts.
5.1 Potential impact of interventions in terms of energy savings on a Municipal level
Research and modelling (drawing predominantly on data derived through the M&V process within the
Eskom IDM Programme) provide an indication of the kind of savings that could be expected from tried and
tested energy efficiency interventions. Figure 10 below indicates which interventions will make the greatest
impact on electricity use reductions within a typical metro city, i.e. of the total possible efficiency, which
interventions contribute what proportion. In this regard solar water heaters (25%) and efficient lighting
(9.6% + 12.2% = 21.6%) for the residential sector are the dominant interventions, with HVAC (13.2%) for the
commercial sector and efficient motors (7.6%) for the industrial sector also carrying some weight. It does
need to be noted that further, detailed data analysis is required on the efficiency output of solar water
heating as this intervention is highly behaviour dependent, and M&V data has indicated lower than
anticipated efficiency results25.
Figure 10: Relative contribution of different interventions towards energy efficiency potential within a typical metro
(SEA, 2014)
The impact by intervention for a typical smaller town is still dominated by SWHs and efficient lighting, but
even more so than in a typical city’s case. These results are indicated graphically in Figure 11 below.
24
This draws on over fifteen years of peer reviewed project work of Sustainable Energy Africa, based also on Eskom M&V figures. Most recent calculations presented here are derived from with completed in a REEEP-funded project exploring the impact of energy efficiency and renewable energy on municipal revenue. 25
Pers com. Eskom IDM Programme (John Philby) and City Power (Paul Vermeulen), March 2014.
0.0%
5.0%
10.0%
15.0%
20.0%
25.0%
30.0%
EE Saving by Intervention - City

32 | P a g e
Figure 11: Relative contribution of different interventions towards energy efficiency potential within a typical smaller
town (SEA, 2014)
Strategically important energy efficiency interventions, considering municipal ‘reach’, impact on energy
savings and addressing poverty, are:
1. efficient lighting in low income housing
2. ceiling retrofit (thermal efficiency) in existing low income housing stock
3. efficiency retrofit (SWH or heat pump) of residential mid-high income water heating appliances –
through endorsement and other schemes
4. efficiency retrofit of HVAC systems in commercial sector – through information and other schemes
5. efficient lighting across all sectors.
5.2 Potential impact of interventions in terms of effective demand management for
municipalities
Load management is particularly important for municipal electricity distribution business. A trend in the
larger cities is a decrease in total demand against a ‘business as usual trajectory’ (in many cases we are
seeing demand sitting at 2006 or 2007 levels), but this is not accompanied by a reduction in maximum
demand, or peak. This is largely driven by the growth in residential sector connections. Low income
household electricity consumption is relatively small, and few efficiency opportunities exist as poor
households do not waste electricity. However, these households drive a short, sharp morning and evening
spike in demand which is extremely costly to Municipal distributors as these customers are cross-subsidised
from revenue from wealthier customers and at peak this electricity is at its most expensive to supply.
This makes demand management of peak within low income households an important area of energy
management. The indications are that water heating is a large component of this peak, as well as cooking,
making the rollout of low pressure solar water heating and possibility of expanding gas usage for cooking,
something that needs to be pursued.
5.3 Potential impact of efficiency on electricity sales at a Municipal level
Municipalities around South Africa are currently experiencing a drop in electricity sales, particularly in the
residential sector. While it is not completely clear why the sales are dropping, it is most likely due to
0.0%
5.0%
10.0%
15.0%
20.0%
25.0%
30.0%
35.0%
EE Saving by Intervention - Town

33 | P a g e
implementation of more energy efficient interventions, and behaviour change, in response to rapidly
increasing electricity prices.
To determine the potential impact of energy efficiency and behavioural interventions on electricity sales, a
spreadsheet has been developed by Sustainable Energy Africa (SEA), the results of which are presented
below for both a typical city, and a typical smaller town26.
Table 4 below indicates that if all sectors (residential, commercial, industrial and municipal) were to
implement energy efficiency and behavioural interventions (100% implementation), electricity sales would
reduce by 21.2%. However a complete rollout will take time, and it is estimated that uptake in 10 years’
time will be of the order of 50%-85% (Rogers curve estimation). Based on this assumption, a reduced
electricity sales impact of 10.6%-18% is expected.
Table 4: Impact of energy efficiency on city electricity consumption and related revenue
A similar study was performed on a small town, and the results in Table 5 show a potential drop of 13.5% -
22.9% in electricity sales by 2024. This figure is higher than a typical city due to the higher percentage of
overall consumption by the residential sector where the EE gains are the greatest
Table 5: Impact of energy efficiency on ‘smaller’ town electricity consumption and related revenue
26
An interactive tool has also been developed through the SEA REEEP-funded project. This enables a municipality to input their own data and evaluate the impact of various efficiency scenarios. The tool is available on: http://www.cityenergy.org.za/category.php?id=2#1.
CityTechnology Behavioural Total Low (50%) High (85%)
Residential (34% of total consumption)
EE Lighting (mid-high inc) 1.8% 0.3% 2.0% 1.0% 1.7% 9.6%
EE Lighting (low inc) 2.1% 0.5% 2.6% 1.3% 2.2% 12.2%
Geyser thermostat adjusting (10 degrees) 0.0% 0.5% 0.5% 0.2% 0.4% 2.3%
Aerated Shower Heads 0.5% 0.0% 0.5% 0.3% 0.4% 2.5%
SWH 5.3% 0.0% 5.3% 2.6% 4.5% 24.9%
Hot Boxes 0.4% 0.0% 0.4% 0.2% 0.4% 2.0%
Ceiilings in RDP houses-isoboard 1.3% 0.0% 1.3% 0.7% 1.1% 6.4%
Sub Total 11.5% 1.2% 12.7% 6.3% 10.8% 59.9%
Commercial (16% of total consumption)
EE Lighting 0.7% 0.5% 1.2% 0.6% 1.0% 5.7%
HVAC 1.9% 0.9% 2.8% 1.4% 2.4% 13.2%
Sub Total 2.6% 1.4% 4.0% 2.0% 3.4% 18.9%
Industrial (41% of total consumption)
Efficient Motors 1.6% 1.6% 0.8% 1.4% 7.6%
Variable Speed Drives 1.2% 1.2% 0.6% 1.0% 5.8%
EE Lighting 0.8% 0.2% 1.1% 0.5% 0.9% 5.0%
HVAC 0.1% 0.0% 0.2% 0.1% 0.2% 0.9%
Sub Total 3.8% 0.3% 4.1% 2.0% 3.5% 19.3%
Municipal (3% of total consumption)
HPS Streetlights 0.3% 0.3% 0.2% 0.3% 1.5%
Efficient buildings 0.1% 0.1% 0.0% 0.1% 0.5%
Sub Total 0.4% 0.0% 0.4% 0.2% 0.4% 2.0%
Total 18.2% 2.9% 21.2% 10.6% 18.0% 100.0%
Potential total energy reduction Uptake by 2024 Impact as % of
all interventions

34 | P a g e
Strategically, it is important for municipalities to accept that rapidly increasing energy efficiency
intervention uptake is a market driven reality over which they have little control. In this light, a municipality
needs to be adopt approaches to manage this reality in such a way that it optimally benefits their
community. These approaches include:
1. Facilitating energy efficiency programmes that support local manufacture, sales, installation and
maintenance of EE interventions (e.g. the City of Cape Town SWH installer accreditation
programme, which endorses installers of good quality locally manufactured product, and raises
awareness around the technology). Such programmes grow the local economy and create jobs.
2. Saving on municipal energy costs by implementing energy efficiency in street and traffic lights and
municipal buildings
3. Seeing the freed up electricity demand as an opportunity for growth and densification within the
municipality, which will increase sales again.
4. Acknowledging that money saved by end users from EE interventions can feed back into the local
economy and grow it further
Amongst the built environment (commercial, residential and industrial) all new building development is
now subject to the new, energy efficient building regulations captured in SANS 10400-XA. This requires that
a specified efficiency per square meter is met in the building design, and a minimum of 50% of heating
requirements must be met through solar water heating/heat pump. Challenges in enforcing the new
regulations need to be addressed for the full effectiveness of these regulations to be realised.
5.4 Municipal ‘own’ consumption
Comprehensive data on energy used by municipalities within their facilities and operations is often difficult
to obtain as municipalities do not always record electricity consumed, or record of this is included in the
broad commercial sector tariff category. Comparison of average consumption by category of use (per
TownTechnology Behavioural Total Low (50%) High (85%)
Residential (45% of total consumption)
EE Lighting (mid-high inc) 2.9% 0.4% 3.3% 1.7% 2.8% 12.3%
EE Lighting (low inc) 2.0% 0.8% 2.7% 1.4% 2.3% 10.1%
Geyser thermostat adjusting (10 degrees) 0.0% 0.8% 0.8% 0.4% 0.7% 2.9%
Aerated Shower Heads 0.9% 0.0% 0.9% 0.4% 0.7% 3.2%
SWH 8.6% 0.0% 8.6% 4.3% 7.3% 31.9%
Hot Boxes 0.4% 0.0% 0.4% 0.2% 0.3% 1.5%
Ceiilings in RDP houses-isoboard 0.4% 0.0% 0.4% 0.2% 0.4% 1.6%
Sub Total 15.1% 2.0% 17.1% 8.6% 14.6% 63.6%
Commercial (27% of total consumption)
EE Lighting 1.2% 0.8% 2.1% 1.0% 1.8% 7.7%
HVAC 3.2% 1.6% 4.8% 2.4% 4.1% 17.9%
Sub Total 4.5% 2.4% 6.9% 3.4% 5.9% 25.6%
Industrial (17% of total consumption)
Efficient Motors 0.7% 0.7% 0.3% 0.6% 2.4%
Variable Speed Drives 0.5% 0.5% 0.3% 0.4% 1.9%
EE Lighting 0.3% 0.1% 0.4% 0.2% 0.4% 1.6%
HVAC 0.1% 0.0% 0.1% 0.0% 0.1% 0.3%
Sub Total 1.5% 0.1% 1.7% 0.8% 1.4% 6.2%
Municipal (7% of total consumption)
HPS Streetlights 1.0% 1.0% 0.5% 0.9% 3.8%
Efficient buildings 0.2% 0.2% 0.1% 0.2% 0.8%
Sub Total 1.3% 0.0% 1.3% 0.6% 1.1% 4.7%
Total 22.2% 4.5% 26.9% 13.5% 22.9% 100.0%
% uptake by 2024Potential total energy reduction Impact as % of
all interventions

35 | P a g e
municipal operation) is also difficult as each municipality may record slightly differently. On average, ‘own’
energy consumption for municipalities (metro and smaller) is between 1 – 2% of total energy consumed in
the municipality. Although this is a relatively small proportion, municipalities are often the single largest
consumer in an area. They have control over this domain and can show leadership by example, making it an
important potential area for energy efficiency implementation.
Figure 12: Illustrative example of the spread of energy consumption between typical municipal operations
A detailed study, commissioned by the SA Cities Network, is underway to explore the energy savings
potential of these sub-sectors in more detail27 and data emerging from the DoE Municipal EEDSM
programme should also provide insight into savings that can be achieved. Based on information available to
date, the following is indicated:
1. Traffic lighting: LED lighting has become the standard efficient retrofit technology. Where
incandescent and halogen light bulbs require replacement every four months, LED traffic light
fitting last 5 – 8 years, substantially reducing maintenance costs. Operating costs are substantially
reduced due to lower wattages and payback periods are short. LED technology is easy to retrofit as
it fits the existing aspects.
2. Street lighting: this often represents a sizeable portion of municipal ‘own’ consumption and savings
of 20% within the sub-sector can be achieved. It is important to get all the aspects of lighting right –
lamp, reflector, ballast and power switch – in order to achieve maximum efficiencies and
procurement specifications should ask for the unit price and output of a Lighting Scheme rather
than of the luminaire only. Municipalities are exploring a range of efficient technologies, including
high pressure sodium, LED, induction and CFL.
3. Building efficiency: the results of a detailed study28 examining 3 classes of public buildings (medium
sized multi-storey office blocks, single storey, multi building compound and large multi storey office
block), indicated that:
a. Single storey compounds offer the least efficiency savings potential (13 – 22% as opposed
to 17 – 35%);
27
Report is to look at the nine SA Cities member cities. Report is due June 2014. 28
Analysis Report: Baseline, energy savings potential and energy efficiency Programme in Public buildings in South Africa, prepared by Sustainable Energy Africa for GIZ V-NAMA Programme, 2012.
Local govt energy use by service (GJ)
Buildings andFacilities
Water & WasteWater Treatment
Street andTraffic Lights
Vehicle Fleet

36 | P a g e
b. Maximum efficiency benefits would come from retrofitting the large multi-storey office
blocks typically found in cities and larger towns;
c. In terms of intervention choice, efficient lighting should be prioritised due to its high
savings potential in all building types and ease of implementation (easy to apply even in
capacity constrained municipalities);
d. All on-ground building engineering staff noted that capacity to monitor and manage energy
buildings is critical; as is the knowledge to ensure that new build and refurbishment of
public buildings adhere to all efficiency regulation.
Table 6: Municipal building efficiency target recommendations
Municipal type Programme Interventions Potential savings
Metro and larger towns All multi-storey office buildings; Larger building compounds
Full suite of interventions (lighting, HVAC, water heating)
17 – 35% off baselines
‘Smaller’ municipalities All office buildings above 1 000sq m
Efficient lighting 13 – 16% off baselines
Source: Analysis Report: Baseline, energy savings potential and energy efficiency programmes in Public buildings in South Africa, prepared by Sustainable Energy Africa for GIZ V-NAMA Programme, 2012.
4. Water pumps: this is a new area of interest and data should shortly be forthcoming.
5. Fleet management: municipalities indicate that substantial savings can be achieved in liquid fuel
consumption through: Procurement of efficient vehicles, improved driving skills, reorganisation of
trips and trip management. Savings potential has yet to be developed.
5.5 Management of losses
Technical and non-technical electricity losses are an important aspect of municipal electricity efficiency that
requires attention29. Reports of losses of as much as 1/5th of all electricity entering a municipal area have
been recorded. Non-technical losses are often as much within industrial and commercial areas, as much as
it is an issue of illegal household connections. Loss management requires a tightening up of billing systems
and administrative management, and electricity infrastructure that is well maintained and managed.
Distribution businesses must include investment in grid infrastructure development and maintenance.
6. Renewable Energy Large-scale renewable energy supply is a national government function. Local renewable energy generation
is, however, starting to become financially viable. Local government distributors and Eskom distribution
have only recently started developing frameworks to allow small generators to connect to, and feed into
the grid in a way that is feasible for both the distributor and small-scale generator. The regulatory system
remains unclear regarding the need for licensing of small generators (between 100kW-1MW). NERSA
guidelines issued in 201130 indicate that generation ‘for own use’, below 100kW, does not require a license.
This guidance requires greater legal clarification, including the definition of ‘own use’ (the working
assumption is that this is based on annual net generation being lower than net consumption).
29
SACN State of Municipal Finances looks at this in some detail. 30
NERSA: Standard Conditions for Embedded Generation within Municipal Boundaries (less than 100KW), 2011

37 | P a g e
There are concerns regarding the impact on municipal revenue of large-scale adoption of solar PV and
other small scale embedded generation options. Appropriate tariffs will need to be developed and
implemented to avoid this situation. However, there is work underway (led by DoE and Eskom) to design a
standard offer approach in line with the national REIPP Programme that would purchase energy from
embedded generators at a set prices so as to render municipalities indifferent between their Eskom supply
and embedded generators (IRP 2010 Update Report, 2013).
Because capital investment for embedded generators is borne by the owner and not government or the
national utility, and job creation potential in this industry is significant, promotion of such generators has
the potential to be economically very beneficial for municipalities and the country as a whole. This is
reflected in the IRP 2010 Update Report, 2013, which explores a fairly aggressive local PV uptake. Limits will
need to be set to ensure grid stability. The draft NRS097-2-1 (which governs small scale embedded
generation and is set to replace the existing NRS097 sometime this year) limit PV installations to 25% of
maximum demand of each site in most circumstances. Given capacity factors this effectively limits total
contribution of grid linked PV to 10% of total demand.
Municipalities themselves have potential renewable energy resources, including landfill gas, sewage
methane and micro-hydro on water distribution systems. Landfill gas electricity generation has potential to
be an economically feasible and important low carbon supply option. However experience shows that
implementation and ongoing operation is demanding. Its feasibility therefore needs investigation before
being pursued by individual municipalities.
Sewage methane electricity generation, usually for on-site electricity requirement reduction, holds promise
as being a financially attractive low carbon energy option in many cases. Again, the threshold feasibility of
this generation option needs to be clarified so that municipalities can be guided regarding its pursuit.
Micro-hydro installations, sometimes embedded in the water supply network of municipalities, can be
viable in certain circumstances. Clarity is needed on conditions for viability.
Some Provinces (KZN, Eastern Cape, and Western Cape) have identified small scale renewable energy
projects that could be developed by municipalities and are developing support activities. Whether
municipalities can themselves be Independent Power Producers within REIPP requires clarification.
Biofuels are an important component of a low carbon energy trajectory for urban areas. However
promotion of liquid fuel mix changes largely rests with national government, not local government.
7. Municipal sustainable energy development underway
Substantial energy efficiency and renewable energy development is underway in South African
municipalities. Some 13 cities/towns in South Africa have Energy and Climate Change Strategies either
developed or underway. These are mostly within metros and secondary cities. Provincial strategies, with
local municipal support programme, are also in place in the Eastern Cape, Western Cape and Gauteng
Provinces. Substantial institutional development has accompanied these strategies, with at least 3 cities
having developed new units employing from 2 – 10 dedicated staff. The figure below provides a visual
indication of the kind of institutional and governance growth in this area from 2006 – 2014 (as the field
develops, the kind of indicators in fact need adjustment, but included here as is for purposes of
demonstrating institutional expansion/growth).

38 | P a g e
Figure 13: Source: Sustainable Energy Africa, State of Energy in SA Cities, 2011
Although metros are pioneering this area of work at a substantial scale, the sense is that a great many
secondary cities and smaller municipalities are engaging with the issues and beginning to address
efficiency/renewable energy related work. Work underway includes31:
1. policy development and the inclusion of energy efficiency and renewable energy into IDPs
2. municipal ‘own’ consumption: building and facility efficiency retrofit; efficient street and traffic
lighting retrofit
3. energy efficiency: commercial energy efficiency activities (real time metering, communications
forum); behaviour campaigns; solar water heating rollout, geyser ripple control, enforcement of
new EE building regulations
4. energy poverty: thermally efficient low income housing delivery
5. renewable energy: waste to electricity, renewable energy purchase
6. transport: bus rapid transit, non-motorised transport support (pavements, pedestrian walkways or
bridges, bicycle lanes/schemes)
7. urban/spatial planning and efficient development planning processes.
Currently the major programme supporting Municipal ‘own’ energy efficiency is the DORA-funded
Municipal EEDSM Programme, run by the Department of Energy. This programme, begun in 2009, has now
been running for nearly five years, and has supported some 20 – 30 municipalities across all types (A-B) in
the retrofit of traffic, street and building lighting, as well as the audit of buildings and increasingly also in
the area of municipal water pumping. Increasingly, there are applications by residents and businesses to
feed in renewable energy source power to the local distribution grid.
31
See Appendix 1 for a more detailed, though still partial, overview of renewable energy and energy efficiency projects underway across the country.
Municipal energy and climate change governance matrix
Au
dit
of
mu
nic
ipal
en
ergy
use
Stat
e o
f en
ergy
dat
a re
po
rt
Ener
gy a
nd
Clim
ate
Ch
ange
Str
ateg
y o
r
po
licy
Ener
gy a
nd
clim
ate
chan
ge v
isib
le in
IDP
Ro
uti
nel
y co
llect
ed e
ner
gy a
nd
clim
ate
rela
ted
dat
a
Pla
nn
ing
fram
ewo
rk s
pea
ks t
o e
ner
gy
effi
cien
cy is
sues
, e.g
. den
sifi
cati
on
Tran
spo
rt p
lan
inco
rpo
rate
s lo
w c
arb
on
city
go
als
Gre
en p
rocu
rem
ent:
eff
icie
ncy
an
ase
pct
of
flee
t p
rocu
rem
ent
Reg
ula
tio
n r
elat
ing
to s
ust
ain
able
ener
gy d
evel
op
men
t/em
issi
on
s
red
uct
ion
Ener
gy e
ffic
ien
t b
uild
ing
cod
es o
r
guid
elin
es
Ded
icat
ed e
ner
gy a
nd
clim
ate
chan
ge
staf
f
Ener
gy a
nd
clim
ate
chan
ge m
anag
emen
t
stru
ctu
re
Bu
dge
t al
loca
ted
to
en
ergy
an
d c
limat
e
chan
ge m
anag
emen
t
Co
mm
un
ity
- co
mm
erce
, cit
izen
s,
ind
ust
ry -
en
ergy
or
clim
ate
foru
m
Ren
ewab
le e
ner
gy g
ener
atio
n in
mu
nic
ipal
ity
or
pu
rch
ase
effi
cien
t w
ater
hea
itn
g/ S
WH
pro
gram
me
un
der
way
Go
vern
men
t h
ou
sin
g d
eliv
ery:
eff
icie
ncy
,
no
tab
ly c
eilin
gs, i
ncl
ud
ed in
TO
R
Enga
ged
in li
ghti
ng
(str
eet,
tra
ffic
,
bu
ildin
g) e
ffic
ien
cy r
etro
fit
Co
mm
un
ity
awar
enes
s p
rogr
am a
rou
nd
effi
cien
cy o
r cl
imat
e ch
ange
Smar
t m
eter
ro
ll o
ut
pro
gram
me
un
der
way
Cape Town
Ekurhuleni
eThekwini
Joburg
Tshwane
NMBMM
Buffalo City
Mangaung
SPM
Polokwane
Saldanha
Sedibeng
Tlokwe
Mombombela
King Sabata
uMhlatuzi
uMsunduzi
STM
KwaDukuza
Rustenburg
2013
Institutional development
2006
2011
ImplementationData and policy Regulation

39 | P a g e
No comprehensive register of energy efficiency and renewable energy projects at the local level exists. The
Eastern Cape Province is busy developing a registry for its local municipal areas. This will be an important
pioneering document for the country. The table below outlines projects underway that were presented
within the municipal consultation process relating to this strategy development. It is extremely important
that the experience developed here is expanded and built upon.
Table 6: Overview of energy efficiency and renewable energy projects currently underway in South
African municipalities.
Energy Efficiency
Municipal EEDSM funded projects
A number of municipalities have been part of the DoE municipal EEDSM Programme. Street and traffic lighting projects as well as energy efficiency awareness programmes have been funded through these funds.
Eskom projects Eskom has carried out its residential CFL mass rollout programme in a number of municipalities.
Municipal funded projects Some municipalities indicated that they have used their own funds for lighting retrofits in municipal owned buildings.
Renewable Energy Projects
Municipal waste-to-electricity
A number of municipalities have conducted, or are in the process of conducting, feasibility studies on landfill gas to electricity. However, one municipality that has completed such a study indicated that no developers seem interested in carrying out the project although the feasibility study indicated a potential for this.
SALGA & GIZ are providing assistance to Umjindi municipality on developing a waste to electricity project.
Studies on generation of electricity for on-site operations from wastewater indicate feasibility.
Solar water heater installation
Low pressure solar water heaters are being installed in some municipalities as part of the national solar water heater programme run by Eskom & the DoE.
High pressure SWH campaign being run by City of Cape Town (endorsement programme).
Solar PV installations Some larger municipalities (and provinces) are installing PV on municipal building rooftops for grid feed-in.
Solar PV traffic lighting Pre-feasibility studies are being carried out on the installation of solar PV panels on traffic lights in a couple of municipalities.
Hydropower Hydropower generation being developed at the municipal owned Witbank dam.
Micro hydro feasibility studies have been done on the water distribution pipes in eThekwini and a project under development.
Rural Off-Grid PV electrification
Most rural municipalities indicated that their municipalities are recipients of the national small-scale solar PV installation programme being run by Eskom & the DoE.
Wave energy/power One coastal municipality indicated that it was investigating generating 40GW electricity from the Agulhas Current System (Indian Ocean)
Bio-fuels Feasibility studies on potential bio-fuel projects have either been conducted or are in the process of being carried out in some municipalities. Some of the municipalities are working with sugar producers and Eskom around development of such projects. While some are community run projects.
The institutional framework
There are a number of national, provincial and local structures that either have a bearing on, or offer
potential towards, local energy development.
Sphere Organisation /Area of relevance for local energy development
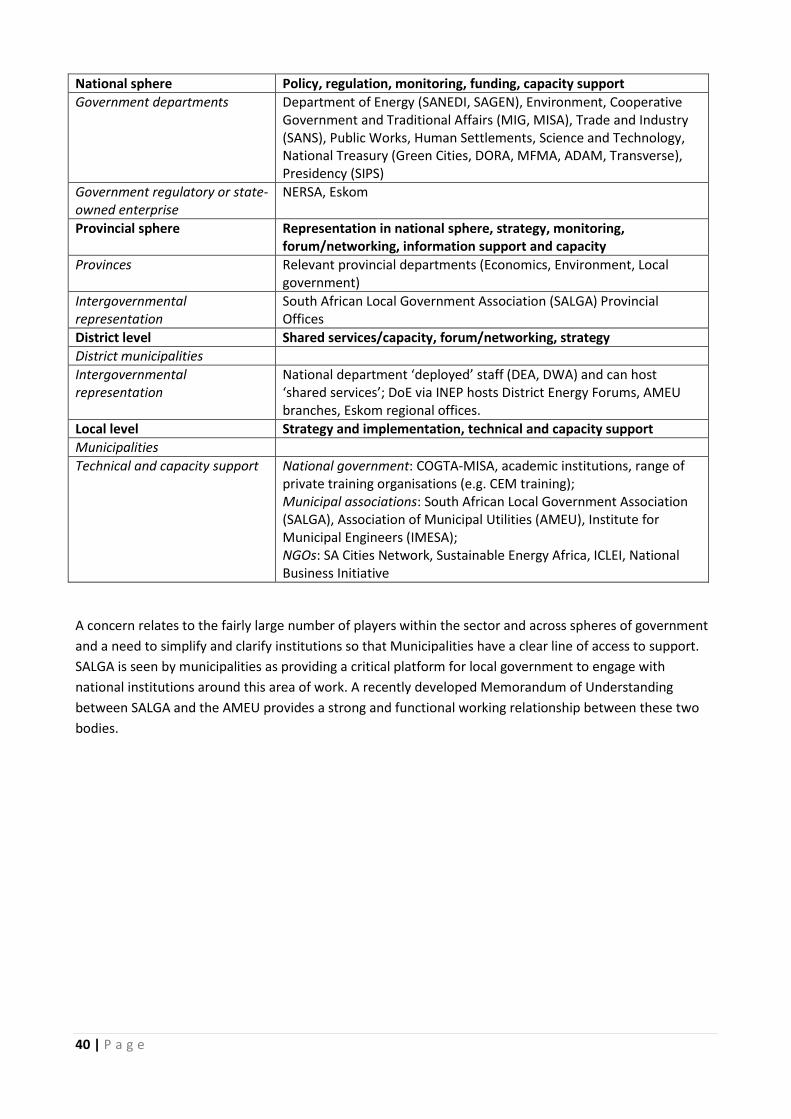
40 | P a g e
National sphere Policy, regulation, monitoring, funding, capacity support
Government departments Department of Energy (SANEDI, SAGEN), Environment, Cooperative Government and Traditional Affairs (MIG, MISA), Trade and Industry (SANS), Public Works, Human Settlements, Science and Technology, National Treasury (Green Cities, DORA, MFMA, ADAM, Transverse), Presidency (SIPS)
Government regulatory or state-owned enterprise
NERSA, Eskom
Provincial sphere Representation in national sphere, strategy, monitoring, forum/networking, information support and capacity
Provinces Relevant provincial departments (Economics, Environment, Local government)
Intergovernmental representation
South African Local Government Association (SALGA) Provincial Offices
District level Shared services/capacity, forum/networking, strategy
District municipalities
Intergovernmental representation
National department ‘deployed’ staff (DEA, DWA) and can host ‘shared services’; DoE via INEP hosts District Energy Forums, AMEU branches, Eskom regional offices.
Local level Strategy and implementation, technical and capacity support
Municipalities
Technical and capacity support National government: COGTA-MISA, academic institutions, range of private training organisations (e.g. CEM training); Municipal associations: South African Local Government Association (SALGA), Association of Municipal Utilities (AMEU), Institute for Municipal Engineers (IMESA); NGOs: SA Cities Network, Sustainable Energy Africa, ICLEI, National Business Initiative
A concern relates to the fairly large number of players within the sector and across spheres of government
and a need to simplify and clarify institutions so that Municipalities have a clear line of access to support.
SALGA is seen by municipalities as providing a critical platform for local government to engage with
national institutions around this area of work. A recently developed Memorandum of Understanding
between SALGA and the AMEU provides a strong and functional working relationship between these two
bodies.

41 | P a g e
Conclusion: Strategic Issues to be addressed Based on the status quo data analysis and the issues raised within the consultation process32, it is clear that
multiple energy issues reside at the local level and that the rapidly changing energy landscape requires that
municipalities engage and manage these issues towards strengthening national energy security and climate
response, addressing poverty alleviation and ensuring sustainable service delivery. There is a strong
commitment and desire amongst local government to do this; however, circumstances are challenging and
coordinated support is required.
The following key issues must be addressed within the Municipal Energy Efficiency and Renewable Energy
Strategy:
Leadership and political direction
Build on and develop the existing strength of feeling and commitment towards tackling these issues
Energy efficiency and renewable energy must be ‘translated’ into the language of local
government, i.e. basic service delivery
Must address local priorities – poverty alleviation – hence energy poverty/access issues must be
included
Must be visible, with tangible benefits (pilot projects recommended)
Greater engagement between national and local government in policy development
SALGA has key role to play here
Mandates, institutions and governance
Role of municipalities must be made clearer in national policy and guidance (directive) issues as to
the articulation of the policy at local level
This must also address the capacity of municipalities in meeting these responsibilities
New or clarified responsibilities must be integrated into the system – job description of Municipal
Manager and into IDP requirements and related systems
Internal energy for municipal own facilities and operations: start here
Strengthen the SALGA platform for municipalities in this area of work, and the SALGA-AMEU
working relationship
Municipal revenue models that can support this work
Energy planning and Electricity business within municipalities
Data to do proper energy and electricity planning must be available
Electricity service delivery must be sustainable and requires better planning, billing, metering and
for this – capacity is needed
Address capacity shortages and particularly within technical positions
Clarify regulatory framework, particularly relating to embedded generation
Streamline data reporting requirements
Grid maintenance
Revenue protection (including eradication electricity theft), grid stability relating to RE uptake
Implementing energy efficiency and renewable energy projects
32
A full set of minutes from each workshop is available from SALGA, and a summation of all issues raised can be found in Appendix 1.
42 | P a g e
Capacity support, possibly through technical unit (technical, financial)
Funding streams to be expanded (including ring-fencing of efficiency savings, inclusion of
embedded generation within the RE Independent Power Producers Programme (REIPPP) funding
streams, private-public partnerships, amongst others)
Training of existing staff (e.g. in enforcing SANS 204)
Supporting partnership development for renewable and efficiency development (PPPs)
Networking platforms, innovation hubs, knowledge sharing
Importance of practicality and viability of projects; avoidance of any technology dumping
Implementation Priorities
Internal energy for municipal own facilities and operations: start here
Alignment of bulk infrastructure projects across departments and inclusion efficiency within all
projects
Access to energy for the poor including: thermal efficiency low income housing; Energy packages
for poor: electrification (on and off grid), improved wiring, FBE/FBAE, tariffs, efficient lighting and
alternative/clean appliances/ technologies for cooking, lighting
Clarity of where this mandate lies within municipalities as it is not within the licensed mandate of
utility distribution licenses under NERSA/the Electricity Regulation Act
Built environment – enforce new energy efficiency regulations
Spatial planning to stem urban sprawl and inefficient growth
Non-motorised transport and public transport support
Community awareness and education
The support required is extensive and, although this strategy is to be held by municipalities and led by
SALGA, achievement of the strategy will require enormous levels of cooperation and partnerships across
government and between government and the private sector and the NGO/academic/research sector.

43 | P a g e
References
Baseline, energy savings potential and energy efficiency programmes in Public buildings in South Africa,
prepared by Sustainable Energy Africa for GIZ V-NAMA Programme, 2012.
DoE/HSRC Household Energy Survey, 2012
DoE [Department of Energy]. 2013. Presentation on the Integrated National Electrification Programme
made to the Parliamentary Portfolio Committee on Energy on 10th September 2013. South Africa.
DoE [Department of Energy]. 2012. A survey of energy-related behaviour and perceptions in South Africa,
The Residential Sector, Pretoria. Available at:
http://www.energy.gov.za/files/media/Pub/Survey%20of%20Energy%20related%20behaviour%20and%20
perception%20in%20SA%20-%20Residential%20Sector%20-%202012.pdf [Accessed October 2013]
DoE [Department of Energy], Development of a first Draft of a National Energy Efficiency Action Plan (NEEAP) for the RSA, Draft 5, DoE, 2013.
DME [Department of Minerals and Energy]. 2007. Free Basic Alternative Energy Policy (Households Energy
Support Programme). Department of Minerals and Energy. Republic of South Africa.
DME [Department of Minerals and Energy]. 2005a. Free Basic Electricity Policy. Department of Minerals and
Energy. Republic of South Africa
DME [Department of Minerals and Energy]. 2005b. Energy efficiency strategy of the Republic of South
Africa. Pretoria, South Africa.
Euston-Brown, M, for Durban Climate Change Strategy Introductory Report: Sustainable Energy, 2013
COGTA: Towards an Integrated Urban Development Framework: discussion document, October, 2013
National Treasury Technical Assistance Unit, 2013, Energy Efficiency Guidelines, Guide for Municipal
Officials in South Africa (Project No. 662): provides a stepped approach to developing internal energy
efficiency policy within municipalities or provinces and detailed guidance on undertaking building/facility
efficiency project implementation.
National Treasury Technical Assistance Unit, 2013, Increasing Investment in Climate Change Related
Projects at the Sub National Level, Phase 1: Diagnostic Report: Barriers and Challenges to Implementing
Climate Change Projects (Project No. 662), Prepared by Misuka Green Development Solutions: provides an
overview of challenges faced at the local level in developing climate response projects and proposed key
interventions to overcome these.
National Treasury Technical Assistance Unit, 2013, Increasing Investment in Climate Change Related
Projects at the Sub National Level, Phase 2: Towards a Financing Framework for Implementing Climate
Change Projects (Project No. 662), Prepared by Misuka Green Development Solutions: provides detailed
technical financial information towards supporting investment in local level climate response projects.

44 | P a g e
NERSA: Standard Conditions for Embedded Generation within Municipal Boundaries (less than 100KW),
2011
PDG (Palmer Development Group). 2013. Review of the impact of inclining block tariffs for electricity on
poor households. Report for BUSA. Cape Town. Available at:
http://www.ameu.co.za/ejournal/2013/9/30/inclining-block-tariffs-ibt-review-of-the-impact-of-
inclinin.html [Accessed November 2013]
Sustainable Energy Africa: various guides, reports and State of Energy in SA Cities 2006 and 2011.
SA Cities Network: Consolidation of Lessons Learnt for EE and RE Initiatives within Cities, Development of a
Roadmap for Future Uptake, November 2013. Prepared by Aurecon.
Tackling Urban Energy Poverty In South Africa – A Report compiled by Sustainable Energy Africa, January
2014. Research funded by Heinrich Böll Stiftung Southern Africa
US Energy Information Administration: South Africa, January 2013 update
Ward, S, The New Energy Book, 2008

45 | P a g e
Appendix 1: Compilation of EE and RE work underway amongst
municipalities represented within the consultation process
Note: this list is limited to capturing some of the input received and gathered in the consultation
workshops, rather than a comprehensive audit (this was not formally covered in each workshop). Even with
these serious limitations, it provides an indication of just how extensively involved municipalities already
are in this area of work.
Kwa-Zulu Natal
Municipality EE and RE Initiatives underway
Dannhauser LM Internally funded rural PV installation Programme RE
Biofuel generation potential (feasibility studies conducted) RE
Hibiscus Coast LM EE awareness programme being run with Eskom – including rollout of CFLs
Ocean Current power generation (potential 40GW within the Agulhas Current ) – RE
EE retrofits of municipal’s own buildings including the Mayor’s Office
UGU District Municipality’s 20-year Growth and Development Strategy incorporates RE & EE development
EThekwini EE awareness campaign still ongoing
Solar PV facilitation – RE
EE street & traffic lighting retrofits (EEDSM funded Programme)
Metro engaging sugar producers around biofuel & electricity generation but most plantations fall outside the metro’s boundaries RE
EThekwini developing a programme for selling “Green Power” as a different product so as to deal with the MFMA restrictions.
Emnambithi/Ladysmith LM
Rural PV electrification project by the DoE (KES |Energy Services) RE
Waste-to-energy biogas project proposed RE
iLembe DM Peaking power plant being built by French company (air-to-electricity) RE
Enterprise iLembe – part of the COGTA funded “Corridor Development Project”
Mandeni LM Rural Cooperatives have been established to produce biofuels from the Moringa tree RE
SAPPI looking into installing gas turbines to generate power Fuel switching
Msunduzi LM Private developer looking at installing a 1MW PV system to feed into the municipal grid
Ingwe LM Proposed development of Biofuels plant RE
Endumeni LM CCC Biogas project (cow dung/chicken waste etc.) RE Umvoti LM Biofuels production from sugar cane RE
Umzinyathi DM (Endumeni & Nquthu LMs)
Municipalities part of DoE’s Rural PV electrification programme being implemented by KES Energy Services RE
Eastern Cape
NB: a detailed registry is available in the Province
Summary of work underway
In Province logging of all EE/RE policy and projects has been made, capacity support has been provided to some of the municipalities.

46 | P a g e
Waste management in smaller municipality has been implemented
Alien plant species are currently eradicated and there will be solar panels installed which will onset “off-grid electrification” in one small municipality (Cofimvaba).
Climate change and renewable energy strategies has been developed in BCM.
There are biogas and biomass projects that are under way which would generate electricity and sell it to ESKOM. The biogas comes from the concept of “zero waste.”
There is hydro scheme currently under development.
Wind energy is also under development.
Free basic access to energy has also been implemented in some smaller municipalities, in others is under exploration to move away from paraffin to other cleaner and safe sources like electricity and LPG.
Internal EE has been implemented with possible exploration of Solar PV.
EE buildings and street lighting retrofitting is also under implementation.
ESKOM has provided supply of FBE and provided technical support on SWH, CFLs and Demand Side Management.
Mpumalanga
Chief Albert Luthuli LM 400 low pressure solar water heaters installed by Eskom & DoE
Msukaligwa LM Eskom’s residential CFL mass rollout programme was implemented (EE)
Streetlight retrofits internally funded by municipality (dead inefficient lights being replaced with EE ones) (EE)
Municipality currently considering installing solar PV panels (RE) for its traffic lights (however solar might not be a viable solution considering weather variability in the Ermelo region). Mountainous and located in high pressure area
Emalahleni LM Landfill gas-to-electricity feasibility study completed and found that there is sufficient methane but no developers seem interested in taking the project further. One company was interested but due to tedious process of stakeholder engagement and applications the project fell through. Not sure how to gain interest of private investors. They would like a national programme to support them in obtaining such investments and possibly an ease of legislation to increase the attractiveness of such projects. Engage MESA on this issue to practically go and do these studies for opportunities (RE).
EEDSM funding for street and traffic lighting retrofits (EE)
EE awareness programme has also been initiated using the EEDSM funds
Municipality in collaboration with Tshwane University of Technology (TUTs) currently working on a hydropower generation project (RE) from the municipally owned Witbank Dam (biggest municipal owned dam in the Southern Hemisphere)
o Water extraction permit has been granted by the DWEA (water use rights reside with DWEA, as the State owns all water/dams)
o This project is being developed as an educational (research) project with the university
o Funded by the Swedish/ German government (not sure on

47 | P a g e
funders) o Electricity to be used to power the municipality’s own Water
Pumping stations (Bulk Water Supply) o Emalahleni Municipality – provides the infrastructure (piping,
buildings etc.) and allows for the use of its dam
Ripple Control project funded by Eskom is also being implemented within the municipality (demand-side management) – the switches being installed cost R800/unit.
Municipality currently developing an ENERGY MASTER PLAN – funding is currently being sort. This PLAN will be separate from the Electricity Plan.
As part of the Ripple Control Project Emalahleni Municipality has a contractual agreement with Eskom to shed 10MW between 0600 – 0800 (morning) and the same between 1800 – 2000 (evening time)
Mbombela LM Hydropower project might be developed mentioned in SoE Report (RE)
Munic also received funding under the DORA EEDSM programme for street and traffic lights retrofits
Umjindi LM (though not present @ workshop)
SALGA & GIZ assisting municipality in developing a waste-to-energy project
IMESA MoU between SALGA and the IMESA providing support to Free State municipalities project funded by COGTA
Gauteng
Tshwane Smart grid metering – off balance sheet financing
Scale public transport and NMT
Building by-laws
PVT sector leverage – waste to energy recycling
Financial sustainability impact
Midvaal EEDSM, 7 million for street lighting, 5 million for buildings.
Western Cape
NB: a full registry is under development within the province
48 | P a g e
Appendix 2: Objectives, priorities and possible actions or intervention
Programmes as emerging from the municipal consultation process
Priorities: Poverty alleviation, job creation, energy access, environmental protection, economic growth,
reduce stress on municipal distribution grid, security of supply
Uptake of EE
o Municipal buildings have EE measures
o Street and traffic lighting is EE: again, guidance to be provided (is an existing guide, but to
update this with more detail now that several municipalities have been developing
experience of different technologies) in response to concerns articulated about the
efficiency and cost and reliability of LED lighting.
o Consider possibility of Eskom incentivising the street lighting tariff to promote efficient
technology; and whether there cannot be some form of premium charge where
municipalities are inefficient or cannot account for usage.
o Must use the planning approval process to ensure that radically new and more energy
efficient ways of doing things are built into new developments from the outset – in the
primary design. Where lack of capacity, this should be developed or supported.
o Projects must be viable and practical
o Uptake of electric vehicles
o Efficient fuels for cooking (and stabilisation LGP price through regulation)
o Education /awareness
o Support from Eskom: rollout of CFLs, SWH, DSM and provision of technical support
o Consideration of time zones to decrease the electricity peak loads
o Get EE into the planning phases of all municipal projects, e.g. low income housing
development, transport planning, etc.
o Build EE into procurement processes
o Involve SABS in ensuring that technology uptake is sensible, viable and based on sound
technologies (avoid technology dumping).
Alternative sources of energy that are environmentally friendly - RE
o Solar rooftop PV on municipal buildings
o Waste to energy projects/ biogas/ biomass
o Micro hydro energy generation
o Development of inexpensive electricity storage devices
o Regulation of LPG to stabilise price and facilitate rollout to poor under FBAE
o Need to include small scale supply at the local level within national energy and electricity
plans. For instance, can these schemes receive funding through the national REIPP
Programe, i.e. be included in the IEP and IRP and have funding streams come down to them
– that way local government can draw in private partnerships for their development. It
does not make sense for local government to get into complex wheeling agreements so
that small-scale embedded can benefit from REBID funding stream via the Eskom Single
Buyers Office.
o National government, via the IEP and Electricity Regulation Act (ERA) must provide greater
clarity on ‘grey areas’ relating to local, embedded, small scale RE (‘own use’) that must be
handled by municipalities.

49 | P a g e
o Changes in national supply approaches should be mapped as these have implications for
local government that need to be considered and when national energy planning requires
new approaches from local government, the appropriate skills and resources for new
capacity development must be considered and provided – e.g. of natural gas coming online
and how municipalities will need to reticulate this.
o Regulation and processes must be in place relating to small-scale RE feed in to local grids and this is a challenge for all local government, but particularly smaller (concerns around additional time in relation to grid maintenance should there be feed-in taking place can be alleviated given that inverter technologies can build in automatic islanding processes; however this is why it is so important that feed-in takes place in a regulated and ‘legal’ manner rather than ‘cowboy’ style). Need SABS guidelines on technologies for metering, inverters, etc.
o The actual type of meter and the billing/accounting process makes the process of embedded feed in more or less difficult. Some areas do not have technology or systems that can easily accommodate the new approaches required by RE feed-in. Support will be required here.
o Address issues of power storage relating to rooftop PV or other systems.
Access to electricity / ‘safe/ modern’ energy for all
o Fair and transparent electricity pricing system
o Capacity building in communities to understand efficient and safe use of energy
o Explore Electrification, LPG or PV as alternative to paraffin distributed under FBAE
o All housing delivery MUST ensure that funding is allocated to include thermally efficient
measures, as required by SANS 10400, and these aspects are included in housing delivery.
o Location of housing should not relegate the poor to the furthest margins thus reducing
access to jobs, information, education resources, etc.
o Subsidy allocation – concern that with indigent policy many of the poor are not being
reached; also, with ‘illegal’ connections the poor don’t receive the subsidy, so informal
areas should be connected (SEA resource).
o Strategy: Within low income – important to continue to electrify (formally so that receive
subsidy), awareness, thermally efficient homes, wood in rural municipalities (KSD,
Thulamela, Polokwane).
Energy security, and the institutions to manage it
o Eradication of electricity theft
o De-link municipal revenue and electricity revenue to ensure money retained for
maintenance of infrastructure and that efficiency is pursued
o Grid expansion and maintenance plans important (integrate with development plans, etc.).
Currently there is an erosion of infrastructure – 6% of revenue meant to go to
maintenance, but this is not ring fenced, so can end up being far less in practice. There is an
NMBMM GIZ research study which can provide some detail on the issues.
o Appointment of expert to look at tariff structures (possibly via Eskom).
Integrated energy planning and systems
o Integrated planning across departments, this relates to housing, transport, spatial
development, electricity, etc. – again must build into IDP system, but even this not enough
– still planning in silos – so beyond and work out ways to integrate and align separate funds
and processes (e.g. electricity planning, housing and street planning).
o Need better access to data
o Establishment of smart grid and net-metering, hybrid mini grids: exploration of this, where
applicable, where not; cost vs benefits. SANEDI/MISA done studies on this. This information
50 | P a g e
should be drawn on and a guide provided to all municipalities as to the application of this
technology. This could also use case studies, for example, Tshwane is in the process of
rolling out a smart meter programme.
o Alignment of investment for bulk infrastructure projects across all spheres of government
(particularly transport, housing); does the ADAM programme, looking to address
infrastructure backlogs, and the MIG, offer opportunities here?
o Engagement of local government with national energy and electricity planning processes:
local government are often called on to distribute or implement aspects of the plan, or are
affected (tariffs, cost recovery, capacity, mandate, and revenue) by aspects of the plan and
their issues must be represented and heard within the planning process.
Good town planning in support of efficiency and mobility
o Paths for cycling and walking
o Location of new urban developments – reducing sprawl and improving healthy
densification
o Noted that spatial form has a large impact on fuel consumption, and this must be taken
into account in all infrastructure and development planning
o Institutionally – consider close alignment between transport and urban planning
o Functional regional planning: Planning should increasingly be based on functional units and
not only geopolitical boundaries (case in point being transport planning across Gauteng).
Efficient transport
o Improved public transport
o Freight to rail
o Large public transport programmes are developed by national government and goals may
not align with local government – SALGA needs to have these discussions at national level
o Noted that efficiency often only considers electricity – need to make specific message to
bring in Transport into this area.
o Public transport needs to be desirable.
o Challenge of smaller towns – people commute from rural areas into urban centre, or from
one urban centre into another – how address this transport challenge – currently taxis.
o Consideration of regulation around private transport, e.g. congestion charging.
Policy and mandates
o Messaging: climate change is not a good message for local government. The message
should be in terms of local government business, which is first and foremost service
delivery, and it should balance social, environmental and economic aspects.
o Clarify mandate – SALGA has a role here – must detail what local government should be
doing (for example, is it the mandate of local government to get involved in electricity or
energy supply, or just the reticulation of it?). As noted below, this should include comment
on interpretation of the MFMA in relation to EE and RE for guidance to Finance
Departments.
o SALGA support to create platform between local government and provincial and national
government.
o Layered mandates: some areas must become part of business as usual, others can be
pursued on more voluntary basis
o Well defined strategy to address EE/RE and clear roles and responsibilities
o Resources to match responsibilities

51 | P a g e
o Political and top management buy-in: this urgent and highest priority – must be able to
‘make the case’ (value of tangible, real pilots, e.g. EE in government buildings)
o Must build into municipal systems: IDP, KPIs, Procurement, planning approval processes
o Consider de-linking EE and RE: phased approach with EE as the priority
o Reporting on EE/RE: as per Eastern Cape, Provinces could play a role in ‘logging’ all
municipal EE and RE projects underway and monitoring and providing capacity support
required; also if brought into the IDP, then there is a requirement to report on projects
listed in the IDP and their budgets and KPIs.
o With changing energy landscape and the increasing emphasis on demand/energy
consumption as well as more diverse and often embedded supply systems, it is important
that local government are more actively involved in the national policy process. Smaller
local governments noted that they often don’t have the capacity to engage in this and this
could be a support role performed by SALGA.
Institutions and capacity
o Possibility of an energy unit established at the District level and filtered down to the
municipalities with one rep of the unit sitting in each municipality
o Also technical expertise units – along lines of the MISA, possibly within MISA
o Knowledge sharing platforms, coordinated by SALGA, bringing together Metros, Eskom and
the District municipal offices
o Training, capacity and awareness building of new staff within units; and awareness raising
of all staff.
o Information portal (note SALGA-SEA urban energy support web platform underway)
o Draw on SALGA capacity and develop this further, particularly in relation to supporting the
unlocking of funding streams
o FET programmes to address municipal need for technical and policy skills in these new
areas
o Resource mobilisation: funds and human capacity, development for start-up motivation to
senior management. There is a need to generate incentives to take new approaches on
board.
o Local level energy strategies useful, these need to be approved by council, included within
IDPs and KPIs.
o SALGA to provide an overarching Municipal EE and RE Strategy (under development here)
and this should be rolled out via the Working Group and adopted by municipalities via the
Municipal Manager. This should then hold municipalities accountable. SALGA would play
the role of monitoring and facilitating implementation.
o There is a need for the transformation of the weighting of Key Performance Assessment
(KPAs) and SALGA could provide support towards this.
o Municipalities need to ensure that they are able to retain important technical skills and
capacity
o In natural gas comes online, appropriate training/skills provision for municipalities that
must reticulate this.
o Noted that financial compliance is the priority in municipalities and all resources go into
this, rather than budgets towards technical skills. National government, with SALGA, need
to emphasise the need for municipal job creation in area of technical staff.
o Lack of ‘new’ capacity and little, or no, succession for technical/engineering positions.
SETAs are failing and there are lots of ‘dis-enablers’ in the education sector.

52 | P a g e
o Possibility of re-initiating the system of municipal bursaries for technical courses/degrees.
o Artisanal training (pre dating SETAs) was considered effective: local people were trained up
and were thus more likely to be retained by the municipality.
o Streamline data requirements by national government. This is considered a Big Jo, but
important – creation of one reporting/data system that lines up requirements from IDP,
NT, DoE, NERSA, Eskom, DEA, etc.
o SANEDI can act as innovation hub to share and test new approaches.
o Call for SALGA to support communication with DoE in the EEDSM Programme as there have
been experiences of challenges to communication (in both directions).
Financing/ funding
o The savings from EE measures should be ring-fenced for expansion of programmes
o Need to develop a new financing model that does not depend on electricity revenues in
local governments – urgent need for government to develop and funding and revenue
model that can support this work
o Primarily, the EE/RE work must be linked to core business of the municipality and be
aligned to the main funding processes
o MIG could offer additional funding
o Partnerships with private sector for investments beyond the core business of municipality
o What is the scope of inclusion of small-medium scale, embedded Municipal RE projects
within IRP so that funding streams for more expensive RE come down to the local level
o Funding for innovation and new approaches to overcome rigid system
o NT to provide clarification note on MFMA in relation to EE and RE procurement: what is
‘value for money’, is it just cheapest option, or is there a more nuanced opinion. Direction
needs to be given to Finance Departments who take the more conservative view point.
An approach proposed:
o Lead by example / high level buy in – achieve this through tangible pilots, such as EE in
government buildings (strong agreement that municipalities must lead by example in their
own buildings and facilities),
o Secondly, EE/RE within municipalities must address the area of highest priority/ need –
poverty reduction – and undertake passive thermal housing interventions.
These two areas therefore should be primary, beyond this, more voluntary and flexible approaches
to be adopted as and where there is interest, motivation, opportunity.

53 | P a g e
Appendix 3: Full data sets with data source

54 | P a g e
Munic Electricity Coal Petrol Diesel Paraffin LPG
Natural
Gas HFO Jet Fuel
Aviation
Gas Wood TOTAL Source Base Year
Buffalo City
Agriculture 24 686 - 3 346 359 292 135 356 - - - - - - 522 680 SoE in SA Cities 2011 2007
Commerce 310 027 13 122 - - - 4 279 - - - - - 327 428 SoE in SA Cities 2011 2007
Government 159 388 14 580 28 171 38 807 - - - - - - - 240 946 SoE in SA Cities 2011 2007
Industrial 2 563 911 1 647 540 - 46 629 878 838 9 983 - 378 228 - - - 5 525 129 SoE in SA Cities 2011 2007
Residential 1 579 896 11 562 - - 1 027 129 14 262 - - - - 177 179 2 810 028 SoE in SA Cities 2011 2007
Transport 14 204 - 6 885 192 5 081 780 23 398 - - - - - - 12 004 574 SoE in SA Cities 2011 2007
Losses 3 722 3 722 SoE in SA Cities 2011 2007
TOTAL 4 655 834 1 686 804 6 916 709 5 526 508 2 064 721 28 524 - 378 228 - - 177 179 21 434 507 SoE in SA Cities 2011 2007
Cape Town
Agriculture 612 614 612 614 DEADP 2009
Commerce 8 299 430 937 035 9 236 465 DEADP 2009
Government 588 241 588 241 DEADP 2009
Industrial 17 091 565 3 055 991 1 874 069 3 967 139 25 988 764 DEADP 2009
Residential 17 712 886 2 034 767 937 035 20 684 687 DEADP 2009
Transport 680 768 41 620 196 30 064 496 18 338 382 46 892 90 750 733 DEADP 2009
International
Marine 44 815 082 44 815 082 DEADP 2009
Losses 3 317 875 3 317 875 DEADP 2009
TOTAL 48 303 379 3 055 991 41 620 196 74 879 578 2 034 767 3 748 138 - 3 967 139 18 338 382 46 892 - 195 994 461 DEADP 2009
Ekurhuleni
Agriculture 6 6 ICLEI 2011
Commerce 9 680 176 146 518 9 826 695 ICLEI 2011
Government 2 410 904 262 362 2 673 266 ICLEI 2011
Industrial 13 244 259 293 037 617 331 14 154 626 ICLEI 2011
Residential 12 053 010 1 265 870 146 518 13 465 398 ICLEI 2011
Transport 636 36 041 124 26 495 283 76 215 789 80 804 138 833 636 ICLEI 2011
Losses 2 158 878 2 158 878 ICLEI 2011
TOTAL 39 547 868 - 36 041 124 26 757 646 1 265 870 586 073 - 617 331 76 215 789 80 804 - 181 112 506 ICLEI 2011
EThekwini
Agriculture 596 932 3 059 036 415 554 4 071 522 eThekwini GHGI, LEAP 2010
Commerce 10 243 287 1 812 1 302 610 2 358 650 35 355 13 941 714 eThekwini GHGI, LEAP 2010
Government 1 329 154 187 082 461 834 10 881 1 988 951 eThekwini GHGI, LEAP 2010
Industrial 16 900 905 6 829 230 260 660 919 30 522 2 021 928 26 443 764 eThekwini GHGI, LEAP 2010
Residential 12 050 700 2 892 001 129 131 889 033 15 960 865 eThekwini GHGI, LEAP 2010
Transport 130 181 35 224 942 37 220 720 174 752 1 749 195 202 741 74 702 530 eThekwini GHGI, LEAP 2010
International
Marine 1 341 263 50 898 888 52 240 151 eThekwini GHGI, LEAP 2010
Losses 1 773 241 1 773 241 eThekwini GHGI, LEAP 2010
TOTAL 42 427 468 6 829 230 36 009 216 42 745 585 4 640 686 2 487 780 - 53 141 805 1 749 195 202 741 889 033 191 122 738 eThekwini GHGI, LEAP 2010
Johannesburg
Agriculture 3 968 36 388 168 187 1 133 209 676 SoE in SA Cities 2011 2007
Commerce 2 017 872 2 407 2 020 279 SoE in SA Cities 2011 2007
Government 1 118 835 58 320 11 254 46 555 4 942 1 239 906 SoE in SA Cities 2011 2007
Industrial 24 989 407 15 300 1 588 418 190 801 7 505 40 430 26 831 861 SoE in SA Cities 2011 2007
Residential 20 924 741 4 082 400 1 049 856 3 115 26 060 112 SoE in SA Cities 2011 2007
Transport 3 442 957 54 578 060 28 144 486 84 917 86 250 420 SoE in SA Cities 2011 2007
Losses - SoE in SA Cities 2011 2007
TOTAL 52 493 812 4 140 720 54 608 582 29 815 847 1 498 703 14 160 - 40 430 - - - 142 612 254 SoE in SA Cities 2011 2007
King Sabata
Agriculture - Ozone SoE 2013 2011
Commerce 570 265 19 646 6 142 134 870 4 066 734 989 Ozone SoE 2013 2011
Government 78 006 6 636 9 567 94 209 Ozone SoE 2013 2011
Industrial 8 582 188 29 665 36 135 187 53 044 127 801 Ozone SoE 2013 2011
Residential 286 275 6 667 411 207 65 053 4 370 773 572 Ozone SoE 2013 2011
Transport 2 242 272 1 040 044 11 089 3 293 405 Ozone SoE 2013 2011
Losses 31 507 31 507 Ozone SoE 2013 2011
TOTAL 974 635 6 667 2 249 096 1 098 922 453 484 200 110 - 53 044 11 089 - 8 436 5 055 483 Ozone SoE 2013 2011
KwaDukuza
Agriculture 40 848 40 848 ICLEI SoE 2013 2012
Commerce 575 884 575 884 ICLEI SoE 2013 2012
Government 53 269 8 616 3 207 65 093 ICLEI SoE 2013 2012
Industrial 556 328 19 691 576 019 ICLEI SoE 2013 2012
Residential 812 453 1 363 813 816 ICLEI SoE 2013 2012
Transport 1 855 799 1 127 313 2 983 111 ICLEI SoE 2013 2012
Losses 260 241 260 241 ICLEI SoE 2013 2012
TOTAL 2 299 023 - 1 864 415 1 130 520 1 363 - - 19 691 - - - 5 315 012 ICLEI SoE 2013 2012
Mangaung
Agriculture - SoE in SA Cities 2006 2004
Commerce - SoE in SA Cities 2006 2004
Government - SoE in SA Cities 2006 2004
Industrial - SoE in SA Cities 2006 2004
Residential - SoE in SA Cities 2006 2004
Transport - SoE in SA Cities 2006 2004
Losses
TOTAL 5 042 761 248 000 6 110 847 5 919 478 364 472 211 459 47 645 217 062 1 900 18 163 624 SoE in SA Cities 2006 2004
Mbombela
Agriculture 31 685 215 562 18 632 1 734 267 613 SoE in SA Cities 2011 2007
Commerce 116 062 3 685 119 747 SoE in SA Cities 2011 2007
Government 12 672 27 801 548 41 021 SoE in SA Cities 2011 2007
Industrial 607 946 916 73 084 21 137 11 489 790 646 1 505 219 SoE in SA Cities 2011 2007
Residential 480 928 116 306 4 769 602 003 SoE in SA Cities 2011 2007
Transport 4 881 155 4 258 135 9 407 9 148 697 SoE in SA Cities 2011 2007
Losses - SoE in SA Cities 2011 2007
TOTAL 1 204 936 - 4 926 428 4 574 582 166 030 21 678 - 790 646 - - - 11 684 300 SoE in SA Cities 2011 2007
Msunduzi
Agriculture 127 247 772 756 17 185 66 152 983 341 SoE in SA Cities 2011 2007
Commerce 140 574 140 574 SoE in SA Cities 2011 2007
Government 37 1 077 505 1 619 SoE in SA Cities 2011 2007
Industrial 78 176 19 495 438 259 335 267 871 198 SoE in SA Cities 2011 2007
Residential 107 270 181 919 289 189 SoE in SA Cities 2011 2007
Transport 4 990 097 2 784 809 8 676 7 783 583 SoE in SA Cities 2011 2007
Losses - SoE in SA Cities 2011 2007
TOTAL 6 447 101 8 518 389 5 117 382 3 636 818 153 132 826 903 - 335 267 - - - 25 034 993 SoE in SA Cities 2011 2007
Nelson
Mandela Bay
Agriculture 29 852 130 397 51 348 12 555 224 151 SoE in SA Cities 2011 2007
Commerce 1 562 662 26 678 1 589 340 SoE in SA Cities 2011 2007
Government 2 138 400 41 759 73 643 1 509 2 255 311 SoE in SA Cities 2011 2007
Industrial 4 646 831 2 776 879 715 58 252 83 170 999 570 6 670 315 SoE in SA Cities 2011 2007
Residential 2 785 752 320 525 34 524 3 140 801 SoE in SA Cities 2011 2007
Transport 9 574 588 8 083 804 25 926 17 684 318 SoE in SA Cities 2011 2007
Losses - SoE in SA Cities 2011 2007
TOTAL 11 133 645 626 940 9 648 975 9 167 559 457 560 156 927 - 999 570 - - - 32 191 176 SoE in SA Cities 2011 2007
Polokwane
Agriculture 17 397 509 693 14 257 210 541 557 SoE in SA Cities 2011 2007
Commerce 447 447 SoE in SA Cities 2011 2007
Government 12 471 20 758 419 33 648 SoE in SA Cities 2011 2007
Industrial 1 995 331 650 16 175 1 393 40 844 392 057 SoE in SA Cities 2011 2007
Residential 88 998 578 89 576 SoE in SA Cities 2011 2007
Transport 5 296 830 3 258 564 7 199 8 562 592 SoE in SA Cities 2011 2007
Losses - SoE in SA Cities 2011 2007
TOTAL 1 842 075 - 5 328 693 4 120 665 127 048 2 628 - 40 844 - - - 11 461 953 SoE in SA Cities 2011 2007
Rustenburg
Agriculture 102 549 102 549 Ozone SoE 2011
Commerce 1 471 935 36 000 72 385 1 580 320 Ozone SoE 2011
Government 60 814 12 550 23 235 96 599 Ozone SoE 2011
Industrial 36 563 281 6 035 160 3 215 435 1 681 173 662 45 989 219 Ozone SoE 2011
Residential 1 202 890 23 983 217 389 38 994 19 380 1 502 636 Ozone SoE 2011
Transport 49 626 3 927 013 3 639 118 15 122 7 630 879 Ozone SoE 2011
Losses 281 477 281 477 Ozone SoE 2011
TOTAL 39 630 023 6 095 143 3 939 563 6 980 337 217 389 113 060 - 173 662 15 122 - 19 380 57 183 679 Ozone SoE 2011
Saldanha
Agriculture 100 539 9 100 109 639 SoE in SA Cities 2011 2007
Commerce 180 537 180 537 SoE in SA Cities 2011 2007
Government 40 893 5 274 11 870 267 58 305 SoE in SA Cities 2011 2007
Industrial 3 542 680 19 503 722 10 324 214 653 4 271 398 SoE in SA Cities 2011 2007
Residential 241 121 56 804 297 925 SoE in SA Cities 2011 2007
Transport 16 332 1 043 225 1 043 950 4 595 2 108 102 SoE in SA Cities 2011 2007
Losses - SoE in SA Cities 2011 2007
TOTAL 4 021 563 16 451 884 1 048 518 1 660 082 81 090 - - 214 653 - - - 23 477 790 SoE in SA Cities 2011 2007
Sedibeng
Agriculture 25 582 9 886 440 124 9 515 3 391 488 498 SoE in SA Cities 2011 2007
Commerce 44 346 7 206 51 552 SoE in SA Cities 2011 2007
Government 11 666 104 005 280 115 951 SoE in SA Cities 2011 2007
Industrial 32 030 842 14 138 923 646 10 795 22 466 52 284 33 054 171 SoE in SA Cities 2011 2007
Residential 8 432 002 41 177 9 325 8 482 504 SoE in SA Cities 2011 2007
Transport 8 821 971 5 528 831 4 804 14 355 607 SoE in SA Cities 2011 2007
Losses - SoE in SA Cities 2011 2007
TOTAL 40 532 772 32 396 277 8 857 661 6 996 607 66 571 42 388 - 52 284 - - - 88 944 560 SoE in SA Cities 2011 2007
Sol Plaatje
Agriculture 4 686 171 349 10 520 4 015 190 569 SoE in SA Cities 2011 2007
Commerce 179 776 8 531 188 308 SoE in SA Cities 2011 2007
Government 31 145 546 4 085 309 36 085 SoE in SA Cities 2011 2007
Industrial 496 868 4 225 419 791 11 934 26 598 959 415 SoE in SA Cities 2011 2007
Residential 630 248 48 750 11 040 690 038 SoE in SA Cities 2011 2007
Transport 2 084 352 1 420 332 5 311 3 509 995 SoE in SA Cities 2011 2007
Losses - SoE in SA Cities 2011 2007
TOTAL 1 338 037 68 040 2 093 809 2 015 557 76 824 50 184 - - - - - 5 642 450 SoE in SA Cities 2011 2007
Steve Tshwete
Agriculture 99 237 99 237 Urban LEDS, ICLEI SoE 2011
Commerce 87 446 87 446 Urban LEDS, ICLEI SoE 2011
Government 103 430 5 018 22 876 131 323 Urban LEDS, ICLEI SoE 2011
Industrial 9 652 071 115 182 9 767 253 Urban LEDS, ICLEI SoE 2011
Residential 775 715 27 989 803 703 Urban LEDS, ICLEI SoE 2011
Transport 2 417 212 6 192 735 13 726 8 623 673 Urban LEDS, ICLEI SoE 2011
Losses 270 191 270 191 Urban LEDS, ICLEI SoE 2011
TOTAL 10 988 089 - 2 422 230 6 215 611 27 989 - - 115 182 - 13 726 - 19 782 826 Urban LEDS, ICLEI SoE 2011
Thulamela
Agriculture - CESU 2011
Commerce - CESU 2011
Government - CESU 2011
Industrial - CESU 2011
Residential - CESU 2011
Transport - CESU 2011
Losses CESU 2011
TOTAL 911 129 1 109 770 397 234 13 385 13 632 2 445 150 CESU 2011
Tlokwe
Agriculture - SoE in SA Cities 2006 2004
Commerce - SoE in SA Cities 2006 2004
Government 161 582 SoE in SA Cities 2006 2004
Industrial - SoE in SA Cities 2006 2004
Residential - SoE in SA Cities 2006 2004
Transport - SoE in SA Cities 2006 2004
Losses - SoE in SA Cities 2006 2004
TOTAL 1 393 402 1 393 402 1 899 440 941 529 59 565 5 610 12 703 1 080 4 332 903 SoE in SA Cities 2006 2004
Tshwane
Agriculture 2 179 062 6 745 389 494 83 616 4 116 2 663 032 SoE in SA Cities 2011 2007
Commerce 5 037 840 8 746 5 046 586 SoE in SA Cities 2011 2007
Government 4 262 185 84 013 315 510 2 457 4 664 165 SoE in SA Cities 2011 2007
Industrial 15 358 745 2 967 929 2 798 1 037 097 94 859 27 268 283 302 19 771 998 SoE in SA Cities 2011 2007
Residential 12 485 563 6 464 456 521 947 11 319 19 483 285 SoE in SA Cities 2011 2007
Transport 3 174 586 30 829 625 18 838 335 42 217 52 884 764 SoE in SA Cities 2011 2007
Losses - SoE in SA Cities 2011 2007
TOTAL 42 497 981 9 432 385 30 923 181 20 580 435 745 096 51 450 - 283 302 - - - 104 513 830 SoE in SA Cities 2011 2007
uMhlaThuze
Agriculture - SoE in SA Cities 2006 2004
Commerce - SoE in SA Cities 2006 2004
Government 59 072 SoE in SA Cities 2006 2004
Industrial - SoE in SA Cities 2006 2004
Residential - SoE in SA Cities 2006 2004
Transport - SoE in SA Cities 2006 2004
Losses SoE in SA Cities 2006 2004
TOTAL 51 780 470 51 150 3 406 035 3 022 231 10 222 377 153 300 423 60 263 447 SoE in SA Cities 2006 2004