LOCAL DIFFERENCES IN SUSTAINABILITY TRANSITIONS: THE CASE OF CAR-SHARING IN THE NETHERLANDS Toon...
11
LOCAL DIFFERENCES IN SUSTAINABILITY TRANSITIONS: THE CASE OF CAR-SHARING IN THE NETHERLANDS Toon Meelen
-
Upload
kelley-booth -
Category
Documents
-
view
214 -
download
0
Transcript of LOCAL DIFFERENCES IN SUSTAINABILITY TRANSITIONS: THE CASE OF CAR-SHARING IN THE NETHERLANDS Toon...

L O C A L D I F F E R E N C E S I N S U S T A I N A B I L I T Y T R A N S I T I O N S : T H E C A S E O F C A R - S H A R I N G I N T H E N E T H E R L A N D S
Toon Meelen
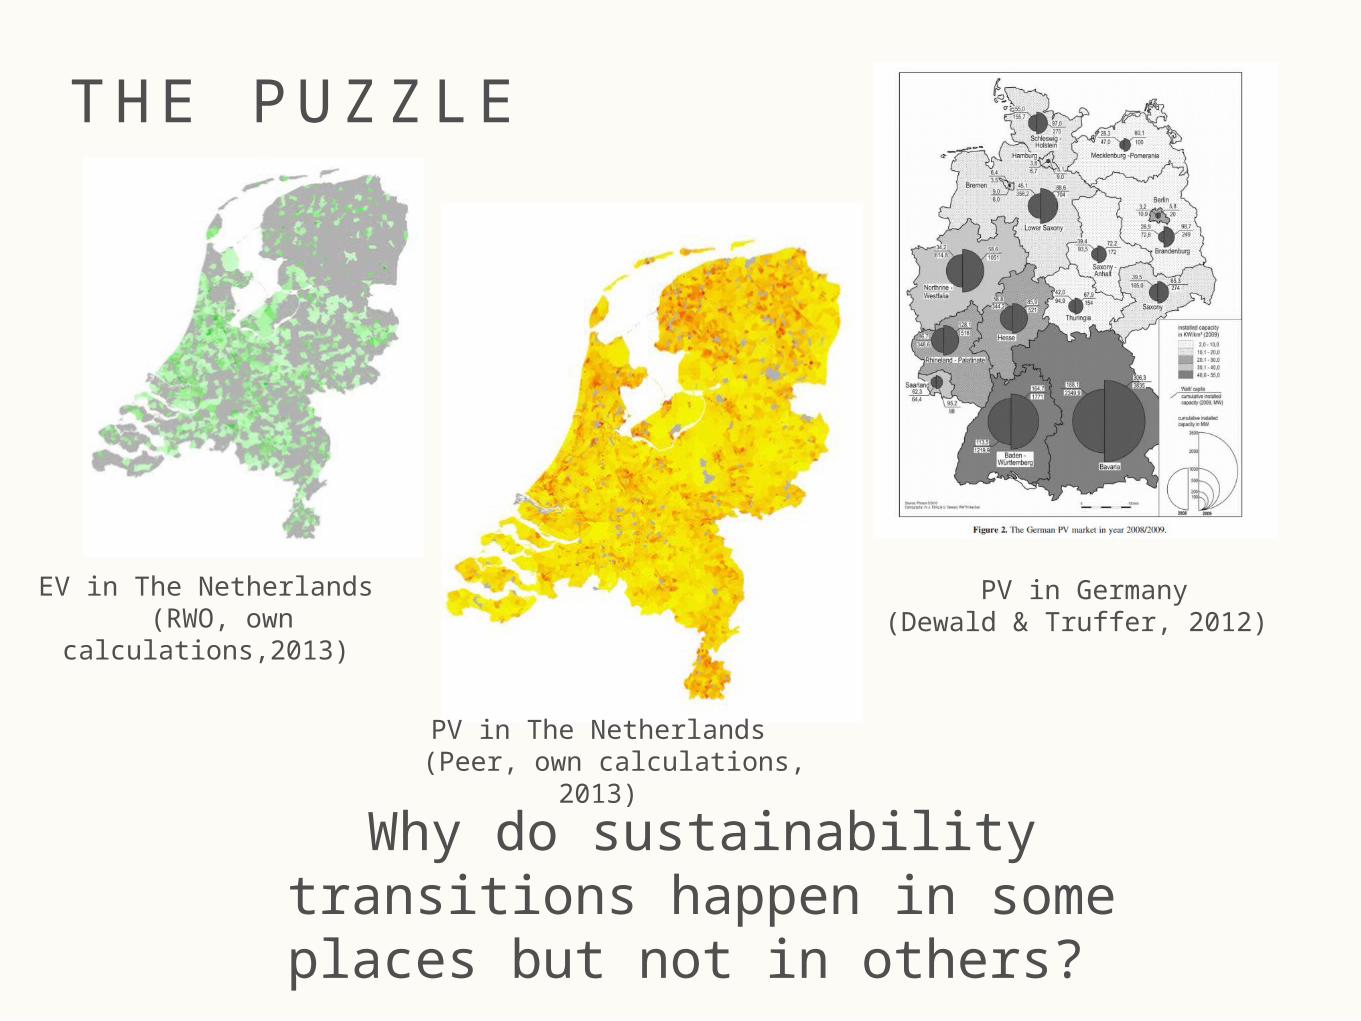
T H E P UZ Z L E
Why do sustainability transitions hap-pen in some places but not in others?
EV in The Netherlands (RWO, own
calculations,2013)
PV in The Netherlands (Peer, own calculations, 2013)
PV in Germany(Dewald & Truffer, 2012)
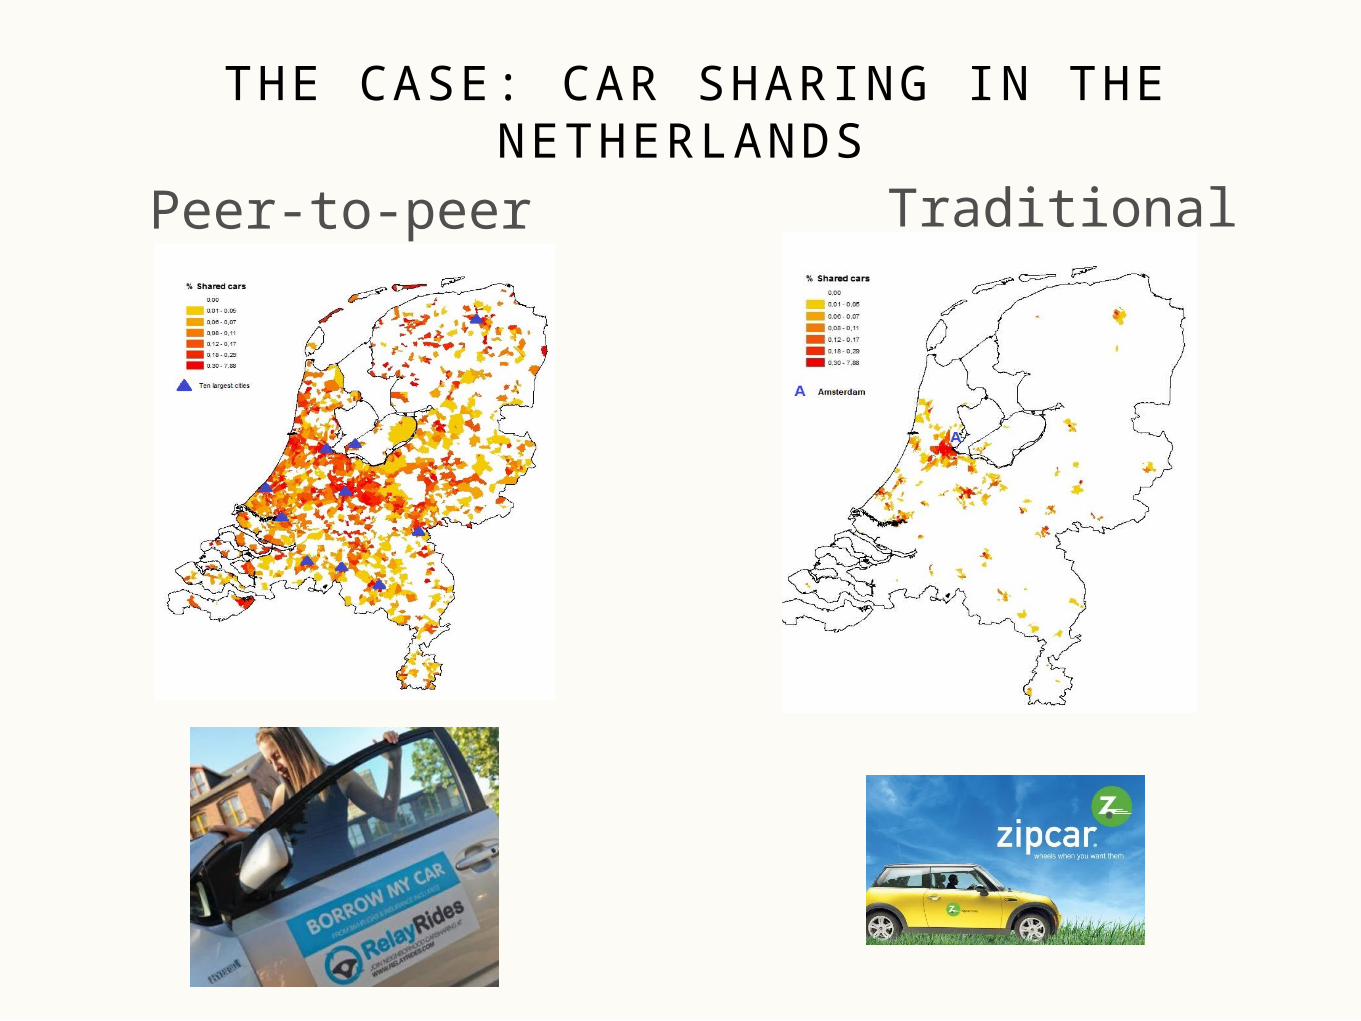
THE CASE: CAR SHARING IN THE NETHERLANDS
Peer-to-peer Traditional


G E O G RA P H Y O F S US TA I N I B I L I T Y T RA N S I T I O N S
• Space & Scale (Coenen et al. 2012)
• local factors influencing transitions (e.g. local institutions, urban policies) (Hansen & Coenen, 2014)
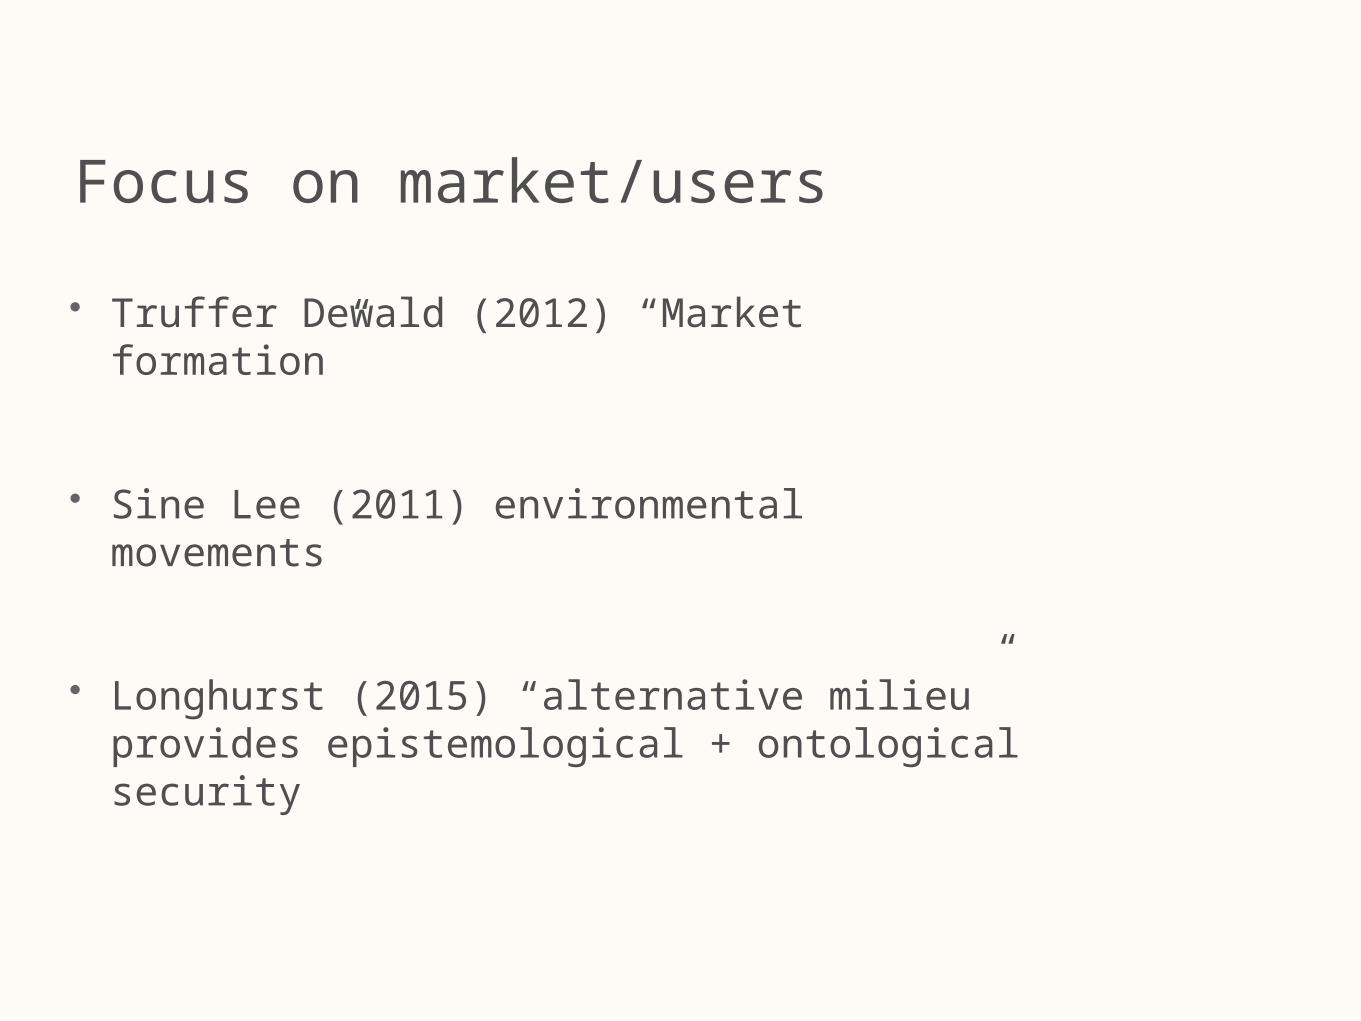
• Truffer Dewald (2012) “Market formation”
• Sine Lee (2011) environmental movements
• Longhurst (2015) “alternative milieu” provides epistemological + ontological security
Focus on market/users

M E T H O D O LO GY
• Data on number of shared cars in the Netherlands via the peer-to-peer and traditional model per neighbourhood (n=10,421 cars, n=4047 neighbourhoods)
• Data on geographical and socio-demographic characteristics of neighbourhoods from Dutch statistical offices + car-sharing policy from all municipalities
• Zero inflated Negative Binomial Model
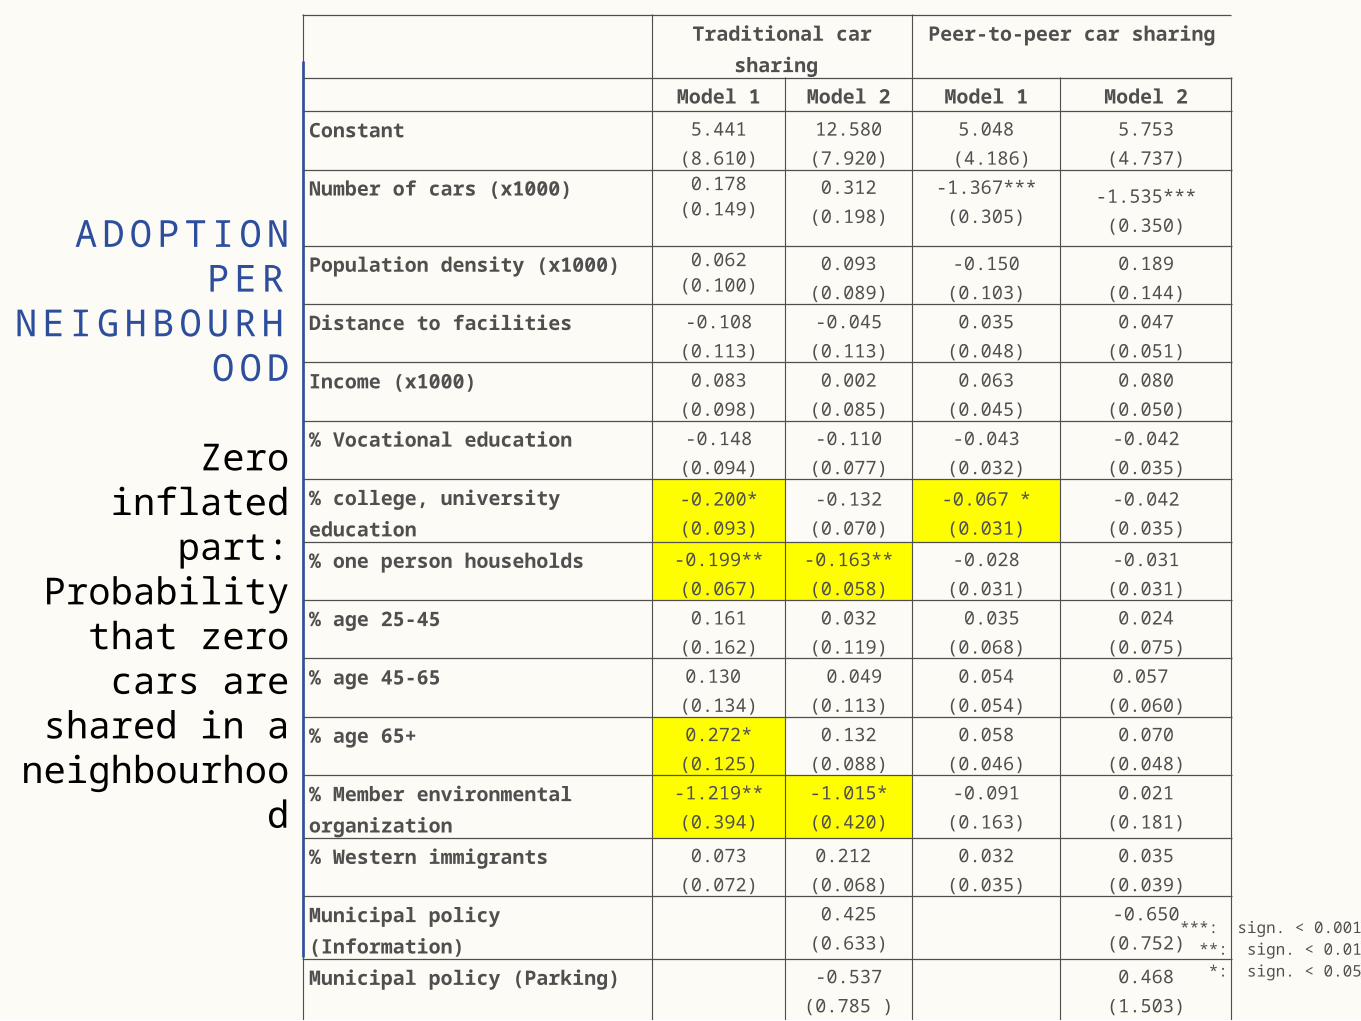
ADOPTIONPER
NEIGHBOURHOOD
Zero inflated part:
Probability that zero cars are
shared in a neighbourhood
Traditional car sharing
Peer-to-peer car sharing
Model 1 Model 2 Model 1 Model 2
Constant 5.441(8.610)
12.580(7.920)
5.048 (4.186)
5.753(4.737)
Number of cars (x1000) 0.178(0.149)
0.312(0.198)
-1.367*** (0.305)
-1.535***(0.350)
Population density (x1000) 0.062(0.100)
0.093(0.089)
-0.150(0.103)
0.189(0.144)
Distance to facilities -0.108(0.113)
-0.045(0.113)
0.035(0.048)
0.047(0.051)
Income (x1000) 0.083(0.098)
0.002(0.085)
0.063(0.045)
0.080(0.050)
% Vocational education -0.148(0.094)
-0.110(0.077)
-0.043(0.032)
-0.042(0.035)
% college, university education
-0.200*(0.093)
-0.132(0.070)
-0.067 *(0.031)
-0.042(0.035)
% one person households -0.199**(0.067)
-0.163**(0.058)
-0.028(0.031)
-0.031(0.031)
% age 25-45 0.161(0.162)
0.032 (0.119)
0.035(0.068)
0.024(0.075)
% age 45-65 0.130 (0.134)
0.049(0.113)
0.054(0.054)
0.057 (0.060)
% age 65+ 0.272*(0.125)
0.132(0.088)
0.058 (0.046)
0.070(0.048)
% Member environmental organization
-1.219**(0.394)
-1.015*(0.420)
-0.091(0.163)
0.021(0.181)
% Western immigrants 0.073(0.072)
0.212 (0.068)
0.032(0.035)
0.035(0.039)
Municipal policy (Information)
0.425 (0.633)
-0.650(0.752)
Municipal policy (Parking) -0.537 (0.785 )
0.468(1.503)
Spatial lags indep var yes yes yes yes
Mcfadden adj R2 0.346 0.362 0.194 0.196
N 2424 2290 2424 2290
Non-zero observations 439 400 1600 1503
***: sign. < 0.001**: sign. < 0.01*: sign. < 0.05

ADOPTIONPER
NEIGHBOURHOOD
Number of cars shared in
neighbourhoods in which it is likely that cars
are shared
Traditional car sharing
Peer-to-peer car sharing
Model 1 Model 2 Model 1 Model 2
Constant -3.586* (1.495)
-3.650*(1.522)
1.028(0.624)
0.938(0.663)
Number of cars (x1000) 0.298*** (0.043)
0.220***(0.043)
0.238***(0.013)
0.238***(0. 014)
Population density (x1000) 0.024 (0.016)
0.042(0.016)
0.033***(0.008)
0.042***(0.009)
Distance to facilities -0.098** (0.031)
-0.071*(0.032)
-0.024 *(0.010)
-0.024*(0.010)
Income (x1000) 0.014 (0.020)
0.007(0.020)
0.001(0.007)
0.004(0.007)
% Vocational education -0.069*** (0.014)
-0.048 **(0.014)
-0.033***(0.006)
-0.025 ***(0.006)
% college, university education
-0.028 (0.016)
-0.028 (0.015)
0.004 (0.005 )
0.003 (0.006)
% one person households 0.038**(0.011)
0.026 **(0.011)
0.014**(0.004 )
0.013**(0.004)
% age 25-45 0.035*(0.017)
0.023(0.017 )
0.008(0.008)
0.002(0.009)
% age 45-65 -0.001(0.018)
0.006 (0.019)
-0.033***(0.008)
-0.036*** (0.009)
% age 65+ -0.025(0.012)
-0.019 (0.013 )
-0.022**(0.006 )
-0.021** (0.006)
% Member environmental organization
0.414***(0.070 )
0.373 ***(0.079)
0.321***(0.029)
0.316***(0.034 )
% Western immigrants 0.062 *(0.018)
0.110***(0.020)
-0.018*(0.007)
-0.018*(0.007)
Municipal policy (Information)
0.618***(0.169)
0.181 **(0.061)
Municipal policy (Parking) 0.510*(0.234)
0.137 (0.071)
Spatial lags indep var yes yes yes yes
Mcfadden adj R2 0.346 0.362 0.194 0.196
N 2424 2290 2424 2290
Non-zero observations 439 400 1600 1503
***: sign. < 0.001**: sign. < 0.01*: sign. < 0.05
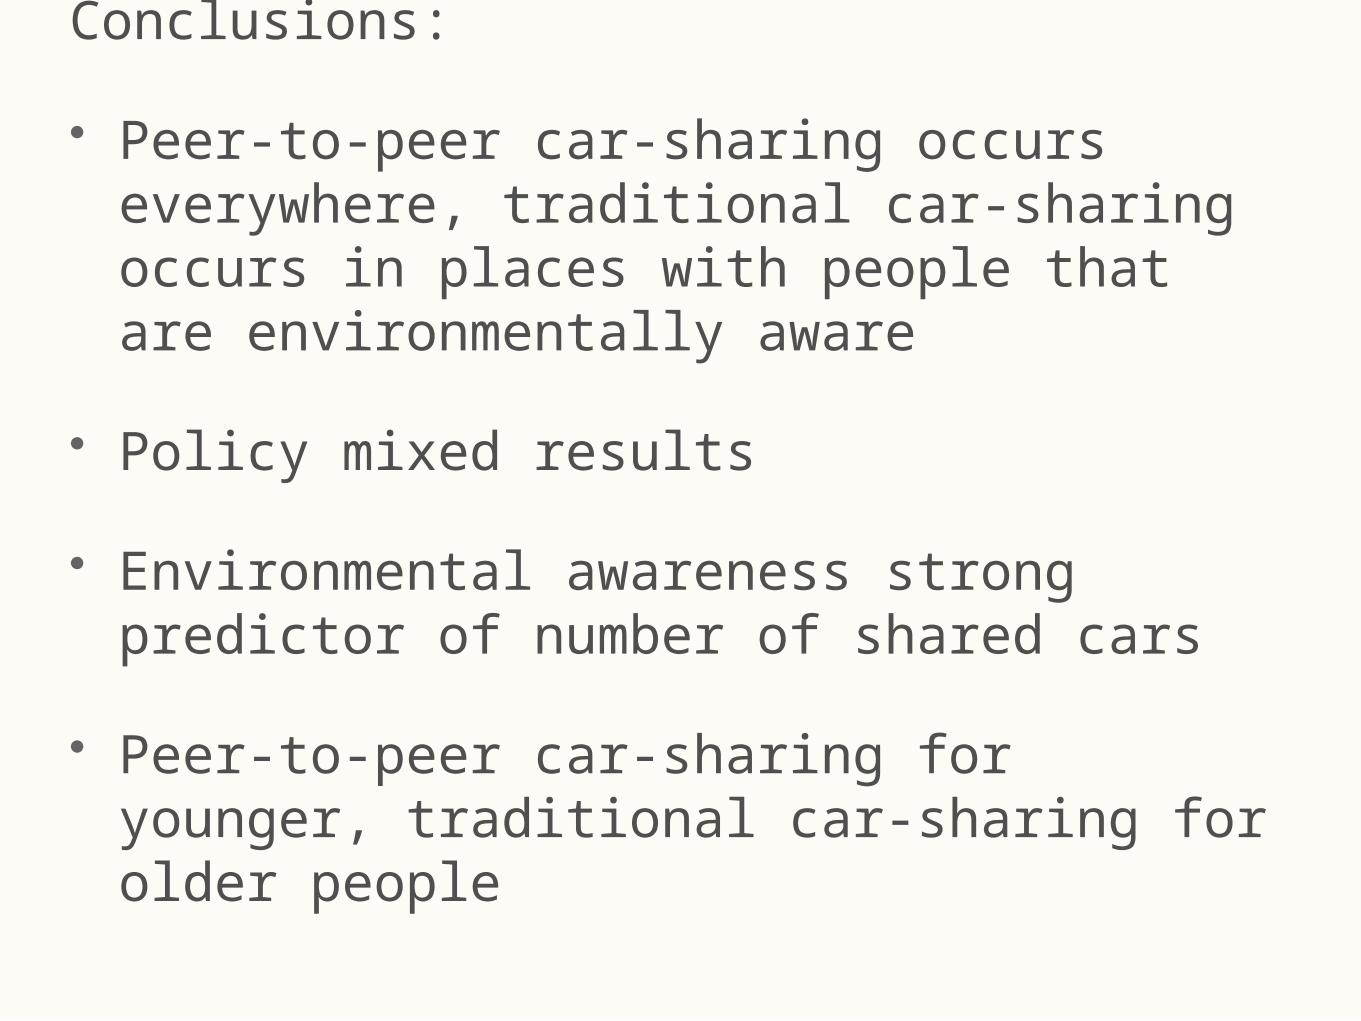
Conclusions:
• Peer-to-peer car-sharing occurs everywhere, traditional car-sharing occurs in places with people that are environmentally aware
• Policy mixed results
• Environmental awareness strong predictor of number of shared cars
• Peer-to-peer car-sharing for younger, traditional car-sharing for older people

• Questions?