Local Climate Action Strategy Mexico CityLocal Climate Action Strategy Mexico City September, 2006...
28
Local Climate Action Strategy Local Climate Action Strategy Mexico City Mexico City September, 2006 Claudia Sheinbaum Pardo Engineering Institute National Autonomous University of Mexico Oscar Vázquez Secretariat for the Environment Mexico City Government Local Actions, Global Challenges
Transcript of Local Climate Action Strategy Mexico CityLocal Climate Action Strategy Mexico City September, 2006...

Local Climate Action StrategyLocal Climate Action StrategyMexico CityMexico City
September, 2006
Claudia Sheinbaum PardoEngineering Institute
National Autonomous University of Mexico
Oscar VázquezSecretariat for the Environment
Mexico City Government
Local Actions, Global Challenges

Reflections aboutReflections about ELACELAC
Mexico do not belong to the Annex 1, even though, we are the thirteenth country in the world emissions contribution
The Mexico City Metropolitan Area contributes with around 12% of the total emissions generated in the country from energy consumption, but less than 0.1% of the forest emissions
Local Actions, Global Challenges
Reflections aboutReflections about ELACELAC
We believe in the need of incorporate the climate change component in the governmental projects, within the framework of the needs and priorities of the sustainable development, on the regional and local scales
Local Actions, Global Challenges

BackgroundBackground
México:1,964,375 km2
100 millions of habitants 75% live in city areas
Federal District:8.6 millions of habitants Surface : 1,484 km2 (0.1%)
Mexico City Metropolitan Area:FD & 18 municipalities of Estate of Mexico 18.7 millions of habitants 35 000 Factories, 4 millions of vehicles
Local Actions, Global Challenges
1920 1930 1950 1970 1990
MCMA
FD

Toward sustainable developmentToward sustainable development
Promote the sustainable economic growth Support the implementation of public policies focused to reduce of poverty and social inequality, to the stimulates the employs generation and to promote a sustainable development with justice equity and social inclusionSustainable management of the natural resources
Latin America and Caribbean initiative for sustainable development
May 2002
Local Actions, Global Challenges

Local Strategy of Climate ActionLocal Strategy of Climate Action
GHG Emissions InventoryGreenhouse Gas Emissions Trends to 2012Mexico City´s Vulnerability AnalysisMexico City´s Adaptability AnalysisEmissions Mitigation: Programs and Projects
Local Actions, Global Challenges

CO2 Equivalent Emissions by sector CO2 Equivalent Emissions by sector in the MCMAin the MCMA
Energy93.0%
Solid Waste6.6%
Forest0.4%
Mexico City Metropolitan Area: 54.1 millions metric Tons CO2 equivalent / yearFederal District: 33.5 millions metric Tons CO2 equivalent per year
13.7 Tg CO2 are emitted outside of the MCMA produced by the electricity consumption2
490 ha/year
Local Actions, Global Challenges

CO2 Emissions Inventory according to CO2 Emissions Inventory according to the energy consumption in the MCMAthe energy consumption in the MCMA
Transport39.9%
Residential16.9%
Public3.0%
Commercial5.8%
Rural0.4%
Industry34.0%
Local Actions, Global Challenges

Energy consumption scenario for Energy consumption scenario for the MCMA the MCMA ((PJoulesPJoules))
0.0
100.0
200.0
300.0
400.0
500.0
600.0
700.0
800.0
2000 2001 2002 2003 2004 2005 2006 2007 2008 2009 2010 2011 2012
Public
Commercial
Residential
Industry
Transport
Local Actions, Global Challenges

Local Actions, Global Challenges
Emissions Mitigation: Programs
and Projects

Forest restoration programForest restoration program
Prevention and fight of Prevention and fight of forest fires programforest fires programEcological restoration Ecological restoration programprogramProtected Natural AreasProtected Natural AreasSustainable rural Sustainable rural productionproductionEcotourismEcotourismUrban growth controlUrban growth control
Local Actions, Global Challenges

Mitigation in the forest sectorMitigation in the forest sectorPrevention and fight of
forest firesBenefit:• 2001-2004 where captured
630 thousand ton of CO2 eq• 2005-2012 1 million tons
Reforestation 2001- 2004
Benefit:• 35 thousand ton of CO2 eq
between 2001-2004• 70 thousand ton of CO2 eq
between 2005-2012• 10 millions of trees by year
Local Actions, Global Challenges

Waste Separation Program
• In the FD are generated 4.2 millions of tons each year• In the year 2000 were emitted 3.6 millions of CO2 eq tons • The waste separation into Organic and Inorganic reduces the
organic carbon available
Benefit:• 69,736 ton of CO2 eq by year in 2006• 1.8 millions of ton between 2006-2012
Local Actions, Global Challenges
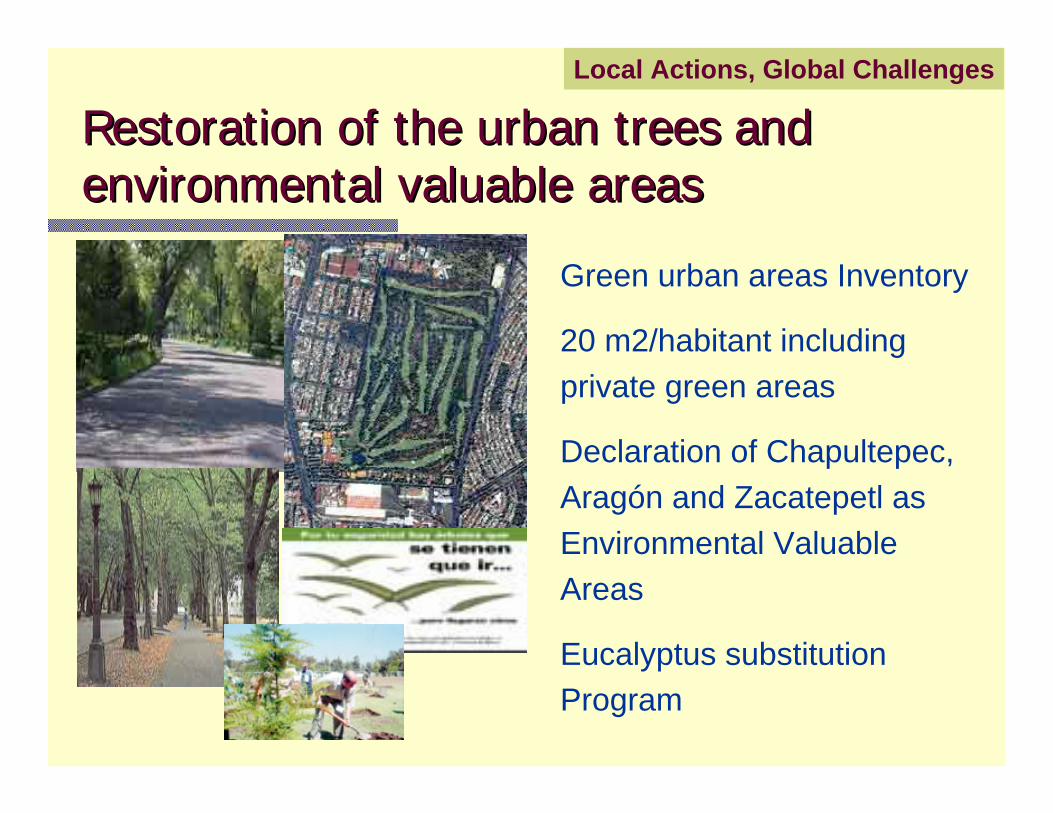
Restoration of the urban trees and Restoration of the urban trees and environmental valuable areasenvironmental valuable areas
Green urban areas Inventory
20 m2/habitant including private green areas
Declaration of Chapultepec, Aragón and Zacatepetl as Environmental Valuable Areas
Eucalyptus substitution Program
Local Actions, Global Challenges

Environmental educationEnvironmental education
Child Summit 2003Child Summit 2003With the main subject With the main subject
““Climate ChangeClimate Change””
Attended by children Attended by children from Mexico, Latin from Mexico, Latin
America and America and CaribbeanCaribbean
Local Actions, Global Challenges

Commercial and ServicesCommercial and ServicesEnergy Saving lamps in Commerce and Services
• T-12 by converting to T-8 saves 28.67 kWh/year. Estimating a T-8 penetration level of 5% in 2001 and of 90% in 2012.
Benefit:•166 thousand ton between 2001-2004 •1.6 millions of ton between 2005-2012
Fuels without the assigned to the
Electric Generation
Electricity Importations
Electric Generation MCMA
Local Actions, Global Challenges
CO2 eq emissions generated by
Electric Consumption2000

ResidentialResidentialConversion from LPG to
CNG in housings
• 242,314 housings with CNG in the FD in 2004
• 2001-2004: 136 thousand housings connected to the CNG network in the FD
Benefit: • 797 thousand ton between
2001-2004• 1.7 million ton between 2005-
2012
Food cooking
27%
Water heating
24%
Lighting
16%
Electrical appliance
32%
CO2 eq emissions generated in the housing in the MCMA during 2000
Local Actions, Global Challenges

Swimming pools and diving pools.Commercial business with 51 employees or more which use hot water for:
Showers &/or lavatoryKitchenLaundry & dry cleaners
Solar Water Heating RuleSolar Water Heating Rule
Solar Percentage: 30%
Local Actions, Global Challenges

SportSportss ClubsClubs
Project cost: $2,500,000m2 of solar collectors: 3,000Diesel´s savings: 354,500 Lts/yearEmissions reduction: 976 t CO2Save: $1,578,000 / yearAmortization time: 19 monthsMaintenance cost: < $25,000
3500m3 of water between 29 y 45°C
Local Actions, Global Challenges
Solar Water Heating RuleSolar Water Heating Rule

GHG mitigation programs linked to local GHG mitigation programs linked to local environmental programsenvironmental programs
Sustainable TransportSustainable TransportTaxi´s substitutionMicrobus´ substitutionRTP fleet renovationAcquisition of new trains for the Metro (subway)90 km of bicycle dedicated roadsConversion of gasoline vehicles to LPG and CNGUpdate the a day without car programBus Rapid Transit Corridors (BRT)
Local Actions, Global Challenges

Taxi substitutionTaxi substitution
The taxis contributes with the 10% of the total GHG emissions from the transport sectorMinimum obligatory efficiency of 12 km/ltRemotion of the VW sedan modelWith the governmental program was substituted the 2% of the fleet (were scrapped)The governmental program induced the substitution of the 20% until nowPublic investment ascend to 13 million USDReduction of 14,165 ton/year of CO2
CombisTractocamion
es
Pickups
Otros
Vehiculos < 3 ton
Taxis
Autobuses
Autos Particulares
Vehiculos > 3 ton
Microbuses
Local Actions, Global Challenges

Substitution of microbuses and Substitution of microbuses and conversion from LPG to CNGconversion from LPG to CNG
The microbuses are responsible for the 15% of the GHG emissions from the transport sectorWith the governmental program 3% of the fleet were scrappedPublic investment ascend to almost 10 million USDReduction of 23,000 ton/year for the conversion to CNG
CombisTractocamion
es
Pickups
Otros
Vehiculos < 3 ton
Taxis
Autobuses
Autos Particulares
Vehiculos > 3 ton
Microbuses
Local Actions, Global Challenges

Update of the A day Without Car ProgramUpdate of the A day Without Car Program
Each vehicle with 10 years or more of Each vehicle with 10 years or more of circulation, will not be driven one day circulation, will not be driven one day per weekper week282,935 ton CO282,935 ton CO22/year/year
Local Actions, Global Challenges
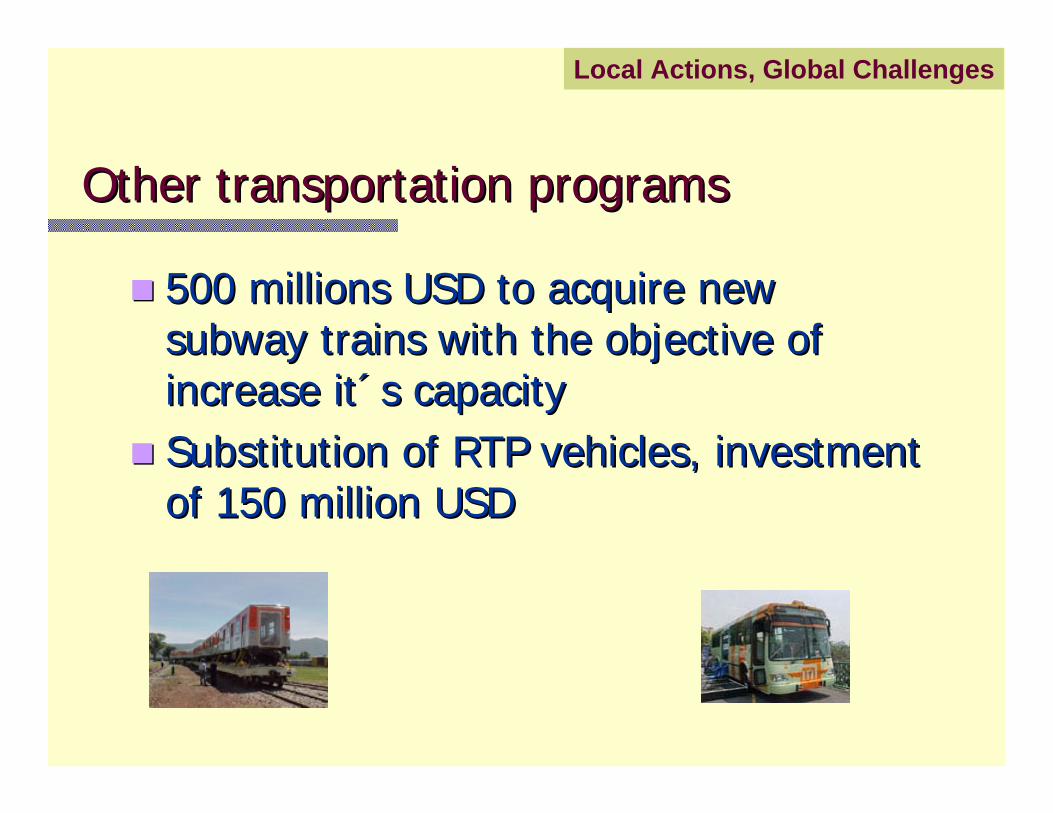
Other transportation programsOther transportation programs
500 millions USD to acquire new 500 millions USD to acquire new subway trains with the objective of subway trains with the objective of increase itincrease it´́s capacitys capacitySubstitution of RTP vehicles, investment Substitution of RTP vehicles, investment of 150 million USDof 150 million USD
Local Actions, Global Challenges

Public Transportation strategic Public Transportation strategic corridors program:corridors program: MetrobusMetrobus
Local Actions, Global Challenges

Sells GHG reductions to Spanish Carbon Found
This project is pioneer in its kind and will contribute with innovating methodologies for the base line, monitoring and verification estimations in transport sector
Public Transportation Strategic CorridorsPublic Transportation Strategic Corridors
Reductions of around 37,000 ton CO2 eq per year
Local Actions, Global Challenges

GHG emissions reduction GHG emissions reduction CO2 equivalent metric tonsCO2 equivalent metric tons
2001 2004 2012A Day Without Car (old) 282,935 211,588 31,601A Day Without Car (actualized) 13,224 175,272Taxi substitution 14,165 14,165Taxi Induced by ADWC 103,873 103,873Microbuses to CNG 11,454 11,454Burned Biogas in LandfillWaste Separation 466,095LPG & CNG in housings 195,574 203,214 223,353LCF in Housings 34,487 243,818 853,190Commercial & Services lighting 7,636 74,920 320,641Public lighting 993 3,684 11,053Forest Fires 2,212 7,382 7,382Reforestation 135,664 135,664 135,664Solar Heating RuleTransport Corridors
TOTAL 709,912 1,072,646
Local Actions, Global Challenges
6,627,975
355,264
11,416,4322,079,450

Local Climate Action StrategyLocal Climate Action StrategyMexico CityMexico City
September, 2006
Claudia Sheinbaum PardoEngineering Institute
National Autonomous University of Mexico
Oscar VázquezSecretariat for the Environment
Mexico City Government
Local Actions, Global Challenges