Local authority child health profiles 2020 - GOV UK...Local authority child health profiles 2020:...
18
Local authority child health profiles 2020 Indicator guide This document presents metadata including the definitions and sources of the data for Public Health England’s local authority child health profiles 2020
Transcript of Local authority child health profiles 2020 - GOV UK...Local authority child health profiles 2020:...
Local authority child health profiles 2020 Indicator guide
This document presents metadata including the definitions and sources of the data
for Public Health England’s local authority child health profiles 2020

Local authority child health profiles 2020: indicator guide
2
About Public Health England
Public Health England exists to protect and improve the nation’s health and wellbeing,
and reduce health inequalities. We do this through world-leading science, research,
knowledge and intelligence, advocacy, partnerships and the delivery of specialist public
health services. We are an executive agency of the Department of Health and Social
Care, and a distinct delivery organisation with operational autonomy. We provide
government, local government, the NHS, Parliament, industry and the public with
evidence-based professional, scientific and delivery expertise and support.
Public Health England
Wellington House
133-155 Waterloo Road
London SE1 8UG
Tel: 020 7654 8000
www.gov.uk/phe
Twitter: @PHE_uk
Facebook: www.facebook.com/PublicHealthEngland
For queries relating to this document, please contact: [email protected]
© Crown copyright 2020
You may re-use this information (excluding logos) free of charge in any format or
medium, under the terms of the Open Government Licence v3.0. To view this licence,
visit OGL. Where we have identified any third party copyright information you will need
to obtain permission from the copyright holders concerned.
Published March 2020
PHE publications PHE supports the UN
gateway number: GW-1115 Sustainable Development Goals

Local authority child health profiles 2020: indicator guide
3
Contents
Introduction 4
General information 5
Geographical areas used in the profiles 5 Main findings 5 Statistical neighbours used in the profiles 6
Confidence intervals 7 Using the spine chart 8
Charts 10
Interpreting the charts 10
Population statistics 13
Spine chart indicators 18

Local authority child health profiles 2020: indicator guide
4
Introduction
The Child health profiles on the Fingertips data website provide an annual snapshot
report of child health in upper-tier local authority areas. These are part of an overview
of child health that brings together indicators for local government and clinical
commissioning group (CCG) areas across several different themes.
Child health profiles have been published nationally as an annual snapshot report since
2011 for each upper tier local authority in England. PHE has responsibility for
producing these statistics on an annual basis.
The document is intended to show the methods used to generate the annual snapshot
reports in a transparent manner, for the avoidance of doubt about how they have been
generated and what they represent.
Local authority child health profiles 2020: indicator guide
5
General information
Geographical areas used in the profiles
The regional comparators shown in the charts on page 3 of the child health profiles,
and as a grey diamond in the spine chart on page 4, are the Nomenclature of Territorial
Units for Statistics (NUTS) 1 statistical regions of England. For more information see:
ec.europa.eu/eurostat/web/nuts/background
Main findings
The main findings relating to the general health and wellbeing summarises the spine
chart and provides a single statement of whether, when considering the indicators
selected for inclusion, the area is ‘better than’, ‘worse than’, ‘similar to’ or ‘mixed
compared with’ the England averages.
An area is classed to be ‘better than’ the England average if any of the following are
true:
• most (60% or more) indicators are green
(they are significantly better than the England average)
• green indicators make up 40% or more and only up to 20% are red
(they are significantly worse than the England average)
• green indicators make up 30% or more and there are no red indicators
An area is classed to be ‘worse than’ the England average if any of the following are
true:
• most (60% or more) indicators are red
• red indicators make up 40% or more and only up to 20% are green
• red indicators make up 30% or more and there are no green indicators
An area is classed to be ‘similar to’ the England average if most (53% or more) of the
indicators are amber. Otherwise, the area is classed as ‘mixed’.
Information on infant and child mortality is given for all areas. Seven main findings are
then given for all areas on topics where public health interventions can improve child
health at a local level. These include childhood obesity, breastfeeding, dental health,
MMR immunisation, teenage pregnancy, smoking in pregnancy and mental health.

Local authority child health profiles 2020: indicator guide
6
The last 2 main findings are selected from a list of potential topics to highlight areas of
particular interest. Topics could include any of the following:
• immunisation against childhood diseases such as:
• diphtheria
• pertussis (whooping cough) and tetanus (DTap)
• Haemophilus influenzae type b (Hib – an important cause of childhood
meningitis and pneumonia)
• polio
• immunisations for children in care
• babies born with low birthweight
• child poverty and family homelessness
• alcohol and substance misuse
• road traffic accidents, injuries, A&E attendance
• hospital admissions for asthma
• young people not in education or employment, children entering the youth justice
system, and school readiness
They aim to balance the profile. So if an area is generally performing well, ones will be
chosen where the area does worse and vice versa. The aim is that these give either the
opportunity for areas to see where they are doing well, and on which they might build,
or areas on which they need to focus to improve.
Where consistent with the method described above, if an area is best or worst in the
country on a particular indicator, then the relevant main finding will be selected.
Many of the main messages describe whether an area is better or worse than the
England average for a particular indicator. This relates to a statistically significant
difference, using the methodology described in the section below on confidence
interval.
Statistical neighbours used in the profiles
Statistical neighbour models provide one method for benchmarking progress. For each
local authority, these models designate a number of other local authorities deemed to
have similar characteristics. These designated local authorities are known as statistical
neighbours. Any local authority may compare its performance (as measured by various
indicators) against its statistical neighbours to provide an initial guide as to whether
their performance is above or below the level that might be expected.
The statistical neighbours used have been drawn from the Department for Education’s
‘children's services statistical neighbour benchmarking tool’, which was last updated in

Local authority child health profiles 2020: indicator guide
7
July 2019. While the tool defines 10 neighbours, this has been limited to the 4 closest
statistical neighbours in the profiles as space on the charts is limited.
Further information about this tool is available here:
https://www.gov.uk/government/publications/local-authority-interactive-tool-lait
Confidence intervals
A confidence interval is a range of values that is used to quantify the imprecision in the
estimate of a particular value that results from random variation in the estimation of the
value.
In public health many indicators are based on what can be considered to be complete
datasets and not samples. For example, mortality rates are based on death registers.
In these instances, the imprecision arises not as a result of sampling variation but of
‘natural’ variation. Generally, in public health, it is the underlying circumstances or
process that is of interest and the actual value observed gives only an imprecise
estimate of this ‘underlying risk’.
The width of the confidence interval depends on 3 things:
• the sample or population size from which the estimate is derived – larger samples
give more precise estimates with smaller confidence intervals
• the degree of variability in the phenomenon being measured
• the required level of confidence – this is an arbitrary value and conventional practice
is to use 95% confidence
For the purpose of these profiles, we have used 95% confidence limits, which are
denoted by a horizontal line on the bar charts with minimum and maximum ranges
showing as small vertical lines at either end. In general, increasing the required level of
confidence results in wider limits. For a given level of confidence, the wider the
confidence interval, the greater the uncertainty in the estimate is.
With the exception of 2 indicators, a significant difference is said to occur where the
confidence intervals for the local authority do not overlap the reference value. For
example, where both the confidence limits for the local authority exceed the value for
England, the area is significantly higher than England. Where the confidence limits
straddle the reference value (England or region), there is said to be no significant
difference. Unless otherwise stated, the reference value is the England average
(mean).
A different method is used for 2 of the immunisations indicators (MMR vaccination for
one dose (2 years) and Dtap/IPV/Hib vaccination (2 years)) to decide whether they
Local authority child health profiles 2020: indicator guide
8
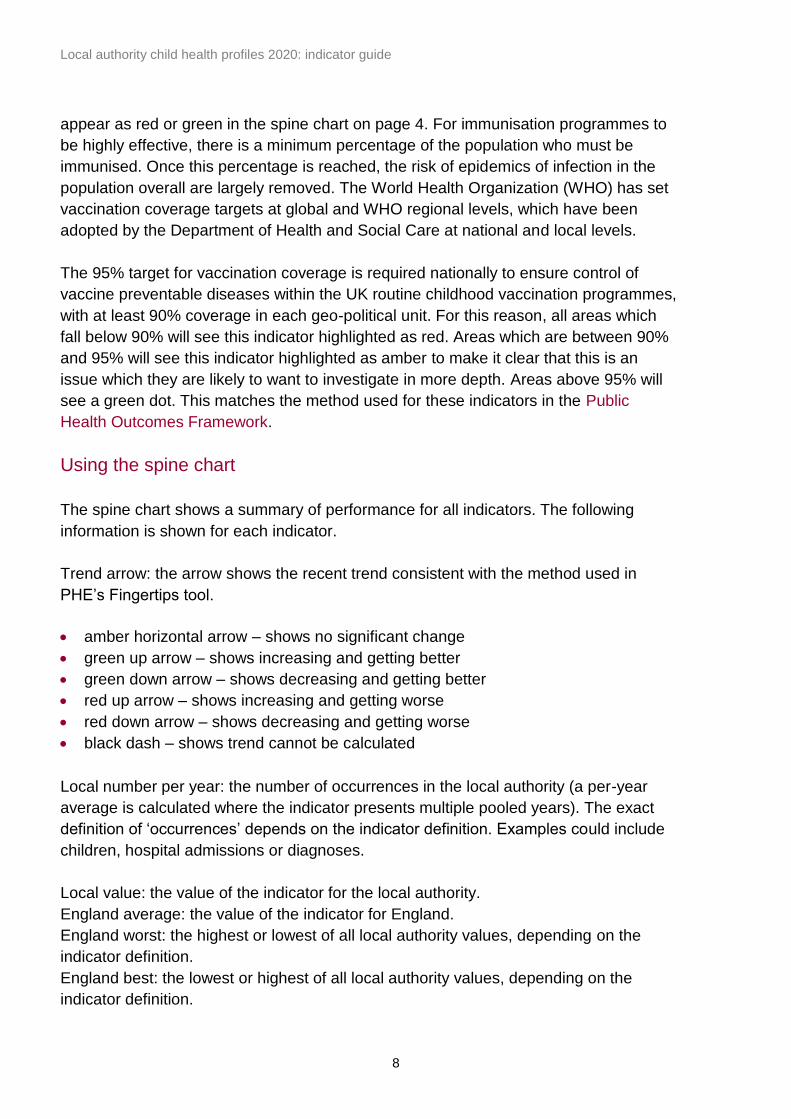
appear as red or green in the spine chart on page 4. For immunisation programmes to
be highly effective, there is a minimum percentage of the population who must be
immunised. Once this percentage is reached, the risk of epidemics of infection in the
population overall are largely removed. The World Health Organization (WHO) has set
vaccination coverage targets at global and WHO regional levels, which have been
adopted by the Department of Health and Social Care at national and local levels.
The 95% target for vaccination coverage is required nationally to ensure control of
vaccine preventable diseases within the UK routine childhood vaccination programmes,
with at least 90% coverage in each geo-political unit. For this reason, all areas which
fall below 90% will see this indicator highlighted as red. Areas which are between 90%
and 95% will see this indicator highlighted as amber to make it clear that this is an
issue which they are likely to want to investigate in more depth. Areas above 95% will
see a green dot. This matches the method used for these indicators in the Public
Health Outcomes Framework.
Using the spine chart
The spine chart shows a summary of performance for all indicators. The following
information is shown for each indicator.
Trend arrow: the arrow shows the recent trend consistent with the method used in
PHE’s Fingertips tool.
• amber horizontal arrow – shows no significant change
• green up arrow – shows increasing and getting better
• green down arrow – shows decreasing and getting better
• red up arrow – shows increasing and getting worse
• red down arrow – shows decreasing and getting worse
• black dash – shows trend cannot be calculated
Local number per year: the number of occurrences in the local authority (a per-year
average is calculated where the indicator presents multiple pooled years). The exact
definition of ‘occurrences’ depends on the indicator definition. Examples could include
children, hospital admissions or diagnoses.
Local value: the value of the indicator for the local authority.
England average: the value of the indicator for England.
England worst: the highest or lowest of all local authority values, depending on the
indicator definition.
England best: the lowest or highest of all local authority values, depending on the
indicator definition.

Local authority child health profiles 2020: indicator guide
9
Spine: the coloured dot shows how the area is performing compared to the England
average (shown as the red line on the chart):
• red dot – with the exception of the immunisations indicators noted above, this
means that the selected area is performing significantly worse than the England
average
• green dot – with the exception of the immunisations indicators noted above, this
means that the selected area is performing significantly better than the England
average
• yellow dot – with the exception of the immunisations indicators noted above, this
means that the selected area is not significantly different from the England average
• white or grey dot – the selected area could not be compared to the England average
• grey diamond – this shows the regional average
• the grey boxes on the spine chart represent the area between the maximum or
minimum value of all local authorities in England, shown as light grey shading, with
the area between the 25th and 75th percentile shown in dark grey shading

Local authority child health profiles 2020: indicator guide
10
Charts
The profiles present more detailed analysis of children and young people’s health in
local areas in the charts on pages 2 and 3 of the child health profiles.
Full details of how the indicators on these pages have been calculated and the sources
for this data are included in the interactive version of the profiles available on PHE’s
Fingertips tool. For help using the interactive tool or for further advice, please contact
the local knowledge and intelligence service in your area:
North East [email protected]
North West [email protected]
Yorkshire and the Humber [email protected]
East Midlands [email protected]
East of England [email protected]
West Midlands [email protected]
London [email protected]
South East [email protected]
South West [email protected]
The methods used to analyse and present the data in the charts are described below.
Interpreting the charts
Obesity charts
The charts compare the local authority featured in the profile with its 4 closest
statistical neighbours and the England value, together with confidence limits. The
confidence limits on the smaller bars are for children who are classified as obese, while
the confidence limits on the longer bars are for those who are classified as obese or
overweight. A significant difference is said to occur where the confidence intervals for
the local authority do not overlap the reference value. For example, where both
confidence limits for the local authority exceed the value for England, the area is
significantly higher than England for that indicator. Where the confidence interval
straddles the England value, there is said to be no significant difference.
Trend information in the alcohol and mental health charts
The trend calculation uses a test which consider data over the most recent five years,
and tests for differences over time. The test produces 2 statistics each time it is run, one
which determines significance at 95% and the other which describes whether the trend

Local authority child health profiles 2020: indicator guide
11
is increasing or decreasing. Outliers are taken into account as part of determining the
significance.
Young people’s sexual and reproductive health, breastfeeding and child development
aged 2-2 ½
The charts compare the local authority featured in the profile with its 4 closest statistical
neighbours and regional and England values, together with confidence limits. A
significant difference is said to occur where the confidence intervals for the local
authority do not overlap the reference value. For example, where both confidence limits
for the local authority exceed the value for England the area is significantly higher than
England. Where the confidence interval straddles the reference value (England or
region), there is said to be no significant difference.
Breastfeeding and child development data have not been published where data for the
area has not passed validation. Further information is available in the indicator definitions:
https://fingertips.phe.org.uk/profile/child-health-profiles/data#page/1/gid/1938133228/
Chlamydia is the most commonly diagnosed sexually transmitted infection. It causes
avoidable sexual and reproductive ill-health, including symptomatic acute infections and
complications such as pelvic inflammatory disease (PID), ectopic pregnancy and tubal-
factor infertility. The chlamydia detection rate amongst under 25-year-olds is a measure
of chlamydia control activities. It represents infections identified (reducing risk of
sequelae in those patients and interrupting transmission onto others). Increasing
detection rates indicate increased control activity: it is not a measure of morbidity.
Chlamydia screening is recommended for all sexually active people under 25 and on
partner change. PHE recommends that local authorities should be working towards
achieving a detection rate of at least 2,300 per 100,000 population.
The text for chlamydia describes whether the area’s detection rate is higher than
recommended (2,300 or above) or lower than the recommended rate. Rates of 1,900 to
less than 2,300 are described as ‘approaching’, to reflect the fact that areas with
detection rates in this range are only just failing to meet recommended levels.
Immunisations chart
The chart shows the local authority featured in the profile with its 4 closest statistical
neighbours and regional and England values, together with confidence limits. The
vertical black line on the chart represents the minimum recommended vaccination
coverage of 95%. So the chart shows whether the area’s coverage is higher than
recommended (95% or above) or lower than recommended. The shaded area on the
graph shows 90 to 95% coverage, and illustrates where local authorities are
approaching the recommended coverage. Areas are described as ‘slightly less’ than

Local authority child health profiles 2020: indicator guide
12
95% if the value falls between 90 and 95%. The confidence intervals are shown to
highlight the inherent variation in this indicator (as is the case with all indicators), but are
not used for the purpose of comparison.
Local authority child health profiles 2020: indicator guide
13
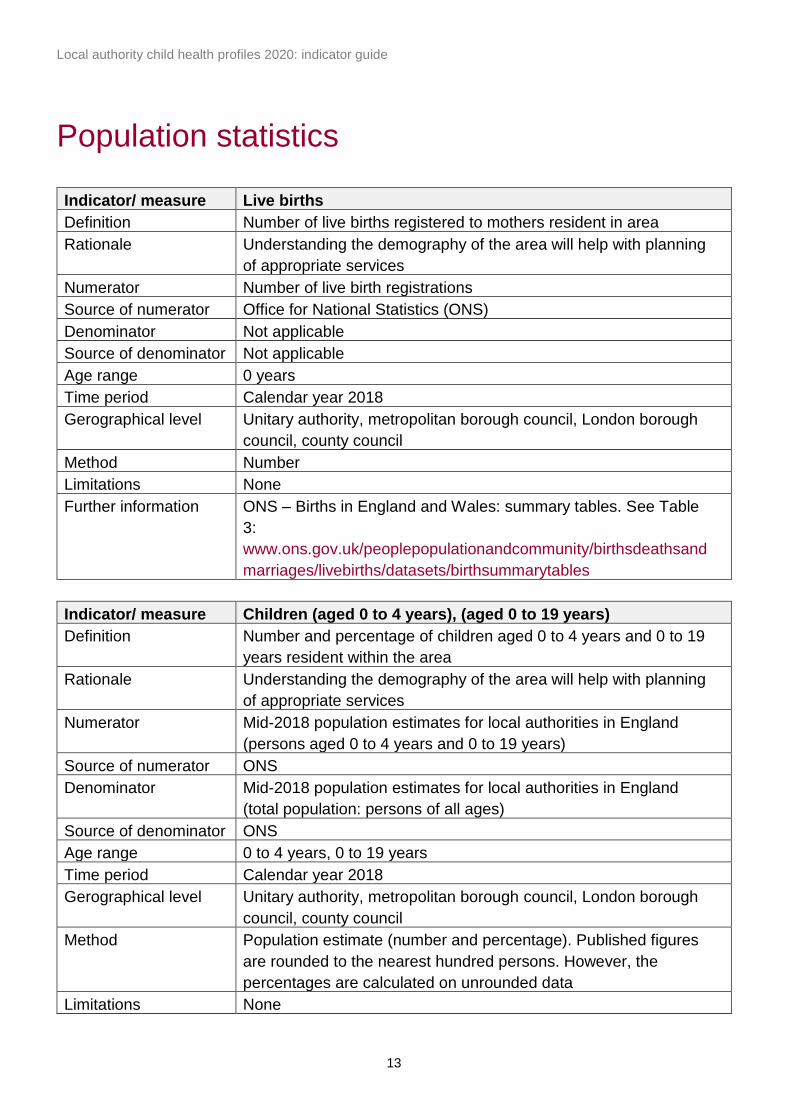
Population statistics
Indicator/ measure Live births
Definition Number of live births registered to mothers resident in area
Rationale Understanding the demography of the area will help with planning
of appropriate services
Numerator Number of live birth registrations
Source of numerator Office for National Statistics (ONS)
Denominator Not applicable
Source of denominator Not applicable
Age range 0 years
Time period Calendar year 2018
Gerographical level Unitary authority, metropolitan borough council, London borough
council, county council
Method Number
Limitations None
Further information ONS – Births in England and Wales: summary tables. See Table
3:
www.ons.gov.uk/peoplepopulationandcommunity/birthsdeathsand
marriages/livebirths/datasets/birthsummarytables
Indicator/ measure Children (aged 0 to 4 years), (aged 0 to 19 years)
Definition Number and percentage of children aged 0 to 4 years and 0 to 19
years resident within the area
Rationale Understanding the demography of the area will help with planning
of appropriate services
Numerator Mid-2018 population estimates for local authorities in England
(persons aged 0 to 4 years and 0 to 19 years)
Source of numerator ONS
Denominator Mid-2018 population estimates for local authorities in England
(total population: persons of all ages)
Source of denominator ONS
Age range 0 to 4 years, 0 to 19 years
Time period Calendar year 2018
Gerographical level Unitary authority, metropolitan borough council, London borough
council, county council
Method Population estimate (number and percentage). Published figures
are rounded to the nearest hundred persons. However, the
percentages are calculated on unrounded data
Limitations None

Local authority child health profiles 2020: indicator guide
14
Further information ONS – Estimates of the population for the UK, England and
Wales, Scotland and Northern Ireland. See Table ‘MYE2 – All’:
www.ons.gov.uk/peoplepopulationandcommunity/populationandm
igration/populationestimates/datasets/populationestimatesforuken
glandandwalesscotlandandnorthernireland
Indicator/ measure Children (aged 0 to 19 years) in 2028 (projected)
Definition Projected number and percentage of children aged 0 to 19 years
resident within the area in 2028
Rationale Understanding how the demography of the area is projected to
change will help with planning of appropriate services
Numerator 2016-based subnational population projections for local
authorities in England (ages 0 to 19 years)
Source of numerator ONS
Denominator 2016-based subnational population projections for local
authorities in England (total population, persons of all ages)
Source of denominator ONS
Age range 0 to 19 years
Time period Calendar year 2028
Gerographical level Unitary authority, metropolitan borough council, London borough
council, county council
Method Population projections (number and percentage). Published
figures are rounded to the nearest hundred persons. However,
the percentages are calculated on unrounded data
Limitations Long-term subnational population projections are an indication of
the future trends in population by age and sex over the next 25
years.
They are trend-based projections, which means assumptions for
future levels of births, deaths and migration are based on
observed levels mainly over the previous 5 years. They show
what the population will be if recent trends continue.
The projected resident population of an area includes all people
who usually live there, whatever their nationality. People moving
into or out of the country are only included in the resident
population if their total stay in that area is for 12 months or more,
thus visitors and short-term migrants are not included. Armed
forces stationed abroad are not included, but armed forces
stationed within an area are included. Students are taken to be
resident at their term-time address.
Local authority child health profiles 2020: indicator guide
15
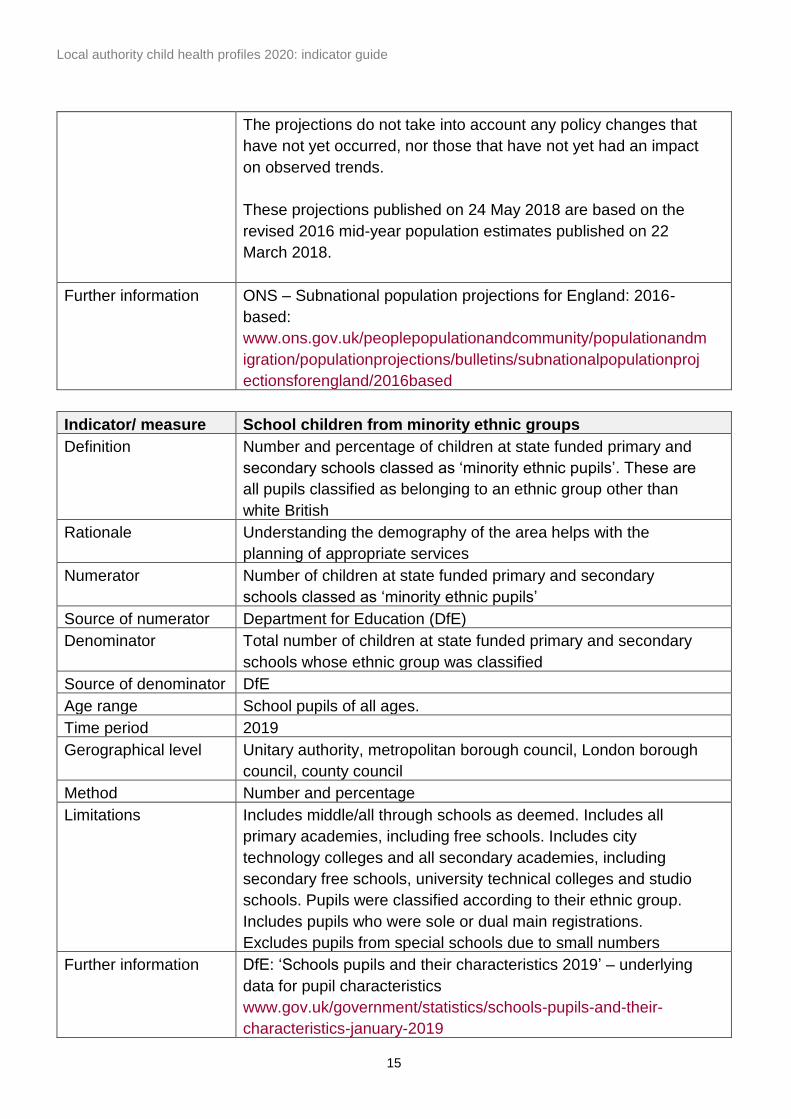
The projections do not take into account any policy changes that
have not yet occurred, nor those that have not yet had an impact
on observed trends.
These projections published on 24 May 2018 are based on the
revised 2016 mid-year population estimates published on 22
March 2018.
Further information ONS – Subnational population projections for England: 2016-
based:
www.ons.gov.uk/peoplepopulationandcommunity/populationandm
igration/populationprojections/bulletins/subnationalpopulationproj
ectionsforengland/2016based
Indicator/ measure School children from minority ethnic groups
Definition Number and percentage of children at state funded primary and
secondary schools classed as ‘minority ethnic pupils’. These are
all pupils classified as belonging to an ethnic group other than
white British
Rationale Understanding the demography of the area helps with the
planning of appropriate services
Numerator Number of children at state funded primary and secondary
schools classed as ‘minority ethnic pupils’
Source of numerator Department for Education (DfE)
Denominator Total number of children at state funded primary and secondary
schools whose ethnic group was classified
Source of denominator DfE
Age range School pupils of all ages.
Time period 2019
Gerographical level Unitary authority, metropolitan borough council, London borough
council, county council
Method Number and percentage
Limitations Includes middle/all through schools as deemed. Includes all
primary academies, including free schools. Includes city
technology colleges and all secondary academies, including
secondary free schools, university technical colleges and studio
schools. Pupils were classified according to their ethnic group.
Includes pupils who were sole or dual main registrations.
Excludes pupils from special schools due to small numbers
Further information DfE: ‘Schools pupils and their characteristics 2019’ – underlying
data for pupil characteristics
www.gov.uk/government/statistics/schools-pupils-and-their-
characteristics-january-2019
Local authority child health profiles 2020: indicator guide
16
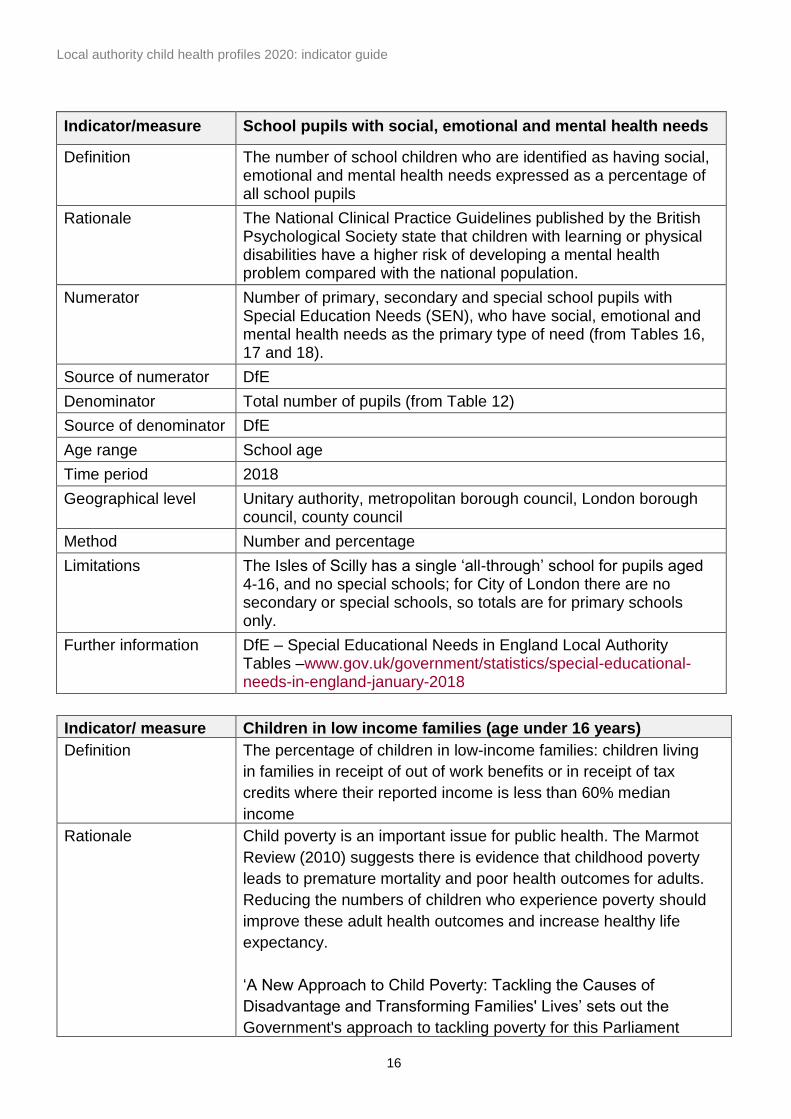
Indicator/measure School pupils with social, emotional and mental health needs
Definition The number of school children who are identified as having social, emotional and mental health needs expressed as a percentage of all school pupils
Rationale The National Clinical Practice Guidelines published by the British Psychological Society state that children with learning or physical disabilities have a higher risk of developing a mental health problem compared with the national population.
Numerator Number of primary, secondary and special school pupils with Special Education Needs (SEN), who have social, emotional and mental health needs as the primary type of need (from Tables 16, 17 and 18).
Source of numerator DfE
Denominator Total number of pupils (from Table 12)
Source of denominator DfE
Age range School age
Time period 2018
Geographical level Unitary authority, metropolitan borough council, London borough council, county council
Method Number and percentage
Limitations The Isles of Scilly has a single ‘all-through’ school for pupils aged 4-16, and no special schools; for City of London there are no secondary or special schools, so totals are for primary schools only.
Further information DfE – Special Educational Needs in England Local Authority Tables –www.gov.uk/government/statistics/special-educational-needs-in-england-january-2018
Indicator/ measure Children in low income families (age under 16 years)
Definition The percentage of children in low-income families: children living
in families in receipt of out of work benefits or in receipt of tax
credits where their reported income is less than 60% median
income
Rationale Child poverty is an important issue for public health. The Marmot
Review (2010) suggests there is evidence that childhood poverty
leads to premature mortality and poor health outcomes for adults.
Reducing the numbers of children who experience poverty should
improve these adult health outcomes and increase healthy life
expectancy.
‘A New Approach to Child Poverty: Tackling the Causes of
Disadvantage and Transforming Families' Lives’ sets out the
Government's approach to tackling poverty for this Parliament

Local authority child health profiles 2020: indicator guide
17
and up to 2020. This strategy meets the requirements set out in
the Child Poverty Act 2010, focuses on improving the life chances
of the most disadvantaged children, and sits alongside the
Government’s broader strategy to improve social mobility.
Numerator Number of children aged under 16 living in families in receipt of
out-of-work benefits plus the number of children aged under 16
living in families in receipt of tax credits with income below 60%
of median
Source of numerator HM Revenue and Customs (HMRC)
Denominator Children in child benefit families aged under 16 years
Source of denominator HMRC
Age range 0 to 15 years
Time period Snapshot as at 31 August 2016
Gerographical level Unitary authority, metropolitan borough council, London borough
council, county council
Method Percentage
Limitations None
Further information HMRC – Personal tax credits: Children in low-income families
local measure:
www.gov.uk/government/statistics/personal-tax-credits-children-
in-low-income-families-local-measure-2016-snapshot-as-at-31-
august-2016
Indicator/ measure Life expectancy at birth
Definition Male or female life expectancy at birth
Rationale Life expectancy at birth takes into account deaths at all ages and
is one of the most commonly used outcome measures for
examining the health of a population
Numerator Male or female life expectancy at birth
Source of numerator ONS
Denominator Not applicable
Source of denominator Not applicable
Age range Life expectancy at birth
Time period Calendar years 2016, 2017 and 2018 pooled
Gerographical level Unitary authority, metropolitan borough council, London borough
council, county council
Method The figures are a 3-year average, produced by aggregating
deaths and population estimates for 2016 to 2018
Limitations
Further information ONS dataset showing life expectancy at birth and at age 65 years
by local areas, UK:
https://fingertips.phe.org.uk/profile/public-health-outcomes-
framework

Local authority child health profiles 2020: indicator guide
18
Spine chart indicators
Full details of how the indicators included in the spine chart on page 4 of child health
profiles 2020 have been calculated, and the sources of this data, are included in the
interactive version of the profiles available on PHE’s Fingertips tool. For help using the
interactive tool or for further advice, please contact the local knowledge and intelligence
service in your area.