Local Area Physician Workforce Planning Model Pilot Area Physician Workforce...Local Area Physician...
22
Local Area Physician Workforce Planning Model Pilot Michael Dill, M.S. 1 ; Gary Hirsch, S.M. 2 ; Emily Yunker, M.P.A. 1 1 Association of American Medical Colleges 655 K Street NW, Suite 100 Washington, DC, 20002 202-828-0963 [email protected] 2 Independent Consultant 7 Highgate Road Wayland, MA 01778 508-202-2990 [email protected] Abstract Physician workforce planning tools are needed to address the adequacy of the nation’s physician workforce to meet its health needs. Since health care is an inherently local phenomenon, physician supply and demand need to be understood in the local area context. Therefore, we seek to build a Local Area Physician Workforce Planning Model that emphasizes a local perspective. To that end, we are developing a process to improve physician workforce planning to better align workforce capacity with community needs. The cornerstone of this effort is the extensive use of an iterative series of group model building processes that engage local system stakeholders in creating a system dynamics-based model of physician workforce capacity and need that facilitates planning and the evaluation of potential policy changes. We are approaching the conclusion of our work in our pilot site, the U.S. metropolitan area of Cleveland, Ohio. The model and development process have generated important lessons, including: the importance of advance preparation for group model building sessions; how a combination of group model building and data analysis can verify shared mental models and highlight key policy levers; the difficulties associated with modeling complex supply chains; and the limitations imposed by a dearth of suitable data. Overview We are in the early stages of a long term system dynamics modeling project that seeks to address the question of how the physician workforce can be configured to best meet a local population’s health needs. Complicating this task is a dynamic environment where payment and care delivery models are evolving, significant changes are occurring in federal and state level policies, and physician work patterns are shifting dramatically. Our goal is to create a model-based tool to support policy decision-making. This requires an enhanced understanding of how supply and demand forces dynamically shape how well an area’s physician workforce capacity meets its health care needs. Past physician workforce projections that we published were based on linear models which could not be applied at the local area level, where most physician workforce decisions are made and where physician services are provided, in a way that reflects that area’s unique circumstances. We have therefore moved to a community-based group model building approach, grounded in
Transcript of Local Area Physician Workforce Planning Model Pilot Area Physician Workforce...Local Area Physician...

Local Area Physician Workforce Planning Model Pilot Michael Dill, M.S.
1; Gary Hirsch, S.M.
2; Emily Yunker, M.P.A.
1
1Association of American Medical Colleges
655 K Street NW, Suite 100
Washington, DC, 20002
202-828-0963
2Independent Consultant
7 Highgate Road
Wayland, MA 01778
508-202-2990
Abstract
Physician workforce planning tools are needed to address the adequacy of the nation’s physician
workforce to meet its health needs. Since health care is an inherently local phenomenon,
physician supply and demand need to be understood in the local area context. Therefore, we seek
to build a Local Area Physician Workforce Planning Model that emphasizes a local perspective.
To that end, we are developing a process to improve physician workforce planning to better align
workforce capacity with community needs. The cornerstone of this effort is the extensive use of
an iterative series of group model building processes that engage local system stakeholders in
creating a system dynamics-based model of physician workforce capacity and need that
facilitates planning and the evaluation of potential policy changes. We are approaching the
conclusion of our work in our pilot site, the U.S. metropolitan area of Cleveland, Ohio. The
model and development process have generated important lessons, including: the importance of
advance preparation for group model building sessions; how a combination of group model
building and data analysis can verify shared mental models and highlight key policy levers; the
difficulties associated with modeling complex supply chains; and the limitations imposed by a
dearth of suitable data.
Overview
We are in the early stages of a long term system dynamics modeling project that seeks to address
the question of how the physician workforce can be configured to best meet a local population’s
health needs. Complicating this task is a dynamic environment where payment and care delivery
models are evolving, significant changes are occurring in federal and state level policies, and
physician work patterns are shifting dramatically. Our goal is to create a model-based tool to
support policy decision-making. This requires an enhanced understanding of how supply and
demand forces dynamically shape how well an area’s physician workforce capacity meets its
health care needs.
Past physician workforce projections that we published were based on linear models which could
not be applied at the local area level, where most physician workforce decisions are made and
where physician services are provided, in a way that reflects that area’s unique circumstances.
We have therefore moved to a community-based group model building approach, grounded in

local stakeholder input and centered on a systems-based workforce projection model and policy
evaluation tool designed explicitly to help localities design effective policy interventions.
Local decision-makers have a number of policy and programmatic “levers” available to them as
they try to adjust the health workforce to meet the population’s health care needs. These levers
include the size and mix of local training programs, incentives to retain people completing
training and those who might migrate in from other areas, and the numbers and kinds of
positions offered and compensation and other conditions that go with those positions. The
problem faced by local decision makers is that there is no framework for understanding how
their decisions affect each other and the size and makeup of the health care workforce. Without
such a framework, it is difficult for them to come together and create a set of workforce
programs and policies in a coherent manner. This model is designed to meet that need by
integrating the various aspects of physician workforce supply and demand.
We are approaching the conclusion of our work in our pilot site, the U.S. metropolitan area of
Cleveland, Ohio. The model and model development process we have established thus far have
generated some important lessons for us as model builders, including: the importance of advance
preparation for group model building sessions; how a combination of group model building and
data analysis can verify shared mental models and highlight key policy levers; the difficulties
associated with modeling inherently complex supply chains; and the limitations imposed upon
modeling by a dearth of suitable data. This paper will describe the process of model development
including group model building, the structure of the pilot model and some simulations it
produced, data dilemmas we faced, and plans for future development.
Background
Physician workforce planning tools are needed to address the adequacy of the nation’s physician
workforce to meet its health needs, including alarm over insufficient absolute numbers and
specialty mix, capacity to adapt to new models of care and payment, and chronic geographic
maldistribution (IHS, 2015; Dill & Salsberg, 2008; Colwill et al, 2008; Peterson et al, 2012;
Phillips et al, 2009). Key issues in this context include: a rise in overall utilization of health care
services (CDC, 2014); the increasing need for management of multiple chronic conditions (IOM,
2001); changes in physician work hours, efficiency and retirement patterns; an aging population
and workforce (IHS, 2015; Dill & Salsberg, 2008); and pressures to change the way both
Medicaid and Medicare pay for health care, such as the Bundled Payments for Care
Improvement (BPCI) Initiative (CMS, 2014).
In 2008, the AAMC released The Complexities of Physician Supply and Demand: Projections
Through 2025; and in 2015, IHS prepared The Complexities of Physician Supply and Demand:
Projections from 2013 to 2025 for AAMC (IHS, 2015). These reports – major resources for
policy advocacy, research, and analysis on the physician workforce – contain series of scenario-
based physician workforce projections for the U.S. However, the models used could not be
applied at local area level, where a great deal of variation can occur.
Indeed, while national numbers are important, health care is an inherently local phenomenon,
needed, sought, and provided at the local area level. Relative supply, demand, and access levels
vary greatly by geographic area. Thus, physician supply and demand need to be understood in
the local area context in order to inform both local and national level physician workforce
planning discussions. We therefore seek to illuminate the nuances of physician workforce
planning that require insights into the local dynamics of supply and demand, specialty mix,
socioeconomic challenges with seeking and accessing health care, and challenges posed by state
and local policy environments. Even more significantly for our purposes, physician workforce
planning happens largely within local health systems, where most physicians are employed and
provide their services.
We set out to build a Local Area Physician Workforce Planning Model that emphasized a local
perspective. We are developing a process for helping localities and their health systems to
improve their physician workforce planning to better align their workforce capacity with
community health care needs. The cornerstone of this effort is a system dynamics-based
computer simulation model of physician workforce capacity and need that facilitates workforce
planning and the evaluation of potential policy changes, especially those related to physician
workforce recruitment and training.
Methodology
Models should be based on our best understanding of how the underlying system works and
evolves. A systems-based methodology is most appropriate for this modeling work, as it tends to
suit the dynamic complexity of problems within health systems (Homer & Hirsch, 2006).
Moreover, a system dynamics model focuses on endogenous explanations for changes over time
in key variables (Richardson, 2011). This endogenous focus enables users to identify leverage
points for achieving change, making system dynamics models particularly well-suited to local
area workforce planning needs, as they provide stakeholders options for action, rather than
merely reaction. The endogenous focus is also crucial for capturing the effects of interactions
between workforce supply and demand.
The modeling work described in this paper also draws on extensive experience in applying
system dynamics methods to modeling health care systems, care delivery, and population health,
both for general populations and people facing particular health problems such as chronic
illnesses (Homer et al, 2004; Milstein et al, 2010; Hirsch et al, 2012; Hirsch et al, 2014). This
work has been important for identifying the structures that affect the health of populations and
the nature of the health care that they receive.
We are drawing upon the direct involvement of local system stakeholders in model
conceptualization and development, employing an iterative group model building process.
Building the model in this fashion has led to a better understanding of local health care systems
and the effects that policy changes are likely to have on them, because the model is informed and
validated by those with firsthand knowledge of those systems. Thus, the group model building
process lies at the heart of our modeling strategy, bringing together stakeholders from across the
health care landscape as a type of learning collaborative with a shared interest in a common
problem.
Well established in the field of system dynamics (e.g., Richardson & Andersen, 1995), group
model building allows stakeholders with diverse perspectives, and even diverse problem
definitions, to share their views and critically examine them in a collaborative environment to
collectively create a better overall understanding of the problem (Vennix, 1996). The strength of
group modeling building lies in the engagement of stakeholders, the explicit sharing of mental
models, the use of simulation to test hypotheses, and ultimately moving participants toward a
shared confidence in the new mental models that emerge from their collaboration (Richardson &
Anderson in Kilgour & Eden, 2010).
The process is conducted through facilitated face-to-face meetings with stakeholders to elicit
model structure in an inductive fashion and engage participants directly in the process of model
conceptualization and formulation. Facilitators employ a set of “scripts” intended to elicit the
desired types of input from participants (Andersen et al, 2007; Luna-Reyes et al, 2006). Groups
unfamiliar with technical modeling methods are introduced to their language and symbols
through a set of small concept models constructed specifically for this purpose, using simple
pictures labeled in the group’s lexicon to draw them into this approach (Richardson, 2006).
Inspired by work done on the ReThink Health project (Rippel Foundation, 2015), we opted for a
strategy of working with a series of local area sites in order to develop a general Local Area
Physician Workforce Planning Model, and a process for adapting and implementing the model.
We will be working with one site after another, modifying and improving our model and our
process for working with local area stakeholders at each site. We will keep calibrating the model
and fine-tuning the process in each specific place, until we have a model and process that are
polished enough that they can be implemented in any area with engaged stakeholders. Not
having done anything like this before, we needed a pilot site, where we could begin with a deep
dive into the local health care landscape, learning its contours: the pressing health, health care,
and physician workforce issues; and getting to know the key stakeholders.
Process
Given its focus on developing a local area health workforce that meets local community needs,
and its potential for generating initial local area contacts, we opted to select one of the sites
involved in another AAMC cooperative endeavor, Urban Universities for HEALTH (Urban
Universities for HEALTH, 2015). After a preliminary review of basic demographic and health
systems data on four of the five main Urban Universities for HEALTH sites (Cincinnati,
Cleveland, Kansas City and Albuquerque – having discounted Brooklyn as inappropriate for a
pilot site), we decided to focus on Cleveland. It is a largely urban area, leaving the complexity of
rural-urban disparities for later sites; it is the site of some significant innovation initiatives, such
as Aligning Forces for Quality (Robert Wood Johnson Foundation, 2015) and Centers for
Medicare and Medicaid Innovation initiatives (CMS, 2015); there are medical schools and other
health professions schools present; and it appeared to offer good relevant data at the state, if not
metropolitan area, level.
Beginning with our initial local contacts, who represented Urban Universities for HEALTH
partners at Northeast Ohio Medical University and Cleveland State University, we eventually
established comprehensive Cleveland area stakeholder contacts through extensive networking,
including site visits to Cleveland, as well as phone calls and e-mails to establish, develop, and
maintain connections. Our current stakeholder network now comprises representatives of all the
area’s major health systems, local and state government, area medical schools, practitioners,
consumer advocacy groups, non-profit health services research organizations, Federally-qualified
Health Centers, private insurance, the local Veterans Administration medical center, the city
school district, and the state boards of medicine and nursing. What we are trying to do appears to
resonate with actors across Cleveland’s health care landscape as a necessary and highly valued
endeavor.

Bringing the group together
After a series of telephone and e-mail communications, as well as a site visit and tour of the
Cleveland area that focused on the geospatial arrangement of its neighborhoods and major health
care facilities, we began to plan our first group model building session. We wanted to ensure that
participants in our group model building process were of a sufficient seniority level to have a
system-wide perspective, but still connected enough to daily operations to have a good sense of
the specific issues faced by practitioners and their patients. We also needed to achieve an
appropriate mix of system leaders, practitioners, trainers, trainees, analysts, and patient
advocates. We were able to draw on our network of contacts to recruit them directly, or those
they recommended based on who would be best suited to the intensive, technical, and creative
work we planned to undertake.
GMB I
The first group model building session was held on June 11, 2014, at Cleveland State University.
We chose a neutral site – one with no affiliation with the major health systems – in order to put
everyone on an equal footing and thwart potential competitive posturing which we had been
cautioned about in the course of our information gathering. For our first group model building
session, participants included executive suite leaders in the two largest health systems,
physicians, experts in healthcare economics, innovators in health care education, and a leading
patient advocate. All participants had been primed on our work through prior communications
that included structured and semi-structured interviews, but none had a background in system
dynamics modeling.
Prior to the first group model building session, AAMC contracted with Gary Hirsch, a leading
system dynamics modeler in the field of health care who helped to develop the HealthBound and
the ReThink Health models (Rippel Foundation, 2015; Hirsch et al, 2012; Milstein, Homer and
Hirsch, 2010; CDC, 2008), to lead the technical model building, and with David Andersen and
George Richardson to facilitate the group model building session itself. Drs. Andersen and
Richardson developed a detailed agenda and accompanying scripts, a list of which plus one
example can be found in Appendix A. These scripts were used to guide participants through a
primer on the technical aspects of model building, as well as a series of group activities aimed at
illuminating and elaborating on mental models of the way that the local health system works and
the problems it faces, and to begin the process of mapping out the model and the stories it should
tell (Richardson and Andersen, 2010). The first session involved 9 participants (see Appendix C)
in an eight hour day that started with a brief description of the purpose of the gathering, with
AAMC as convener and listener, and an overview of the day. Next, we began to use the scripts,
as participants described their hopes and fears for the day, for their community, and for the
model and modeling process. This activity was particularly beneficial as there was considerable
consensus in both the hopes and fears described. Cleveland health care is a particularly
competitive environment, and this activity helped break down preconceived notions of the big
issues concerning the various players. A “small but wrong” model was then used to introduce
modeling terminology and processes. Participants were next asked to graph key variables the
model should display, and the behavior of those variables over time. This was followed by a
discussion of the policy levers that might influence change in those variables. The variables
focused primarily on factors related to the of training physicians, public health service
utilization, and overall health, while the policy levers emphasized provider education and
organizational policies, expanded services, and patient education campaigns.

Participants honed in on key policy gaps in primary care and public health, specifically service
gaps faced by the area’s vulnerable poor and minority populations in the inner city, as well as the
training needed to meet these needs. We asked participants to develop “system policy stories”
(another script) to show what causes and impacts these issues. Three groups developed the
following ideal scenarios:
“Access for All”, which focused on providing appropriate care and encouraging service
in underserved areas.
“Public Health as Though the Public Matters”, which focused on building a healthy
community infrastructure and connecting patients with community resources.
“Enhancing Connectivity between the Health Care System and Local Community
Health”, which focused on building bridges between resources and providers.
During the development of system stories, participants identified the most important stakeholders
in implementing the policies that were an integral part of those stories. These stakeholders were
plotted on a “power and interest” grid, shown in Appendix B, allowing us to identify several key
constituencies who were missing from the group of stakeholders we had brought together for the
group model building and broader project: trainees (medical students and residents); specialty
care providers; community health centers; and the other prominent health systems in the area.
The day concluded with Mr. Hirsch showing the participants a simple model that he had
developed during the session to demonstrate how their day’s work translated into the icons and
language of a system dynamics model. This effectively demonstrated that the key variables and
policy levers they had identified translated effectively into a system dynamics model that could
be used to tell the types of system stories they wanted told.
Initial model building
This initiated an iterative process where each succeeding session provided feedback on the
modeling team’s interpretation of the last session and shifted into next steps for further model
improvement. Thus, we used the model from the conclusion of our first group model building
session as the basis of the actual system dynamics model we subsequently built. In the months
following that initial group model building session, the modeling team built and refined model
structures identified and defined by the group. We then identified various data that could be used
in the model, employing a series of “fall back” positions. Where we could find data specific to
the actual study area (the Cleveland-Elyria-Mentor Ohio Metropolitan Statistical Area), we used
those. If the parameters we sought to populate could not rely on local area data, then we looked
for data at the state level (Ohio). Failing that, we sought out national level data. Where no data
were available, we relied on the literature for estimates.
GMB II
The second group model building session was held in the same location on November 20, 2014,
for another eight hours. This session focused on eliciting stakeholder feedback on the model
building that had occurred as a result of the first session. We were able to secure a panel of 17
participants (see Appendix C), with the only absence being an administrator for the county-
owned safety net hospital, though practitioners from that system were represented.
After a brief catch-up on methodology for new participants, we reviewed the model and the
outputs it could display, talking through the points where we knew there were gaps. The
participants divided into groups to go through each portion of the model, discussing what needed

to be changed, added, and removed, and where each participant might help us fill in data gaps.
This took the majority of the day, as participants discussed supply for both primary care and
specialty care, and demand for the same. The group benefited from the inclusion of a health
economist who understood the labor market flows, and the leaders of a pipeline program who
could illuminate key issues with the way we had designed training structures.
In the concluding activity, we asked participants to prioritize the variables that should be
manipulated and the outputs they want to see, as they are the ultimate end users of the model. We
received fascinating feedback, particularly on when workforce recruiting and planning begin
(with high school students at the least and elementary school students at the ideal), the
complexity of the path through medical training, and the degree to which the health system relies
upon Advanced Practice Registered Nurses (APRNs) and Physician Assistants (PAs) despite
sometimes restrictive scope of practice regulations. These items constituted the primary focus for
the next revision of the model.
Revising the model
In the months following the second group model building session, we attempted to make the
requested revisions to the model. Primary among them was building out the training pipeline.
Because of the complex process for entering and completing training, as well as the variety of
ways that people can change their path, this proved particularly challenging. The number of
possible education pathways a physician can follow, especially if we extend the pipeline back to
where they attended high school, numbers in the thousands. Moreover, because the medical
school through residency education timeline is so long, typically taking from 8 to 14 years
depending on the specialty, and this pipeline can be exited and re-entered multiple times, the data
available to trace the pathways cannot always be assumed to be complete. Data collection for the
earliest point in which our stakeholders are interested, location of high school, only began in
2002. Given the three-year lag in updating the primary database on practicing physicians, the
American Medical Association’s Masterfile, we encounter a data window of 9 years: less than
that required for most physicians to complete their training.
Nonetheless, we were able to perform some important analyses on data related to physicians’
pathways through the educational pipeline. In particular, group model building participants had
emphasized policy levers related to “growing their own”, i.e., recruiting and training future
physicians from within the local population. Originally highlighted during a group model
building script that focused specifically on policy levers available and important to our
stakeholder participants, this concept lent itself to quantitative investigation in two different
ways: creation and analysis of original survey data on physicians practicing in the area; and
analysis of existing data on where practicing physicians attended high school. In conjunction
with our pilot modeling work in Cleveland, we fielded a survey of physicians practicing in
Cuyahoga County, the core county within the Cleveland MSA (2,500 surveys mailed, with 40%
response rate prior to third mailing which is currently in field). Based on group model building
participants’ expressed interest in “growing their own”, we included a question on that survey
about where physicians attended high school. Our results showed that more than a third of
practicing physicians in that County had attended high school in the Cleveland metropolitan area,
and half within the state of Ohio, where Cleveland is located. Moreover, for the subset of
practicing physicians nationwide for whom AAMC has data on high school location, and who
matriculated to medical school during the 2002-2005 period (the first years we collected high
school location data), we found that those who attended high school in Cleveland were 26 times

as likely to practice there when compared with those who attended high school anywhere else in
the U.S. We hope to follow up on that finding with further analyses.
GMB III
The third all-day group model building session was held on March 18, 2015, at Cleveland State
University. This session had 7 attendees (see Appendix C), though many who could not attend
expressed interest in continuing to participate. We are currently completing a series of web-based
conferences with them in order to elicit their input, as well. The content for this session focused
on key model structures which we had not been able to develop satisfactorily, and validating data
we had collected and analyzed. The group had particular interest in the physician pipeline and
the use of APRNs and PAs. We were able to flesh out some key policy levers for training
decisions made by programs and students, and where the decision points fit in the system.
We also devoted considerable time to reviewing some detailed data we had developed for the
pipeline parameters, paying particular attention to concerns we had over their veracity. In
compiling them for the most recent version of the model, we had discovered some crucial
problems with core data on physician supply and retention rates at different stages of the
educational pipeline. Stakeholders were able to help us understand what we were seeing in the
data, confirm our suspicions that some of the data were in error (though they were also able to
help us validate many of the data points we shared), and even provide us with more accurate data
through their own access to the sources of those data points. Informed by our participants’
feedback and data, we are now conducting analyses to improve the pipeline retention rates; and
we have initiated a longer term project to develop a method for improving our physician supply
estimates.
We are have not yet learned all the lessons and built all the structures necessary to call the model
complete. We do need to move on to a new site in order to expand key aspects of the model, such
as the need for a rural component, and to improve the process through replication. However, we
established a plan for maintaining our contact with pilot site participants as we move forward.
The group showed interest in participating in ongoing conversations, both with the modeling
team and with other sites, through telephone and web conference. The main focus of these
sessions will be to discuss potentially major changes to the model structure and identify data
needs that they may be able to resolve for their own site. We will follow up with our Cleveland
contacts at the conclusion of the multi-site local model development project to deliver a final
model that can be used for the purpose of ongoing, locality-wide workforce planning.
The model
The model is still in development, as we are still just completing work at the pilot site.
Nonetheless, the basic structure of the model is fairly well developed (Figure 1). It includes
supply chains for physicians and the complementary professions of PAs and APRNs, whose
participation in care delivery directly affects the capacity of care physicians can provide, and
demand driven by population health, age, and income.
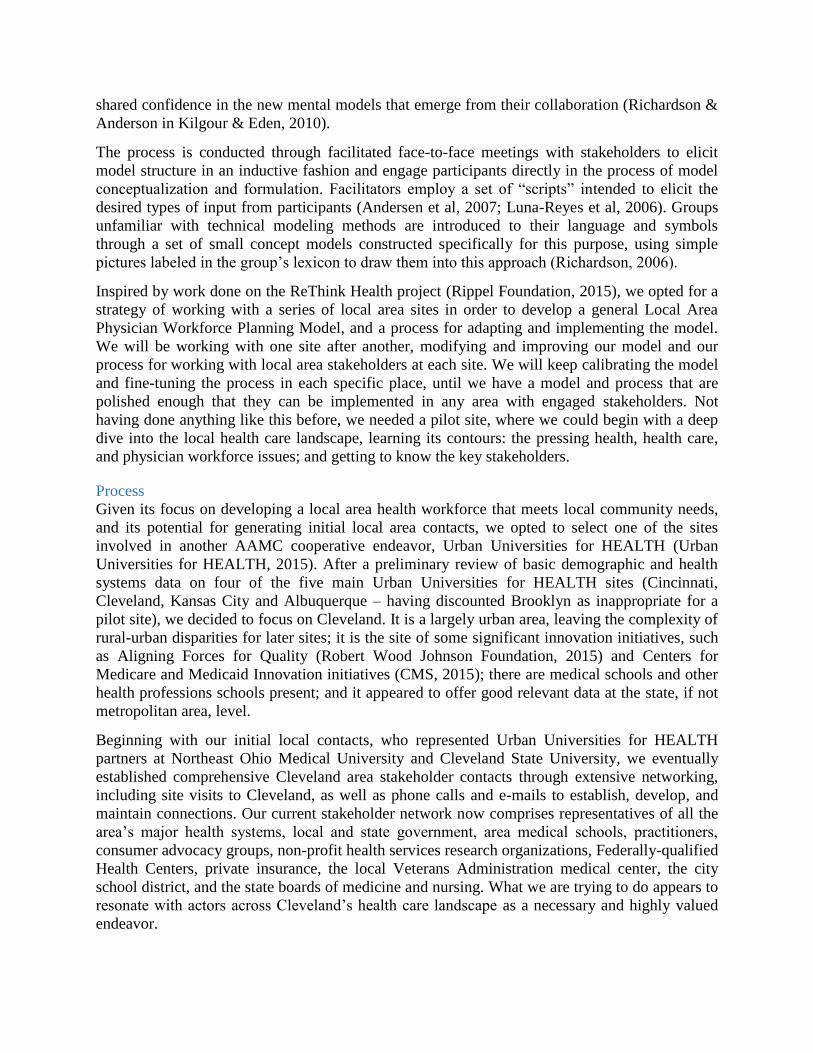
Figure 1. Overview of Pilot Local Area Physician Workforce Model
Figure 2 highlights the feedback loops inherent in the system. Loops A and B adjust the local
area population based on births and deaths. Loops C and D are balancing loops in which greater
needs for care ideally result in the greater demand for care, utilization of more care, improving
health, and limiting future needs for care. However, the delivery of care is constrained by the
capacity to provide both primary and specialty care. Capacity depends on the number of
physicians and mid-levels employed for primary and specialty care plus residents and fellows
who can also provide care. Loops E and F adjust employment to accommodate utilization plus
provide some percentage of slack capacity by increasing or decreasing positions available.
Employment also depends on the willingness of people to fill vacant positions. Loops G and H
embody the response of physicians, PAs and APRNs who may migrate from other parts of the
country to fill vacancies and loops I and J affect the willingness of people trained in local
programs to remain in the area depending on the job opportunities available.
Population Distributed
by Age, Income, and
Health Status
Demand for
Primary Care
Demand for
Specialty Care
Visits, Procedures
Primary Care Visits
Delivered
Specialty Visits and
Procedures Delivered
Fraction with Insurance
Coverage and Types of
Coverage
Capacity to Deliver Primary
Care Visits, by Setting
(Office, CHC, OPD)
Capacity to Deliver
Specialty Visits and
Procedures, by Setting
(Office, CHC, OPD)
Primary Care
Physicians by Age,
Gender, and Setting
Specialty Physicians
by Age, Gender, and
SettingFractions of Facilities
Accepting Medicaid, by
Setting
Average Patient
Care Hours by Age
and Gender
Residents in Local
Primary Care
Training Programs
Residents in Local
Specialty Training
Programs
Fractions Completing Local
Programs Retained in Area
Physicians Coming
from and Going
Elsewhere
Nurse
Practitioners by
Age and Setting
Physician
Assistants by
Age and Setting
Medical
Students in
Local
Programs
Nurse Practitioners
in Local Training
Programs
Physician
Assistants in
Local Training
Programs
Medical Students
from Elsewhere
Entering Local
Residency Programs
Adequacy of
Primary Care
Adequacy of
Specialty Care
Fellows in Local
Sub-Specialty
Training Programs

Figure 2: Feedback Loops in the Pilot Local Area Physician Workforce Model
The supply of practicing physicians is modeled in two parallel sections for primary care and
specialty care (Figure 3 – structure for specialty care not shown). The structures are identical but
built separately as each performs somewhat separate functions within the larger system,
addressing different types of demands for care, and each also affects the other.
Figure 3. Pilot Basic Model Structure for Primary Care Physician Supply
Primary Care Visits
Delivered
Specialty Visits and
Procedures Delivered
Population Distributed
by Age and IncomeNeed for Care Demand for Care
Deaths
Insurance
Coverage
Health
Literacy
Capacity to Deliver
Primary Care
Births
Capacity to Deliver
Specialty Care
Positions Available
for Primary Care
Positions Available for
Specialty Care
Physicians andMid-Levels Employed
in Primary Care
Physicans and
Mid-Levels Employed
in Specialty Care
Vacancies for
Specialty Care
Vacancies for
Primary Care
Net Migration of
Specialists Into
the Area
Net Migration of Primary
Care Providers Into the
Area
Retention of Specialty
Trainees in the Area
Retention of Primary
Care Trainees in the
Area
Relative Compensation
and Amenities in Area
Mid-Level Training
Programs
Primary Care
Residencies
Specialty Residencies
and Fellowships
A
BC
D
E
F
G
H
I
J
Capacity to Deliver
Primary Care Visits
Primary Care Visits
Delivered
PAs and NPs
Employed in
Primary Care
Physician Visits
Available for Primary
Care
Net Hiring of PAs and
NPs Employed in
Primary Care
Primary CareResidents in
Local TrainingPrograms
Primary CareResidentsCompleting
Local Programs
Primary CareResidents
Entering LocalPrograms
Positions for Employing
Primary Care Physicians
Available Positions Effect on
Primary Care Retention
Fraction
Local Area Retention
Fraction for Primary Care
Residents
NewPhysiciansEngaged in
Primary Care
Mid-CareerPhysiciansEngaged in
Primary Care
OlderPhysiciansEngaged in
Primary CarePhysiciansAging IntoMid-Career
PhysicansAging into
Late CareerRetirements and Net
Hiring and Migration
of Older Primary Care
Physicians
Net Hiring and Migration of
Mid-Career Primary Care
Physicians
Entry of New Primary
Care Physicians from
Residency
Total Primary Care Physician
Patient Care Hours Available
per Week
Local Supply of
Primary Care
Physicians
Net Hiring and Migration of
New Primary Care
Physicians
Relative Availability of
Primary Care Physicians
Resident Visits
Available for Primary
Care
PA and NP Visits
Available for Primary
Care
<Total Demand for
Primary Care Visits>
Change in Primary
Care Positions
Desired Primary
Care Positions

Demand for primary care physicians is built around three stocks that divide the population by
health status, with people in each health status needing and using different levels of service
(Figure 4). Insurance coverage is also built into this part of the model, as it is a crucial driver of
access to health care in the U.S. It generates numbers of visits needed and used. Specialty care
demand is also built around the same three population health status stocks, but along with
generating visits it also includes additional model structures for hospital admissions, stays and
procedures (Figure 5).
Figure 4. Pilot Basic Model Structure for Primary Care Demand
Figure 5. Pilot Basic Model Structure for Specialty Care Demand
Primary Care Visits
Delivered Capacity to Deliver
Primary Care Visits
Demand for Primary
Care VisitsNeed for Primary
Care VisitsFraction with Effective
Insurance Coverage for
Primary Care
Fraction of Population
with Coverage by
Segment
Fraction of People with
Regular Source of Primary
Care
People with
excellent or very
good health
People with good
health
People with fair or
poor healthDeveloping
Moderate ChronicIllness
DevelopingSevere Chronic
Illness
Deaths of People with
No Chronic Illness
Deaths of People with
Moderate Chronic Illness
Deaths of People with
Severe Chronic Illness
Adequacy of
Primary Care
Adequacy of
Specialty Care
Fraction of Primary Care
Capacity Accepting
Insurance
Effect of Health Literacy
on Demand for CareNeed for ER
Visits
Non-Urgent ER
Visits
Fraction of ER Visits
That Are Non-Urgent
Effect of Adequacy of
Care on Development
of Chronic Illness
Effect of Adequacy of
Specialty Care on Need for
Primary Care
Effect of Regular Source
of Care on Demand for
Care

Since the second group model building session, we have been focused on building out two of the
supply chains that our participant stakeholders told us needed more elaboration, especially since
they included key policy decision points. One of these is the educational pipeline for physicians,
which our stakeholders said needed to be extended back to include medical school, and
preferably even information on where physicians attended high school. The other is the local
educational pipeline for producing PAs and APRNs.
The physician supply chain (Figure 6) now includes medical school and different residency
tracks (also known as graduate medical education, or GME). Data on high school attended have
not been collected long enough for us to include that variable in the model, though we have
separately analyzed some relevant data on that topic for our stakeholders.
Figure 6. Pilot Basic Model Structure for Physician Education Pipeline
The supply chains for PAs and APRNs (Figure 7) are more rudimentary but allow us to explicitly
model local contributions to these key factors in overall system capacity.
Specialty Visits
DeliveredDemand for
Specialty Visits
Need for
Specialty Visits
Fraction of Specialty
Capacity Accepting
Insurance
Adequacy of
Specialty Care
People withexcellent or very
good health
People with good
health
People with fair or
poor health
Overall Specialty
Capacity Available
Need for Specialty
Procedures
Demand for Specialty
Procedures
Fraction of Population
with Coverage by
Segment
Capacity Demand for
Specialty Procedures
Specialty Procedures
Delivered
Need for Specialty
Admissions
Demand for Specialty
AdmissionsSpecialty
Admissions
Effective Insurance
Coverage for Specialty
Care
Ratio of Capacity to
Demand for Specialty
Care
Capacity Demand for
Specialty Visits
Overall Demand for
Specialty Capacity
Ratio of Specialty Capacity
to Demand by Population
Group
. .. ...
Residents in Local
Core Primary Care
Training ProgramsPrimary Care
Residents
Completing
Local Programs
Primary Care Residents
Entering Local Programs
Medical
Students in
Local Training
Programs Medical StudentsEntering Local
TrainingPrograms
Medical Students
Graduating from
Local Programs
Students from Elsewhere
Entering Primary Care
Residencies
Residents in Local
Core Specialty
Training ProgramsResidentsCompleting
Local Programsin Specialty
Care
Residents Entering Local
Programs in Specialty Care
Fellows in LocalTraining
Programs for SubSpecialty Care
Students from Elsewhere
Entering Specialty
Residencies
Residents Entering
Local Sub Specialty
Programs
Fellows
Completing Local
Sub Specialty
Programs
Residents Entering Sub
Specialty Programs from
Elsewhere

Figure 7. Pilot Basic Model Structure for Physician Assistant and Advanced Practice Registered
Nurse Pipelines
At the second group model building session, we presented some preliminary output from the
model in order to demonstrate the types of output we could generate at that time, but also to
check the face validity of that output. A few examples are presented here, all of which constitute
very preliminary output, beginning with basic output on projected population size by age (Figure
8) showing a slow decline. This is consistent with the long-term trend in the area.
Figure 8. Preliminary Projections of Population by Age, Cleveland MSA
We also presented projections of the need for visits by population age, in part to emphasize that
even if overall population is declining, it is also aging, and that implies growing need (Figure 9).
Figure 9. Preliminary Projections of Need for Primary Care Visits by Age, Cleveland MSA
Nurse Practitioners
Employed in
Primary Care
Net Additions of
Nurse Practitioners
Trained Elsewhere
Into Primary Care
Total NP and PA
Positions in Primary
Care
Nurse
Practitioners in
Training Nurse PractitonerStudents Entering
TrainingPrograms
Nurse Practitioners
Completing Training and
Entering Local Primary Care
Nurse Practitioners
Employed in
Specialty Care
Nurse Practioners Completing
Training and Entering Local
Specialty Care
Net Additions of
Nurse Practitioners
Trained Elsewhere
Into Specialty Care
Nurse Practitioner Graduates
Leaving to be Employed
Elsewhere
Physician
Assistants in
TrainingPhysician Assistant
Students Entering
Training Programs
PhysicianAssistants
Employed inPrimary Care
Physician Assistants
Completing Training and
Entering Local Primary Care
Net Additions ofPhysician AssistantsTrained Elsewhereinto Primary Care
Physician
Assistants
Employed in
Specialty Care
Physician AssistantsCompleting Trainingand Entering Local
Specialty Care
Physician Assistant
Graduateds Leaving to be
Employed Elsewhere
Net Additions of
Physician Assistants
Trained Elsewhere into
Specialty Care
Total NP and PA
Positions in Specialty
Care
Population by Age
3 M
2.25 M
1.5 M
750,000
0
0 2 4 6 8 10 12 14 16 18 20
Time (Year)
Total Children : Baseline
Total Adult : Baseline
Total Senior : Baseline

In preparation for the third group model building session, we prepared some model outputs that
focused on physician supply, reflecting our focus on the pipeline structures within the larger
model. These included the supply of physicians by age (Figure 10 – only primary care shown)
since the aging of physician supply is a key concern.
Figure 10. Projected Supply of Primary Care Physicians by Age, Cleveland MSA
Key lessons learned
We have learned some important lessons at our pilot site, both substantive and methodological.
We knew going in that in the field of health workforce modeling we were breaking new ground
with our community-based approach and focus on local area dynamics, where the social
determinants of health meet care-seeking and care-delivering decisions in the context of place.
Need for Primary Care Visits by Population
5 M
3.75 M
2.5 M
1.25 M
0
0 2 4 6 8 10 12 14 16 18 20
Time (Year)
Childrens Need for Primary Care Visits : test
Adults Need for Primary Care Visits : test
Seniors Need for Primary Care Visits : test
Primary Care Physicians by Age
4000
3000
2000
1000
0
0 2 4 6 8 10 12 14 16 18 20
Time (Year)Total New Primary Care Physicians : Baseline test20
"Total Mid-Career Primary Care Physicians" : Baseline test20
Total Older Primary Care Physicians : Baseline test20

We believed this was a crucial perspective to introduce because health care is largely a localized
phenomenon: it is needed, used, and provided at a local area level. Indeed, neighborhood level
factors affect health in multiple ways: direct effects on health; effects on health-related
behaviors; the accessibility of health care; and the long-term effects of opportunities associated
with place (Ellen et al, 2001; MacIntyre & Ellaway, 2000). While implementing our process, we
gained a new appreciation for the significance of perception in health care access: Even when
theoretically appropriate and accessible facilities are proximate to patients’ actual geographic
location, specific communities and neighborhoods still struggle with health care access. This is
because health care needs to be more than accessible: it needs to be perceived as accessible. Just
because there is a hospital in an impoverished area does not mean that its neighbors will see it as
a viable option for their own health care, regardless of whether they will actually be served there.
In terms of our method, we remain committed to a group model building approach, including the
development and use of scripts, such as our use of a “small but wrong” model as a step-by-step
guide to introducing system dynamics methodology to a group unfamiliar with it and its lexicon.
Without these, we would not have garnered the quality of input we have from our stakeholders.
We have also found unexpected value in one of the very first group model building scripts we
employed: identifying stakeholders’ hopes and fears for their communities and our project. We
have come to rely on those as a key reference in prioritizing project work: How well are we
building toward our partners’ hopes? What are we doing to ameliorate their fears?
Constructing scripts, or even adapting existing scripts, requires substantial preparatory work; but
without that investment, group model building sessions would not produce the immense value
that they do – for both the modeling team and for participants. They also provide interim guides
for a key concept that emerged from our group model building experience, which is the
management of expectations. Setting clear expectations for the entire pilot, as well as each
session and each session’s component (governed by scripts), was crucial to facilitating the
successful completion of our pilot work such that participants remain enthusiastic and committed
to participation even after we move to another site, and even though it will be years before we
return to them with a finished model.
We quickly discovered that modeling even a simplified version of the supply chain was a
complicated task. Flows through the chain for creating physician supply are seemingly
straightforward, involving just three main phases: undergraduate medical education; graduate
medical education; and active practice. But there are thousands of possible pathways, and
individuals can leave and re-enter the chain at different points. They can also emigrate and
immigrate at multiple points along the chain. Modeling this required substantial effort and
consultation with experts in order to reach the optimum compromise between simplification and
realistic representation. All of these difficulties were also compounded by data limitations that
made some flows difficult to parameterize. We have struggled with data throughout this process,
from having to rely on data points increasingly removed from the local area context (our “fall
back positions”), to the complexity, absence, and incompleteness of real world data. On the
demand side, national data on health care utilization cannot completely reflect locality specific
patterns, even when applied to local area demographics. On the supply side, we used the data set
for physicians which is generally accepted as the industry standard, and we found that it
produced significant overestimates of supply. This has led us to the realization that we need to
focus next on improving data we had initially hoped were sufficient. Moreover, comparable data
on PAs and APRNs simply do not exist. We need solutions to these data dilemmas. As we move

forward, we will be exploring the development and refinement of parameter estimates through
multiple methods, including the group model building process itself. Fortunately, we have
learned that this process can contribute to improved data by helping us to verify data points,
identify or confirm data errors and shortcomings, and connect us with better data, as well as to
identify strategies for improving the data, all of which will create improvements in our model but
also contribute more broadly to the fields of health workforce research and planning.
The model itself is still in development, but it has already revealed some key insights. Some
reinforced lessons learned from our national projections, and others were new. These include:
the importance of a concomitantly aging population and physician supply; the significant impact
medical school recruitment strategies can have on aligning future supply with population health
needs; how slightly different flows of future physician residents through the graduate medical
education pipeline (including location, program and specialty choice decisions) can dramatically
impact an area’s available supply of physician capacity; and the potential for an ever-widening
gap between capacity to provide visits and the need for visits even with the anticipated growth in
the absolute numbers of physicians, PAs and APRNs.
Next steps
Our immediate next step is to produce a final report for our pilot site, documenting for our
participants what we have accomplished to date, as well as sharing with them all the data we
have collected and compiled. We will soon move on to our second site, where we will attempt to
replicate our process, with some improvements, and continue to build and modify our model.
Eventually, through a series of local area partnerships, we hope to develop a model and model
development process that can be used for any local area in the U.S. which is interested in using
our approach to inform their physician workforce planning. We will then be able to return to all
our former partner sites, such as Cleveland, with a more refined product for them to use. Each
successive site where we work on the model will constitute a test of our model and process. We
anticipate a constant improvement process, taking Version 1.0 back to Cleveland once we are
ready, and Version 1.1 to the site after that. In the interim, beginning with our upcoming second
site, we will be implementing a formal evaluation process in conjunction with our model
building, examining more formally the validity of both our model-in-progress and our modeling
process.
We also plan to apply the process, model and data improvements developed for local areas to the
development of a new national physician workforce model which treats the national health care
landscape not as a single continuum, but as a diversity of contexts, capacities and communities.
With what we have learned from working with localities, we expect to be able to improve upon
our past methodology for national modeling. How actively it engages the national debate will be
the final test of the model and method.

References
Andersen DF, Vennix JAM, Richardson GP, and Rouwette EAJA. 2007. Group Model Building:
Problem Structuring, Policy Simulation, and Decision Support. Journal of the Operational
Research Society 58(5): 691-694.
Center for Medicare and Medicaid Services. 2014. Bundled Payments for Care Improvement
(BPCI) Initiative: General Information. Retrieved on June 5, 2014 from
http://innovation.cms.gov/initiatives/bundled-payments/.
Centers for Medicare and Medicaid Services. 2015. Center for Medicare and Medicaid
Innovation. Retrieved on March 4, 2015 from http://innovation.cms.gov.
Centers for Disease Control. 2008. “HealthBound”. http://www2.cdc.gov/syndemics/game.htm.
Last modified: January 30, 2008.
Centers for Disease Control. 2014. Physician offices and hospital outpatient department visits:
US, 2002-2010 (Source: NAMCS, NHAMCS). Health Data Interactive. Table accessed June 4,
2014, from http://www.cdc.gov/nchs/hdi.htm.
Colwill JM, Cultice JM, and Kruse RL. 2008. Will generalist physician supply meet demands of
an increasing and aging population? Health Affairs. 27(3):w232-w241.
Dill MJ and Salsberg ES. 2008. The complexities of physician supply and demand: projections
through 2025. Washington, D.C.: Association of American Medical Colleges.
Fannie E. Rippel Foundation. 2015. ReThink Health. Retrieved on March 4, 2015 from
http://www.rethinkhealth.org.
Hirsch G, Homer J, Milstein B, Scherrer L, Ingersoll C, Landy L, Sterman J, Fisher E. 2012.
ReThink Health Dynamics: Understanding and Influencing Local Health System Change. In
Proceedings of the 2012 International Conference of the System Dynamics Society, St. Gallen,
Switzerland, System Dynamics Society.
Hirsch G, Homer J, Orenstein D, Trogden J, Wile K. 2014. Using Simulation to Compare
Intervention Categories for Reducing Cardiovascular Disease Risks: Results for the United
States and a Less-Advantaged County. American Journal of Public Health 104 (7), 1187-1195.
Homer J and Hirsch G. 2006. System Dynamics Modeling for Public Health: Background and
Opportunities. American Journal of Public Health 96(3): 452-458.
Homer J, Hirsch G, Pierson M, and Minniti M. 2004. Models for Collaboration: How System
Dynamics Helped a Community Organize Cost Effective Care for Chronic Illness, System
Dynamics Review 20(3):199-222
IHS. 2015. The Complexities of Physician Supply and Demand: Projections from 2013 to 2025.
Prepared for the Association of American Medical Colleges. March, 2015. Retrieved May 18,
2015, from https://www.aamc.org/download/426242/data/ihsreportdownload.pdf.
Institute of Medicine. 2001. Crossing the Quality Chasm: A New Health System for the 21st
Century. Committee on Quality of Health Care in America, Institute of Medicine. National
Academy Press. Washington, DC.
Luna-Reyes LF, Martinez-Moyano IJ, Pardo TA, Cresswell AM, Andersen DF, Richardson GP.
2006. Anatomy of a group model-building intervention: building dynamic theory from case
study research. System Dynamics Review 22(4): 291-320.
Milstein B, Homer J, Hirsch G. 2010. Analyzing National Health Reform Strategies with a
Dynamic Simulation Model. American Journal of Public Health 100(5):811-819
Petterson SM, Liaw WR, Phillips RL, Rabin DL, Meyers DS, and Bazemore AW. 2012.
Projecting US primary care physician workforce needs: 2010-2025. Annals of Family Medicine.
10:503-509.
Phillips RL, Dodoo MS, Petterson SM, Xierali I, Bazemore AW, Teevan B, Bennett K,
Legagneur, C., Rudd, J., and Phillips, J. 2009. Specialty and Geographic Distribution of the
Physician Workforce: What Influences Medical Student and Resident Choices? Washington,
DC: Robert Graham Center.
Richardson GP. 2006. Concept Models. Proceedings of the 2006 International System Dynamics
Conference. Nijmegen, Netherlands, System Dynamics Society.
Richardson GP. 2011. Reflections on the foundations of system dynamics. System Dynamics
Review 27(3): 219-243.
Richardson GP and Andersen DF. 1995. Teamwork in Group Model-Building. System Dynamics
Review 11(2): 113-137.
Richardson GP and Andersen DF. 2010. Systems Thinking, Mapping, and Modeling in Group
Decision and Negotiation. Chapter in Kilgour DM & Eden C. Handbook of Group Decision and
Negotiation. Springer Verlag: Netherlands, 313-324.
Robert Wood Johnson Foundation. 2015. Aligning Forces for Quality: Improving Health &
Health Care in Communities Across America. Retrieved on March 4, 2015 from
http://www.forces4quality.org.
Urban Universities for HEALTH. 2015. Urban Universities for HEALTH. Retrieved on March 4,
2015 from http://www.urbanuniversitiesforhealth.org.
Vennix JAM. 1996. Group Model Building: Facilitating Team Learning Using System
Dynamics. John Wiley and Sons, Chichester.

Appendix A: Group Model Building Scripts Used To Date
GMB I
Hopes and Fears (Andersen & Richardson)
Elicited participant hopes and fears for model and for project more generally.
A Sketch of a Very Small and Wrong Simulating Model (Andersen & Richardson)
Introduced participants to iconography and lexicon of system dynamics modeling through
use of a small model that employed concepts familiar to participants but which was
wrong enough not to bias their conceptions of what should go into the real model.
Eliciting Graphs of Key Variables over Time (Andersen & Richardson)
Small group exercise that elicited reference mode behavior of variables of interest to
participants.
Preliminary Policy Levers of Interest (Andersen & Richardson)
Small group exercise that elicited from participants the policy levers that most interested,
and were most relevant to, them.
Systems Story Creation Involving Key Stakeholders (Andersen & Richardson)
Small group exercise that had participants put together stories of how the local health
care system works and what the effects of various policy changes might be, using the key
variables and policy levers of interest generated during prior activities.
Stakeholder Power and Interest (Andersen & Richardson)
OBJECTIVE: Participants plotted stakeholders who had interest in the issues we were
addressing along two axes: interest and power. (See Appendix B.) This was used to help
identify key stakeholders who were not yet participating in the GMB process.
PROCESS: During the Systems Story Creation activity, a facilitation team member
recorded the names and organizations of stakeholders to health policy. The group then
discussed where they should go on the axes of interest and power to affect change in the
health workforce. The discussion lasted approximately 20 minutes.
ASSESSMENT: While the group initially considered public health as the issue on which
to gauge interest, most of the positioning translated quite well to health workforce – the
true objective of the activity. After some edits after the session, we shared the grid with
participants during the following session and in follow-up conversations. This grid also
helped us to revise our invitee list for the second group model building session to ensure
a more complete group.
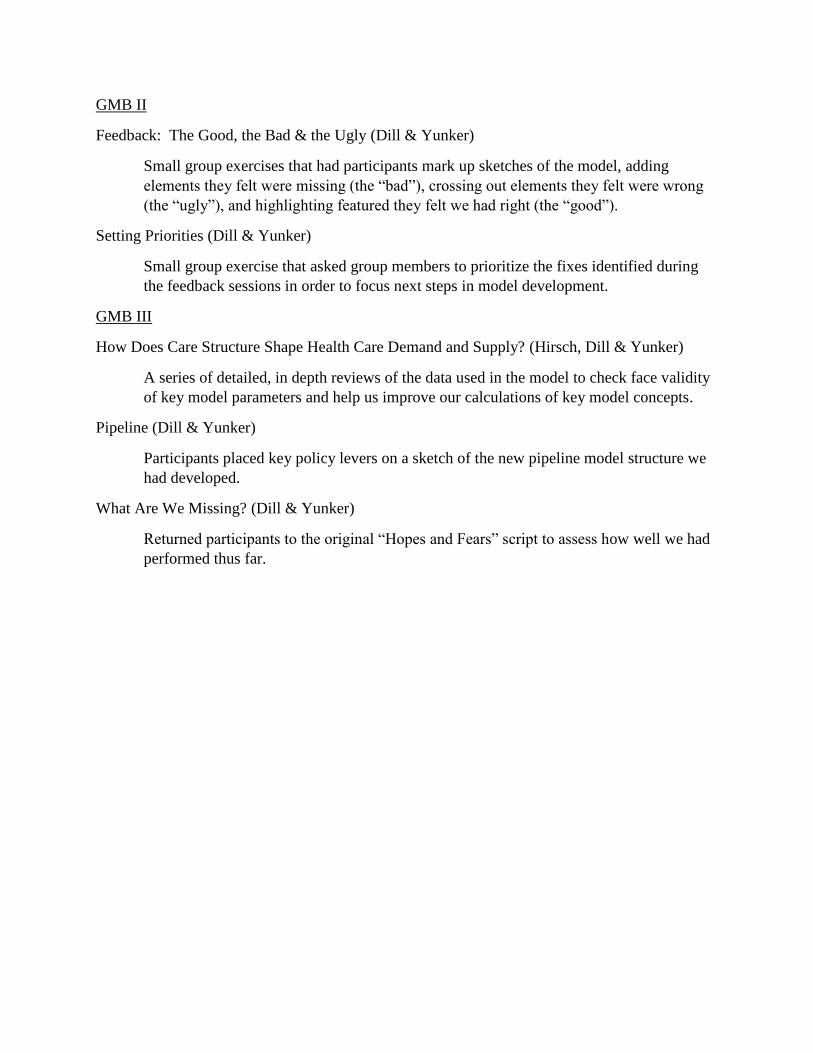
GMB II
Feedback: The Good, the Bad & the Ugly (Dill & Yunker)
Small group exercises that had participants mark up sketches of the model, adding
elements they felt were missing (the “bad”), crossing out elements they felt were wrong
(the “ugly”), and highlighting featured they felt we had right (the “good”).
Setting Priorities (Dill & Yunker)
Small group exercise that asked group members to prioritize the fixes identified during
the feedback sessions in order to focus next steps in model development.
GMB III
How Does Care Structure Shape Health Care Demand and Supply? (Hirsch, Dill & Yunker)
A series of detailed, in depth reviews of the data used in the model to check face validity
of key model parameters and help us improve our calculations of key model concepts.
Pipeline (Dill & Yunker)
Participants placed key policy levers on a sketch of the new pipeline model structure we
had developed.
What Are We Missing? (Dill & Yunker)
Returned participants to the original “Hopes and Fears” script to assess how well we had
performed thus far.

Appendix B: Power and Interest Grid
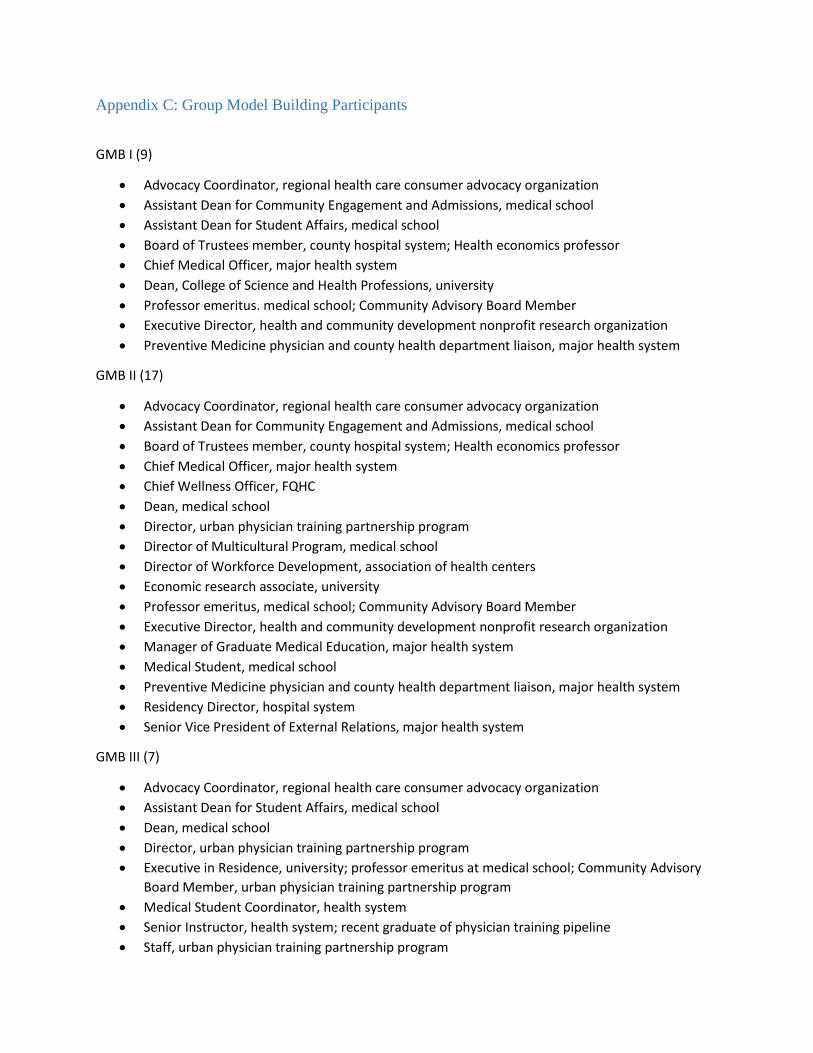
Appendix C: Group Model Building Participants
GMB I (9)
Advocacy Coordinator, regional health care consumer advocacy organization
Assistant Dean for Community Engagement and Admissions, medical school
Assistant Dean for Student Affairs, medical school
Board of Trustees member, county hospital system; Health economics professor
Chief Medical Officer, major health system
Dean, College of Science and Health Professions, university
Professor emeritus. medical school; Community Advisory Board Member
Executive Director, health and community development nonprofit research organization
Preventive Medicine physician and county health department liaison, major health system
GMB II (17)
Advocacy Coordinator, regional health care consumer advocacy organization
Assistant Dean for Community Engagement and Admissions, medical school
Board of Trustees member, county hospital system; Health economics professor
Chief Medical Officer, major health system
Chief Wellness Officer, FQHC
Dean, medical school
Director, urban physician training partnership program
Director of Multicultural Program, medical school
Director of Workforce Development, association of health centers
Economic research associate, university
Professor emeritus, medical school; Community Advisory Board Member
Executive Director, health and community development nonprofit research organization
Manager of Graduate Medical Education, major health system
Medical Student, medical school
Preventive Medicine physician and county health department liaison, major health system
Residency Director, hospital system
Senior Vice President of External Relations, major health system
GMB III (7)
Advocacy Coordinator, regional health care consumer advocacy organization
Assistant Dean for Student Affairs, medical school
Dean, medical school
Director, urban physician training partnership program
Executive in Residence, university; professor emeritus at medical school; Community Advisory
Board Member, urban physician training partnership program
Medical Student Coordinator, health system
Senior Instructor, health system; recent graduate of physician training pipeline
Staff, urban physician training partnership program