Local Area Personal Income Methodology
105
Local Area Personal Income Methodology November 2021 Table of Contents I. Introduction A Brief History Uses of the Local Area Estimates Place of Residence and Place of Measurement Relation of Personal Income in the NIPA and in the County Personal Income Accounts Industrial Classification Revisions to NAICS Descriptions changed from NAICS 2002 to NAICS 2007: Descriptions changed from NAICS 2007 to NAICS 2012: Geographic Detail FIPS Codes Per Capita Personal Income Farm Proprietors’ Income Employment Personal Income, Adjusted Gross Income, and Money Income Sources of the Data Preparation and Revision Schedule Release and Publication Schedule Tables Resources on BEA’s website Glossary Mapping of regional statistics Previously published estimates Statistical area delineations Coronavirus (COVID-19) Impact on Local Area Personal Income Estimates Table A. Relation of Personal Income in the NIPA and the Local Area Personal Income Accounts Table B. Regional Income and Employment Data Tables Available from the Bureau of Economic Analysis II. Compensation Wages and Salaries Wages and salaries in industries fully covered by the UI programs Adjustment for industry non-classification Adjustment for statewide reporting Adjustments for misreported wage and salary data Adjustments for federal civilian payrolls Adjustment for a component of state government payrolls
Transcript of Local Area Personal Income Methodology

Local Area Personal Income Methodology
November 2021
Table of Contents
I. Introduction A Brief History Uses of the Local Area Estimates Place of Residence and Place of Measurement Relation of Personal Income in the NIPA and in the County Personal Income Accounts Industrial Classification Revisions to NAICS Descriptions changed from NAICS 2002 to NAICS 2007: Descriptions changed from NAICS 2007 to NAICS 2012: Geographic Detail FIPS Codes Per Capita Personal Income Farm Proprietors’ Income Employment Personal Income, Adjusted Gross Income, and Money Income Sources of the Data Preparation and Revision Schedule Release and Publication Schedule Tables Resources on BEA’s website Glossary Mapping of regional statistics Previously published estimates Statistical area delineations Coronavirus (COVID-19) Impact on Local Area Personal Income Estimates Table A. Relation of Personal Income in the NIPA and the Local Area Personal Income Accounts Table B. Regional Income and Employment Data Tables Available from the Bureau of Economic Analysis II. Compensation Wages and Salaries Wages and salaries in industries fully covered by the UI programs Adjustment for industry non-classification Adjustment for statewide reporting Adjustments for misreported wage and salary data Adjustments for federal civilian payrolls Adjustment for a component of state government payrolls

November 2021 LOCAL AREA METHODOLOGY ii
II. Compensation (continued) Wages and salaries in industries not fully covered by the state UI programs
Farms Farm labor contractors Railroads Private elementary and secondary schools Religious organizations Private households Military Other adjustments Alternative measure of county wages Supplements to Wages and Salaries Employer Contributions for employee pension and insurance funds Pension plans and insurance funds Defined benefit and defined contribution plans Group health insurance plans Group life insurance plans Supplemental unemployment benefit plans Privately administered workers’ compensation plans Employer contributions for government social insurance Old-age, Survivors, and Disability Insurance (OASDI) and Hospital Insurance (HI) Railroad retirement and railroad employees’ unemployment insurance Unemployment Compensation for Federal Employees (UCFE) and Unemployment Compensation for Ex-Service Members (UCX) Military medical insurance and veterans’ life insurance Pension benefit guaranty Federal workers’ compensation State-administered workers’ compensation State-administered temporary disability insurance Table C. Compensation of Employees, by Component and by Industry, United
States, 2020 Table D. Relation of BEA Wages and Salaries to Wages as Published by the
Bureau of Labor Statistics, United States, 2020 Table E. Components of Supplements to Wages and Salaries, United States, 2020 III. Proprietors’ Income Nonfarm Proprietors’ Income Income of nonfarm sole proprietorships and partnerships Income of nonfarm tax-exempt cooperatives Farm Proprietors’ Income Farm gross receipts Farm production expenses Inventory change adjustment Adjustment to exclude the income of corporate farms Table F. Proprietors’ Income, by Industry, United States, 2020

November 2021 LOCAL AREA METHODOLOGY iii
IV. Dividends, Interest, and RentPersonal Dividend Income
Imputed receipt of dividend income from pension plans Other dividend income Personal Interest Income
Monetary interest income Imputed interest receipts from employee pension plans Imputed interest receipts from financial institutions and insurance companies
Rental Income of Persons Monetary rental income
Imputed rental income Mobile homes Permanent-site nonfarm dwellings Permanent-site farm dwellings
Table G. Components of Property Income, 2020
V. Personal Current Transfer Receipts
Current Transfer Receipts of Individuals from Governments Retirement and disability insurance benefits
Social Security benefits Railroad retirement and disability benefits Workers’ compensation Other government retirement and disability insurance benefits
Temporary disability benefits Black lung benefits Pension Benefit Guaranty benefits
Medical benefits Medicare benefits Medicaid benefits Other medical care benefits Military medical insurance benefits
Income maintenance benefits Supplemental Security Income (SSI) benefits Earned Income Tax Credit (EITC) Supplemental Nutritional Assistance Other income maintenance benefits
Family assistance General assistance benefits Foster care and adoption assistance Additional Child Tax Credit Energy Assistance Special Supplemental Nutrition for Women, Infants, and Children (WIC) benefits

November 2021 LOCAL AREA METHODOLOGY iv
V. Personal Current Transfer Receipts (continued) Unemployment insurance compensation State unemployment insurance compensation Unemployment Compensation of Federal Employees (UCFE) Unemployment compensation for railroad employees Unemployment Compensation for Veterans (UCX) Other unemployment compensation Trade adjustment assistance Redwood Park benefits Public service employment benefits Transitional benefits Veterans’ benefits Veterans’ pension and disability benefits Veterans’ readjustment benefits Veterans’ life insurance benefits Other assistance to veterans Education and training assistance Federal fellowship benefits Federal educational exchange benefits Interest on guaranteed student loans Higher education student assistance Job Corps benefits State educational assistance Other transfer receipts of individuals from governments Compensation of survivors of public safety officers Compensation of victims of crime Alaska Permanent Fund benefits Disaster relief benefits Radiation exposure compensation Japanese interns redress benefits Anti-terrorism judgment receipts Compensation of victims of September 11 Bureau of Indian Affairs benefits TV converter box coupons American Recovery and Reinvestment Act of 2009 (ARRA) Federal additional Compensation for unemployment ARRA COBRA premium reduction ARRA Economic Recovery lump sum ARRA Making Work Pay tax credit ARRA Government Retiree tax credit American Opportunity tax credit (AOTC) Home Affordable Mortgage Program principal reduction Temporary High-Risk Health Insurance premium reduction World Trade Center Health benefits Economic Stimulus Act of 2008 rebates Alternative Minimum Tax (AMT) credit Adoption tax credit

November 2021 LOCAL AREA METHODOLOGY v
V. Personal Current Transfer Receipts (continued) Health Coverage Tax Credit Health Insurance Premium Assistance Tax Credit Cost-Sharing Reduction Subsidy Health Benefits for Retired United Mine Workers of America Members Economic Impact Payments (EIP) Lost Wages Supplemental Payments Current Transfer Receipts of Nonprofit Institutions Receipts from the federal government Paycheck Protection Program loans Provider Relief Fund Other federal nonprofit payments Receipts from state and local governments Receipts from businesses Current Transfer Receipts of Individuals from Businesses BP oil spill settlement receipts Other transfer receipts of individuals from businesses Table H. Components of Personal Current Transfer Receipts, 2020 VI. Contributions for Government Social Insurance Employer Contributions for Government Social Insurance Employee and Self-employed Contributions for Government Social Insurance Table I. Components of Contributions for Government Social Insurance, 2020 VII. Residence Adjustment Net Residence Adjustment for Intercounty Commuting Flows Modifying the provisional estimates International Border Workers Inflows from and outflows to Canada and Mexico U.S. residents employed by certain foreign organizations VIII. Employment Introduction Employment estimates measure the number of jobs Treatment of part-time jobs Geography Temporal dimension Wage and Salary Employment Employment in industries fully covered by the UI programs Adjustment for industry non-classification Misreporting adjustment Adjustment for statewide reporting Geographic adjustments for government employment Employment in industries not fully covered by the state UI programs Farms

November 2021 LOCAL AREA METHODOLOGY vi
VIII. Employment (continued) Farm labor contractors Railroads Private elementary and secondary schools Religious organizations Private households Military Adjustments for noncovered segments of UI-covered industries Alternative measures of wage and salary employment Current Employment Statistics County Business Patterns Nonfarm Self-Employment National totals Sole proprietorships Partners State and county estimates Farm Self-Employment National and State Estimates (1969-2001) National and State Estimates (2002 forward) County Estimates Table J. Relation of BEA Wage & Salary Employment and BLS Total Employment IX. Technical Notes Allocation Procedures Dual Allocation Disclosure-Avoidance Procedures Geocoding Imputation Interpolation and Extrapolation Table K. Wages and salaries in thousands of dollars Table L. Employment and average wages Table M. Average wages in dollars Table N. Employment and wage approximations Table O. First approximation of wages for year 5 X. Appendix Concordance between BEA Line Codes and NAICS Industry Codes Concordance between BEA Line Codes and SIC Industry Codes BEA Regions BEA modifications to FIPS codes

I. INTRODUCTION This guide presents the conceptual framework, the data sources, and the statistical methods used by the Regional Income Division of the Bureau of Economic Analysis (BEA) to estimate personal income and employment for local areas, that is, for counties, metropolitan statistical areas, and other county aggregates. Personal income is the income received by, or on behalf of, all persons f rom all sources: from participation as laborers in production, from owning a home or business, from the ownership of financial assets, and from government and business in the form of transfers. It includes income from domestic sources as well as from the rest of the world. It does not include realized or unrealized capital gains or losses. Persons include individuals, nonprofit institutions that primarily serve individuals, private noninsured welfare funds, and private trust funds. Personal income for an area is the income received by, or on behalf of all persons resident in the area, regardless of the duration of residence, except for foreign nationals employed by their home governments in the United States. Alternatively, personal income can be defined as the sum of wages and salaries, supplements to wages and salaries, proprietors’ income, dividends, interest, and rent, and personal current transfer receipts, less contributions for government social insurance. Because the personal income of an area represents the income that is received by, or on behalf of, all the persons who live in that area, and because the estimates of the earnings component of personal income are made on a place-of-work basis, state and county personal income includes an adjustment for residence. The residence adjustment represents the net flow of compensation (less contributions for government social insurance) of intercounty commuters. The county estimates of personal income are conceptually and statistically consistent with the national estimates of personal income in the National Income and Product Accounts (NIPA). County estimates sum to state totals which, together with the estimate for the District of Columbia, sum to a national total which equals the NIPA estimate except for some small differences in the treatment of U.S. residents working abroad, the income of foreign residents working in the U.S., and the use of more current source data.
A Brief History In the mid-1930’s, BEA began work on the estimation of regional income as part of the effort to explain the processes and structure of the nation’s economy. As a result, it published annual state estimates of “income payments to individuals” in the April 1940 issue of the Survey of Current Business (Survey). These income payments were calculated as the sum of (1) wages and salaries, (2) other labor income and relief, (3) entrepreneurial withdrawals, and (4) dividends, interest, net rents, and royalties. During the 1940’s and early 1950’s, BEA developed an integrated set of national economic accounts, sought additional source data, and improved the methods used to prepare the estimates. One result of this work was the development of state personal

November 2021 LOCAL AREA METHODOLOGY
I-2
income—a measure that is more comprehensive than state income payments. Estimates of state personal income were first published in the September 1955 Survey. State personal income differs significantly from state income payments in five ways:
• State personal income consists of six major components (supplements to wages and salaries and personal current transfer receipts replaced other labor income and relief, and the component, contributions for government social insurance, was added as an explicit deduction);
• Personal income includes more component detail and a broader range of income-in-kind and imputed income items than state income payments;
• Personal income includes the income of nonprofit institutions that primarily serve individuals, private noninsured welfare funds, and private trust funds (collectively called quasi-individuals);
• Personal income includes employer contributions (both actual and imputed) to pension funds—as part of supplements to wages and salaries—instead of the benefits paid by the funds; and
• Personal income includes personal current transfer receipts from business. In addition, in the mid-1950’s, BEA began work on preparing estimates for local areas. It prepared estimates for a few counties in the states in the Mideast and Plains regions. In the late 1950’s, BEA developed estimates of state disposable personal income. This series was published occasionally in the Survey in the 1960’s and 1970’s and has been published annually beginning with 1982. During the 1960’s, BEA developed quarterly estimates of state personal income. The first set of these estimates as a continuous time series was published in the December 1966 issue of the Survey. In addition, BEA prepared a personal income series for metropolitan areas and for nonmetropolitan counties for selected years 1929-1962. In the early 1970’s, BEA developed estimates of personal income for counties in metropolitan areas. These estimates were published for the first time in the April 1975 Survey. Later in the 1970’s it developed estimates of employment for states, counties, and metropolitan areas. In the 1980’s, BEA developed estimates of gross domestic product (GDP) by state and industry. These estimates were first published in the May 1988 Survey, as gross state product. In the 2000’s, BEA began researching inter-area price levels. The research culminated in the release in 2013 of regional price parities and real personal income estimates by state and metropolitan area. In 2014, BEA developed prototype estimates of quarterly GDP by state for 2005-2013, and prototype estimates of personal consumption expenditures (PCE) by state f or 1997-2012. In 2018, BEA developed prototype estimates of GDP by county for 2012-2015. Now, BEA prepares annual and quarterly estimates of state personal income and GDP, and annual estimates of state disposable personal income, personal consumption

November 2021 Introduction
I-3
expenditures, and employment. It also prepares annual estimates of personal income, employment, and GDP for all metropolitan areas and counties.
Uses of the Local Area Estimates The local area estimates of personal income and its components, per capita personal income, employment, and GDP by county are widely used by both the public and the private sectors to measure and track economic well-being over time and to make comparisons across counties and metropolitan areas in the level and composition of economic activity and the value added by an area’s industries. These estimates provide a framework for the analysis of local area economies, and they serve as a basis for decision making. Federal agencies use these estimates in econometric models, such as those used to project energy and water use. They also use the estimates as a basis for allocating f unds and for determining matching grants. For example, in fiscal year 2018, $499.8 billion in federal funds were distributed based on BEA’s state and local personal income and GDP statistics. State governments use the estimates of personal income and GDP to measure the economic base of planning areas. They also use the estimates in econometric models for various planning purposes and to project tax revenue and the need for public utilities and services.
University schools of business and economics use the estimates for theoretical and applied economic research. Some of these schools distribute the estimates in abstracts or similar reports to various state and local government agencies, regional councils of governments, private research groups, businesses, and libraries. Economic development associations use the estimates in their analytical studies to present economic growth opportunities in localities to businesses. Businesses use the estimates for planning activities, such as evaluating markets for new or established products and determining areas for the location, expansion, and contraction of their activities.
Place of Residence and Place of Measurement In regional economic accounts, income can be recorded by place of production (where earned) or by place of residence (where received). Since personal income is a measure of the income received by persons, the estimates of state and county personal income reflect the residence of the recipients. Income as recorded in the data sources used to estimate personal income, however, is not always recorded by place of residence. The concept of place used by the data sources varies by component of income. The methods used to adjust the source data to a place-of-residence basis, if that is necessary, are described in detail in the following chapters. 0 F
1
1 The concept of place of residence for nonprofit institutions serving households, private noninsured welfare funds, and private trust funds entails difficulties beyond those encountered for individuals. In some

November 2021 LOCAL AREA METHODOLOGY
I-4
The estimates of wages and salaries, employer contributions for employee pension and insurance funds, and contributions for government social insurance (by employers and employees) are mainly based on source data that are reported by place of work. 1 F
2 These data are reported by industry in the state and county in which the employing establishment is located. The residence adjustment of these data is discussed in chapter VII. The estimates of nonfarm proprietors’ income and the estimates for contributions for government social insurance by the self-employed are based on source data that are reported by place of filing, that is, the tax-filing address of the recipient. This address is often that of the proprietor’s residence; therefore, these data are treated as if they were reported by place of residence. The estimates of farm proprietors’ income are based on data that are reported by the principal place of production, which is usually the county in which the farm has most of its land and in which most of the work is performed. Because most f arm proprietors live on, or near, their land, the place of production is treated as if it were the same as the place of residence. The estimates of monetary dividend and interest income are based on federal income tax data sources that are compiled by the tax filing address of the recipient. The source data for the dividend and interest income of pension plans imputed to participants in the plans do not adequately report the place of residence of the participants. The national controls are divided into portions for currently-employed and retired participants and then allocated to states and counties using separate geographic indicators. The portion imputed to currently employed participants is allocated to states and counties based on wages and salaries adjusted to a place of residence basis. The portion imputed to retirees and other beneficiaries is allocated to states and counties based on indicators such as pension benefit payments by place of residence. The estimates of rental income of persons are based on place of residence data from the American Community Survey. The estimates of current transfer receipts of individuals from governments are based on source data that are generally reported by the place of residence of the income recipient. However, the source data for the estimates of state unemployment insurance compensation and workers’ compensation from state-administered funds are based on source data reported by the state that pays the compensation. BEA adjusts these payments data to reflect the residence of the recipient.
cases, a separate national control total for their income may not exist. In other cases, the place in which their income is recorded in the source data is not adequate for the purposes of state personal income. In general, their income is allocated along with similar types of income received by individuals. 2 The estimates of personal contributions for supplementary medical insurance and for veterans’ life insurance are based on source data that are reported by place of residence.

November 2021 Introduction
I-5
Relation of Personal Income in the NIPA and in the County Personal Income Accounts
The level of U.S. personal income in the national income and product accounts (NIPAs) differs slightly from the national total in the county personal income accounts because of differences in coverage and in timing of the availability of source data (table A). The differences in coverage stem from different concepts of residence. For county personal income, residents include all persons who reside in a county, regardless of the duration of residence, except for foreign nationals employed by their home governments in the United States. For NIPA personal income, a U.S. resident has a center of economic interest in the United States and resides, or expects to reside, in the United States for a year or more. In addition, U.S. residents include all U.S. citizens who reside outside the United States for less than 1 year and U.S. citizens residing abroad for 1 year or more who meet one of the following criteria: Owners or employees of U.S. business enterprises who reside abroad to further the enterprises’ business and who intend to return within a reasonable period; U.S. Government civilian and military employees and members of their immediate families; and students who attend foreign educational institutions. Foreign residents are those persons residing and pursuing economic interests outside the United States and foreign nationals employed by their home governments in the United States. In general, the NIPA measure of personal income is broader than county personal income.
• NIPA personal income includes the earnings of federal civilian and military personnel stationed abroad and the property income received by the federal pension plans of these workers. The regional measure of personal income does not include this income.
• NIPA personal income includes all income earned by U.S. citizens living abroad for less than a year. County personal income excludes the portion earned while individuals live abroad.
• NIPA personal income includes the income of foreign nationals only if they live and work in the United States for a year or more. County personal income includes the income of resident foreign nationals working in the United States—including migrant workers—regardless of length of residency.
Both NIPA and county personal income: • Include the wages and salaries of U.S. citizens employed by international
organizations and foreign embassies and consulates located within the geographic borders of the United States.
• Include the wages and salaries of foreign nationals residing in the United States for a year or more and working at international organizations located in the United States.
• Exclude the income of foreign nationals employed by their home governments in the United States.
• Exclude the income of private U.S. citizens living outside the country f or a year or more.

November 2021 LOCAL AREA METHODOLOGY
I-6
The annual estimates of personal income in the NIPAs also diverge from the national totals of county personal income because of differences in the timing of the availability of source data. Some data that were not available when the NIPA estimates were prepared may become available afterwards when county personal income is estimated.
Industrial Classification Up through 2000, the Standard Industrial Classification (SIC) was used (with some slight modifications) for the industrial classification of private industry wages and salaries, compensation, earnings, and employment. The Standard Industrial Classification Manual, 1967 was used for the years 1969-1974, the 1972 Manual was used for the years 1975-1987, and the 1987 Manual was used for 1988-2000 for states and 1988-2000 for counties. 2 F
3 Since 2001, the North American Industry Classification System (NAICS), with some slight modifications, has been used for the private sector. 3 F
4 The 2002 edition of NAICS was used for the years 2001-2006, the 2007 edition was used for the years 2007-2010, the 2012 edition is used for the years 2012-2016, and the 2017 edition is used f or subsequent years. In addition, BEA converted state earnings and employment estimates that were originally compiled on a SIC basis to a NAICS basis for 1998-2000 to provide users with a longer time series on the current industrial classification system. The introduction of a new edition of the classification system can potentially break the consistency of the time series estimates for an industry. Fortunately, for the industries for which BEA publishes regional income and employment statistics, only a few industries, listed below, are potentially affected by the revisions to NAICS. For the public sector, the income and employment are classified by level of government—federal, state, and local. The estimates for the federal government are sub classified into civilian and military. The different treatment of the private and public sectors means that BEA's state and local government industry includes public education, public hospitals, and other types of government services while BEA reports only private schools in its educational services industry corresponding to the 3-digit NAICS industry 611 and only private hospitals in its hospitals industry corresponding to industry 622. Concordances between the line codes and industry names used by BEA and those in the NAICS and SIC manuals are presented in an appendix.
3 Executive Office of the President, Office of Management and Budget, Statistical Policy Division, Standard Industrial Classification Manual, 1967 (Washington, DC: U.S. Government Prin t ing Of f ice (GPO), 1967); Manual, 1972 (GPO, 1972); Manual, 1987 (GPO, 1987). 4 Office of Management and Budget: North American Industry Classification System, United States, 2002 (Lanham, MD: Bernan Press, 2002), Office of Management and Budget: North American Industry Classification System, United States, 2007 (Lanham, MD: Bernan Press, 2007) and Office of Management and Budget: North American Industry Classification System, United States, 2012 (Lanham, MD: Bernan Press, 2012).

November 2021 Introduction
I-7
Revisions to NAICS Of the industries BEA publishes in its regional personal income and employment statistics, the following are potentially affected by revisions to the North American Industry Classification System (NAICS). Descriptions changed from NAICS 2002 to NAICS 2007: 321,327-339 Durable goods manufacturing 333 Machinery manufacturing 3364-3369 Other transportation equipment manufacturing 337 Furniture and related product manufacturing 339 Miscellaneous manufacturing 311-316,322-326 Nondurable goods manufacturing 314 Textile product mills 315 Apparel manufacturing 326 Plastics and rubber products manufacturing 516 Internet publishing and broadcasts 517 Telecommunications 518 ISPs, search portals, and data processing 519 Other information services 52 Finance and insurance 525 Funds, trusts, and other financial vehicles 53 Real estate and rental and leasing 531 Real estate 54 Professional and technical services 56 Administrative and waste services Descriptions changed from NAICS 2007 to NAICS 2012: 321 Wood product manufacturing 337 Furniture and related product manufacturing 443 Electronics and appliance stores 451 Sporting goods, hobby, book and music stores There were no changes in descriptions from NAICS 2012 to NAICS 2017.
Geographic Detail BEA publishes local area personal income and employment for counties, micropolitan statistical areas, metropolitan statistical areas (MSAs), metropolitan divisions (parts of MSAs), combined statistical areas, states, and the metropolitan and nonmetropolitan portions of states. Counties consist of counties and county equivalents, such as the parishes of Louisiana, the boroughs, municipalities and Census areas of Alaska, the District of Columbia, and the independent cities of Maryland, Missouri, Nevada, and Virginia. The estimates for Kalawao County, Hawaii and the small

November 2021 LOCAL AREA METHODOLOGY
I-8
independent cities of Virginia—generally those with fewer than 100,000 residents—are combined with estimates for adjacent counties.
Statistical areas (micropolitan, metropolitan, and combined) and metropolitan divisions are defined (geographically delineated) by the Office of Management and Budget and the definitions are updated as new information warrants. 4 F
5 The local area personal income and employment estimates for these areas are based on the definitions in the Office of Management and Budget Bulletin No. 20-01 issued March 6, 2020.5 F
6 When OMB adds a new statistical area, BEA creates a time series for it starting in 1969 even though it may not have had any urban area at the time. Similarly, when OMB changes the definition of a statistical area, BEA recreates the time series for that area, using the same definition (the new one) for every year in the time series. For example, when OMB f irst defined the Gainesville, FL MSA it consisted of the single county of Alachua. The current definition of the Gainesville, FL MSA consists of Alachua and Gilchrist counties. BEA’s estimates of personal income and employment for the Gainesville, FL MSA also consist of the same two counties every year from 1969 to the present. A micropolitan statistical area is an area consisting of a core county or counties in which lies an urban area having a population of 10,000 but less than 50,000, plus adjacent counties having a high degree of social and economic integration with the core counties as measured through commuting ties. 6 F
7 A metropolitan statistical area is an area consisting of a core county or counties in which lies an urban area having a population of at least 50,000, plus adjacent counties having a high degree of social and economic integration with the core counties as measured through commuting ties. A metropolitan division is a county or group of counties within a metropolitan statistical area that contains an urban area with a population of at least 2.5 million. A combined statistical area consists of two or more adjacent metropolitan or micropolitan statistical areas that have social and economic ties as measured by commuting, but at lower levels than are found among counties within metropolitan and micropolitan statistical areas. The metropolitan portion of a state consists of all counties that are parts of metropolitan statistical areas. The nonmetropolitan portion of a state consists of all counties that are outside of metropolitan statistical areas.
5 See 2010 Standards for Delineating Metropolitan and Micropolitan Statistical Areas published in the Federal Register, Vol. 75, No. 123, June 28, 2010, pp. 37245-37252, and a correction published in the Federal Register, Vol. 75 No. 129, July 7, 2010, p. 39052. 6 http://www.whitehouse.gov/omb/information-for-agencies/bulletins/#2020 7 Micropolitan statistical areas, metropolitan statistical areas, metropolitan divisions, and combined statistical areas are defined by the Office of Management and Budget. See the Federal Register, Vol. 75 , No. 123, June 28, 2010 pp. 37245-37252 and Office of Management a nd Budget Bul letin No . 13-01 February 28, 2013.

November 2021 Introduction
I-9
FIPS Codes BEA uses Federal Information Processing Standards (FIPS) codes to uniquely identify states, MSAs, and counties with the following modifications (see the Appendix for further details):
• Kalawao County, Hawaii is combined with Maui County and the combined area is designated 901. (Kalawao does not have its own local government; it is administered by the State of Hawaii.)
• The independent cities of Virginia with populations of less than 100,000 have been combined with an adjacent county and given codes starting at 901. In the name of the combined area, the county name appears first and is followed by the city name(s).
• The metropolitan portion of each state is designated 998 and the nonmetropolitan portion is designated 999.
Over time some important changes have occurred:
• Alaska o Estimates up to and including 1978 reflect Alaska Census Divisions as
defined in the 1970 Decennial Census. o Estimates for 1979 forward reflect Alaska Census Areas as defined by the
Census Bureau o Estimates for 1988 forward separate Aleutian Islands Census Area into
Aleutians East Borough and Aleutians West Census Area. o Estimates for 1991 forward separate Denali Borough from Yukon-
Koyukuk Census Area and Lake and Peninsula Borough from Dillingham Census Area.
o Estimates from 1993 forward separate Skagway-Yakutat-Angoon Census Area into Skagway-Hoonah-Angoon Census Area and Yakutat Borough.
o Estimates for 2008 forward separate Skagway-Hoonah-Angoon Census Area into Hoonah-Angoon Census Area and Skagway Municipality.
o Estimates for 2009 forward (a) separate Wrangell-Petersburg Census Area into Petersburg Census Area and Wrangell City and Borough, and (b) transfer a part of Prince of Wales-Outer Ketchikan Census Area to Ketchikan Gateway Borough, transfer a part (Meyers Chuck Area) to the new Wrangell City and Borough, and rename the remainder Prince of Wales-Hyder Census Area.
o Estimates for 2013 forward separate most of the Petersburg Census Area and a small portion of the Hoonah-Angoon Census Area into Petersburg Borough. The remainder of the Petersburg Census Area was transferred to the Prince of Wales-Hyder Census Area. Petersburg Borough retains the same federal information processing standards (FIPS) code as the f ormer Petersburg Census Area, creating a break in the time series between 2012 and 2013.
o Estimates for 2020 forward separate Valdez-Cordova Census Area into Chugach Census Area and Copper River Census Area.

November 2021 LOCAL AREA METHODOLOGY
I-10
• La Paz County, Arizona was separated from Yuma County on January 1, 1983. The Yuma MSA contains the area that became La Paz County through 1982 and excludes it beginning with 1983.
• Cibola County, New Mexico was separated from Valencia County in June 1981, but data for Valencia includes Cibola through the end of 1981.
• Menominee County, Wisconsin was formed as a new county from Oconto and Shawano counties in 1961. However, since a large part of Menominee is an Indian reservation and there was little economic activity in the county, estimates of Menominee are combined with Shawano County through 1988 and the combined area designated 901. Separate estimates for Menominee and Shawano Counties begin in 1989.
• Broomfield County, Colorado was created from parts of Adams, Boulder, Jefferson, and Weld counties effective November 15, 2001. Estimates for Broomfield County begin with 2002. The Denver-Aurora-Lakewood, CO MSA contains the parts of Boulder and Weld counties that became Broomfield County beginning with 2002. (Since Adams, Jefferson, and Broomfield counties are in the Denver-Aurora, CO MSA, the transfer of parts of Adams and Jefferson to Broomfield had no effect on the MSA estimates.) The estimates for Boulder, CO, MSA include the part of Boulder County that was separated to form Broomfield County through 2001 and the estimates for Greeley, CO MSA include that part of Weld County that was separated to form Broomfield County through 2001.
Per Capita Personal Income Per capita personal income is calculated as the personal income of the residents of a given area divided by the resident population of that area. In computing annual per capita personal income for states and counties, BEA uses the Census Bureau’s annual midyear (July 1) population estimates. For quarterly estimates of per capita income f or states BEA uses mid-quarter population estimates based on unpublished Census Bureau data. Local area per capita personal income estimates should be used with caution for several reasons. In some instances, an unusually high or low per capita personal income is the temporary result of unusual conditions, such as a bumper crop or hurricane. In other instances, the income levels of certain groups atypical of the resident population may cause a longer term high or low per capita personal income that is not indicative of the economic well-being of the area. For instance, a major construction project—such as a defense facility, power plant, or dam—may substantially raise the per capita personal income of an area for several years because it attracts highly paid workers whose incomes are measured at the construction site.7 F
8 This high per capita income may not be indicative of the economic well-being of the permanent residents of the area (or, in many cases, of the construction workers themselves, because they frequently send a substantial portion of their wages to their dependents living in other areas).
8 Typically, construction wages and employment are measured at the home office, not the construction site. Exceptions are made for major construction projects.

November 2021 Introduction
I-11
Conversely, the presence of a large institutional population—such as that of a college or a prison—will tend to keep the per capita personal income of an area at a lower level because the residents of these institutions have little income attributable to them at these institutions. This lower per capita personal income is not indicative of the economic well-being of the other residents of the area (or, in some cases, of the institutional populations, because some of these populations, such as college students, typically receive support from their families living in other areas). The per capita personal income estimates can also be misleading in areas where population changes rapidly. Population is measured at midyear, whereas income is measured as a flow over the year; therefore, a significant change in the population of an area during the year, particularly if it occurs around midyear, can cause a distortion in the per capita personal income estimates. In counties where farm income predominates, additional considerations should be considered.
Farm Proprietors’ Income
Farm proprietors’ income as measured for personal income reflects returns from current production; it does not measure current cash flows. Sales out of inventories are included in current gross farm income, but they are excluded from net farm income because they represent income from a previous year’s production. Additions to inventories are included in net farm income at current market prices; therefore, f armers’ attempts to regulate their cash flows by adjusting inventories are not reflected in BEA’s farm proprietors’ income estimates. However, this regulation of cash f lows by f armers extends their earnings cycles, so it helps them to survive losses or lowered income f or 2 or 3 years. In addition, the per capita personal income of sparsely populated areas that are dependent on farming will react more sharply to the vagaries of weather, world market demand, and changing government policies related to agriculture than that of areas where the sources of income are more diversified.
Employment BEA gives equal weight to full-time and part time jobs in its estimates of employment. Wage and salary jobs and proprietors’ jobs are counted, but unpaid f amily workers and volunteers are not. Proprietors’ employment consists of the number of sole proprietorships and the number of general partners. Wage and salary employment is on a place-of-work basis. Proprietors’ employment, however, is more nearly by place of residence because, for nonfarm sole proprietorships, the estimates are based on IRS tax data that reflect the addresses from which the proprietors’ individual tax returns are filed, which are usually the proprietors’ residences. Nonfarm partnership employment ref lects the tax-filing address of the partnership, which may be either the residence of one of the partners or the business address of the partnership. Farm proprietors’ employment is a count of operators running sole proprietorship and partnership farms estimated from U.S. Department of Agriculture data. The residence and place of work of farm proprietors’ employment is assumed to be the same—the county in which most of farmland is located.
November 2021 LOCAL AREA METHODOLOGY
I-12
The employment estimates are designed to be consistent with the estimates of wages and salaries, proprietors’ income, and earnings. The employment estimates are based on the same sets of source data as the corresponding earnings estimates and are prepared with parallel methodologies. However, two components of proprietors’ income—the income of limited partnerships and the income of tax-exempt cooperatives—have no corresponding employment estimates.
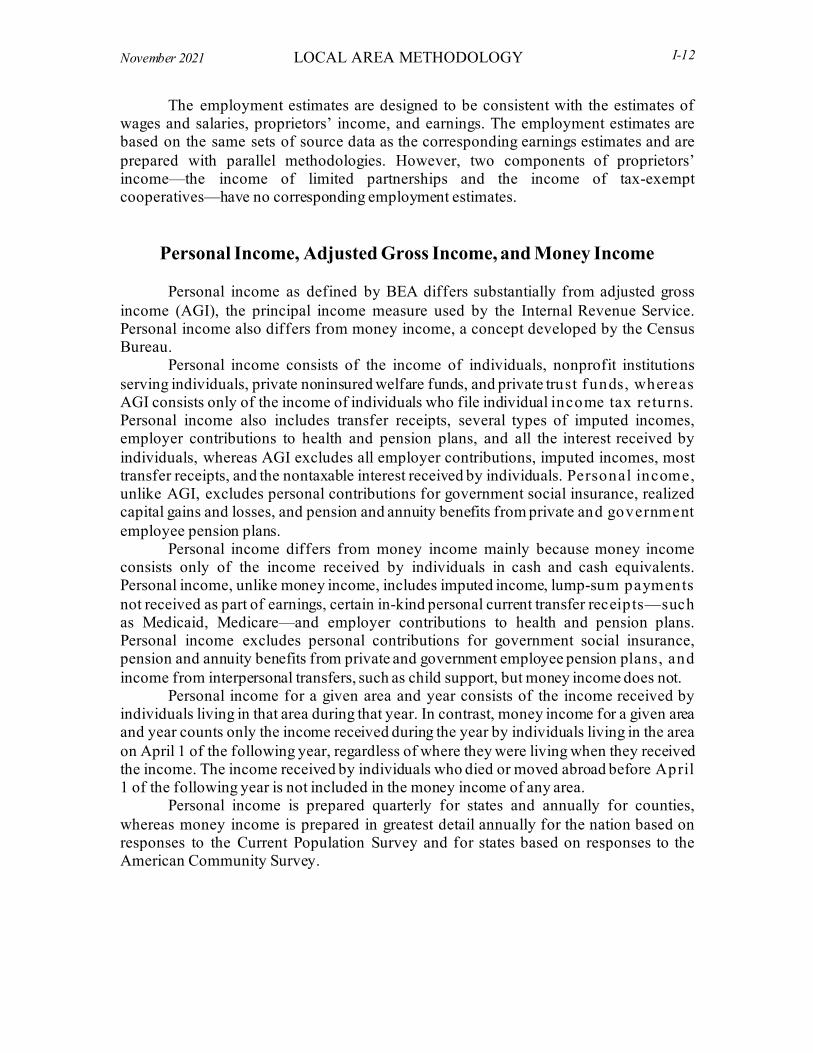
Personal Income, Adjusted Gross Income, and Money Income
Personal income as defined by BEA differs substantially from adjusted gross income (AGI), the principal income measure used by the Internal Revenue Service. Personal income also differs from money income, a concept developed by the Census Bureau. Personal income consists of the income of individuals, nonprofit institutions serving individuals, private noninsured welfare funds, and private trust f unds, whereas AGI consists only of the income of individuals who file individual income tax returns. Personal income also includes transfer receipts, several types of imputed incomes, employer contributions to health and pension plans, and all the interest received by individuals, whereas AGI excludes all employer contributions, imputed incomes, most transfer receipts, and the nontaxable interest received by individuals. Personal income, unlike AGI, excludes personal contributions for government social insurance, realized capital gains and losses, and pension and annuity benefits from private and government employee pension plans. Personal income differs from money income mainly because money income consists only of the income received by individuals in cash and cash equivalents. Personal income, unlike money income, includes imputed income, lump-sum payments not received as part of earnings, certain in-kind personal current transfer receipts—such as Medicaid, Medicare—and employer contributions to health and pension plans. Personal income excludes personal contributions for government social insurance, pension and annuity benefits from private and government employee pension plans, and income from interpersonal transfers, such as child support, but money income does not. Personal income for a given area and year consists of the income received by individuals living in that area during that year. In contrast, money income for a given area and year counts only the income received during the year by individuals living in the area on April 1 of the following year, regardless of where they were living when they received the income. The income received by individuals who died or moved abroad before April 1 of the following year is not included in the money income of any area. Personal income is prepared quarterly for states and annually for counties, whereas money income is prepared in greatest detail annually for the nation based on responses to the Current Population Survey and for states based on responses to the American Community Survey.
November 2021 Introduction
I-13
Sources of the Data The state and county personal income and employment estimates are based primarily on administrative-records data. In addition, some survey and census data are used. The administrative records data are a byproduct of the administration of various federal and state government social insurance programs and tax codes. They may originate either from the recipients of the income or from the payer of the income. Some of the more important of these programs and taxes (and the agencies compiling the data) are:
• State unemployment insurance programs (Bureau of Labor Statistics, U.S. Department of Labor)
• State Medicaid programs and the federal Medicare program (Centers for Medicare and Medicaid Services, U.S. Department of Health and Human Services)
• Social Security (Social Security Administration) • Federal veterans’ programs (U.S. Department of Veterans Affairs) • State and federal income tax codes (Internal Revenue Service, U.S. Department of
the Treasury and Bureau of the Census, U.S. Department of Commerce) The census data are mainly collected from the recipients of the income. The most important sources of census data for the personal income and employment estimates are the Census of Population and Housing, conducted by the Bureau of the Census every ten years and the Census of Agriculture, conducted by the U.S. Department of Agriculture (USDA) every five years. The survey data are collected from both the payers and the recipients of the income. The more important surveys include the Annual Survey of Public Pensions and the American Community Survey conducted by the Census Bureau and the monthly Current Employment Statistics survey conducted by the Bureau of Labor Statistics. The estimates of farm proprietors’ income rely principally on the USDA’s estimates of the income of all farms. The USDA uses sample surveys along with census data and administrative-records data to develop its estimates. The estimates of military compensation and employment rely principally on tabulations of data provided by the U.S. Department of Defense. Using administrative records data and census data to measure local area personal income has both advantages and disadvantages. By using these data, BEA can prepare detailed annual and quarterly estimates at a relatively low cost and without increasing the reporting burden on businesses and households. However, because the source data often do not precisely match the concept being estimated, they must be adjusted to compensate for differences in definitions, coverage, timing, and geographic detail.
Preparation and Revision Schedule The local area personal income estimates are released and then revised on a regular schedule to incorporate source data that are more complete, more detailed, or otherwise more appropriate than the data which were available when the estimates were initially prepared. They are also revised to keep them consistent with revisions to
November 2021 LOCAL AREA METHODOLOGY
I-14
personal income estimates in the National Income and Product Accounts (NIPA), to which they are controlled. Personal income estimates are first prepared for the nation and then for states. Lastly, they are prepared for counties, metropolitan statistical areas (MSAs), and other local areas that are combinations of counties. Quarterly estimates of state personal income are prepared about three months after the end of the quarter. The preliminary annual state estimates are prepared about three months after the end of the year, and the revised state estimates are prepared about nine months after the end of the year. The annual estimates of local area personal income are prepared about 11 months after the end of the year. In March of each year, the state estimates for the fourth quarter of the previous year are prepared, and the estimates for the first three quarters are revised; the preliminary annual state estimates for the previous year are prepared by averaging these quarterly estimates. 8 F
9 In June, the state estimates for the first quarter of the current year are prepared, and the estimates for the four quarters of the previous year are revised. In September, the annual state estimates for the previous year are revised using the annual, rather than the quarterly, methodology, and the annual estimates f or the two years before that are revised. The annual estimates are based on administrative and survey data and replace previously reported estimates of total taxes, total transfers, and total farm proprietors’ income that relied on extrapolations of past trends. Annual estimates by industry are prepared in greater detail—for 3-digit NAICS industries—than the quarterly estimates, which are prepared for 2-digit industries. Estimates of transfer receipts by major program, tax payments by level of government, employment by industry, and detailed farm income and expenses for the previous year are prepared. With the same release, the state estimates for the second quarter of the current year are prepared, and the estimates for the first quarter are revised. Furthermore, the estimates for the quarters of the previous five years are revised for consistency with the revised annual estimates. In November of each year, the estimates of local area personal income for the previous year are prepared, and the estimates for the four years before that are revised. In December, the estimates of state personal income for the third quarter of the current year are prepared, and the estimates of the first and second quarters are revised. Aside from this schedule, the state and local area estimates are normally revised again only after a comprehensive, or benchmark, revision of the NIPA. Comprehensive revisions of the NIPA are made approximately every four or five years. 9 F
10 In a comprehensive NIPA revision, the national estimates of personal income are affected by statistical changes that result from the introduction of new source data and the use of improved estimating methods. The national estimates may also be affected by changes in definitions and classifications that are made so that the NIPA will ref lect the
9 Revisions to the quarterly state personal income estimates in general reflect only revisions to NIPA controls and updated seasonal factors. 10 For the results of the latest comprehensive revision of the NIPA, see Robert Kornfeld, “Initial Results o f the 2013 Comprehensive Revision of the National Income and Product Accounts,” Survey o f Curren t Business 93 (August 2013): 6-17.

November 2021 Introduction
I-15
evolving economy of the United States. 1 0 F
11 For example, as part of the 2017 comprehensive update, measures of normal cost for state and local government defined benefit pension plans are now based on the projected benefit obligation (PBO) method rather than on the accumulated benefit obligation (ABO) method. The state estimates of employers’ normal cost for 2000 to the present are prepared in the same manner and with the same source data as the NIPA estimate. 1 1 F
12
Release and Publication Schedule
The annual estimates of local area personal income and related news releases that provide brief commentary and summary data tables on the statistics are first released on BEA’s Web site at www.bea.gov. By visiting the site, data users can also subscribe to receive free e-mail alerts of BEA releases and announcements. The release dates are announced in advance and are listed on the Web site. Further commentary on the personal income estimates, including discussions of special factors and revisions that affect the statistics, is published in the December issue of the Survey of Current Business, which is only available in an electronic format on BEA’s Web site. Detailed data tables are no longer published by BEA in the Survey . Go to https://apps.bea.gov/iTable/index_regional.cfm to access interactively the complete set of personal income and employment estimates for local areas. In addition, an archive of previously published news releases and historical data that have since been revised by BEA is available. For more information, call BEA at 301-278-9321 or e-mail [email protected].
Tables The local area personal income data are organized in a set of tables and are available online (table B). The tables contain data for counties, metropolitan statistical areas, micropolitan statistical areas, combined statistical areas, metropolitan divisions, state metropolitan/nonmetropolitan portions, states, the District of Columbia, the eight BEA regions, and the United States. 1 2 F
13 The local area personal income statistics incorporate the results of the annual revision to the National Income and Product Accounts (NIPA) released in July 2021
11 See “Preview of the 2018 Comprehensive Update of the National Income and Product Accounts: Changes in Definitions and Presentations,” Survey of Current Business 98 (April 2018). 12 See “Preview of the 2018 Comprehensive Update of the Regional Economic Accounts,” Survey of Current Business 98 (August 2018). 13 See the list of BEA regions with their constituent states in Chapter X Appendix.
November 2021 LOCAL AREA METHODOLOGY I-16
Resources on BEA’s website
A wide range of resources are available on BEA’s website to assist people in using and understanding its regional statistics. These resources include:
• Glossary—Glossary terms related to state personal income and employmentstatistics are available on BEA’s website. Go tohttps://apps.bea.gov/regional/definitions to access the definitions of these terms.
• Mapping of regional statistics—This interactive tool allows users to create maps using regional personal income and employment statistics. Go tohttps://apps.bea.gov/iTable/index_regional.cfm and click on “Begin mapping thedata…” to access this interactive tool.
• Previously published estimates—This archive contains the Regional Accountsdata that were published at the time of the previous Regional Accounts data newsreleases. They are for research only. Go to https://apps.bea.gov/regional/histdatato access this archive data.
• Statistical area delineations—Descriptions of the counties included inmetropolitan and micropolitan statistical areas are available on BEA’s website.Go to https://apps.bea.gov/regional/docs/msalist.cfm to access these geographies.
Coronavirus (COVID-19) Impact on Local Area Personal Income Estimates
The 2020 annual estimates of local area personal income were impacted by the response to the spread of COVID-19, as governments issued and lifted "stay-at-home" orders, and government pandemic assistance payments were distributed to households (economic impact payments and expanded unemployment benefits) and businesses (Paycheck Protection Program loans). The full economic effects of the COVID-19 pandemic cannot be quantified in the local area personal income estimates because the impacts are generally embedded in source data and cannot be separately identified. Information on COVID-19 and recovery impacts is available at https://www.bea.gov/recovery.

2018 2019 2020Personal income, NIPA's 17,706.0 18,424.4 19,627.6
Plus adjustments for: Coverage differences... -21.6 -22.8 -27.9 Federal workers abroad... -35.3 -38.0 -39.5 Wage and salary disbursements… -24.0 -25.6 -26.3 Supplements to wages and salaries/1/ -7.7 -8.5 -9.1 Dividends, interest, and rent /2/ -6.0 -6.5 -6.7 Less: Personal contributions for social insurance… -2.4 -2.6 -2.6
Rest-of-the-world difference. 13.7 15.2 11.6 Wages of private foreign nationals in U.S. 15.1 16.7 12.9 Wages of private U.S. residents abroad -1.4 -1.5 -1.3
Use of more current source data... -2.0 1.7 9.1 Wage and salary disbursements... 0.0 0.0 0.0 Farm proprietors' income... -2.0 1.7 9.1 Personal current transfer receipts <0.1 <0.1 <0.1
Statistical discrepancy /3/ -1.2 -1.3 -1.4
Equals: State personal income... 17,681.2 18,402.0 19,607.4
3. Includes revisions made in the NIPAs that are not yet reflected in State Personal Income concerning wages of border workers and foreign nationals working for international organizations.4. State personal income was released September 23, 2021.
Table A. Relation of Personal Income in the NIPA and the State Personal Income Accounts[Billions of dollars]
1. Employer contributions for government social insurance and for employee pension and insurance funds for Federal workers stationed abroad.2. Investment income received by Federal retirement plans that is attributed to Federal workers stationed abroad.

Time series Time lagLocal Area Annual Series
Personal Income Summary: Personal Income, Population, Per Capita Personal Income (CAINC1) 1969-2020 11 months
Personal Income and Employment by Major Component (CAINC4) 1969-2020 11 months
Personal Income by Major Component and ….. Earnings by NAICS Industry (CAINC5N) 2001-2020 11 monthsEarnings by SIC Industry (CAINC5S) 1969-2000 *
Compensation of Employees….. by NAICS Industry (CAINC6N) 2001-2020 11 monthsby SIC Industry (CAINC6S) 1969-2000 *
Total Full-Time and Part-Time Employment….. by NAICS Industry (CAEMP25N) 2001-2020 11 months by SIC Industry (CAEMP25S) 1969-2000 * Economic Profile (CAINC30) 1969-2020 11 months Personal Current Transfer Receipts (CAINC35) 1969-2020 11 months Farm Income and Expenses (CAINC45) 1969-2020 11 months Gross Flow of Earnings (CAINC91) 1969-2020 11 months BEA Regional Fact Sheets (BEARFACTS) 2020 11 months
* Data revisions in these tables are incorporated during flexible annual and comprehensive revisions only.NAICS North American Industry Classification SystemSIC Standard Industrial Classification
Table B.--Regional Income and Employment Data Tables Available from the Bureau of Economic AnalysisTable
(Available for United States, Regions, and States, Counties, Metropolitan Areas, Combined Statistical Areas, Metropolitan Divisions, and State Metro/Nonmetro Portions)

II. COMPENSATION Compensation is the income received by employees as remuneration for their
work. Compensation is the sum of wages and salaries and supplements to wages and salaries. Supplements to wages and salaries are the sum of employer contributions for government social insurance and employer contributions for employee pension and insurance funds. Compensation is reported by place of work. For comparison, compensation is 58.9 percent of total personal income at the national level in 2020 (table C).
The sources of data and the methods that are used to prepare the compensation estimates are described in two sections: wages and salaries and supplements to wages and salaries.
Wages and Salaries
Wages and salaries are broadly defined to include commissions, tips, and bonuses; voluntary employee contributions to deferred compensation plans, such as 401(k) plans; employee gains from exercising stock options; and receipts-in-kind that represent income. Wages and salaries are measured before deductions, such as social security contributions, union dues, and voluntary employee contributions to defined contribution pension plans. They represent the amount of wages and salaries accrued during the year. The estimates are prepared, with a few exceptions, at the North American Industry Classification System (NAICS) three-digit industry level. 0 F
1 Wages and salaries accounted for almost 48.1 percent of total personal income at the national level in 2020 (table C). The national, state and county estimates of wages and salaries are based primarily on the Quarterly Census of Employment and Wages (QCEW) data that originate from the state unemployment insurance (UI) system, and from the UI program for federal civilian employees. These data are assembled by the Bureau of Labor Statistics (BLS) of the Department of Labor. The data (reported quarterly on Form ES-202, the state UI contribution reports filed by employers in the industries covered by, and subject to , each state’s UI laws and by federal agencies) are tabulated by county and by NAICS six-digit industry. The QCEW data account for 93.0 percent of wages and salaries as estimated by BEA (table D).
Under most state UI laws, wages and salaries include bonuses, tips, and the cash value of meals and lodging provided by the employer—that is, pay-in-kind. The estimates of wages and salaries for a few industries are prepared largely or entirely with data other than the QCEW data. These industries are either not covered by state UI or are only partly covered. For three of these industries—support activities for agriculture and forestry; private education; and religious, grantmaking, civic, professional and similar organizations—the estimates are prepared as the sum of (1) an estimate f or the fully covered portion of the industry, based on the QCEW data, and (2) an estimate
1 NAICS has been used since 2001. Previously the Standard Industrial Classification (SIC) was used. See “Industrial Classification” in Chapter I Introduction.

November 2021 LOCAL AREA METHODOLOGY II-2
for the not fully covered portion of the industry, based largely or entirely on other source data, as discussed below. Wages and salaries in industries fully covered by the UI programs Estimates of wages and salaries covered by state UI programs or by the UI program for federal civilian employees are based on quarterly QCEW wage and salary (or payroll) data. However, these data do not precisely meet BEA’s statistical and conceptual requirements; therefore, the data must be adjusted. These adjustments affect both the industrial and the geographic patterns of state and county personal income. Adjustment for industry non-classification - The industry detail of the QCEW data regularly shows minor amounts of payroll—about 0.2 percent of total payrolls nationally—that have not been assigned to any industry. The industrial classification scheme used by BEA does not permit this not-elsewhere-classified category. Therefore, for each state and county, the amount in this category is distributed among the industries in proportion to the industry-classified QCEW payrolls. Because this adjustment only apportions the amount reported for a county within that county, no error is introduced into the total estimate for the county.
Adjustment for statewide reporting - A state UI contribution report is usually filed for each establishment by industry and by county; however, a report may be filed by an employer for a group of very small establishments by state, not by county. Therefore, county data are unavailable for these establishments. The state totals of the wages and salaries reported for these statewide units f or an industry are allocated to counties in proportion to the distribution of the wages and salaries for the industry that is reported by county. The statewide totals are allocated for each private-sector industry and for five government components—federal civilian, state education, state non-education, local education, and local non-education. Adjustments for misreported wage and salary data - Approximately $76.2 billion of the wages and salaries not reported by employers is added to the QCEW (table D). Because state and county data are unavailable, the national estimate for each industry is allocated to states and counties in proportion to the QCEW payroll data for the industry. The national estimate for each industry is prepared in two parts. One part is prepared for the payrolls that were underreported, and one part is prepared for the payrolls that were not reported because employers failed to file a report. 1 F
2 In addition, tips are assumed to be understated in the UI contribution reports from the following industries: health and personal care stores; general merchandise stores; air transportation; railroad transportation; taxicabs, (a part of transit and ground passenger transportation); scenic and sightseeing transportation; couriers and messengers; administrative and support services; waste management and remediation services; amusement, gambling, and recreation industries; accommodation services; food services and drinking places; personal and laundry services; and religious, grant making, civic, professional and similar organizations. For each of these industries, the national estimate of the unreported tips is allocated to states and counties in proportion to the QCEW
2 Robert P. Parker, “Improved Adjustments for Misreporting of Tax Return Information Used to Est imate the National Income and Product Accounts, 1977,” Survey 64 (June 1984): 17-25.

November 2021 Compensation II-3
payroll data for the industry (or in proportion to Railroad Retirement Board data for the railroad transportation industry). Further, the wages and salaries that employees contribute to tax-deferred thrift savings plans—such as 401(k) plans—had been omitted from the UI contribution reports of some employers in some states. This form of underreporting ended in 1997 in all states except Alaska. Beginning with 1996, Alaskan employers are no longer required to include employees’ voluntary savings contributions with reported wages and salaries. Only the reported wages and salaries of the state government appear to have been affected by this change so far. A state control is allocated to counties in proportion to QCEW payroll data.
Adjustments for federal civilian payrolls - Large proportions of the QCEW data for the wages and salaries of the civilian employees of some federal government agencies in New York (through 2002) and Wisconsin (through 1998) were reported by state, not by county. Therefore, the county estimates of the wages and salaries of these employees were derived from employment data provided by the Office of Personnel Management (OPM). Prior to 2002, the state estimates of the wages and salaries of the civilian employees of the Postal Service in New York were allocated to the counties in the state in proportion to the OPM employment data for the agency.
In addition, in the QCEW payroll data for federal civilian employees, all the wages and salaries for congressional staff are assigned to Washington, DC. However, some of these wages are earned by congressional staff who work in the state of fices of the members of Congress. BEA assumes that 25 percent of the total congressional payrolls are earned by congressional staff in state offices, so this percentage of these payrolls is allocated to states in proportion to their congressional representation. The state estimates of this adjustment are allocated to counties in proportion to the QCEW payroll data.
Federal employees who work in certain U.S. intelligence agencies are not included in the Unemployment Compensation for Federal Employees (UCFE) data, thus adjustments are made in specific geographies to provide complete coverage of all federal civilian wages and salaries.
Adjustment for a component of state government payrolls - The geographic coding of the QCEW data for the non-education component of state government payrolls attributes too much of the payrolls to the counties of the state capitals in six states. Therefore, wage data from the decennial Census of Population and more recently, 5-year estimates from the annual American Community Survey (ACS), are used in the preparation of the county estimates of the wages and salaries for these employees. The county estimates of the wages and salaries for the non-education component, for Illinois, Michigan, New Jersey, Rhode Island, Tennessee, and Wisconsin are based on wage data derived from unpublished decennial tabulations of journey-to-work (JTW) data from the Census for the years before 2001. Starting with 2008, the ACS JTW employment data was used, with 2001-2007 interpolated between the two JTW distributions. Wage and salary estimates for the establishments of American Indian Tribal Councils are included with local governments.

November 2021 LOCAL AREA METHODOLOGY II-4
Wages and salaries in industries not fully covered by the state UI programs The estimates of wages and salaries for seven industries are primarily based on data other than QCEW data. The QCEW data are inadequate for five industries—farms, farm labor contractors, private elementary and secondary schools, religious organizations, and private households—because these industries are fully covered by state UI programs in only a few states. The QCEW data are unavailable for two industries—railroads and military—because these industries are not covered by state UI programs. 2F
3 Consequently, the wages and salaries of all seven industries are treated as if they were not covered by state UI programs. In addition, because these estimates are primarily based on data that do not include wages paid in kind, an estimate of pay-in-kind is prepared for each of these industries except farm labor contractors, and railroads.
Farms - The estimates of wages and salaries for farms consist of cash wages, including the salaries received by the owner-operators of farm sole proprietorships, partnerships, and family-held corporations 3 F
4, and the pay-in-kind of hired farm labor.4 F
5 The state estimates of cash wages are based on estimates of hired farm cash wages and operator wages prepared by the Department of Agriculture. Estimates for most states are allocated to counties by the distribution of wages paid to farm employees from the Census of Agriculture. However, farm employees have mandatory UI coverage or almost complete voluntary coverage in Arizona, California, Connecticut, Delaware, Florida, Hawaii, Massachusetts, New Jersey, Rhode Island, and Washington. Therefore, county estimates of cash wages for these states are derived from QCEW data. State estimates of pay-in-kind are based on estimates prepared by the Department of Agriculture and are allocated to counties in proportion to the number of hired farm workers who worked 150 days or more from the Census of Agriculture.
Farm labor contractors - Farm labor contractors are classified in support activities for agriculture and forestry. Farm labor contractors and their employees are only partially covered by UI laws in most states, so most state and county estimates of wages are based on data for contract farm labor expenses from the Census of Agriculture. Since in Arizona and California all employees in this industry are covered, estimates are based on QCEW payroll data.
Railroads - The estimates of the wages and salaries of railroad employees are based mainly on data provided by the Railroad Retirement Board (RRB), which administers the Railroad Unemployment Insurance and Retirement systems. The railroad industry is not covered by state unemployment insurance, and the RRB does not require railroads to submit employment and wage data by establishment. However, the RRB does collect data from each railroad company on its total payroll, and, for each railroad company employee, on the wages and salaries that are subject to the railroad UI and
3 Military is a BEA industry classification. 4 Family-held corporations are those qualified under the Internal Revenue Code subchapter S. 5 USDA state estimates of farm labor expenses exclude the salaries received by the owner-operators; these salaries are treated as part of the return to capital. The BEA treatment of the salaries received by owner-operators of farms is different from the treatment of salaries received by sole proprietors a nd partners o f nonfarm enterprises. Their salaries are included in nonfarm proprietors’ income.

November 2021 Compensation II-5
retirement tax. The state and county of residence of each employee can also be identified in the RRB records. 5 F
6 The estimates of railroad wages and salaries by state and county of employee residence are based on the sum of the wages of employees whose wages do not exceed the ceiling for RRB taxation plus estimates of the wages of the employees with wages above the ceiling. To estimate the latter, the national total of the wages of railroad employees receiving below-ceiling wages—summed from the RRB employee data—is subtracted from the national total of the payrolls of all railroad companies—summed from the RRB company data—to yield the total of the wages of the employees with above-ceiling wages. This total is allocated to states and counties in proportion to the number of employees receiving above-ceiling wages, as determined from the RRB employee data. To be consistent with the estimates of wages and salaries for other industries, the state and county estimates of railroad wages and salaries are converted to a place-of-work basis. This is based on data from the 2011-2015 American Community Survey five-year estimates. From these data, the proportion of the wages of railroad employees who lived in one county but worked in another was calculated. Each of these proportions was multiplied by the corresponding place-of-residence wage estimates to calculate the intercounty flows of wages due to commuting; each of these flows was subtracted from the county of residence and added to the county of work to adjust the place-of-residence wage estimates to a place-of-work basis. The current year state and county estimates of railroad wages and salaries reflect the geographic distribution of the previous year estimates.
Private elementary and secondary schools - State estimates of cash wages of private school employees are based on data from the Census Bureau’s annual County Business Patterns (CBP) data, the data with the most uniform national coverage. State estimates of pay-in-kind reflect the number of full-time teachers in religious orders from the Official Catholic Directory. 6 F
7 In about half of the states, the county estimates of cash wages and pay-in-kind are derived from the best available series chosen from (1) data on employment in private elementary and secondary schools published by the state departments of education, (2) employment data from the U.S. Department of Education’s Survey of private elementary and secondary schools, or (3) relevant wage data from County Business Patterns. 7 F
8 In the other states, the UI coverage is complete enough so that the QCEW data can be used as the basis for the county estimates. In these states, the QCEW distribution
6 The data are converted to counties based on 5-digit ZIP codes. 7 See the “General Summary,” in the Official Catholic Directory (New York: P.J. Kenedy and Sons). The Directory is published annually. The “General Summary” is a tabulation of the number o f members o f religious orders who are employed in Catholic institutions in each diocese and in each state. The data are classified by clerical title and by religious assignment. The number of teachers does not distinguish between those who receive cash wages and those who receive only pay-in-kind, nor does it d ist ingu ish between those who teach in elementary and secondary schools and those who teach in colleges and universities. 8 The CBP data are tabulated from the administrative records of the Old-Age, Surv ivors, and Disa bility Insurance program. This program exempts nonprofit religious organizations, such as many of these schools, from mandatory coverage, but its provisions for elective coverage have resulted in the participation of most of these schools and many of the other religious organizations.

November 2021 LOCAL AREA METHODOLOGY II-6
of wages and salaries is the basis for the estimates of cash pay, and the QCEW distribution of employment is the basis for the estimates of pay-in-kind.
Religious organizations - The state estimates of cash wages and pay-in-kind of religious organizations are based on CBP data. However, the CBP county data are too frequently suppressed to avoid disclosure of information about individual organizations to be useful; therefore, the state estimates are allocated to counties in proportion to the distribution of the household population. 8F
9 Private households - The distribution of county level wages is based on Census
Journey to Work (JTW) county-level data from the 2000 decennial Census of Population. The JTW data were extrapolated to the present by the annual change in the household population. The extrapolated series for each year is adjusted proportionately to sum to the state estimates of cash wages. Estimates of pay-in-kind for private household employees are allocated to counties by BEA estimates of private household wage and salary employment.
Military - Estimates of wages and salaries for the military consist of estimates of cash wages (including allowances) of full-time military personnel and members of the military Reserves, including the National Guard, and of estimates of the pay-in-kind provided to enlisted personnel. 9 F
10 State estimates of cash wages for full-time military personnel of all services, are
allocated to counties in proportion to the number of personnel prepared by the Defense Manpower Data Center (DMDC).
1 0 F
11 State estimates of cash wages for the Reserves are based on data from the
appendix of the Budget of the United States Government. Because county payroll data are unavailable, the state estimates are allocated to counties in proportion to the distribution of the household population.
The national estimate for the pay-in-kind of the full-time personnel of each service is allocated to states and counties in proportion to the number of enlisted personnel.
Other adjustments - The QCEW payroll data for some industries exclude small portions of wages and salaries either because the employing establishments are not covered by the UI programs or because a portion of the establishments’ payrolls is not subject to UI reporting. The following procedure is used to prepare county estimates of these non-covered wages.
National estimates of non-covered wages are prepared and allocated to states based on the best available related economic series. The state estimates of the non-covered wages are added to the QCEW payroll data for the relevant industries. Then, the national estimates of wages and salaries (both covered and non-covered portions) are allocated by industry to states in proportion to the augmented QCEW data.
9 County total population is from the Census Bureau. Household population for counties is calculated as the difference between the total population and the Census Bureau population in group quarters estimates. 10 Officers do not receive pay-in-kind. The imputation for clothing is limited to standard issue clo thing; it does not include clothing and equipment for special or unusual duties. 11 Coast Guard data are now included with the DMDC report and no longer require a separate report from the Department of Homeland Security.

November 2021 Compensation II-7
The state estimates of wages and salaries (both covered and non-covered portions) are allocated to the counties in proportion to the unaugmented QCEW data. This procedure is used to prepare county estimates of the following items:
• Payrolls of railroad carrier affiliates, which are classified in support activities for transportation, and payrolls of railway labor organizations, classified in religious, grant making, civic, professional, and similar organizations
• Contributions to cafeteria plans that are excluded from QCEW payroll data for private industries and state and local governments in twenty-eight states
• Payrolls of nonprofit organizations, in numerous industries, that are exempt f rom UI coverage because they have fewer than four employees
• Wages and salaries of students employed by the institutions of higher education in which they are enrolled, which are classified in private education, state government education, and local government education
• Pay-in-kind of the members of religious orders who teach at private colleges and universities but who do not receive cash wages
• Pay-in-kind of workers in private hospitals who do not receive cash wages (mainly interns, student nurses, and members of religious orders)
• Salaries of elected officials, members of the judiciary, and hospital interns in state and local governments
• Commissions received by insurance solicitors and real estate agents • Transportation subsidies paid to federal civilian employees who use mass transit
to commute to and from work and allowances paid to federal civilian employees in selected occupations for uniforms
• Prisoner compensation, in counties where prisons are located, in federal government and in state government non-education
• Compensation to justices of the peace for marriage fees in local government non-education
• Compensation to jurors and expert legal witnesses in state government non-education
Alternative measure of county wages Another measure of county wages by place of work is the payroll data published in the Census Bureau’s County Business Patterns (CBP). It differs in source data and coverage from BEA’s wages and salaries and QCEW wages. 1 1 F
12 The CBP data are derived from Census Bureau business establishment surveys and federal administrative records. The coverage of the CBP data differs from that of the QCEW data primarily because the CBP data exclude most government employees, while the QCEW data cover civilian government employees. 1 2 F
13 CBP data also exclude several private industries covered at least in part by the QCEW: crop and animal production; rail transportation;
12 See table C. 13 The CBP data cover only those government employees who work in government hospitals, f ederally chartered savings institutions and credit unions, retail liquor stores, wholesale liquor establishments a nd university publishers. QCEW data in most states exclude state and local elected officials, members o f the judiciary, state national and air national guardsmen, temporary emergency employees, and those in po licy and advisory positions.

November 2021 LOCAL AREA METHODOLOGY II-8
insurance and employee benefit funds; trusts, estates, and agency accounts; and private households. However, the CBP data cover the employees of educational institutions, membership organizations, and small nonprofit organizations in other industries more completely than the QCEW data. 1 3 F
14 Beginning in 2001, QCEW classifies employees of Indian tribal governments and enterprises in local government. These employees were previously classified in the relevant private industries. 1 4 F
15 In the CBP data, these employees are still classified in private industries.
Supplements to Wages and Salaries
Supplements to wages and salaries consist of employer contributions for employee pensions and insurance funds (previously called other labor income) and employer contributions for government social insurance. For most components of supplements to wages and salaries, county-level source data are not available and so state estimates are allocated to counties based on wages or employment. See State Personal Income and Employment Methodology for a full description of each component of supplements and the data sources and estimation methods used for the state estimates. Supplements amount to 18.3 percent of compensation at the national level in 2020 (table E). Employer contributions for employee pension and insurance funds
Employer contributions for employee pension and insurance funds amounted to 12.6 percent of compensation at the national level in 2020 (table E). State estimates of employer contributions for the following funds are distributed to counties, by industry, using the allocator noted: Pension plans and insurance funds
• Defined benefit and defined contributions plans - BEA estimates of private and government wages and salaries.
• Group health insurance plans - BEA estimates of private and government employment.
• Group life insurance plans - BEA estimates of private and government wages and salaries
• Supplemental unemployment benefit plans - BEA estimates of private wages and salaries.
• Privately administered workers’ compensation plans - BEA estimates of wages and salaries.
14 Some religious elementary and secondary schools are not covered by QCEW because of a 1981 Supreme Court decision stating “schools operated and supported by churches and not separately incorporated [a re] held exempt from unemployment compensation taxes.” College students (and their spouses) employed by the school in which they are enrolled, and student nurses and interns employed by hospitals as part of their training are also excluded from QCEW. While QCEW coverage varies, half o f the states only include nonprofit organizations with four or more employees during twenty weeks in a calendar year. 15 For example, employees of casinos owned by tribal councils were included in the North American Industry Classification System subsector “Amusement, Gambling, and Recreation Industries.”

November 2021 Compensation II-9
Employer contributions for government social insurance Employers contribute on behalf of their employees to several government social insurance programs. These contributions amounted to 5.7 percent of compensation at the national level in 2020 (table E). County-level source data are used to prepare estimates of employer contributions for state unemployment insurance (UI) programs. Estimates of state UI taxes on employers and federal unemployment taxes are based on unpublished employer contributions data by county and industry provided by the Bureau of Labor Statistics of the U.S. Department of Labor. County-level estimates of employer contributions for all other government social insurance programs are distributions of state-level estimates, by industry, using the allocator noted:
• Old-Age, Survivors, and Disability Insurance (OASDI) and Hospital Insurance (HI).—BEA estimates of private wages and salaries that have been adjusted so that the average wage for each county and industry does not exceed the annual maximum taxable wage. Military wages and salaries are adjusted to exclude pay-in-kind. Most employers contribute to both the OASDI and HI programs on behalf of their employees. However, employees of the rail transportation industry, federal employees in the Civil Service Retirement System, and some state and local government employees covered under their employers’ pension programs are covered by the HI program but not by the OASDI program.
• Railroad retirement and railroad employees’ unemployment insurance—BEA estimates of wages and salaries for rail transportation.
• Unemployment Compensation for Federal Employees (UCFE) and Unemployment Compensation for Ex-Service Members (UCX) - BEA estimates of wages and salaries for civilian federal government and wages and salaries excluding pay in kind for active-duty military personnel.
• Military medical insurance and veterans’ life insurance —BEA estimates of military wages and salaries excluding pay in kind.
• Pension benefit guaranty—BEA estimates of wages and salaries for private industries.
• Federal workers’ compensation—BEA estimates of wages and salaries for civilian federal government.
• State-administered workers’ compensation—BEA estimates of wages and salaries.
• State-administered temporary disability insurance—BEA estimates of wages and salaries. New Jersey is the only state that requires employers to contribute to this program.

By ComponentPersonal Income 19,607,447 100.0 Compensation of employees 1/ 11,543,304 58.9 Wages and salaries 9,425,703 48.1 Supplements to wages and salaries 2,117,601 10.8 Employer contributions for employee pension and insurance funds 2/ 1,455,219 7.4 Employer contributions for government social insurance 662,382 3.4 Average compensation per job (dollars) 3/ 78,400 (NA)
By Industry Compensation of employees 1/ 11,543,304 58.9 Farm compensation 29,065 0.1 Nonfarm compensation 11,514,239 58.7 Private nonfarm compensation 9,424,411 48.1 Forestry, fishing, and related activities 30,304 0.2 Forestry and logging 3,726 0.0 Fishing, hunting, and trapping 967 0.0 Agriculture and forestry support activities 25,611 0.1 Mining 70,867 0.4 Oil and gas extraction 28,332 0.1 Mining (except oil and gas) 17,586 0.1 Support activities for mining 24,949 0.1 Utilities 93,780 0.5 Construction 595,781 3.0 Construction of buildings 144,045 0.7 Heavy and civil engineering construction 101,294 0.5 Specialty trade contractors 350,442 1.8 Manufacturing 1,124,104 5.7 Durable goods manufacturing 735,786 3.8 Wood product manufacturing 25,634 0.1 Nonmetallic mineral product manufacturing 31,697 0.2 Primary metal manufacturing 31,679 0.2 Fabricated metal product manufacturing 102,198 0.5 Machinery manufacturing 96,919 0.5 Computer and electronic product manufacturing 170,468 0.9 Electrical equipment and appliance manufacturing 38,502 0.2 Motor vehicles, bodies and trailers, and parts manufacturing 75,164 0.4 Other transportation equipment manufacturing 84,857 0.4 Furniture and related product manufacturing 21,881 0.1 Miscellaneous manufacturing 56,787 0.3 Nondurable goods manufacturing 388,318 2.0 Food manufacturing 105,967 0.5 Beverage and tobacco product manufacturing 20,324 0.1 Textile mills 5,823 0.0
Table C.--Compensation of Employees, by Component and by Industry, United States, 2020
Millions of dollars
Percent of personal income

Textile product mills 5,727 0.0 Apparel manufacturing 5,321 0.0 Leather and allied product manufacturing 1,508 0.0 Paper manufacturing 31,894 0.2 Printing and related support activities 24,582 0.1 Petroleum and coal products manufacturing 20,844 0.1 Chemical manufacturing 115,450 0.6 Plastics and rubber products manufacturing 50,878 0.3 Wholesale trade 563,130 2.9 Retail trade 671,251 3.4 Motor vehicle and parts dealers 128,670 0.7 Furniture and home furnishings stores 21,919 0.1 Electronics and appliance stores 28,147 0.1 Building material and garden supply stores 63,581 0.3 Food and beverage stores 113,219 0.6 Health and personal care stores 52,643 0.3 Gasoline stations 29,150 0.1 Clothing and clothing accessories stores 33,085 0.2 Sporting goods, hobby, book and music stores 15,153 0.1 General merchandise stores 101,128 0.5 Miscellaneous store retailers 28,377 0.1 Nonstore retailers 56,179 0.3 Transportation and warehousing 411,387 2.1 Air transportation 58,113 0.3 Rail transportation 22,455 0.1 Water transportation 7,321 0.0 Truck transportation 109,475 0.6 Transit and ground passenger transportation 21,186 0.1 Pipeline transportation 8,613 0.0 Scenic and sightseeing transportation 1,015 0.0 Support activities for transportation 53,646 0.3 Couriers and messengers 53,188 0.3 Warehousing and storage 76,375 0.4 Information 426,737 2.2 Publishing industries, except Internet 129,562 0.7 Motion picture and sound recording industries 33,616 0.2 Broadcasting, except Internet 29,589 0.2 Telecommunications 84,818 0.4 Data processing, hosting, and related services 59,207 0.3 Other information services 4/ 89,945 0.5 Finance and insurance 913,825 4.7 Monetary authorities - central bank 3,114 0.0 Credit intermediation and related activities 316,468 1.6 Securities, commodity contracts, investments 274,503 1.4 Insurance carriers and related activities 316,321 1.6 Funds, trusts, and other financial vehicles 3,419 0.0 Real estate and rental and leasing 169,816 0.9

Real estate 133,232 0.7 Rental and leasing services 33,675 0.2 Lessors of nonfinancial intangible assets 2,909 0.0 Professional, scientific, and technical services 1,176,858 6.0 Management of companies and enterprises 359,240 1.8 Administrative and waste management services 489,575 2.5 Administrative and support services 454,867 2.3 Waste management and remediation services 34,708 0.2 Educational services 214,588 1.1 Health care and social assistance 1,351,182 6.9 Ambulatory health care services 619,187 3.2 Hospitals 441,560 2.3 Nursing and residential care facilities 150,437 0.8 Social assistance 139,998 0.7 Arts, entertainment, and recreation 101,978 0.5 Performing arts and spectator sports 47,995 0.2 Museums, historical sites, zoos, and parks 7,038 0.0 Amusement, gambling, and recreation 46,945 0.2 Accommodation and food services 328,065 1.7 Accommodation 66,742 0.3 Food services and drinking places 261,323 1.3 Other services, except public administration 331,943 1.7 Repair and maintenance 75,252 0.4 Personal and laundry services 51,231 0.3 Religious, grantmaking, civic, professional, and similar organizations 182,891 0.9 Private households 22,569 0.1 Government and government enterprises 2,089,828 10.7 Federal, civilian 372,060 1.9 Military 143,310 0.7 State and local 1,574,458 8.0 State government 448,182 2.3 Local government 1,126,276 5.7
Footnotes
4. Under the 2007 NAICS, internet publishing and broadcasting was reclassified to other information services.
Note-- All dollar estimates are in current dollars (not adjusted for inflation).
Note-- Detail may not add to totals due to rounding
(NA) Data not available.
3. Average compensation per job is compensation of employees divided by total full-time and part-time wage and salary employment.
1. The estimates for 2020 are based on the 2017 NAICS.2. Includes actual employer contributions and actuarially imputed employer contributions to reflect benefits accrued by defined benefit pension plan participants through service to employers in the current period.

2020Total wages, BLS1... 8,769,109
Plus: Adjustments made by BEA:For unreported wages and unreported tips on employment tax returns... 76,218For wages and salaries not covered or not fully covered by unemployment insurance:
Private… 301,873Government… 139,299
Other adjustments2… 139,204
Equals: Wage and salary, BEA ... 9,425,703
2. Consists of adjustments to the wage and salary estimates to remove employees of U.S. companies stationed overseas, and reflect updates to published BLS Quarterly Census of Employment and Wages (QCEW) data.
1. BLS.gov data as of 09/01/21.
Table D.--Relation of BEA Wage and Salary to Wages as Published by the Bureau of Labor Statistics, United States, 2020
[Millions of dollars]

Millions of Dollars
Percent of Compensation
Compensation 11,543,304 100.0 Supplements to wages and salaries 2,117,601 18.3 Employer contributions for employee pension and insurance funds 1,455,219 12.6 Employer contributions for employee pension plans 575,949 5.0 Defined benefit plans 321,813 2.8 Defined contribution plans 254,136 2.2 Employer contributions for employee insurance plans 879,270 7.6 Group health insurance plans 790,986 6.9 Group life insurance plans 12,575 0.1 Supplemental unemployment benefit plans 455 <0.1 Privately-administered workers' compensation plans 75,254 0.7 Employer contributions for government social insurance 662,382 5.7 Old-age, survivors, and disability Insurance, and health insurance 586,167 5.1 Unemployment insurance 44,605 0.4 Railroad retirement 3,220 <0.1 Pension Benefit Guaranty Corporation 7,958 0.1 Military medical insurance, Veterans' life insurance, and Federal workers' compensation 14,836 <0.1 State-administered workers' compensation 50 0.0 State-administered temporary disability insurance 5,546 <0.1
Note. -- Detail may not add to totals due to rounding.
Table E. -- Components of Supplements to Wages and Salaries, United States, 2020

III. PROPRIETORS’ INCOME
Proprietors’ income with inventory valuation and capital consumption adjustments is the current-production income of sole proprietorships and partnerships and of tax-exempt cooperatives. A sole proprietorship is an unincorporated business required to file Schedule C of IRS Form 1040 (Profit or Loss from Business) or Schedule F (Profit or Loss from Farming). A partnership is an unincorporated business association required to file Form 1065 (U.S. Return of Partnership Income). A tax-exempt cooperative is a nonprofit business organization that is collectively owned by its customer-members. Proprietors’ income includes corporate directors’ fees, but it excludes the imputed net rental income of owner-occupied housing as well as the dividends and the monetary interest that are received by nonfinancial sole proprietorships and partnerships. 0 F
1 Proprietors’ income accounted for approximately 8.5 percent of total personal
income at the national level in 2020 (table F). The estimates of proprietors’ income are prepared in two parts—nonfarm proprietors’ income and farm proprietors’ income. Nonfarm proprietors’ income accounted for approximately 95.2 percent of proprietors’ income, and farm proprietors’ income, for approximately 4.8 percent.
Nonfarm Proprietors’ Income
Income of nonfarm sole proprietorships and partnerships
National estimates of the income of nonfarm sole proprietorships and partnerships are based on tabulations of Internal Revenue Service (IRS) tax returns: (1) “net prof it or (loss)” reported on Schedule C of Form 1040 for sole proprietorships; (2) “ordinary business income (loss)” from Form 1065 for partnerships; and (3) “net rental real estate income (loss)” plus “other net rental income (loss)” from Schedule K of Form 1065. 1 F
2 Collectively, these amounts are referred to as net profits. Because these data do not always reflect the income earned from current production and because they are incomplete, the estimates also include three major adjustments—the inventory valuation adjustment (IVA), the capital consumption adjustment (CCAdj), and the misreporting adjustment. 2 F
3 The IVA removes the effects of gains and losses that result from changes in the
prices of products withdrawn from inventories. The capital consumption adjustment represents the difference between capital
consumption allowances (depreciation on the historical-cost basis used in the source data) and the consumption of fixed capital (depreciation valued on a replacement-cost basis and the effects of the accidental destruction of depreciable plant and equipment). 3F
4
1 The dividends are included in personal dividend income, the monetary interest in personal interest income, and the rental income in rental income of persons. See Chapter IV Dividends, Interest, and Rent. 2 The net profit or (loss) reported on Schedule C of Form 1040 includes corporate directors’ fees. 3 Estimates of the IVA and CCAdj are in NIPA table 1.13 and an estimate of the misreporting adjustment is in NIPA table 7.14 4 The capital consumption adjustment also includes the differences between the serv ice lives a nd the depreciation patterns used for tax accounting and the empirically based depreciation schedules that are used

November 2021 LOCAL AREA METHODOLOGY III-2
The misreporting adjustment is an estimate of the net income of sole proprietors and partnerships that is not reported on tax returns. This adjustment accounted for 39 percent of nonfarm proprietors’ income in 2020.4 F
5 Like the national estimates, the state estimates are based on data tabulated f rom Schedule C of Form 1040 and from Form 1065. The geographic coding of the data is by tax-filing address. 5 F
6 This address is assumed to be the same as the address of the place of residence.
National estimates of nonfarm proprietors’ income—including the IVA, the CCAdj and the misreporting adjustment—for 2001 forward by North American Industry Classification System (NAICS) subsectors are allocated to the states using a 3-year moving average of state level tabulations of net profits. 6 F
7 NAICS subsector estimates of nonfarm proprietors’ income for 2001 are then interpolated backwards to create NAICS based estimates for 1998-2000.7 F
8 The IRS county data at the NAICS three-digit (subsector) level could not be used because the data are severely impaired by many suppressions required to prevent the disclosure of confidential information. Consequently, the county estimates for 2001 forward were prepared in two steps. First, the two-digit (sector) level state estimates were allocated to the counties using a 3-year moving average of the tabulations of net profits by county by sector. Next, the state subsector estimates were used to allocate the county sector estimates to subsectors. 8F
9
for national economic accounting. See Arnold J. Katz and Shelby W. Herman, “Improved Est imates o f Fixed Reproducible Tangible Wealth, 1929-95,” Survey of Current Business 77 (May 1997): 69-92. 5 Pamela A. Kelly, Stephanie H. McCulla, and David B. Wasshausen, “Improved Estimates of the National Income and Product Accounts”, Survey of Current Business 98 (September 2018). 6 See “Geocoding” in Chapter IX Technical Notes. 7 The allocator for year t is an average of the IRS profit data for years t, t-1, and t-2. 8 National estimates of nonfarm proprietorship and partnership income, excluding the misreporting adjustment, for 1992-2001 for most of the SIC two-digit industries were allocated to states in proportion to state level tabulations of net profits. For coal mining, the national estimate, excluding the m isreport ing adjustment, was allocated to states in proportion to the number of Schedules C plus the number of partners in general partnerships. For the other industries, the national estimates, excluding the misreporting adjustment, were allocated to states in proportion to net receipts (“gross receipts or sales” less “returns a nd allowances” as reported on Form 1040 Schedule C and Form 1065) for each industry. National estimates of the misreporting adjustment for 1992-2001 for all SIC industries except coal m in ing were a llocated to states in proportion to net receipts for each industry. For coal mining, the national estimate of the misreporting adjustment was allocated to states in proportion to the same series that was used to a llocate the estimate excluding the misreporting adjustment. 9 Prior to 2001, estimates of the income of nonfarm sole proprietorships and partnerships by industry were prepared using the Standard Industrial Classification (SIC). State division-level estimates were allocated to counties in proportion to net receipts. Three types of allocators were used to apportion county division-level estimates to two-digit industries. Estimates for nonmanufacturing divisions (excluding three industries to be mentioned below) were allocated to two-digit industries using the number of small firms as reported in County Business Patterns. The estimates were tied to a 1981-83 benchmark prepared using unsuppressed county-level data for net receipts and proprietorship and partnership income reported to the IRS. Estimates for the manufacturing division were allocated to two-digit industries by an estimate of wages and salaries in the industries. Estimates for three nonmanufacturing industries—crude petroleum and natural gas extraction, real estate, and holding and other investment offices—were allocated using dividends received by individuals as reported on IRS Form 1040.

November 2021 Proprietors’ Income III-3
Income of nonfarm tax-exempt cooperatives The income of tax-exempt cooperatives consists of the income that is received by rural electric cooperatives, rural telephone cooperatives, and agricultural cooperatives. The state estimates of the income of rural electric and telephone cooperatives are allocated to counties in proportion to estimates of proprietorship and partnership income, excluding the misreporting adjustment in broadcasting and telecommunications (for rural telephone cooperatives) and utilities (for rural electric cooperatives). Agricultural cooperatives are mainly farm marketing cooperatives and farm supply cooperatives; they are classified in wholesale trade. The state estimates of the income of these cooperatives are allocated to counties in proportion to the income of sole proprietorships and partnerships, excluding the misreporting adjustment, in the nondurable wholesale trade industry.
Farm Proprietors’ Income Farm proprietors’ income consists of the income that is received by the sole proprietorships and the partnerships that operate farms. It excludes income received by corporate farms. The national and state estimates of farm proprietors’ income are primarily derived from estimates of the income of all farms that are prepared by the U.S. Department of Agriculture (USDA). The concepts that underlie the USDA national and state estimates of farm income are generally the same as those that underlie the BEA estimates of f arm proprietors’ income. However, the USDA estimates of farm income include the net rental value of farm housing and the income of corporate farms; exclude sales and purchases of livestock between farms and a measure of the change in farm inventories of materials and supplies; and use a measure of depreciation different from BEA’s measure. 9 F
10 Additionally, for years prior to 2008, the USDA estimates include the net value of Commodity Credit Corporation loans. BEA’s county estimates of farm proprietors’ income for 2007-2020 are primarily derived from county data from the 2007, 2012, and 2017 Censuses of Agriculture. In addition, data from other sources within the USDA, such as the Farm Service Agency, are used. The process consists of three major steps. First, estimates of the “realized net income” of all farms (corporate and unincorporated) are computed as gross receipts less production expenses. Second, the estimates of realized net income are modified by the inventory change adjustment so that only the income and expenses from current production are measured. This modification yields estimates of the “total net income” of
10 For the differences between the USDA and the BEA estimates of net farm income at the national level, see NIPA table 7.15, “Relation of Net Farm Income in the National Income and Product Accounts to Net Farm Income as Published by the U.S. Department of Agriculture (USDA).” For information on the BEA estimates of depreciation, see Barbara M. Fraumeni, “The Measurement of Depreciation in the U.S. National Income and Product Accounts,” Survey 77 (July 1997): 7-23. Sales and purchases between farms are excluded from the USDA state estimates of cash receipts from marketing livestock and of expenses f or livestock purchases because in the aggregated state estimates o f farm income the cash receip ts f rom intrastate interfarm sales offset the expenses for intrastate interfarm purchases. Because these transactions may not be intracounty transactions, BEA estimates the transactions for each state and adds the estimate to the USDA state estimates of these cash receipts and expenses.

November 2021 LOCAL AREA METHODOLOGY III-4
all farms. Third, the income of corporate farms is estimated and subtracted from the estimates of total net income to yield farm proprietors’ income. For 2007, 2012, and 2017, the county estimates of gross receipts, production expenses, and the value of the net change in inventories are derived mainly from the Census of Agriculture. For non-census years, the county estimates for each state are prepared using the best available county source data for the state. The county estimates of each of these components are controlled to BEA’s state estimates. Farm gross receipts The estimates of gross receipts of all farms consist primarily of the following items: (1) Cash receipts from farm marketing of crops and livestock, (2) receipts from other farm-related activities, including recreational services, sales of forest products, and custom-feeding services performed by farm operators, as well as indemnity payments (benefits) from crop insurance (3) payments to farmers under several federal government farm subsidy programs, and (4) the imputed value of home consumption, which is the value of the farm products (food and fuel) produced and consumed on farms. 1 0F
11 The largest component of gross receipts is cash receipts from marketing. For 2007, 2012, and 2017 the USDA state estimates of cash receipts from the marketing of each commodity were allocated to counties by the related Census data. For non-census years the 2008-2011 and 2013-2016 county estimates reflect interpolations between the 2007 and 2012 Census data and 2012 and 2017 Census data, respectively, and the 2018-2020 estimates reflect extrapolation from the 2017 Census data. State estimates of the receipts from other farm-related activities for 2007-2020 were similarly allocated to counties in proportion to data for the receipts from these activities from the Censuses or from interpolations between the Censuses. Data on crop indemnity payments from crop insurance from the Risk Management Agency, USDA was used to allocate the 2008-2020 state estimates of crop insurance indemnities. State estimates of federal government payments to farmers for 2007-2020 were allocated to counties in proportion to annual tabulations of the payments f rom the Farm Service Agency data plus conservation payments data from the Natural Resource Conservation Service of USDA. County source data that reflect the imputed value of home consumption are unavailable. Therefore, the county estimates are based on the distribution of the number of farms per county, as reported in the Censuses. Farm production expenses State estimates of most farm production expenses for 2007, 2012, and 2017 were allocated to counties in proportion to production expense data from the Censuses for those years; the 2008-2011 and 2013-2016 county estimates are based on interpolations of the data from the Censuses, and the 2018-2020 estimates are based on data f rom the 2017 Census. 1 1F
12
11 Receipts for recreation services are for providing facilities for recreational activities, such as f ish ing, hunting, and camping. 12 Direct allocators for the following expenses are available from the 2007 and 2012 Censuses: Purchases of feed, livestock including poultry, seed, fertilizer and agricultural chemicals including lime, and pet roleum products; cash wages, perquisites, and social security taxes; contract labor expenses; machine h ire a nd

November 2021 Proprietors’ Income III-5
Inventory change adjustment The adjustment for inventory change is an estimate of the value of the net change during the year in farm inventories of the livestock and crops held for sale and private farm inventories of materials and supplies (i.e., purchased inputs such as feed, seed, fertilizer, and chemicals). This estimate is added to the estimate of realized net income in the second major step in the calculation of farm proprietors’ income, so that farm proprietors’ income for a year will include only the farm income and production expenses during the year, or from current production. The sum of realized net income and the value of the net change in inventories is total net income. The role of the inventory change adjustment in the derivation of net farm income is illustrated by the following examples. For crops, the value of the net change in inventories is negative when farmers feed more crops to their animals or sell more crops than they produce during the year; the amount held in inventory declines and realized net income overstates the income from current production by the value of the net withdrawals from inventory. For livestock, the value of the net change in inventories is positive when the number of animals that are born or that farmers purchase is greater than the number that they sell during the year; the size of the herds increases, and the realized net income understates the income from current production by the value of the net increase in the herds. For materials and supplies, the value of the net change in inventories is positive when farmers purchase more raw materials and supplies than they consume during the year; the amount held in inventory rises and the realized net income overstates the expenses from current production by the value of the net increase in the private inventories of materials and supplies. The county estimates are based on the county distribution of the number of livestock units in farm inventories reported in the 2007, 2012, and 2017 Censuses. The 2008-2011 and 2013-2016 state estimates were allocated by the interpolations f rom the Censuses, 2018-2020 estimates are based on data from the 2017 Census. State estimates of the value of the net change in crop inventories were allocated to counties by the data for crop production from the Censuses for those years, the 2008-2011 and 2013-2016 state estimates were allocated by the interpolations of the data f rom the Censuses, and the 2018-2020 state estimates were allocated by the data from the 2017 Census. The 2007, 2012, and 2017 state estimates of the value of the net change in materials and supplies inventories are allocated to counties using production expenses from the Censuses for: feed, seeds, commercial fertilizer, agricultural chemicals, and petroleum products. The 2008-2011 and 2013-2016 state estimates were allocated by the interpolations of the data from the Censuses, and the 2018-2020 state estimates were allocated by the data from the 2017 Census. Adjustment to exclude the income of corporate farms An adjustment to exclude the income of corporate farms is made in the third major step in the calculation of farm proprietors’ income, because the estimates of total
custom work; electricity; interest; taxes; repair and maintenance; depreciation; and a miscellaneous category that includes animal health costs.

November 2021 LOCAL AREA METHODOLOGY III-6
net income of all farms calculated in the second major step include the income of corporate farms. The adjustment is calculated in four steps. First the ratio of total crop and livestock sales of corporate farms to the total crop and livestock sales of all farms is computed for each county using unpublished tabulations from the 2012 and 2017 Censuses. The 2012 ratio is held constant through 2015. The 2017 ratio is used for 2020, and the ratios for 2016 to 2019 are derived by interpolation. Second, the adjustment ratio is multiplied by the county estimate of the total net income of all farms in order to derive the initial estimate of corporate farm income for each county. Third, the state estimates of corporate farm income are allocated to counties in proportion to the initial county estimates. Fourth, the allocated county estimates of the income of corporate farms for each county are subtracted from the estimates of the income of all farms to obtain estimates of farm proprietors’ income.

Personal income 19,607,447 100.0Proprietors' Income/1/ 1,659,171 8.5 Farm 79,315 0.4 Forestry, fishing, and related activities 8,342 0.0 Mining, quarrying, and oil and gas extraction 71,457 0.4 Utilities 23,404 0.1 Construction 228,971 1.2 Manufacturing 50,375 0.3 Wholesale and retail trade 127,176 0.6 Transportation and warehousing 107,921 0.6 Information 71,146 0.4 Finance and insurance 51,895 0.3 Real estate and rental and leasing 178,467 0.9 Professional, scientific, and technical services 267,455 1.4 Management of companies and enterprises 537 0.0 Administrative and support and waste management and remediation services 73,255 0.4 Educational services 10,530 0.1 Health care and social assistance 133,373 0.7 Arts, entertainment, and recreation 18,942 0.1 Accommodation and food services 38,245 0.2 Other services (except government and government enterprises) 118,365 0.6
Footnotes
NOTE.––Detail may not add to totals due to rounding. .
Millions of dollars
Percent of personal income
Table F.-- Proprietors' Income, by Industry, United States, 2020
1. Shown with inventory valuation and capital consumption adjustments.

IV. DIVIDENDS, INTEREST, AND RENT Personal dividend income, personal interest income, and rental income of persons with capital consumption adjustment are collectively known as property income. These components accounted for 18.4 percent of personal income at the national level in 2020 (table G).
Personal Dividend Income
Personal dividend income is the cash and other assets, excluding the corporations’ own stock that persons who are U.S. residents receive from U.S. and foreign corporations. Personal dividend income accounted for 6.6 percent of total personal income at the national level in 2020 (table G). The county estimates of personal dividend income are prepared in two parts: (1) imputed receipt of dividend income f rom pension plans, and (2) all other dividend income. Imputed receipt of dividend income from pension plans
The imputed receipt of dividends from pension plans consists of the dividends received by noninsured pension plans and passed through to persons 0 F
1. Separate estimates are prepared for imputed receipts from private pension plans, state and local government employee pension plans, and from the Thrift Savings Plan (TSP) in which federal civilian and military employees may participate. For each of these categories, a portion of the dividends is assumed to be received on behalf of current employees, and a portion on behalf of retirees and their survivors. For private pension plans, the state estimates of the currently employed portion are allocated to counties using place-of-residence private-sector wage and salary estimates. The state estimates of the retired portion are allocated to counties using BEA estimates of Social Security benefits. 1 F
2 For the dividends received by the Thrift Savings Plan, the state estimates of the currently employed portion are allocated to counties using residence-adjusted county estimates of federal civilian wages and salaries; the state estimates of the retired portion, are allocated by federal retirement & disability payments data from the Census Bureau’s Consolidated Federal Funds Report. For the dividends received by the state and local government employee retirement plans, the state estimates of both the currently employed and the retired portions are allocated to counties using residence-adjusted county estimates of state and local government wages and salaries.
1 For a detailed discussion of the treatment of pension plans in personal income see Jason W. Chute, Stephanie H. McCulla, and Shelly Smith, “Preview of the 2018 Comprehensive Update of the National Income and Product Accounts: Changes in Methods, Definitions, and Presentations” Survey of Current Business 98 (April 2018) and “Preview of the 2013 Comprehensive Revision of the National Income and Product Accounts; Changes in Definitions and Presentations,” Survey of Current Business 93 (March 2013). 2 See Chapter V Personal Current Transfer Receipts.

November 2021 LOCAL AREA METHODOLOGY IV-2
Other dividend income State estimates of other dividend income are allocated to counties using
unpublished IRS Individual Master File (IMF) county tabulations of ordinary dividends reported on individual income tax return Form 1040. 2F
3
Personal Interest Income Personal interest income is the interest income (monetary and imputed) of persons, including individuals and nonprofits serving households, from all sources. Personal interest income accounted for 8.2 percent of total personal income at the national level in 2020 (table G). The county estimates of personal interest income are prepared in three parts: (1) monetary interest income, (2) imputed interest receipts f rom employee pension plans, and (3) imputed interest receipts from financial institutions and insurance companies. Monetary interest income The state estimates of monetary interest income are allocated to counties on the basis of unpublished IRS Individual Master File (IMF) tabulations of the taxable and non-taxable interest reported by individuals on IRS Form 1040 and included in the IRS Individual Master File (IMF). 3 F
4 The IMF interest data are supplemented by an estimate of the interest received by individuals from regulated investment companies, such as money market mutual funds. The supplementation is necessary because the interest received by individuals from regulated investment companies is reported as dividend income on Form 1040 but is treated as interest income in BEA’s state personal income accounts. County estimates of the interest received from regulated investment companies are based on a national ratio of such interest to IMF dividends and county-level estimates of IMF dividends. Imputed interest receipts from employee pension plans
The imputed receipt of interest income from pension plans consists of the monetary and imputed interest received by noninsured pension plans and passed through to persons. 4 F
5 Separate estimates are prepared for imputed receipts from private sector pension plans, federal civilian employee pension plans (including the Thrift Savings
3 Beginning with the estimates for 2009, the tabulations of ordinary dividends are based on tabulations of a 52-week IMF data file. Previously, the tabulations were based on returns processed in the first 39 weeks o f the year. In order to avoid a break in the time series due to the switch the 52-week file, BEA carried back, at a decreasing rate, the income reported on end-of-year returns from 2009 to 1990 for personal dividends. 4 Beginning with the estimates for 2009, the tabulations of taxable interest are based on tabulations of a 52-week IMF data file. Previously, the tabulations were based on returns processed in the first 39 weeks of the year. In order to avoid a break in the time series due to the switch the 52-week file, BEA carried back, at a decreasing rate, the income reported on end-of-year returns from 2009 to 1990 for personal interest. 5 For a detailed discussion of the treatment of pension plans in personal income see Jason W. Chute, Stephanie H. McCulla, and Shelly Smith, “Preview of the 2018 Comprehensive Update of the National Income and Product Accounts: Changes in Methods, Definitions, and Presentations” Survey of Current Business 98 (April 2018) and “Preview of the 2013 Comprehensive Revision of the National Income and Product Accounts; Changes in Definitions and Presentations,” Survey of Current Business 93 (March 2013).
November 2021 Dividends, Interest, and Rent IV-3
Plan), the military retirement plan, and state and local government employee pension plans. For each of these categories, a portion of the interest is assumed to be received on behalf of current employees, and a portion on behalf of retirees and their survivors. For private plans, federal civilian employee plans and state and local government plans these portions are determined using the same sources as described above for dividends. 5 F
6 The state estimates of the imputed receipt of interest income from private pension
plans, federal civilian plans and by state and local government plans are allocated to counties in the same manner described above for the dividends they receive. For military pension plans, the portion of the imputed receipt of interest income attributed to active-duty military and reservists is allocated to counties on the basis of BEA estimates of residence-adjusted base pay of active-duty military personnel. The state estimates of the portion attributed to annuitants are allocated to counties using military retirement and disability payments data from the Census Bureau’s Consolidated Federal Funds Report. Imputed interest receipts from financial institutions and insurance companies6 F
7 Imputed interest receipts from financial institutions and insurance companies
consist of (a) the value of depositor services (such as checking and record keeping) furnished without payment by financial intermediaries (commercial banks, savings institutions, and credit unions) to persons, (b) the value of the investor services that are furnished without payment by regulated investment companies (mutual funds) to their shareholders, (c) premium supplements for property and casualty insurance, and (d) the interest received from life insurance carriers. 7 F
8 Premium supplements for property and casualty insurance is the property income
that property and casualty insurance carriers earn on reserves held to pay claims. This income is deemed to be paid out to policyholders and then paid back as premium supplements even though in actuality the insurance companies retain the property income. The imputed interest received from life insurance carriers consists of the property income life insurance carriers earn on life insurance and annuity reserves. This income is deemed to be paid out to policyholders and then paid back as premium supplements even though the insurance companies retain the property income. The state estimates of imputed interest receipts from financial institutions and insurance companies are allocated to counties in proportion to the BEA estimate of monetary interest.
6 The interest received by the military retirement plan is divided into that attributed to current annuitants and that attributed to active-duty personnel and reservists based on the present value of future benefits of each group from the DOD publication: Valuation of the Military Retirement System. 7 For a detailed description of the treatment of imputed interest in the National Income and Product Accounts see “Chapter 5: Personal Consumption Expenditures” NIPA Handbook: Concepts and Methods of the U.S. National Income and Product Accounts, May 2019. 8 See “Imputation” in Chapter IX Technical Notes.

November 2021 LOCAL AREA METHODOLOGY IV-4
Rental Income of Persons The rental income of persons with capital consumption adjustment is the net current-production income of persons (except those primarily engaged in the real estate business) from the rental of real property; the imputed net rental income of owner-occupants of farm and nonfarm dwellings; and the royalties received by persons from patents, copyrights, and rights to natural resources.8 F
9 The national estimate of the rental income of persons accounted for 3.6 percent of
total personal income in 2020 (table G). Monetary rental income accounted for 0.8 percent of total personal income, and imputed rental income accounted for about 2.8 percent. Monetary rental income
The state estimates of monetary rental income, which are the combined estimates of rental income of real property including tenant occupied housing and royalties, are allocated to counties in proportion to unpublished IRS Individual Master File (IMF) tabulations of the gross rent and royalties reported on Schedule E of Form 1040. 9F
10 Imputed rental income Imputed rent is an imputation for the net rental income of owner-occupied housing. It is based on the assumption that owner-occupants are in the rental business and that they are renting the houses in which they live to themselves: As tenants, they pay rent to the landlords (that is, to themselves); as landlords, they collect rent from their tenants (that is, from themselves), they incur expenses, and they may have a profit or a loss from the rental business. 1 0 F
11 The county estimates of imputed net rental income are prepared in in three parts: (1) imputed net rent received by the owner-occupants of mobile homes, (2) imputed net rent received by the owner-occupants permanent-site nonfarm dwellings and (3) imputed net rent received by the owner-occupants of permanent-site farm dwellings. Mobile Homes- The state estimates of imputed net rent from mobile homes are allocated to counties in proportion to the sum of the net rental value of owner occupied nonfarm mobile homes, owner occupied farm mobile homes, and vacant nonfarm mobile homes estimates, from the American Community Survey (ACS) 1-Year Public Use Microdata Sample (PUMS) file. Permanent-site nonfarm dwellings- The state estimates of imputed net rent from permanent-site nonfarm dwellings are allocated to counties in proportion to the sum of the net rental value of owner occupied nonfarm permanent site homes and vacant nonfarm permanent site homes estimates, from the American Community Survey (ACS) 1-Year Public Use Microdata Sample (PUMS) file.
Permanent-site farm dwellings- The state estimates of imputed net rent from permanent-site farm dwellings are allocated to counties in proportion to estimates of the
9 The net rental income received by persons who are primarily engaged in the real estate business is included in nonfarm proprietors’ income. 10 Beginning with the estimates for 2009, the tabulations of gross rent and royalties are based on tabulations of a 52-week IMF data file. For prior years, the tabulations were based on returns processed in the first 39 weeks of the year. 11 See “Imputation” in Chapter IX Technical Notes.

November 2021 Dividends, Interest, and Rent IV-5
net rental value of owner-occupied farm permanent site homes, from the American Community Survey (ACS) 1-Year Public Use Microdata Sample (PUMS) file.

Personal income 19,607,447 100.0Dividends, interest, and rent 3,617,027 18.4 Personal dividend income 1,297,734 6.6 Personal interest income 1,607,709 8.2 Imputed interest receipts 1/ 1,036,042 5.3 Monetary interest receipts 571,667 2.9 Rental income of persons 2/ 711,584 3.6 Imputed rent 554,982 2.8 Monetary rent 156,602 0.8
Footnotes
2. Rental income of persons includes the capital consumption adjustment.
NOTE. -- Detail may not add to totals due to rounding.
Table G. -- Components of Property Income, United States, 2020
Millions of dollars
Percent of personal income
1. Consists of imputed interest received from (1) finance and insurance companies and (2) employee pension plans.

V. PERSONAL CURRENT TRANSFER RECEIPTS In personal income, transfer receipts are benefits received by persons f or which no current services are performed. They are payments by government and business to individuals and nonprofit institutions. 0 F
1 Transfer receipts accounted for 21.6 percent of total personal income at the national level in 2020 (table H). Estimates are prepared for approximately 50 subcomponents of transfer receipts. For organizational convenience, the subcomponents are classified by source—government or business—and by recipient—individuals or nonprofit institutions. In this discussion, transfer receipts consist of three major components—receipts of individuals from governments, receipts of nonprofit institutions, and receipts of individuals from businesses. This chapter is organized according to the order of the presentation of the subcomponents in table H. Each subcomponent is briefly defined, and the preparation of the county estimates is described.
Current Transfer Receipts of Individuals from Governments Retirement and disability insurance benefits Social Security benefits - These are mainly monthly benefits received by retired workers and their dependents, disabled workers and their dependents, and survivors; and lump-sum benefits received by survivors. The state estimates are based on annual tabulations of payments from the Social Security Administration (SSA). The county estimates are based on SSA tabulations of the amount of monthly benefits paid to those in current-payment status on December 31 by county of residence of the beneficiaries.
Railroad retirement and disability benefits - These benefits are received by retired and disabled railroad employees and their survivors under the federal program of retirement insurance for railroad employees, who are not covered by Social Security. The state estimates and county estimates of the benefits, beginning with 2011, are based on fiscal year data from the Department of Treasury’s USASpending.gov website. For earlier years, state estimates are based on the Census Bureau’s discontinued Consolidated Federal Funds Report (CFFR) and county estimates are based on the Census Bureau’s discontinued Federal Assistance Awards Data System (FAADS).
Workers’ compensation - This compensation is received by individuals with employment-related injuries and illnesses, and by the survivors of individuals who died of employment-related causes, from publicly administered workers’ compensation insurance from both the federal and state governments. The state estimates of the compensation received under the federal program, which covers only federal civilian employees, are based on fiscal year data from the Census Bureau’s discontinued Consolidated Federal Funds Report (CFFR). In the absence of data for counties, the state estimates are allocated to counties in proportion to
1 Transfer receipts from the rest of the world are netted against similar payments to the rest o f the world , and the net payments, called “personal current transfer payments to the rest of the world (net),” are recorded in the national income and products accounts as part of personal outlays.
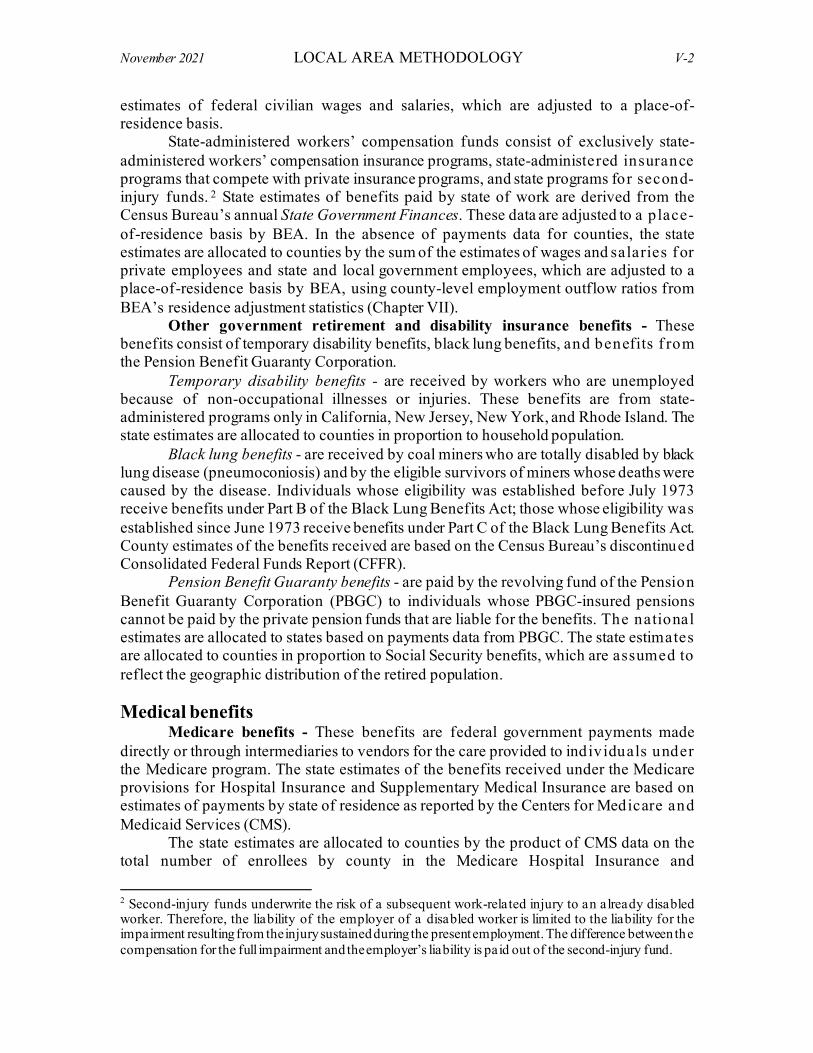
November 2021 LOCAL AREA METHODOLOGY V-2
estimates of federal civilian wages and salaries, which are adjusted to a place-of-residence basis. State-administered workers’ compensation funds consist of exclusively state-administered workers’ compensation insurance programs, state-administered insurance programs that compete with private insurance programs, and state programs for second-injury funds. 1 F
2 State estimates of benefits paid by state of work are derived from the Census Bureau’s annual State Government Finances. These data are adjusted to a place-of-residence basis by BEA. In the absence of payments data for counties, the state estimates are allocated to counties by the sum of the estimates of wages and salaries f or private employees and state and local government employees, which are adjusted to a place-of-residence basis by BEA, using county-level employment outflow ratios from BEA’s residence adjustment statistics (Chapter VII). Other government retirement and disability insurance benefits - These benefits consist of temporary disability benefits, black lung benefits, and benefits f rom the Pension Benefit Guaranty Corporation. Temporary disability benefits - are received by workers who are unemployed because of non-occupational illnesses or injuries. These benefits are from state-administered programs only in California, New Jersey, New York, and Rhode Island. The state estimates are allocated to counties in proportion to household population. Black lung benefits - are received by coal miners who are totally disabled by black lung disease (pneumoconiosis) and by the eligible survivors of miners whose deaths were caused by the disease. Individuals whose eligibility was established before July 1973 receive benefits under Part B of the Black Lung Benefits Act; those whose eligibility was established since June 1973 receive benefits under Part C of the Black Lung Benefits Act. County estimates of the benefits received are based on the Census Bureau’s discontinued Consolidated Federal Funds Report (CFFR). Pension Benefit Guaranty benefits - are paid by the revolving fund of the Pension Benefit Guaranty Corporation (PBGC) to individuals whose PBGC-insured pensions cannot be paid by the private pension funds that are liable for the benefits. The national estimates are allocated to states based on payments data from PBGC. The state estimates are allocated to counties in proportion to Social Security benefits, which are assumed to reflect the geographic distribution of the retired population. Medical benefits Medicare benefits - These benefits are federal government payments made directly or through intermediaries to vendors for the care provided to individuals under the Medicare program. The state estimates of the benefits received under the Medicare provisions for Hospital Insurance and Supplementary Medical Insurance are based on estimates of payments by state of residence as reported by the Centers for Medicare and Medicaid Services (CMS).
The state estimates are allocated to counties by the product of CMS data on the total number of enrollees by county in the Medicare Hospital Insurance and
2 Second-injury funds underwrite the risk of a subsequent work-related injury to an already disabled worker. Therefore, the liability of the employer of a disabled worker is limited to the liability for the impairment resulting from the injury sustained during the present employment. The difference between the compensation for the full impairment and the employer’s liability is paid out of the second-injury fund.

November 2021 Personal Current Transfer Receipts V-3
Supplementary Medical Insurance programs times a measure of fee for service payments per enrollee by county based on CMS data from the rate setting program for Medicare Advantage. 2 F
3 Estimates beginning with 2006 also include Medicare Prescription Drug Plan (Part D). The national control for Part D was allocated to states and counties by the counts from CMS of the number of enrollees in Part D. Medicaid benefits - These medical benefits are received by low-income individuals. The benefits consist mainly of the payments made directly or through intermediaries to vendors for care provided to individuals under the federally assisted, state-administered Medicaid program and the Title XIX Medicaid expansion portion of the Children’s Health Insurance Program (CHIP). 3 F
4 The state estimates are based on payments data from CMS. For about two-thirds of the states, the county estimates of payments made under both Medicaid are based on Medicaid payments data from the state departments of social services. For a year or years for which the data are not available, the available data are interpolated, or the most recent year is used to prepare the county estimates. For the states for which payments data are not available by county, the state estimates of all benefits received are allocated to counties in proportion to BEA’s estimates of family assistance. The county estimates of Title XIX CHIP benefits are based on enrollment data from the various state departments of social services. For counties in states that do not provide these data, the state estimates are allocated in proportion to the estimate of children age 0-17 in poverty from the Census Bureau’s Small Area Income and Poverty Estimates.
Other medical care benefits - These benefits are received by low-income individuals. The benefits consist mainly of the payments made directly or through intermediaries to vendors for care provided to individuals under the Title XXI of the federally assisted, state-administered Children’s Health Insurance Program (CHIP), and under the general assistance medical programs of state and local governments. The state estimates of the payments made under the CHIP are based on data from CMS. The state estimates of payments made under the general assistance medical programs are based on data that are obtained from state departments of social services by CMS. The county estimates of Title XXI CHIP benefits are based on enrollment data from the various state departments of social services. For counties in states that do not provide these data, the state estimates are allocated in proportion to the estimate of children age 0-17 in poverty from the Census Bureau’s Small Area Income and Poverty Estimates. The state estimates of payments made under the general assistance medical programs are allocated to counties in proportion to Medicaid benefits. Military medical insurance benefits - These benefits are vendor payments made under the TRICARE Management Program, formerly called the Civilian Health and Medical Plan of the Uniformed Services, for the medical care of dependents of active-duty military personnel and of retired military personnel and their dependents at nonmilitary medical facilities. The state estimates are based on payments data f rom the Department of Defense. County data for these payments are unavailable. The state
3 http://www.cms.gov/Medicare/Health-Plans/MedicareAdvtgSpecRateStats/FFS-Data.html 4 On the treatment of Medicaid as a personal current transfer receipt see the Survey of Current Business, October 1985, pp.22-23 (Vol.65, No.10).

November 2021 LOCAL AREA METHODOLOGY V-4
estimates are allocated to counties by military retirement payments data for September that are provided each year by the Department of Defense. Income maintenance benefits Supplemental Security Income (SSI) benefits - These benefits are received by the aged, the blind, and the disabled from both the federal and state governments. The state estimates are based on Social Security Administration (SSA) tabulations of annual disbursements for two categories of SSI benefits: Basic federal payments and supplemental state payments. The county estimates of the combined categories are based on payments data from the SSA.
Earned Income Tax Credit (EITC) - is a refundable federal income tax credit for low-income workers, mainly those with minor children. Eligibility for the tax credits is determined by the size of adjusted gross income, or earned income, and by certain household characteristics. The state estimates are based on data from the Internal Revenue Service’s Historical Table 2 published in the SOI Bulletin. State estimates are allocated to counties based on the tabulations of these payments from the Internal Revenue Service. The data used to construct county-level estimates of EITC has changed over the years. 4 F
5 From 2016 forward, data from 52-week IRS Individual Master File and Individual Returns Transaction File (IRTF) are used. Supplemental Nutritional Assistance 5 F
6 - These benefits, under the Supplemental Nutritional Assistance Program (SNAP) (formerly called food stamps), are issued to qualifying low-income individuals to supplement their ability to purchase food. Eligibility is determined by each state’s interpretation of federal regulations; the U.S. Department of Agriculture (USDA) pays the cost of the benefits. The state estimates are based on tabulations of the value of the distributed benefits from the Department of Agriculture. The state estimates are allocated to counties based on payments data from the various state departments of social services. When payment data are not available, data on the number of SNAP recipients from the Census Bureau’s Small Area Income and Poverty Estimates program are used to extrapolate or interpolate. Other income maintenance benefits - These benefits consist of family assistance, general assistance benefits, foster care and adoption assistance, child tax credit, energy assistance, and the value of vouchers issued under the Special Supplemental Nutrition for Women, Infants and Children (WIC) program. Family assistance - Formerly, this assistance was provided through the federally-aided, state-administered Aid to Families with Dependent Children (AFDC) and emergency assistance programs. In 1997 they were phased out and replaced by the Temporary Assistance to Needy Families (TANF) program. The state estimates are based on fiscal year direct data from the web site of the Administration for Children and Families (ACF) of the Department of Health and Human Services. The county estimates are based on payments data from the various state departments of social services.
General assistance benefits - are the benefits received from state and local governments by low-income individuals and families who do not qualify for help under
5 From 2009 to 2015, data from the IRS SPEC returns database are used. From 1998 to 2008, IRS zip code-based data are used. Prior to 1998, the series is interpolated using Census Bureau poverty data as an indicator. 6 See Interpolation and extrapolation in Chapter IX Technical Notes.

November 2021 Personal Current Transfer Receipts V-5
federally supported programs and disaster assistance received from the federal-state Other Needs Assistance program. 6 F
7 The state estimates are based on payments data from the Census Bureau’s annual State and Local Government Finances except for the disaster assistance portion which is based on direct data for each state and disaster from the Federal Emergency Management Agency (FEMA). The non-disaster portion of county estimates is based on payments data from the various state departments of social services. For counties in states where relevant payments data are not available, the state estimates are allocated in proportion to the estimate of people in poverty from the Census Bureau’s Small Area Income and Poverty Estimates. The disaster portion of county estimates is based on data related to the specific disaster in related components when available or on household population of counties listed by FEMA as eligible for individual assistance for each disaster. Foster care and adoption assistance - is received from state governments by families and institutions that care for foster children and by families that adopt children. The assistance is provided by state programs, some of which are federally aided. The state estimates are based on federal grants data from the Administration for Children and Families adjusted to reflect the fund matching percentage that is required of each state. The state estimates were allocated to counties in proportion to household population. Additional Child Tax Credit (ACTC) – This is a federal income tax credit for people who have minor children. People who qualify for the non-refundable child tax credit, and for whom that credit exceeds their total tax liability, may qualify to receive a portion of the excess as a refund. The state estimates are based on data from the Internal Revenue Service’s Historical Table 2 published in the SOI Bulletin. State estimates are allocated to counties based on the tabulations of these payments from the Internal Revenue Service. The data used to construct county-level estimates of ACTC has changed over the years. 7F
8 From 2016 forward, data from 52-week IRS Individual Master File and Individual Returns Transaction File (IRTF) are used.
Energy assistance - consists of both cash payments received by needy households and vendor payments made to suppliers to help defray the cost of home heating, cooling, and weatherization under the federally funded and state-administered energy assistance programs. The state estimates are based on payments data published by the Administration for Children and Families. The estimates for counties in most states are based on payments data from the various state departments of social services. For counties in states that do not provide these data, the state estimates are allocated to counties in proportion to unpublished Supplemental Security Income enrollment (number of recipients) from the Social Security Administration. Special Supplemental Nutrition for Women, Infants and Children (WIC) benefits - This program is fully funded by the USDA Food and Nutrition Service and administered mainly through state agencies. The transfers under the program take the form of vouchers issued to low-income women who are pregnant or who have young children; the vouchers are used to purchase supplemental nutritious foods. The state estimates are based on direct data provided by the Food and Nutrition Service. State estimates were allocated to counties in proportion to BEA’s estimates of family assistance.
7 The Federal Government neither funds nor regulates these programs. 8 From 2009 to 2015, data from the IRS SPEC returns database are used. From 1999 to 2008, IRS zip code-based data are used.
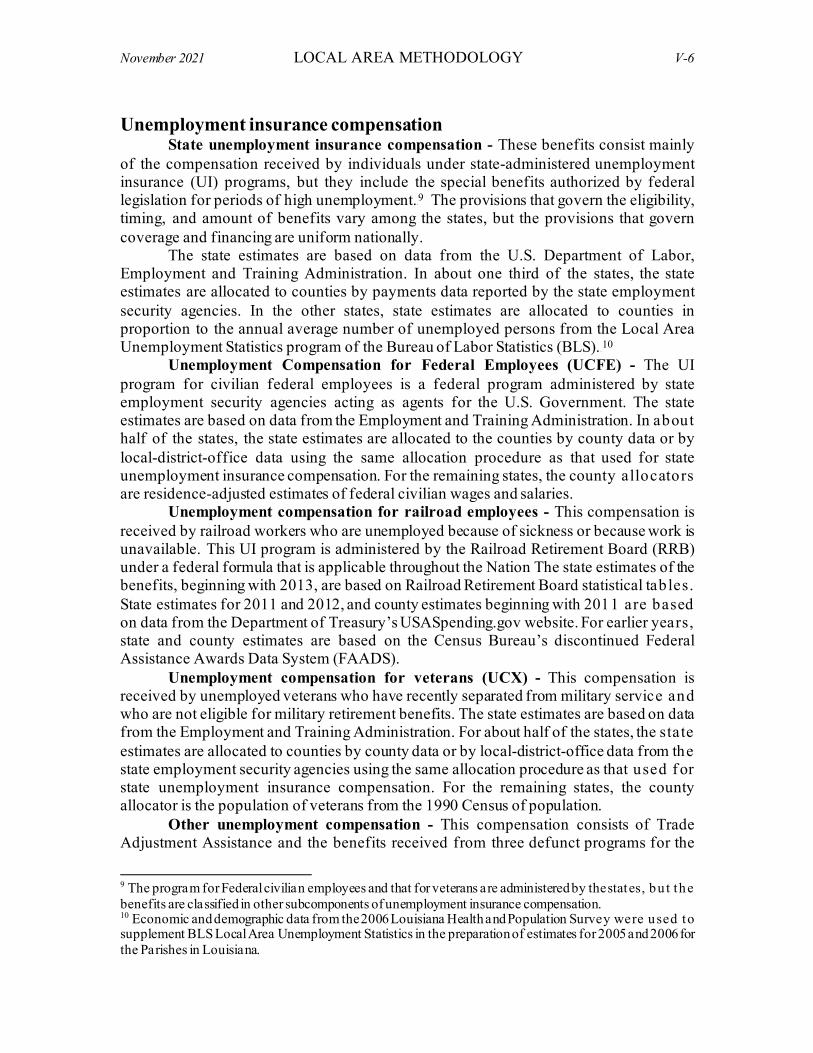
November 2021 LOCAL AREA METHODOLOGY V-6
Unemployment insurance compensation State unemployment insurance compensation - These benefits consist mainly of the compensation received by individuals under state-administered unemployment insurance (UI) programs, but they include the special benefits authorized by federal legislation for periods of high unemployment. 8F
9 The provisions that govern the eligibility, timing, and amount of benefits vary among the states, but the provisions that govern coverage and financing are uniform nationally. The state estimates are based on data from the U.S. Department of Labor, Employment and Training Administration. In about one third of the states, the state estimates are allocated to counties by payments data reported by the state employment security agencies. In the other states, state estimates are allocated to counties in proportion to the annual average number of unemployed persons from the Local Area Unemployment Statistics program of the Bureau of Labor Statistics (BLS). 9 F
10 Unemployment Compensation for Federal Employees (UCFE) - The UI program for civilian federal employees is a federal program administered by state employment security agencies acting as agents for the U.S. Government. The state estimates are based on data from the Employment and Training Administration. In about half of the states, the state estimates are allocated to the counties by county data or by local-district-office data using the same allocation procedure as that used for state unemployment insurance compensation. For the remaining states, the county allocators are residence-adjusted estimates of federal civilian wages and salaries. Unemployment compensation for railroad employees - This compensation is received by railroad workers who are unemployed because of sickness or because work is unavailable. This UI program is administered by the Railroad Retirement Board (RRB) under a federal formula that is applicable throughout the Nation The state estimates of the benefits, beginning with 2013, are based on Railroad Retirement Board statistical tables. State estimates for 2011 and 2012, and county estimates beginning with 2011 are based on data from the Department of Treasury’s USASpending.gov website. For earlier years, state and county estimates are based on the Census Bureau’s discontinued Federal Assistance Awards Data System (FAADS). Unemployment compensation for veterans (UCX) - This compensation is received by unemployed veterans who have recently separated from military service and who are not eligible for military retirement benefits. The state estimates are based on data from the Employment and Training Administration. For about half of the states, the state estimates are allocated to counties by county data or by local-district-office data from the state employment security agencies using the same allocation procedure as that used f or state unemployment insurance compensation. For the remaining states, the county allocator is the population of veterans from the 1990 Census of population. Other unemployment compensation - This compensation consists of Trade Adjustment Assistance and the benefits received from three defunct programs for the
9 The program for Federal civilian employees and that for veterans are administered by the states, bu t the benefits are classified in other subcomponents of unemployment insurance compensation. 10 Economic and demographic data from the 2006 Louisiana Health and Population Survey were used to supplement BLS Local Area Unemployment Statistics in the preparation of estimates for 2005 and 2006 for the Parishes in Louisiana.

November 2021 Personal Current Transfer Receipts V-7
jobless: the Redwood Employee Protection program, the Public Service Employment program, and the Transitional Benefits program. Trade adjustment assistance - Workers who are unemployed because of the adverse economic effects of international trade arrangements may be eligible to receive trade adjustment assistance. Prior to 2009, the state estimates of trade adjustment assistance, a component of unemployment insurance compensation, were allocated to counties using a 1986 distribution of benefits from the Department of Labor. Beginning with 2009, the state estimates are allocated to counties using the number of workers covered by certified petitions. The annual county tabulations of these workers are provided by the Department of Labor. Redwood Park benefits - These benefits were provided to workers made jobless by the expansion of the Redwood National Park in California during the period from May 31, 1977 to September 30, 1980. The benefits—which included weekly lay-off benefits, severance payments, and vacation replacement payments, as well as the continuation of health and welfare coverage, accrual of pension rights and credits, and retraining—generally extended to September 30, 1984 (although for any given beneficiary the benefits may have terminated earlier). Eighty-five percent of the state estimate provided by the Employment and Training Administration was allocated to Humboldt County and 15 percent was allocated to Del Norte County. Public service employment benefits - These benefits were provided to unemployed public service workers who were ineligible for extended unemployment compensation under any other federal or state UI program. The program was authorized through 1979, but the extended into 1980. State employment security agencies made the payments and were reimbursed by the federal government. State estimates from the Employment and Training Administration were allocated to counties in proportion to state UI compensation. Transitional benefits - These benefits were provided to jobless workers, newly eligible under the state UI program (agricultural workers, private household workers, and state and local government employees), during the first six months after the extended coverage became effective (January 1, 1978). State employment security agencies made the payments to the jobless workers and were reimbursed by the federal government. State estimates from the Employment and Training Administration were allocated to counties in proportion to state UI compensation. Veterans’ benefits Veterans’ pension and disability benefits - These benefits are received primarily by veterans with service-connected disabilities and by the survivors of military personnel who died of service-connected causes. In addition, these benefits are received by war veterans who are 65 years old or older, who have nonservice-connected disabilities, who are permanently and totally disabled, and who meet specified income requirements. The state and county estimates are based on the data for these benefits from the Geographic Distribution of VA Expenditures (GDX) Report of the Department of Veterans Affairs (DVA). 10 F
11
11 Because the GDX Report has data for counties as well as for states, starting with the estimates for 2009, the GDX data are now used as the allocating series for both counties and states. For earlier years, county
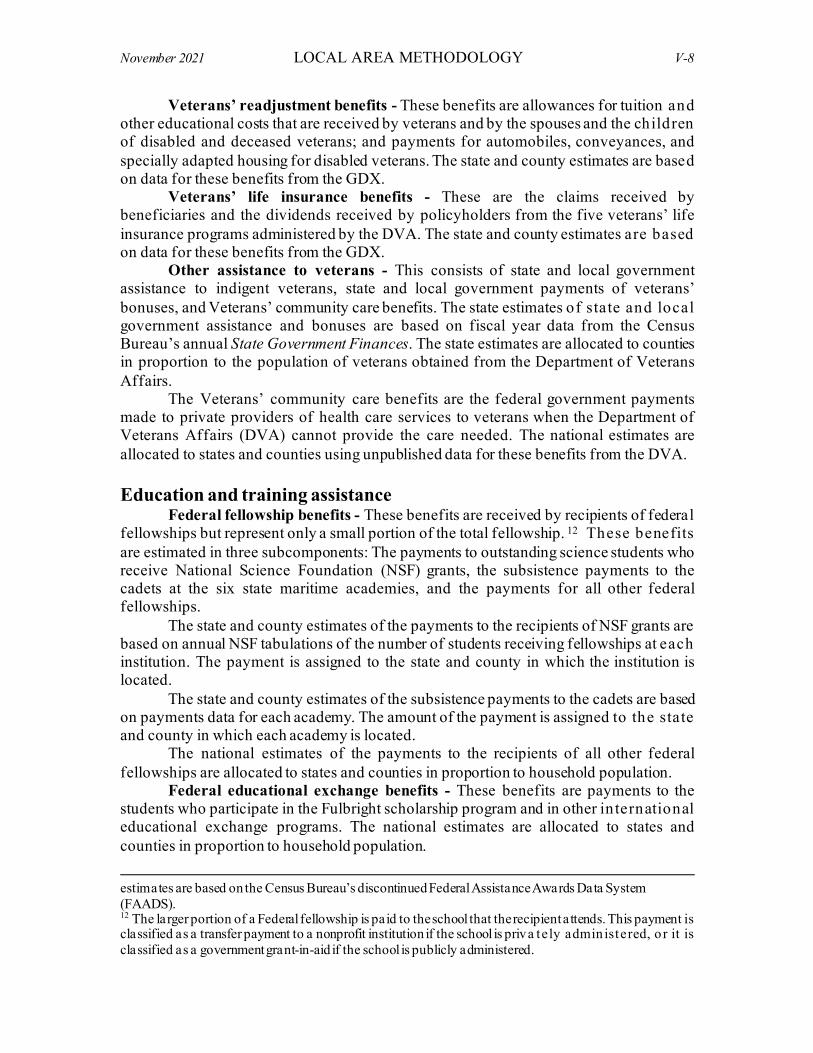
November 2021 LOCAL AREA METHODOLOGY V-8
Veterans’ readjustment benefits - These benefits are allowances for tuition and other educational costs that are received by veterans and by the spouses and the children of disabled and deceased veterans; and payments for automobiles, conveyances, and specially adapted housing for disabled veterans. The state and county estimates are based on data for these benefits from the GDX. Veterans’ life insurance benefits - These are the claims received by beneficiaries and the dividends received by policyholders from the five veterans’ life insurance programs administered by the DVA. The state and county estimates are based on data for these benefits from the GDX.
Other assistance to veterans - This consists of state and local government assistance to indigent veterans, state and local government payments of veterans’ bonuses, and Veterans’ community care benefits. The state estimates of state and local government assistance and bonuses are based on fiscal year data from the Census Bureau’s annual State Government Finances. The state estimates are allocated to counties in proportion to the population of veterans obtained from the Department of Veterans Affairs.
The Veterans’ community care benefits are the federal government payments made to private providers of health care services to veterans when the Department of Veterans Affairs (DVA) cannot provide the care needed. The national estimates are allocated to states and counties using unpublished data for these benefits from the DVA. Education and training assistance Federal fellowship benefits - These benefits are received by recipients of federal fellowships but represent only a small portion of the total fellowship. 11 F
12 These benefits are estimated in three subcomponents: The payments to outstanding science students who receive National Science Foundation (NSF) grants, the subsistence payments to the cadets at the six state maritime academies, and the payments for all other federal fellowships. The state and county estimates of the payments to the recipients of NSF grants are based on annual NSF tabulations of the number of students receiving fellowships at each institution. The payment is assigned to the state and county in which the institution is located. The state and county estimates of the subsistence payments to the cadets are based on payments data for each academy. The amount of the payment is assigned to the state and county in which each academy is located. The national estimates of the payments to the recipients of all other federal fellowships are allocated to states and counties in proportion to household population. Federal educational exchange benefits - These benefits are payments to the students who participate in the Fulbright scholarship program and in other international educational exchange programs. The national estimates are allocated to states and counties in proportion to household population.
estimates are based on the Census Bureau’s discontinued Federal Assistance Awards Data System (FAADS). 12 The larger portion of a Federal fellowship is paid to the school that the recipient attends. This payment is classified as a transfer payment to a nonprofit institution if the school is priva tely admin istered, o r it is classified as a government grant-in-aid if the school is publicly administered.

November 2021 Personal Current Transfer Receipts V-9
Interest on guaranteed student loans – These interest payments are made by the Department of Education to commercial lending institutions on behalf of the individuals who receive low-interest, deferred-payment loans from these institutions in order to pay the expenses of higher education. The national estimates are allocated to states in proportion to the number of individuals enrolled in institutions of higher education located in those states from the Department of Education. The allocator for the county estimates is household population. Higher education student assistance - This federal assistance consists of Pell Grants to students with low incomes for an undergraduate education and, beginning in 2006, Academic Competitiveness Grants and National SMART Grants to students eligible for Pell Grants. The state estimates are based on award year award data from the Department of Education (tabulated by the location of the institution). The county estimates of the benefits, beginning with 2011, are based on fiscal year data from the Department of Treasury’s USASpending.gov website. 1 2 F
13 For earlier years, county estimates are based on the Census Bureau’s discontinued Consolidated Federal Funds Report (CFFR).
Job Corps benefits - These benefits are primarily the allowances for living expenses received by economically disadvantaged individuals who are between the ages of 16 and 21 and who are enrolled in the designated vocational and educational training programs. These benefits also include the adjustment allowances received by trainees upon the successful completion of their training. The state estimates are based on calendar year tabulations of the amount of allowances and allotments disbursed to the enrollees; the tabulations are from the Employment and Training Administration of the Department of Labor. The state estimates are allocated to counties in proportion to household population. State educational assistance - These benefits consist of educational assistance provided by states to individuals for tuition and other educational expenses not including loans. The national and state estimates are based on data published by the Census Bureau’s annual State Government Finances. The state estimates are allocated to counties in proportion to household population. Other transfer receipts of individuals from governments Compensation of survivors of public safety officers - These are payments to the survivors of state and local government employees, such as police officers and fire fighters, who are killed in the line of duty; the payments are made under a federal program. In 1988, the payment was $100,000. Since 1988, it has been $100,000 plus an allowance for the increase in consumer prices. The state estimates are based on fiscal year data from the Census Bureau’s discontinued Consolidated Federal Funds Report (CFFR). The county allocator is the number of claims by county from the same tabulations. Compensation of victims of crime - This compensation consists of payments to crime victims and to vendors on behalf of crime victims. The national estimates of total compensation are allocated to states in proportion to data provided by the Office of
13 The fiscal year data is available by the nine-digit ZIP codes associated with the Pell Grant recipients’ schools and the amount of the grants disbursed to their schools. BEA converts the data to calendar years and sums the ZIP codes to counties.

November 2021 LOCAL AREA METHODOLOGY V-10
Victims of Crime of the Department of Justice. The state estimates are allocated to counties in proportion to household population. Alaska Permanent Fund benefits - These benefits are the disbursements of property income to the residents of Alaska from the Alaska Permanent Fund. The fund, which is derived from oil revenue, pays a portion of its net property income to every resident. The state estimate is the amount that is paid and that is reported by the state. The state estimate is allocated to the boroughs and Census areas in proportion to household population. Disaster relief benefits - These benefits are transient accommodations reimbursements to the victims of disasters, such as hurricanes and earthquakes, from the Federal Emergency Management Agency. The national estimates are allocated to states and counties in proportion to household population.1 3 F
14 Radiation exposure compensation - These are payments made under the Radiation Exposure Compensation Act, which offers compensation to individuals exposed to radiation released during above-ground nuclear weapons tests and uranium mining. The state estimates are based on direct data from the Department of Justice. The state estimates are allocated to counties in proportion to household population. Japanese interns redress benefits - These benefits, which were made from 1990 to 1997, are payments to the American citizens of Japanese descent who were interned during World War II. The state and county estimates are based on tabulations of these payments by ZIP code area from the Department of Justice. The ZIP code tabulations were converted to counties by BEA. Anti-terrorism judgment receipts - These are payments from the U.S. Treasury to satisfy certain court judgments against countries found to have sponsored terrorism. The national estimates are allocated to states and counties in proportion to household population. Compensation of victims of September 11 - These payments are from a voluntary, federally-funded program that provides compensation to eligible individuals or relatives of individuals who were killed or physically injured as a result of the terrorist-related aircraft crashes of September 11, 2001. National estimates are allocated to states and counties in proportion to an Associated Press list of confirmed dead. Bureau of Indian Affairs benefits - These benefits are payments to American Indians for educational and social services that are not available to them from state or local agencies. The state estimates are based on data for these payments from the Bureau of Indian Affairs. The state estimates are allocated to counties in proportion to Census Bureau estimates of the “American Indian and Alaska Native Alone” population.
TV converter box coupons - These coupons, worth $40 each toward the purchase of up to two digital-to-analog converter boxes, were available upon request to all U.S. households. State and county estimates are based on a National Telecommunications and Information Administration report of number of coupons requested by state and 5-digit ZIP code.
14 The unusually high estimate for 2005 reflects billions of dollars distributed by FEMA directly to the victims of Hurricanes Katrina, Rita, and Wilma. The assistance is largely attributed to Katrina victims and a portion of that estimate was distributed to all states based on the Current Location Report f rom FEMA. County estimates were based on FEMA data on individual assistance and Flo rida Of fice o f I nsurance Regulations data on claims. Parish estimates were based on FEMA data on individual assistance a djusted for population changes.

November 2021 Personal Current Transfer Receipts V-11
American Recovery and Reinvestment Act of 2009 (ARRA) Federal additional compensation for unemployment - These receipts are an additional $25 weekly for beneficiaries of state and federal unemployment compensation. National estimates are allocated to states based on payment data reported to recovery.gov by the Labor Department’s Employment and Training Administration. The state estimates are allocated to counties in proportion to the annual average number of unemployed persons from the Local Area Unemployment Statistics program of the Bureau of Labor Statistics (BLS). ARRA COBRA premium reduction - This benefit for certain unemployed individuals is a 65 percent subsidy of the premium for health care insurance provided under the Consolidated Omnibus Budget Reconciliation Act (COBRA). National estimates are allocated to states in proportion to the number of unemployed persons covered by unemployment insurance programs as reported by Employment and Training Administration. The state estimates are allocated to counties in proportion to the annual average number of unemployed persons from the Local Area Unemployment Statistics program of the Bureau of Labor Statistics (BLS). ARRA Economic Recovery lump sum - This benefit consists of a $250 lump sum provided to recipients of Social Security, Supplemental Security Income, Veterans’ Pensions and Railroad Retirement benefits. National estimates for each type of beneficiary are allocated to states in proportion to the number of beneficiaries as reported by the administering agencies. The state estimates for Social Security, Supplemental Security Income and Railroad Retirement recipients are allocated to counties in proportion to the number of beneficiaries as reported by the administering agencies. The distribution of the state estimates for Veterans Recipients is based on the county estimates of Veterans’ pension and disability benefits.
ARRA Making Work Pay tax credit - This is a refundable federal income tax credit of up to $400 for working individuals and $800 for married taxpayers filing joint returns. The state estimates are based on data from the Internal Revenue Service’s Historic Table 2 published in the SOI Bulletin. State estimates are allocated to counties based on the tabulations, by ZIP code, from the Internal Revenue Service, of the total number of returns. The IRS tabulations were converted to counties by BEA. 1 4 F
15 ARRA Government Retiree tax credit - This is a refundable one-time federal
income tax credit of $250 available in 2009 for certain government retirees who receive a pension from work and are not covered by Social Security. This one-time credit is taken on the 2009 income tax return filed in 2010 and is a reduction to any Making Work Pay tax credit. The state estimates are based on data from the Internal Revenue Service’s Historic Table 2 published in the SOI Bulletin. State estimates are allocated to counties based on the tabulations, by ZIP code, from the Internal Revenue Service, of the total number of returns. The IRS tabulations were converted to counties by BEA. 1 5 F
16 American Opportunity tax credit (AOTC) - This refundable tax credit, initially authorized under the American Recovery and Reinvestment Act of 2009 (ARRA), is a temporary modification of the Hope Credit, beginning with tax year 2009. The state estimates are based on data from the Internal Revenue Service’s Historic Table 2 published in the SOI Bulletin. State estimates are allocated to counties based on the
15 See footnote 7. 16 See footnote 7.
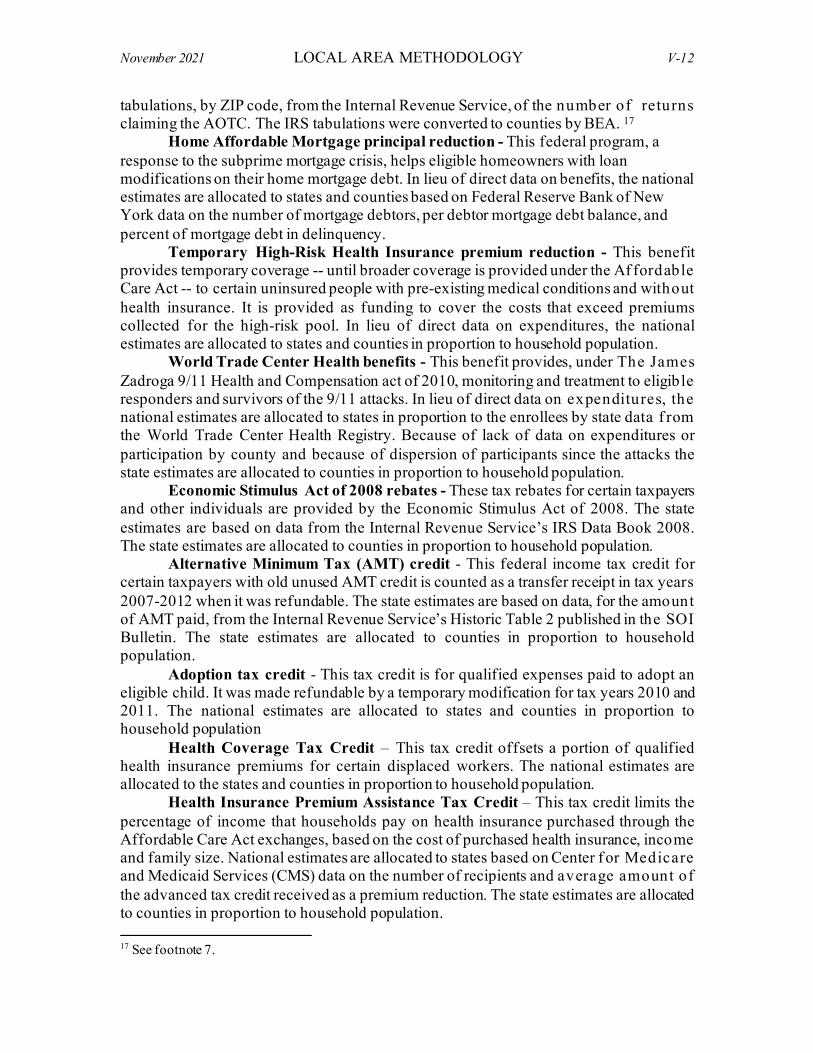
November 2021 LOCAL AREA METHODOLOGY V-12
tabulations, by ZIP code, from the Internal Revenue Service, of the number of returns claiming the AOTC. The IRS tabulations were converted to counties by BEA. 1 6 F
17 Home Affordable Mortgage principal reduction - This federal program, a
response to the subprime mortgage crisis, helps eligible homeowners with loan modifications on their home mortgage debt. In lieu of direct data on benefits, the national estimates are allocated to states and counties based on Federal Reserve Bank of New York data on the number of mortgage debtors, per debtor mortgage debt balance, and percent of mortgage debt in delinquency.
Temporary High-Risk Health Insurance premium reduction - This benefit provides temporary coverage -- until broader coverage is provided under the Af fordable Care Act -- to certain uninsured people with pre-existing medical conditions and without health insurance. It is provided as funding to cover the costs that exceed premiums collected for the high-risk pool. In lieu of direct data on expenditures, the national estimates are allocated to states and counties in proportion to household population.
World Trade Center Health benefits - This benefit provides, under The James Zadroga 9/11 Health and Compensation act of 2010, monitoring and treatment to eligible responders and survivors of the 9/11 attacks. In lieu of direct data on expenditures, the national estimates are allocated to states in proportion to the enrollees by state data f rom the World Trade Center Health Registry. Because of lack of data on expenditures or participation by county and because of dispersion of participants since the attacks the state estimates are allocated to counties in proportion to household population. Economic Stimulus Act of 2008 rebates - These tax rebates for certain taxpayers and other individuals are provided by the Economic Stimulus Act of 2008. The state estimates are based on data from the Internal Revenue Service’s IRS Data Book 2008. The state estimates are allocated to counties in proportion to household population.
Alternative Minimum Tax (AMT) credit - This federal income tax credit for certain taxpayers with old unused AMT credit is counted as a transfer receipt in tax years 2007-2012 when it was refundable. The state estimates are based on data, for the amount of AMT paid, from the Internal Revenue Service’s Historic Table 2 published in the SOI Bulletin. The state estimates are allocated to counties in proportion to household population.
Adoption tax credit - This tax credit is for qualified expenses paid to adopt an eligible child. It was made refundable by a temporary modification for tax years 2010 and 2011. The national estimates are allocated to states and counties in proportion to household population
Health Coverage Tax Credit – This tax credit offsets a portion of qualified health insurance premiums for certain displaced workers. The national estimates are allocated to the states and counties in proportion to household population.
Health Insurance Premium Assistance Tax Credit – This tax credit limits the percentage of income that households pay on health insurance purchased through the Affordable Care Act exchanges, based on the cost of purchased health insurance, income and family size. National estimates are allocated to states based on Center f or Medicare and Medicaid Services (CMS) data on the number of recipients and average amount of the advanced tax credit received as a premium reduction. The state estimates are allocated to counties in proportion to household population.
17 See footnote 7.

November 2021 Personal Current Transfer Receipts V-13
Cost-Sharing Reduction Subsidy - This subsidy, available to some recipients of Health Insurance Premium Assistance Tax Credits, reduces deductibles, copayments and other out-of-pocket charges incurred while using the health plan. National estimates are allocated to states based on CMS data on the number of enrollees in cost-sharing reduction. The state estimates are allocated to counties in proportion to household population.
Health Benefits for Retired United Mine Workers of America Members -These benefits are the federal government payments made to the United Mine Workers of America (UMWA) retiree health plans to continue the coverage of the retirees of certain bankrupt coal companies. National estimates are allocated to states and counties based on unpublished health benefit expenditure data from the UMWA Health and Retirement Funds. In states where health benefit expenditure data are unavailable at the county level, the state estimates are allocated to counties in proportion to household population.
Economic Impact Payments (EIP) - These benefits, initially established by the Coronavirus Aid, Relief, and Economic Security (CARES) Act, provide direct payments to individuals during the COVID-19 pandemic. The state estimates are based on data on the amount of EIP paid, from the Internal Revenue Service Statistics of Income (SOI) program. The state estimates are allocated to counties based on IRS SOI county income data using the number of returns by filing status within eligible AGI ranges and the number of dependents multiplied by the corresponding EIP payment.
Lost Wages Supplemental Payments - These benefits are payments made by Federal Emergency Management Agency (FEMA) from the Disaster Relief Fund to supplement wages lost because of the COVID-19 pandemic. The state estimates are based on data from FEMA. The state estimates are allocated to counties using BEA county estimates of state unemployment insurance compensation, which are assumed to reflect the distribution of individuals eligible for these payments.
Current Transfer Receipts of Nonprofit Institutions These benefits consist of the payments made by federal, state, and local governments and by businesses to nonprofit organizations that serve individuals. These payments exclude federal government payments for work under research and development contracts. Receipts from the federal government
Paycheck Protection Program loans - These benefits, initially established by the Coronavirus Aid, Relief, and Economic Security (CARES) Act, provide forgivable loans to help small businesses and nonprofit institutions make payroll and cover other expenses. State and county estimates are based on data for PPP loans disbursed by recipient, from the Small Business Administration.
Provider Relief Fund - These payments are made by the Department of Health and Human Services from the Provider Relief Fund (PRF) to hospitals and health care providers during the coronavirus response. This funding supports health care-related expenses or lost revenue attributable to COVID-19 and ensures uninsured Americans can get treatment for COVID-19.The state estimates are based on data for PRF funds

November 2021 LOCAL AREA METHODOLOGY V-14
disbursed by recipient, from the Department of Health and Human Services. The state estimates are allocated to counties in proportion to household population.
Other federal nonprofit payments - These are mainly receipts of private educational institutions on behalf of the recipients of federal fellowships, Pell grants, and other education and training programs. 1 7F
18 They also include receipts of private institutions under National Institutes of Health research initiatives and other programs of the Department of Health and Human Services and under programs of the National Science Foundation, the Corporation for Public Broadcasting, and the Legal Services Corporation. The national estimates of receipts from the federal government are allocated to states and counties in proportion to household population. Receipts from state and local governments
These receipts consist largely of Workforce Investment Act benefits received by private nonprofit institutions that provide job training under a work-study program funded by the federal government (formerly authorized by the Job Training Partnership Act). The national estimates are based on data from the Monthly Treasury Statement. The national estimates are allocated to the states and counties in proportion to household population. Receipts from businesses
These transfer receipts are donations by corporate business to nonprofit institutions serving households. The national estimates are allocated to states and counties in proportion to household population.
Current Transfer Receipts of Individuals from Businesses BP oil spill settlement receipts
These are receipts of individuals from BP (either directly or from a $20 billion escrow account) for losses from the oil spill in the Gulf of Mexico that began in April 2010. State estimates and county estimates are based on claims data from the Gulf Coast Claims Facility. Other transfer receipts of individuals from businesses
These mostly consist of receipts from insurance companies (commercial automobile liability, medical malpractice, and net insurance settlements), corporate cash prizes, business losses due to fraud and unrecovered thefts, and receipts f rom personal injury trust funds. Net insurance settlements are actual insured losses (or claims payable) less a normal level of losses1 8F
19. The national estimates are allocated to states and counties in proportion to household population.
18 These receipts exclude payments to private educational institutions for research and development under federal contracts, which are treated as government purchases. 19 See Brent R. Moulton and Eugene P. Seskin, “Preview of the 2003 Comprehensive Revision of the National Income and Product Accounts: Changes in Definitions and Classifications,” Survey of Current Business 83 (June 2003):17-34

Personal income 19,607,447 100.0Personal current transfer receipts 4,241,091 21.6 Current transfer receipts of individuals from governments 4,050,252 20.7 Retirement and disability insurance benefits 1,113,849 5.7 Social Security benefits 1,077,928 5.5 Excluding Social Security benefits 35,921 0.2 Railroad retirement and disability benefits 13,126 0.1 Workers' compensation 12,102 0.1 Other government retirement and disability insurance benefits 1/ 10,693 0.1 Medical benefits 1,504,739 7.7 Medicare benefits 819,202 4.2 Public assistance medical care benefits 2/ 670,395 3.4 Medicaid 3/ 657,258 3.4 Other medical care benefits 4/ 13,137 0.1 Military medical insurance benefits 5/ 15,142 0.1 Income maintenance benefits 302,583 1.5 Supplemental Security Income (SSI) benefits 57,932 0.3 Earned Income Tax Credit (EITC) 67,150 0.3 Supplemental Nutrition Assistance Program (SNAP) 83,766 0.4 Other income maintenance benefits 93,735 0.5 Family assistance 6/ 20,926 0.1 Excluding family assistance 7/ 72,809 0.4 Unemployment insurance compensation 536,927 2.7 State unemployment insurance compensation 535,935 2.7 Excluding state unemployment insurance compensation 992 <0.1 Unemployment compensation for Federal civilian employees (UCFE) 223 <0.1 Unemployment compensation for railroad employees 210 <0.1 Unemployment compensation for veterans (UCX) 239 <0.1 Other unemployment compensation 8/ 320 <0.1 Veterans' benefits 145,543 0.7 Veterans' pension and disability benefits 112,009 0.6 Veterans' readjustment benefits 9/ 10,581 0.1 Veterans' life insurance benefits 821 <0.1 Other assistance to veterans 10/ 22,132 0.1 Education and training assistance 11/ 71,941 0.4 Other transfer receipts of individuals from governments 12/ 374,670 1.9 Current transfer receipts of nonprofit institutions 155,798 0.8 Receipts from the Federal government 120,580 0.6 Receipts from state and local governments 10,391 0.1 Receipts from businesses 24,827 0.1 Current transfer receipts of individuals from businesses 13/ 35,041 0.2
Millions of dollars
Percent of personal income
Table H.--Components of Personal Current Transfer Receipts, United States, 2020

Addenda: Refundable tax credits 14/ 430,579 2.2 Earned Income Tax Credit (EITC) 15/ 67,150 0.3 Additional Child Tax Credit 16/ 30,162 0.2 Other refundable tax credits 17/ 333,267 1.7
Footnotes
10/ Consists largely of state and local government payments to veterans and Veterans Choice and VA Community Care benefits.11/ Consists largely of federal fellowship payments (National Science Foundation fellowships and traineeships, subsistence payments to state maritime academy cadets, and other federal fellowships), interest subsidy on higher education loans, Pell Grants, Job Corps payments, education exchange payments, and state education assistance payments.12/ Consists largely of other refundable tax credits (see footnote 17 for list of other refundable tax credits); Bureau of Indian Affairs payments; Alaska Permanent Fund dividend payments; compensation of survivors of public safety officers; compensation of victims of crime; disaster relief payments; compensation for Japanese internment; the American Recovery and Reinvestment Act of 2009 funded Federal Additional Compensation for unemployment, COBRA premium reduction; Economic Recovery lump sum payment; ACA cost sharing reductions and other special payments to individuals.13/ Consists of personal injury payments to individuals other than employees and other business transfer payments.
9/ Consists largely of veterans' readjustment benefit payments, educational assistance to spouses and children of disabled or deceased veterans, payments to paraplegics, and payments for autos and conveyances for disabled veterans.
1/ Consists largely of temporary disability payments, pension benefit guaranty payments, black lung payments, and Panama Canal construction annuity payments.2/ Consists of Medicaid, beginning in 1966, and other medical vendor payments.3/ Consists of Medicaid and the Children's Health Insurance Program (CHIP) expansion under title XIX of the Social Security Act.4/ Consists of the Children's Health Insurance Program (CHIP) under title XXI of the Social Security Act and general medical assistance.5/ Consists of payments made under the TRICARE Program (formerly called CHAMPUS) for the medical care of dependents of active duty military personnel and of retired military personnel and their dependents at nonmilitary medical facilities.6/ Through 1995, consists of emergency assistance and Aid to Families with Dependent Children (ADFC). Beginning with 1998, consists of benefits-- generally known as Temporary Assistance for Needy Families (TANF)-- provided under the Personal Responsibility and Work Opportunity Reconciliation Act of 1996. For 1996-97, consists of payments under all three of these programs.
7/ Consists largely of general assistance; expenditures for food under the Special Supplemental Nutrition Program for Women, Infants, and Children (WIC); Other Needs Assistance; refugee assistance; foster home care and adoption assistance; Additional Child Tax Credits; and energy assistance.8/ Consists of Trade Adjustment Assistance, Redwood Park benefit payments, public service employment benefit payments, and transitional benefit payments.

16/ Included in SAINC35 line 2342.17/ Included in SAINC35 line 2700. Other refundable tax credits consist of American Opportunity Tax Credit (2010-2019), Economic Stimulus Act Rebate (2008-2010), Making Work Pay Tax Credit (2009-2013), Government Retiree Tax Credit (2010), Adoption Tax Credit (2011-2015), Health Coverage Tax Credit (2003-2019), Health Insurance Premium Assistance Tax Credit (2014-2019), and Alternative Minimum Tax Credit (2008-2019). Values shown in parenthesis following the credit name indicate years in which the refundable tax credit contributes to series total.
14/ Refundable tax credits are already included in the lines and totals above. Refundable tax credits Include the amounts by which federal refundable tax credits reduce personal current tax liabilities and liabilities to pay contributions for government social insurance as well as the outlays that are distributed when the amount of federal refundable tax credits exceeds an individual's federal tax liabilities.15/ Same as SAINC35 line 2320.

VI. CONTRIBUTIONS FOR GOVERNMENT SOCIAL INSURANCE
Contributions for government social insurance consist of employer contributions for government social insurance and employee and self-employed contributions for government social insurance (formerly called personal contributions for social insurance). It is deducted from earnings by place of work in the calculation of personal income. Because most social insurance funds are trust funds with assets that cannot be used for purposes other than those specified by statute or trust agreement, payments to these funds are classified as contributions rather than taxes. Contributions for government social insurance amounted to 11.0 percent of earnings by place of work at the national level in 2020 (table I). Employer contributions for government social insurance were 45.5 percent of the total, while employee and self-employed contributions for government social insurance made up the other 54.5 percent in 2020.
Employer Contributions for Government Social Insurance Employer contributions for government social insurance amounted to 5.0 percent of earnings by place of work in 2020 (table I). These contributions are a component of supplements to wages and salaries. A complete description of these contributions and the methodology employed to estimate them are presented in Chapter II Compensation.
Employee and Self-employed Contributions for Government Social Insurance
Employee and self-employed contributions for government social insurance consist of payments by employees, by the self-employed, and by other individuals who participate in the following programs: Old-age, Survivors, and Disability Insurance (OASDI); Hospital Insurance (HI, or Medicare Part A); Supplementary Medical Insurance (Medicare Parts B and D); railroad retirement; state unemployment insurance (UI); temporary disability insurance; and veterans’ life insurance. These contributions amounted to 6.0 percent of earnings by place of work at the national level in 2020 (table I). Contributions of employees—like their payments of income taxes on wages and salaries—are withheld by their employers from their paychecks. These contributions include the payments that are sometimes made by employers on behalf of their employees (that is, the payments that are customarily made by the employee and that under special arrangement are made by the employer). The self-employed make their contributions with their quarterly payments of estimated federal individual income taxes or annually with their federal income tax returns.

November 2021 LOCAL AREA METHODOLOGY VI-2
County contributions data are not available for any of the programs; therefore, the state estimates of these contributions are allocated to counties by related data:
• State estimates of employee contributions to OASDI and HI for private employees excluding farm and railroad employees, federal civilian employees, active-duty military, and state and local government employees are allocated to counties using the corresponding wages and salaries of those groups of employees.
• State estimates of self-employed contributions to OASDI and HI are allocated to counties using nonfarm proprietors’ income.
• State estimates of contributions to railroad retirement are allocated to counties using wages and salaries of railroad employees.
• The 1991-2020 state estimates of contributions for Supplementary Medical Insurance (Medicare Parts B and D) are allocated to counties by tabulations of the number of persons (both the disabled and the aged) enrolled in the program f rom the Centers for Medicare and Medicaid Services (formerly the Health Care Financing Administration).
• State estimates of contributions for veterans’ life insurance are allocated to counties using the 2006-2010 American Community Survey 5-year estimates of the veteran population, centered on 2008. This allocator is held constant for subsequent years. State estimates of contributions for veterans’ life insurance f or prior years are allocated to counties using the veteran population from the decennial Census of Population. Linear interpolation is used for other years.
• State estimates of employee contributions for State UI are allocated to counties in proportion to the BEA estimates of wage and salary employment, beginning with 1969. Although employee contributions are a fixed percentage of wages, the taxable wage base on which the contributions are paid is generally low. Most employees are likely to contribute similar amounts, so employment is likely to be a better allocator than wages. Employees contribute to State UI only in Alabama (1969-70, 1975-1985), Alaska and New Jersey (1969-2014), and Pennsylvania (1984-88, 1992-1996, and 2003-2020).
• State estimates of contributions for temporary disability insurance are also allocated to counties in proportion to BEA estimates of wage and salary employment. Employees contribute to this program only in California, New Jersey, and Rhode Island.
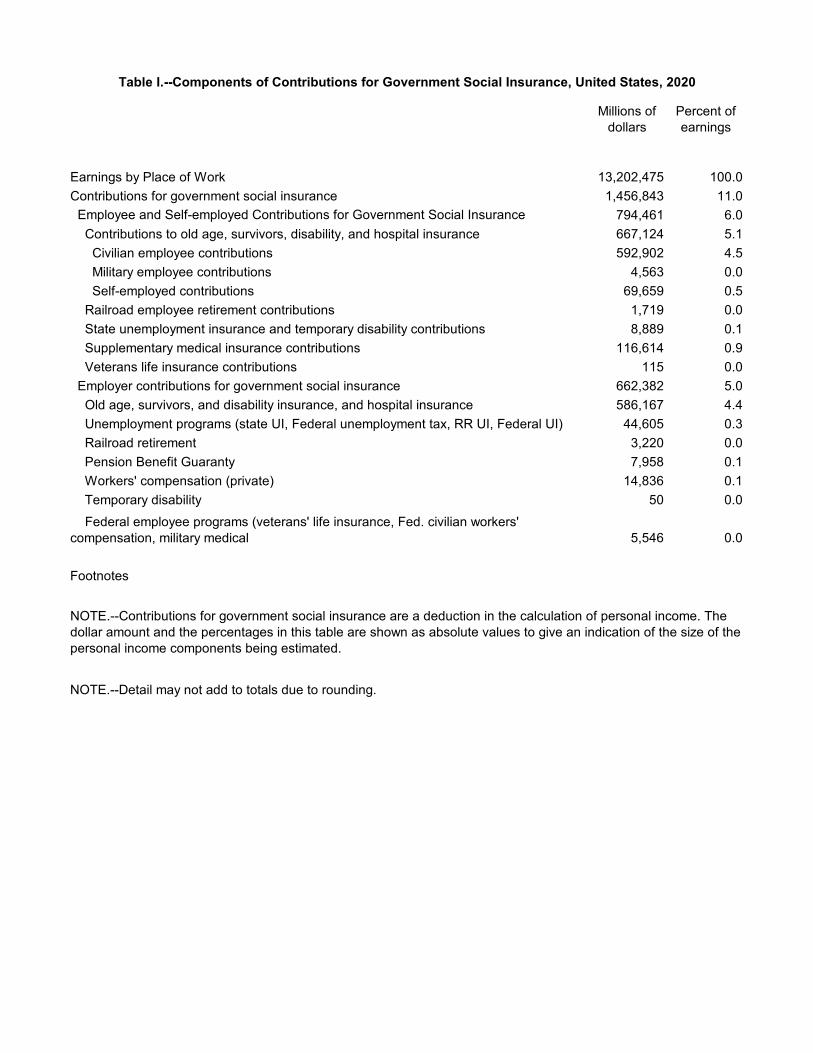
Earnings by Place of Work 13,202,475 100.0Contributions for government social insurance 1,456,843 11.0 Employee and Self-employed Contributions for Government Social Insurance 794,461 6.0 Contributions to old age, survivors, disability, and hospital insurance 667,124 5.1 Civilian employee contributions 592,902 4.5 Military employee contributions 4,563 0.0 Self-employed contributions 69,659 0.5 Railroad employee retirement contributions 1,719 0.0 State unemployment insurance and temporary disability contributions 8,889 0.1 Supplementary medical insurance contributions 116,614 0.9 Veterans life insurance contributions 115 0.0 Employer contributions for government social insurance 662,382 5.0 Old age, survivors, and disability insurance, and hospital insurance 586,167 4.4 Unemployment programs (state UI, Federal unemployment tax, RR UI, Federal UI) 44,605 0.3 Railroad retirement 3,220 0.0 Pension Benefit Guaranty 7,958 0.1 Workers' compensation (private) 14,836 0.1 Temporary disability 50 0.0
5,546 0.0
Footnotes
NOTE.--Detail may not add to totals due to rounding.
Millions of dollars
Percent of earnings
Federal employee programs (veterans' life insurance, Fed. civilian workers' compensation, military medical
NOTE.--Contributions for government social insurance are a deduction in the calculation of personal income. The dollar amount and the percentages in this table are shown as absolute values to give an indication of the size of the personal income components being estimated.
Table I.--Components of Contributions for Government Social Insurance, United States, 2020

VII. RESIDENCE ADJUSTMENT Personal income is a measure of income by place of residence. When the source data used to estimate components of personal income are not recorded by place of residence, BEA must first adjust them to a place-of-residence basis. For some components of personal income, the residence adjustment is discussed along with the source data and the estimation methodology. The methods used to adjust source data reported by place of work, however, are applied to multiple components of personal income—wages and salaries, supplements to wages and salaries, and contributions for government social insurance—and so are discussed here in a separate chapter. In addition to publishing net earnings on a place of residence basis, BEA publishes earnings and its components on a place of work basis. The difference is also published as a separate component of state and local area personal income called the adjustment for residence. For the nation, the residence adjustment has little impact on personal income. It is the net of income flows associated with U.S. residents working in Canada or Mexico less the flows of Canadian and Mexican residents working in the United States, plus income received by U.S. residents who work for International Organizations and foreign governments. For some states and counties, the residence adjustment is considerably larger. Correctly assigning the place of residence of the recipient of income is especially important when metropolitan areas extend across state boundaries (for example, the Washington-Baltimore-Arlington, DC-MD-VA-WV-PA Combined Statistical Area). In 2020, the adjustment for residence as a percentage of earnings by place of work was -51.1 percent for the District of Columbia, 10.2 percent for Maryland, 5.5 percent for Virginia, but less than 0.1 percentage point for the nation. BEA’s concept of residence as it relates to state and county personal income refers to the location where the income to be measured is received, rather than to “usual,” “permanent,” or “legal” residence. This definition of residence differs from that used by the Census Bureau, mainly in the treatment of migrant, seasonal, and short-term workers. For example, the residence of seasonal migrant workers is sometimes reported to the Census Bureau as their usual place of residence rather than the state in which they are living and working on April 1 when the decennial Census of Population is taken. Accordingly, for state and county personal income, the residence of military personnel is the state and county in which they live while they are on military assignment, not their permanent or legal state of residence. The income of military personnel on foreign assignment is excluded from the state and local area personal income estimates because their residence is outside of the territorial limits of the United States. The adjustment for residence is prepared by first calculating a net residence adjustment for inter-county commuting flows and then adding the compensation inflows and subtracting the compensation outflows associated with international border workers. The state estimates of residence adjustment are summations of the residence adjustments for all of the counties within the state.
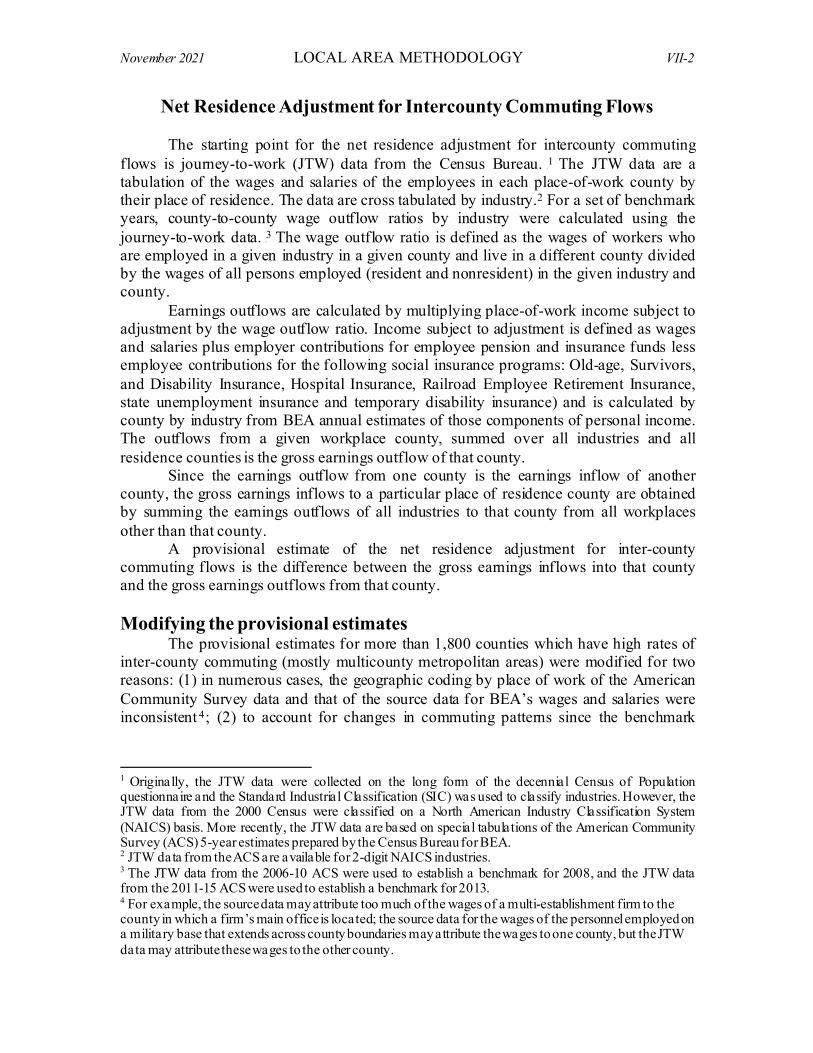
November 2021 LOCAL AREA METHODOLOGY VII-2
Net Residence Adjustment for Intercounty Commuting Flows The starting point for the net residence adjustment for intercounty commuting flows is journey-to-work (JTW) data from the Census Bureau. 0F
1 The JTW data are a tabulation of the wages and salaries of the employees in each place-of-work county by their place of residence. The data are cross tabulated by industry. 1F
2 For a set of benchmark years, county-to-county wage outflow ratios by industry were calculated using the journey-to-work data. 2 F
3 The wage outflow ratio is defined as the wages of workers who are employed in a given industry in a given county and live in a different county divided by the wages of all persons employed (resident and nonresident) in the given industry and county. Earnings outflows are calculated by multiplying place-of-work income subject to adjustment by the wage outflow ratio. Income subject to adjustment is defined as wages and salaries plus employer contributions for employee pension and insurance funds less employee contributions for the following social insurance programs: Old-age, Survivors, and Disability Insurance, Hospital Insurance, Railroad Employee Retirement Insurance, state unemployment insurance and temporary disability insurance) and is calculated by county by industry from BEA annual estimates of those components of personal income. The outflows from a given workplace county, summed over all industries and all residence counties is the gross earnings outflow of that county. Since the earnings outflow from one county is the earnings inflow of another county, the gross earnings inflows to a particular place of residence county are obtained by summing the earnings outflows of all industries to that county from all workplaces other than that county. A provisional estimate of the net residence adjustment for inter-county commuting flows is the difference between the gross earnings inflows into that county and the gross earnings outflows from that county. Modifying the provisional estimates The provisional estimates for more than 1,800 counties which have high rates of inter-county commuting (mostly multicounty metropolitan areas) were modified for two reasons: (1) in numerous cases, the geographic coding by place of work of the American Community Survey data and that of the source data for BEA’s wages and salaries were inconsistent3 F
4; (2) to account for changes in commuting patterns since the benchmark
1 Originally, the JTW data were collected on the long form of the decennial Census of Population questionnaire and the Standard Industrial Classification (SIC) was used to classify industries. However, the JTW data from the 2000 Census were classified on a North American Industry Classification System (NAICS) basis. More recently, the JTW data are based on special tabulations of the American Community Survey (ACS) 5-year estimates prepared by the Census Bureau for BEA. 2 JTW data from the ACS are available for 2-digit NAICS industries. 3 The JTW data from the 2006-10 ACS were used to establish a benchmark for 2008, and the JTW data from the 2011-15 ACS were used to establish a benchmark for 2013. 4 For example, the source data may attribute too much of the wages of a multi-establishment firm to the county in which a firm’s main office is located; the source data for the wages of the personnel employed on a military base that extends across county boundaries may attribute the wages to one county, but the JTW data may attribute these wages to the other county.
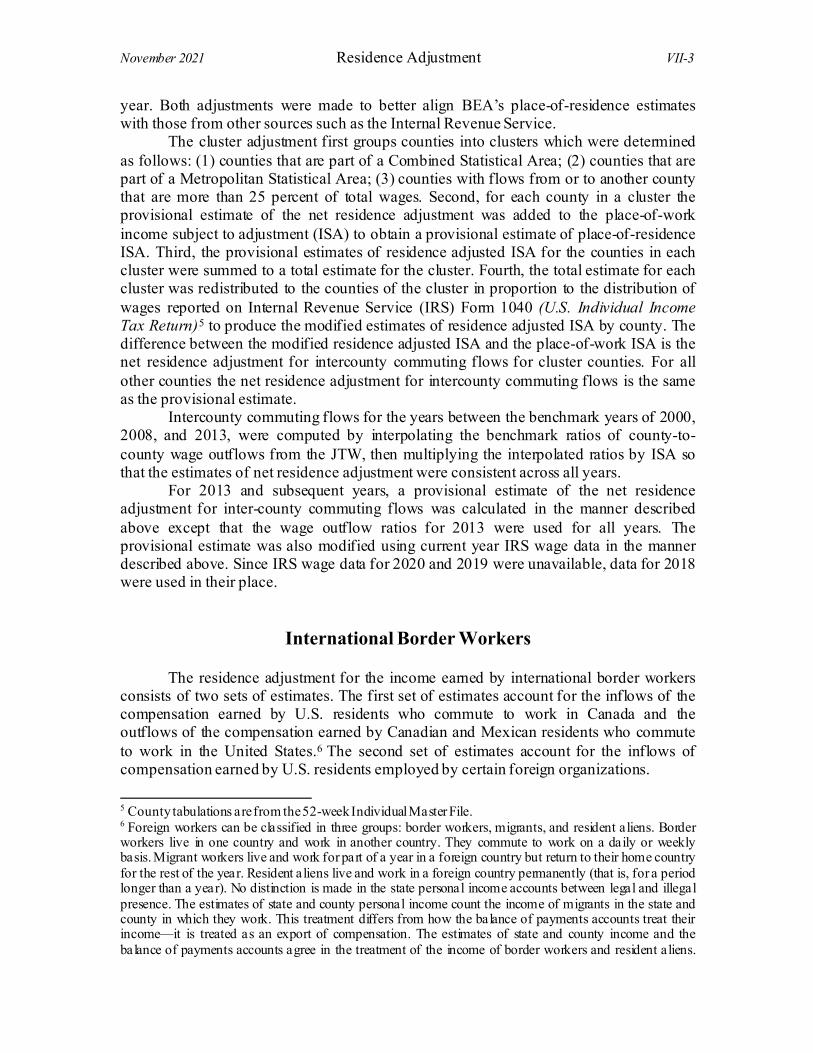
November 2021 Residence Adjustment VII-3
year. Both adjustments were made to better align BEA’s place-of-residence estimates with those from other sources such as the Internal Revenue Service. The cluster adjustment first groups counties into clusters which were determined as follows: (1) counties that are part of a Combined Statistical Area; (2) counties that are part of a Metropolitan Statistical Area; (3) counties with flows from or to another county that are more than 25 percent of total wages. Second, for each county in a cluster the provisional estimate of the net residence adjustment was added to the place-of-work income subject to adjustment (ISA) to obtain a provisional estimate of place-of-residence ISA. Third, the provisional estimates of residence adjusted ISA for the counties in each cluster were summed to a total estimate for the cluster. Fourth, the total estimate for each cluster was redistributed to the counties of the cluster in proportion to the distribution of wages reported on Internal Revenue Service (IRS) Form 1040 (U.S. Individual Income Tax Return)4 F
5 to produce the modified estimates of residence adjusted ISA by county. The difference between the modified residence adjusted ISA and the place-of-work ISA is the net residence adjustment for intercounty commuting flows for cluster counties. For all other counties the net residence adjustment for intercounty commuting flows is the same as the provisional estimate.
Intercounty commuting flows for the years between the benchmark years of 2000, 2008, and 2013, were computed by interpolating the benchmark ratios of county-to-county wage outflows from the JTW, then multiplying the interpolated ratios by ISA so that the estimates of net residence adjustment were consistent across all years. For 2013 and subsequent years, a provisional estimate of the net residence adjustment for inter-county commuting flows was calculated in the manner described above except that the wage outflow ratios for 2013 were used for all years. The provisional estimate was also modified using current year IRS wage data in the manner described above. Since IRS wage data for 2020 and 2019 were unavailable, data for 2018 were used in their place.
International Border Workers The residence adjustment for the income earned by international border workers consists of two sets of estimates. The first set of estimates account for the inflows of the compensation earned by U.S. residents who commute to work in Canada and the outflows of the compensation earned by Canadian and Mexican residents who commute to work in the United States. 5F
6 The second set of estimates account for the inflows of compensation earned by U.S. residents employed by certain foreign organizations.
5 County tabulations are from the 52-week Individual Master File. 6 Foreign workers can be classified in three groups: border workers, migrants, and resident aliens. Border workers live in one country and work in another country. They commute to work on a daily or weekly basis. Migrant workers live and work for part of a year in a foreign country but return to their home country for the rest of the year. Resident aliens live and work in a foreign country permanently (that is, for a period longer than a year). No distinction is made in the state personal income accounts between legal and illegal presence. The estimates of state and county personal income count the income of migrants in the state and county in which they work. This treatment differs from how the balance of payments accounts treat their income—it is treated as an export of compensation. The estimates of state and county income and the balance of payments accounts agree in the treatment of the income of border workers and resident aliens.
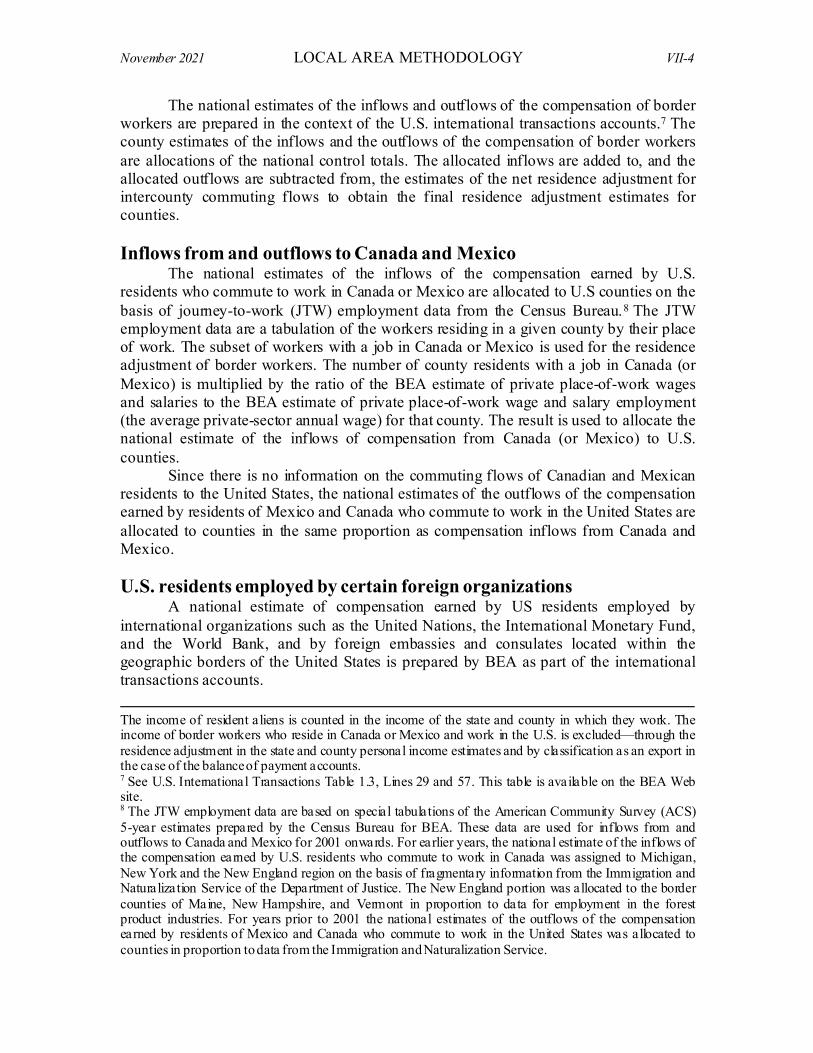
November 2021 LOCAL AREA METHODOLOGY VII-4
The national estimates of the inflows and outflows of the compensation of border workers are prepared in the context of the U.S. international transactions accounts.6 F
7 The county estimates of the inflows and the outflows of the compensation of border workers are allocations of the national control totals. The allocated inflows are added to, and the allocated outflows are subtracted from, the estimates of the net residence adjustment for intercounty commuting flows to obtain the final residence adjustment estimates for counties. Inflows from and outflows to Canada and Mexico
The national estimates of the inflows of the compensation earned by U.S. residents who commute to work in Canada or Mexico are allocated to U.S counties on the basis of journey-to-work (JTW) employment data from the Census Bureau. 7 F
8 The JTW employment data are a tabulation of the workers residing in a given county by their place of work. The subset of workers with a job in Canada or Mexico is used for the residence adjustment of border workers. The number of county residents with a job in Canada (or Mexico) is multiplied by the ratio of the BEA estimate of private place-of-work wages and salaries to the BEA estimate of private place-of-work wage and salary employment (the average private-sector annual wage) for that county. The result is used to allocate the national estimate of the inflows of compensation from Canada (or Mexico) to U.S. counties. Since there is no information on the commuting flows of Canadian and Mexican residents to the United States, the national estimates of the outflows of the compensation earned by residents of Mexico and Canada who commute to work in the United States are allocated to counties in the same proportion as compensation inflows from Canada and Mexico. U.S. residents employed by certain foreign organizations
A national estimate of compensation earned by US residents employed by international organizations such as the United Nations, the International Monetary Fund, and the World Bank, and by foreign embassies and consulates located within the geographic borders of the United States is prepared by BEA as part of the international transactions accounts.
The income of resident aliens is counted in the income of the state and county in which they work. The income of border workers who reside in Canada or Mexico and work in the U.S. is excluded—through the residence adjustment in the state and county personal income estimates and by classification as an export in the case of the balance of payment accounts. 7 See U.S. International Transactions Table 1.3, Lines 29 and 57. This table is available on the BEA Web site. 8 The JTW employment data are based on special tabulations of the American Community Survey (ACS) 5-year estimates prepared by the Census Bureau for BEA. These data are used for inflows from and outflows to Canada and Mexico for 2001 onwards. For earlier years, the national estimate of the inflows of the compensation earned by U.S. residents who commute to work in Canada was assigned to Michigan, New York and the New England region on the basis of fragmentary information from the Immigration and Naturalization Service of the Department of Justice. The New England portion was allocated to the border counties of Maine, New Hampshire, and Vermont in proportion to data for employment in the forest product industries. For years prior to 2001 the national estimates of the outflows of the compensation earned by residents of Mexico and Canada who commute to work in the United States was allocated to counties in proportion to data from the Immigration and Naturalization Service.
November 2021 Residence Adjustment VII-5
Foreign embassies and consulates in the United States are part of the territory of the countries they represent. U.S. residents working for foreign embassies and consulates in the United States are therefore international border workers, that is, persons who live in one country and work in another. The offices of international organizations are treated in a similar fashion, that is, they are treated as if they were located on foreign territory. Therefore, the compensation paid to US residents by these embassies, consulates, and international organizations represent inflows to the US. The national estimate of wage inflows from these foreign organizations is first allocated to twelve very large counties and the District of Columbia in proportion to estimates (from 1968) of the administrative expenditures of these organizations. 8F
9 The administrative expenses series was prepared by BEA. This yields a set of place-of-work estimates. Next, the place-of-work estimates are adjusted for the place of residence of the workers. The place-of-work estimates are multiplied by county-to-county wage outflow ratios (discussed above in the Intercounty Commuting Flows section) to estimate gross wage outflows (and inflows). County estimates of wage inflows from foreign organizations by place of residence are the sum of the place of work estimates and the estimates of the gross wage inflows less the gross wage outflows.
9 The counties are Los Angeles and San Francisco (California); Miami-Dade (Florida); Cook (Illinois); Orleans (Louisiana); Bronx, Kings, New York, Queens, and Richmond (New York); Philadelphia (Pennsylvania); and Harris (Texas).

VIII. EMPLOYMENT
Introduction BEA’s estimates of state and local area employment consist of the number of wage and salary jobs, sole proprietorships, and general partners. The estimates are available annually beginning with 1969. The county employment estimates are a complement to the place-of-work earnings estimates. Earnings is estimated on a place-of-work basis, by North American Industry Classification System (NAICS) three-digit subsector beginning in 2001 and by Standard Industrial Classification (SIC) two-digit industry for 1969 to 2000, and net earnings (net of contributions for government social insurance) is estimated on a place-of-residence basis for the sum of all industries. The employment estimates are designed to conform conceptually and statistically with the place-of-work earnings estimates; the same source data—generally from administrative records—are used for both the earnings and employment estimates whenever possible. The earnings estimates reflect the scale and industrial structure of an area’s economy rather than the income of the area’s residents. Therefore, the employment estimates measure the number of jobs in a county, instead of the number of workers who perform the jobs. The characteristics of the county employment estimates follow from this concept and from the characteristics and limitations of the available source data. The state and local area employment estimates are not fully consistent with the National Income and Product Accounts (NIPA) employment estimates. 0 F
1 The county estimates are prepared only on a full-time and part-time basis, while the NIPA estimates are prepared on both a full-time and part-time basis and on a full-time equivalent basis. The county estimates exclude overseas jobs—mainly federal civilian and military employment of U.S. citizens abroad—and border worker adjustments—the addition of U.S. persons commuting to work abroad and subtraction of foreign commuters and seasonal workers in the United States—that are included in the NIPA estimates. Finally , the county estimates include all sole proprietorships and general partners—approximating a full-time and part-time basis, whereas the NIPA estimates of the number of proprietors count only persons whose principal occupation is their self-employment—approximating a full-time equivalent basis of measurement. Employment estimates measure the number of jobs
Employment can be measured either as a count of workers or as a count of jobs. In the former case, an employed worker is counted only once; in the latter case, all jobs held by the worker are counted. The county employment estimates are a count of the number of jobs, so that, as with the earnings estimates, a worker’s activity in each industry and location of employment is reflected in the measure.
1 The NIPA employment estimates are published in tables 6.4, 6.5, 6.7, and 6.8, which are available on the BEA web site.

November 2021 LOCAL AREA METHODOLOGY VIII-2
Treatment of part-time jobs County employment is estimated on a full-time and part-time basis because of the
limitations of the available source data. County-level data that separate part-time jobs and wages from full-time jobs and wages, which are needed to prepare full-time equivalent measures, are not available. An average earnings measure can be calculated from the BEA county employment and earnings estimates. Average earnings reflect the extent of part-time employment in the given area and industry, as well as more basic factors such as hourly wage rates. Geography
County employment estimates, like wage and salary estimates, are measured by place-of-work—the job location—instead of by place of residence—where the worker lives. Thus, the estimates are more representative of the county’s industrial base than of the activities of the residents of the county. For nonfarm sole proprietors’ employment, the only available annual data are classified by tax filing address, which is usually the filer’s residence. BEA assumes that place-of-work and place-of-residence are identical for nonfarm sole proprietors. Since most farm operators live on or near their land, place of work and place of residence are also identical for farm proprietors. Temporal dimension
The estimates of wage and salary employment are annual averages of 12-monthly observations for the year. This gives a job which lasts only part of the year a lesser weight that a year-round job. In contrast, the estimates of nonfarm proprietors’ employment are counts of the number of proprietors active during any portion of the year. This is because the available source data do not indicate the portion of the year that the businesses are in operation.
Wage and Salary Employment Wage and salary employment is a measure of the average annual number of f ull-time and part-time jobs in each area by place of work. All jobs for which wages and salaries are paid are counted. Although compensation paid to jurors, expert legal witnesses, prisoners, and justices of the peace (for marriage fees), is counted in wages and salaries, these activities are not counted as jobs in wage and salary employment. Corporate directorships are counted as self-employment. The following description of the sources and methods used in estimating wage and salary employment is divided into two sections: Employment in industries covered by unemployment insurance (UI) programs, and employment in industries not covered by UI. 1 F
2
2 The relevant UI programs are state UI, which covers most private sector and state and local government employment, and Unemployment Compensation for Federal Employees. The agency administering the UI program for railroad employees compiles data differently from the state UI p rogram, a nd there is no employment reporting under the UI program for persons leaving the military services; accordingly, railroads and the military services are treated as non-covered industries in the est imation o f local a rea employment.

November 2021 Employment VIII-3
Employment in industries fully covered by the UI programs The estimates of 94.5 percent of wage and salary employment are derived f rom tabulations of 2020 quarterly unemployment insurance (UI) contribution reports (Form ES-202) filed with state employment security agencies (table J). Employers subject to UI laws usually submit reports for each operating establishment, classified by county and industry. However, in some cases, an employer may group very small establishments into a single “statewide” report without county designation. Each quarter, the state employment security agencies submit the tabulations to the Bureau of Labor Statistics (BLS), which provides the data to BEA. The tabulated data (called the Quarterly Census of Employment and Wages, QCEW) consist of monthly employment and quarterly wages by county by NAICS six-digit detail (beginning in 2001) or by SIC four-digit detail (through 2000). 2 F
3 BEA adds several million administrative records received from the states and the District of Columbia to its database annually. The records are checked for major errors by several computerized edit routines. One edit routine analyzes the current quarter county data for invalid industry codes, duplicate records, and records that contain no data. Another edit routine calculates expected county-level average employment and average wages on a quarterly basis, based on percentage changes for that quarter in the previous two years. If the difference between the actual numbers and the estimated numbers exceeds established limits, the record is identified for further review. Anomalies that remain unreconciled after reviewing comments and other supporting data are referred to BLS for further investigation. The basic procedure for preparing the local area estimates of wage and salary employment for each UI-covered industry is to average the 12-monthly QCEW employment observations and to allocate the higher-level geographic total in proportion to the averaged series. However, QCEW employment does not precisely meet the statistical and conceptual requirements for BEA’s employment estimates. Consequently , the data must be adjusted to meet the requirements more closely. The necessary adjustments affect both the industrial and geographic patterns of county employment. Adjustment for industry non-classification - The industry detail of the QCEW tabulations regularly shows minor amounts of employment that have not been assigned to an industry. The industrial classification scheme used by BEA for its estimates does not allow for a not-elsewhere-classified category. Therefore, for each county, the amount of QCEW employment in this category is distributed among the covered industries in proportion to the industry-classified employment. The amounts involved in this adjustment are quite small—about 0.1 percent of total employment nationally. No error is introduced into the total employment estimate for a county because the adjustment involves only an apportionment within the county of the amount reported for that county. Misreporting adjustment - An adjustment is made to the QCEW data for misreporting of private sector employment. In 2020, misreported employment accounted for 0.6 percent of BEA wage and salary employment (table J). The national estimate of
3 The monthly employment observations represent the number of employees receiving wages f o r the pay periods that include the 12th day of the month. The QCEW tabulations reflect the 1972 SIC for years up to 1987, the 1987 SIC for 1988 through 2000 and the 2002 NAICS for years 2001 through 2006. The estimates for 2007-2010 are based on the 2007 NAICS. The estimates for 2011 forward are based on the 2012 NAICS.

November 2021 LOCAL AREA METHODOLOGY VIII-4
misreported employment for each industry is made in two parts: One for the underreporting of employment on UI contribution returns filed by employers and one f or the employment of employers that fail to file UI contribution returns. The data necessary to replicate this methodology below the national level are not available. Instead, the national adjustment for each industry is allocated to the counties in proportion to QCEW employment. Adjustment for statewide reporting - Employment reported for statewide units is allocated to counties in proportion to the distribution of the employment reported by each county. Geographic adjustments for government employment -In several cases, BEA has determined that the QCEW reports attribute government employment to the wrong states or counties; the best available information is used to remedy these deficiencies. Examples of how BEA adjusts the government employment are as follows:
• The QCEW tabulations of federal civilian employment assign all the employment of the U.S. Congress and its staff to the District of Columbia, although members of Congress employ some of their staff in home district offices. BEA assumes that this home district employment accounts for 25 percent of total congressional employment and reassigns that portion of the total to the states in proportion to their congressional representation. No explicit adjustment is made at the county level; in effect, the home district employment is allocated to counties in proportion to QCEW federal employment.
• For the federal sector, detailed civilian employment data available from the Office of Personnel Management (OPM) is used to evaluate the county coding of the corresponding QCEW data and remedy the deficiencies. Prior to 2002, f or New York, BEA allocated the QCEW state employment totals for the Postal Service to counties in proportion to the OPM series for that agency.
• For the non-education component of state government, a comparison of the QCEW data with comparable data from the Census of Population indicated that an excessively large proportion of the QCEW employment was reported in the county of the state capital for six states. For these states—Illinois, Michigan, New Jersey, Rhode Island, Tennessee, and Wisconsin—the state totals of state government non-education employment are allocated to counties in proportion to an unpublished tabulation of the place-of-work segment of the journey-to-work (JTW) decennial Census employment data for 1970, 1980, 1990, with 1990 carried forward to 2000 and all intermediate years interpolated. More recently , a five-year employment compilation of the annual American Community Survey (ACS) JTW employment data are used in the preparation of the county estimates of employment, with 2001-2007 interpolated between the two JTW distributions.
Employment in industries not fully covered by the state UI programs Farms - This industry is only partially covered. Farm employees have mandatory UI coverage or almost complete voluntary coverage in the following states: Arizona, California, Connecticut, Delaware, Florida, Hawaii, Massachusetts, New Jersey, Rhode Island, and Washington. Therefore, county estimates of hired farm employment for these states are derived from QCEW data. For the remaining states, the county estimates of

November 2021 Employment VIII-5
hired farm employment are based on the geographic distribution of the number of hired farm workers who worked 150 days or more reported in Census of Agriculture. Farm labor contractors - This industry is classified in support activities for agriculture and forestry rather than in farms. The UI coverage in Arizona and California is complete enough to permit the use of the QCEW data for both the state and county estimates, but most state UI programs only partially cover this industry. For these states, the county estimates of farm labor contractor employment are based on the geographic distribution of expenditures for contract labor reported in the Census of Agriculture. Railroads - The railroad industry is covered by its own unemployment insurance program, which is administered by the Railroad Retirement Board (RRB), rather than by the state UI system. Data suitable for estimating local area employment of railroads are available from the RRB only on a place-of-residence basis.3 F
4 Because BEA’s employment estimates are designed to conform conceptually and statistically to the place-of-work earnings estimates, the RRB data are adjusted to a place-of-work basis by using journey-to-work data from the 2000 Census of Population. The national totals for all railroad companies combined are allocated to counties in proportion to the adjusted RRB series. Private elementary and secondary schools - Private elementary and secondary schools are treated as a non-covered industry because religiously affiliated elementary and secondary schools, which account for most of the employment in this industry, remain largely outside the scope of the UI program. The state estimates of private elementary and secondary school employment are primarily based on the employment reported annually by the Census Bureau’s County Business Patterns (CBP). The CBP data are tabulated from the administrative records of the social security program—Old-Age, Survivors, Disability, and Hospital Insurance—and are more complete for elementary and secondary schools than the data prepared under the UI program. The social security program, although exempting nonprofit religious organizations—including schools—from mandatory coverage, has elective coverage provisions that have resulted in broad participation among religiously affiliated elementary and secondary schools. In about half of the states, the UI coverage of elementary and secondary schools is complete enough to permit the use of QCEW data as the basis for the county employment estimates. For the other states, the county estimates are based on the best available series of private elementary and secondary school employment chosen from data published by state departments of education, data from the U.S. Department of Education’s survey of private elementary and secondary schools, or data from CBP, which cannot be used more generally because they are frequently suppressed at the county level to prevent disclosures. Religious organizations - The Federal Unemployment Tax Act permits states to exclude religious organizations from mandatory UI coverage. Although most state UI laws do have some provisions for elective coverage, about 11 percent of the national total employment of religious organizations are covered. Therefore, the county estimates of the employment of religious organizations are based on CBP data. The CBP data are adjusted proportionately to sum to the BEA national employment totals for this industry. Private households - For this largely non-covered industry—mainly domestic servants—the national employment estimates are allocated to counties in proportion to the “3-year estimates” of place-of-work private household employment from the
4 The data are converted to counties based on 5-digit ZIP codes.
November 2021 LOCAL AREA METHODOLOGY VIII-6
American Community Survey. Estimates for 2000 and earlier years are based on the Census of Population journey-to-work data Military - County military employment is measured as the number of military personnel assigned to active-duty units that are stationed in the county plus the number of military reserve unit members. The estimates of active-duty employment f or the Army, Air Force, Navy, Marine Corps, and Coast Guard are based on the annual averages of 12-monthly observations, for a given year, from reports received from the Defense Manpower Data Center (DMDC). 4 F
5 Navy personnel assigned to ships and other mobile units and Marines assigned to Fleet Marine Force units are measured according to the units’ home ports rather than their actual locations as of the reporting date. The measure of employment of the military Reserves—including the National Guard—is confined to members of reserve units that meet regularly for training. The state estimates are based on fiscal year—ending September 30—tabulations of military reserve strength provided by the Department of Defense. For consistency with the BEA estimates of military reserve wages, the state totals of military reserve employment are allocated to counties in proportion to household population. 5 F
6 Adjustments for noncovered segments of UI-covered industries - BEA makes adjustments to add the employment of several non-covered segments. If relevant source data are not available, the national adjustments are allocated to states in proportion to the QCEW employment of the affected industry or industries. In all cases, the state adjustments are allocated to counties in proportion to QCEW employment. Examples of BEA adjustments for non-covered segments of UI-covered industries are as follows:
• Some insurance solicitors and real estate agents are omitted from UI coverage because they are paid solely by commissions. The national estimates for these two segments are allocated to states in proportion to QCEW employment in each industry.
• Establishments of railroad carrier affiliates and railway labor organizations are covered by the Railroad Unemployment Insurance system rather than by state UI. The state adjustments are based on data provided by the Railroad Retirement Board.
• Corporate officers in Washington State are omitted from UI coverage. The Washington Employment Security Department provides BEA with estimates of the number of corporate officers by NAICS six digit by county.
• Some nonprofit organizations are exempt from UI coverage because they have fewer than four employees. The national estimates are allocated to states in proportion to the QCEW employment of each industry.
• Students and the spouses of students who are employed by the institutions of higher education in which the students are enrolled are generally omitted from UI coverage. State estimates of the non-covered student employment of private, state government, and local government institutions are based on the differences
5 Coast Guard data are now included with the DMDC report and no longer require a separate report from the Department of Homeland Security. 6 Military reserve wages are estimated directly on a place-of-residence basis because there a re no source data to convert a place-of-work series to a place-of-residence basis for inclusion in personal income. County total population is from the Census Bureau. Household population for counties is calculated a s the difference between the total population and the Census Bureau population in the group quarters estimates.
November 2021 Employment VIII-7
between the relevant QCEW employment data and alternative employment data that include student employment. The alternative data are reported annually by the Census Bureau in County Business Patterns for the private institutions and on the Census Bureau’s Annual Survey of Public Employment and Payroll.
• UI coverage of state and local government employees excludes elected officials, members of the judiciary, and hospital interns. The national estimates are allocated to states in proportion to QCEW state and local government employment.
• Coverage of federal employees under the Unemployment Compensation of Federal Employees (UCFE) program excludes federal employees who work for certain U.S. intelligence agencies. So, adjustments are made in specific geographies to provide complete coverage of all federal civilian employment.
Alternative measures of wage and salary employment Current Employment Statistics - The Bureau of Labor Statistics (BLS)—in cooperation with state employment security agencies—prepares the Current Employment Statistics (CES)—a set of state and local area wage and salary employment estimates—that is similar to the BEA estimates. Both are job-count measures of full-time and part-time employment on a place-of-work basis. The CES estimates are based on a monthly sample survey—using Form BLS-790—of nonagricultural establishments with employees. The sample for UI-covered industries is drawn from all establishments reported in employers’ UI contributions returns, and the monthly sample-based series f or covered industries is benchmarked annually to QCEW employment; thus, both the BEA and the CES series are grounded on the same set of administrative records data. A detailed description of the sampling and estimating methodologies for the CES estimates is presented in the “Explanatory Notes” of BLS’s monthly Employment and Earnings. The CES estimates are timelier than the BEA estimates; preliminary BLS estimates are released with a one-month lag. By contrast, the BEA estimates are prepared only as annual averages and are released at the state level nine months after the reference year. At the county level, the estimates by industry are released 11 months after the reference year. The BEA series is somewhat broader in its coverage than the CES series. The BEA series includes industries—agriculture, forestry, fishing, and hunting; private households; and the military—that CES excludes. 6 F
7 A misreporting adjustment is unique to the BEA series. However, the CES series includes, within the scope of its coverage, all the non-covered segments of UI-covered industries for which BEA makes explicit adjustments. The BEA estimates of wage and salary employment are accompanied by a self-employment series that is consistent with the wage and salary employment series as much as the available source data allow. No self-employment series is available in conjunction with the CES employment estimates. At the national and state levels, the BEA estimates of wage and salary employment are available at the NAICS three-digit subsector beginning with 1998 and by SIC two-digit level for 1969-2000. By contrast, the CES estimates for the nation (in
7 More precisely, the CES excludes all of NAICS sector 11 (agriculture, forestry , f ish ing, a nd hunting) except logging (1133).

November 2021 LOCAL AREA METHODOLOGY VIII-8
Employment and Earnings) are available in more detail: At the state level the CES estimates are presented only at the NAICS sector or SIC division (“one-digit”) level; however, more detailed estimates are available from some of the state employment security agencies. At the county level, the BEA estimates of wage and salary employment are available at the all-industry level, and at the NAICS sector or SIC division level, when combined with BEA’s self-employment estimates. The CES local area estimates are available at the NAICS sector or SIC division level. The BEA estimates are available for almost all counties, and for all county-based metropolitan areas as defined for federal statistical purposes. The local area CES estimates presented in Employment and Earnings are only for the larger metropolitan areas but estimates for smaller metropolitan areas and for counties are available from some of the state employment security agencies. BLS uses the alternative city-and-town definitions of the metropolitan areas in the New England states, while BEA uses the standard county-based metropolitan area definitions. County Business Patterns - Another measure of county employment by place of work is the employment data published in the Census Bureau’s County Business Patterns (CBP). It differs in source data and coverage from BEA’s employment and QCEW employment. The CBP data are derived from Census Bureau business establishment surveys and federal administrative records. The coverage of the CBP data differs from that of the QCEW data primarily because the CBP data exclude most government employees, while the QCEW data cover civilian government employees. 7 F
8 CBP data also exclude several private industries covered at least in part by the QCEW: crop and animal production; rail transportation; insurance and employee benefit funds; trusts, estates, and agency accounts; and private households. However, the CBP data cover the employees of educational institutions, membership organizations, and small nonprofit organizations in other industries more completely than the QCEW data. 8 F
9 In addition, the CBP data reports employment for the month of March only; the QCEW employment data are quarterly and annual averages of monthly data. Beginning in 2001, QCEW classifies employees of Indian tribal governments and enterprises in local government. These employees were previously classified in the relevant private industries. 9 F
10 In the CBP data, these employees are still classified in private industries.
8 The CBP data cover only those government employees who work in government hospitals, f ederally chartered savings institutions and credit unions, retail liquor stores, wholesale liquor establishments a nd university publishers. QCEW data in most states exclude state and local elected officials, members o f the judiciary, state national and air national guardsmen, temporary emergency employees, and those in po licy and advisory positions. 9 Some religious elementary and secondary schools are not covered by QCEW because of a 1981 Supreme Court decision stating “schools operated and supported by churches and not separately incorporated [a re] held exempt from unemployment compensation taxes.” College students (and their spouses) employed by the school in which they are enrolled, and student nurses and interns employed by hospitals as part of their training are also excluded from QCEW. While QCEW coverage varies, half o f the states only include nonprofit organizations with four or more employees during twenty weeks in a calendar year. 10 For example, employees of casinos owned by tribal councils were included in the North American Industry Classification System subsector “Amusement, Gambling, and Recreation Industries.”

November 2021 Employment VIII-9
Nonfarm Self-Employment The BEA local area estimates of nonfarm self-employment consist of the number of sole proprietorships and the number of individual general partners. 1 0 F
11 The nonfarm self-employment estimates resemble the wage and salary employment estimates in that both measure jobs—as opposed to workers—on a full-time and part-time basis. However, because of limitations in source data, two important measurement differences exist between the two sets of estimates. First, the self-employment estimates are largely on a place-of-residence basis rather than on the preferred place-of-work basis. Second, the self-employment estimates reflect the total number of sole proprietorships or partners active at any time during the year—as opposed to the annual average measure used for wage and salary employment. National totals For each NAICS three-digit subsector (or SIC two-digit industry in years prior to 2001), the national total of nonfarm self-employment equals the sum of the number of sole proprietorships and the number of individual general partners. Sole proprietorships - Income from a nonfarm sole proprietorship is reported on Schedule C—Profit, or Loss, from Business or Profession—of Internal Revenue Service (IRS) Form 1040—U.S. Individual Income Tax Return. A schedule is filed for each business operated by the filer and the industry of the proprietorship reported. In addition, corporate directors—who are not officers in the corporation—use Schedule C to report their director’s fees. BEA uses the number of Schedule Cs filed (including those filed by corporate directors) as its measure of the number of sole proprietorships. The national estimate of the number of nonfarm sole proprietorships in each NAICS three-digit subsector is based on a sample of these schedules.1 1 F
12 In the absence of IRS data f or the most recent years, the number of proprietorships is extrapolated forward using prior years’ growth rates. Partners - A preliminary national estimate of the number of nonfarm partners by NAICS three-digit subsector is based on a sample of returns of IRS Form 1065—U.S. Partnership Return of Income. One Form 1065 is filed by each business partnership. The number of partners which can include corporations and other legal entities as well as individuals) and the industry of the business are indicated on the form. The preliminary estimate of the number of partners by industry is adjusted by using relationships from two special tabulations of partnership tax data provided by the IRS. The first tabulation, available annually, is of the number of limited partners—generally at the NAICS sector level. The second tabulation, available for 1986 only, is the number of partners by SIC division by type (e.g., individuals, corporations, other partnerships acting as partners, and fiduciaries) in partnerships with 10 or fewer partners. The adjustment of the preliminary estimate is at the NAICS sector level. The preliminary estimates of the number of partners are summed to the appropriate industry totals. The number of limited partners from the first IRS special tabulation is subtracted
11 Partners can be individuals, corporations, partnerships, estates, trusts, limited liability companies, ta x-exempt organizations, or individual retirement arrangements. They can be either general or limited. 12 When a husband and wife jointly operate a nonfarm sole proprietorship (e.g. a restaurant) and file a join t income tax return, only one will be counted as a proprietor.

November 2021 LOCAL AREA METHODOLOGY VIII-10
from the preliminary estimate to obtain the number of general partners. Next, the ratio of the number of individual partners to the total number of partners is calculated f or each industry from the second IRS special tabulation. This ratio is multiplied by the number of general partners in the industry in each year to yield the number of individual general partners. Finally, the NAICS sector totals of the number of individual general partners are allocated to the three-digit subsectors in proportion to the number of partnerships to yield the final estimate of partners. In the absence of IRS data for the most recent years, the number of partners is extrapolated forward using prior years’ growth rates. State and county estimates Preliminary state and county estimates of self-employment are also based on tabulations of the number of nonfarm sole proprietorships filing IRS Schedule C, Form 1040 and on the number of nonfarm general partners as reported on IRS Schedule B, Form 1065. However, the entire population of returns is used (rather than just the sample used for the national estimates) and slightly different data from the forms are available for states and counties. Specifically, data are available on the number of partners in each partnership and the type of partnership. Up to four partners in each partnership are counted except limited partnerships which are assumed to have a single general partner.1 2F
13 Tabulations are prepared by NAICS three-digit subsector. The national estimates of sole proprietorships and partners are combined to form an estimate of total self -employment and allocated to states in proportion to the preliminary state estimate of total self-employment. In the absence of IRS data for the most recent years, the state allocators f or prior years are used. At the county level, tabulations of Schedule C and Form 1065 are available at the NAICS sector level only. Therefore, state estimates are summed to the NAICS sector level for use as control totals for the county estimates. The controls are then allocated to the counties in proportion to preliminary estimates of county self-employment. In the absence of IRS data for the most recent years, the county allocators for prior years are used.
Farm Self-Employment Farm self-employment is defined as the number of non-corporate farm operators, consisting of sole proprietors and partners. A farm is defined as an establishment that produces, or normally would be expected to produce, at least $1,000 worth of farm products—crops and livestock—in a typical year. Because of the low cutoff point for this definition even when adjusted for inflation, the farm self-employment estimates are effectively on a full-time and part-time basis. The estimates are consistent with the job-count basis of the estimates of wage and salary employment because farm proprietors are counted without regard to any other employment. The distinction between place-of-work and place-of-residence is not significant because most farm operators live on or near their land. Similarly, because of the annual production cycle of most farming, the distinctions
13 Up to 500 partners are counted in law and accounting firms.

November 2021 Employment VIII-11
between the point-in-time, the average annual, and the any-activity temporal concepts of employment measurement are not significant. National and State Estimates (1969-2001) Both the national and state estimates of farm self-employment are prepared by the application of a series of ratios to the annual estimates of the number of all farms prepared by the National Agricultural Statistics Service (NASS), U.S. Department of Agriculture (USDA). For the BEA national estimates, the ratios are drawn from the USDA’s annual Agricultural Resource Management Study (ARMS), previously the Farm Costs and Returns Survey (FCRS); for the state estimates, the ratios are drawn f rom the quinquennial Census of Agriculture. The census ratios are interpolated between census years, and the ratios from the last census are used for each subsequent year. 1 3 F
14 The sequence of estimating steps for the national totals and the preliminary state estimates is as follows:
1. The number of non-corporate farms is derived as the product of the NASS number of all farms and the ratio of the number of non-corporate farms to all farms.
2. The number of sole-proprietor farms is derived as the product of the number of non-corporate farms (step 1) and the ratio of the number of sole-proprietor farms to non-corporate farms.
3. The number of partnership farms is derived as the product of the number of non-corporate farms (step 1) and the ratio of the number of partnership f arms to non-corporate farms.
4. The number of farm partners is derived as the product of the number of partnership farms (step 3) and the ratio of the number of farm partners to partnership farms.
5. Total farm self-employment (final for the nation; provisional for the states) is derived as the sum of the number of sole-proprietor farms (step 2) and the number of farm partners (step 4).
Finally, the national totals are allocated to states in proportion to the provisional state estimates (the allocators developed in step 5). National and State Estimates (2002 forward) Beginning in 2002, the Census of Agriculture started publishing the number of farm operators by legal form of organization for all states. The methodology for estimating farm self- employment from 2002 onward therefore includes additional steps in which the ratio of the number of farm operators to the number of farms are applied. In addition, BEA now adjusts the production threshold an operation must meet to qualify as a farm for inflation using the prices received index for all items for all farms from NASS. 1 4 F
15 The new sequence of steps for estimating farm self- employment are as follows:
14 The most recent Census of Agriculture in use for the BEA employment estimates is that for 2017. 15 The USDA $1,000 threshold was set in 1974.

November 2021 LOCAL AREA METHODOLOGY VIII-12
1. The number of non-corporate farms is derived as the product of the NASS number of all farms and the ARMS ratio of the number of non-corporate farms to all farms.
2. The number of sole-proprietor farms is derived as the product of the number of non-corporate farms (step 1) and the ARMS ratio of the number of sole-proprietor farms to non-corporate farms.
3. The adjusted number of sole-proprietor farms is derived as the product of the number of sole-proprietor farms (step 2) and the ratio of the number of sole-proprietor farms over the inflation-adjusted threshold to all sole-proprietor farms.
4. The number of sole-proprietor farms is further adjusted to remove farms with hired managers. It is derived as the product of the adjusted number of sole-proprietors farms (step 3) and the ratio of sole-proprietor farms without hired managers to total sole-proprietor farms.
5. The number of sole-proprietors is derived as the product of the adjusted number of sole-proprietor farms (step 4) and the ratio of the number of operators to sole-proprietor farms. 15 F
16 6. The number of partnership farms is derived as the product of the number of
non-corporate farms (step 1) and the ARMS ratio of the number of partnership farms to non-corporate farms.
7. The adjusted number of partnership farms is derived as the product of the number of partnership farms (step 6) and the ARMS ratio of the number of the number of partnership farms over the inflation-adjusted threshold to all partnership farms.
8. The number of partnership farms is further adjusted to remove farms with hired managers. It is derived as the product of the adjusted number of partnership farms (step 7) and the ratio of partnership farms without hired managers to total partnership farms.
9. The number of farm partners is derived as the product of the adjusted number of partnership farms (step 8) and the ratio of the number of farm partners to partnership farms.
10. Total farm self-employment (final for the nation; provisional for the states) is derived as the sum of the number of sole-proprietors (step 5) and the number of farm partners (step 9).
11. Finally, the national totals are allocated to states in proportion to the provisional state estimates (step 10).
County Estimates State estimates of the number of operators in sole-proprietor farms are allocated to counties based on the number of sole proprietor farms and state estimates of the number of farm partners are allocated to counties based on the number of partnership farms.
16 Formerly, BEA assumed that sole proprietorship farms had a single operator, the owner. Data from 2002 Census of Agriculture revealed that many sole proprietorship farms had more than one operator.

2018 2019 2020Total Employment, BLS1 146,132,000 148,105,000 139,104,000
Plus: Adjustment for misreporting of employment on tax returns 869,000 902,000 827,000 Private employment exempt from UI coverage2 4,401,000 4,541,000 4,340,000 Government employment exempt from UI coverage3 2,959,000 2,986,000 2,965,000
Equals: Wage and Salary Employment, BEA 154,361,000 156,534,000 147,236,000
Table J. Relation of BEA Wage and Salary Employment and BLS Total Employment
1BLS.gov data as of 09/01/2021.
2Consists mostly of employment in the religious organizations industry (NAICS 8131), private education (6111), and private households (814). Also consists of employment in the agriculture, forestry, and fishing, rail transportation, hospitals, and social assistance industries; employment of some nonprofit organizations having fewer than four employees (in any industry); insurance solicitors and real estate agents classified as statutory employees; and corporates officers in the state of Washington.
3 Consists mostly of military employees (active duty and reserve officers and enlisted personnel). Also consists of state and local elected officials, members of the judiciary, students and their spouses employed by public colleges and universities, and employees of public railroads.

IX. TECHNICAL NOTES
Allocation Procedures
Allocation procedures impart to the state (or county) estimates the characteristics of the national (or state) estimates that are not reflected in the available state-level (or county-level) source data; for most components of personal income, the state and county source data are less comprehensive and less reliable than the data that are available for the national estimates. In addition, these procedures allow the use of state and county data that are related to, but that do not precisely match, the component being estimated. For example, state control totals of unemployment compensation are allocated to counties of some states in proportion to direct payments data provided their employment security agencies. For the states not providing such data, the control totals are allocated in proportion to the number of unemployed persons estimated by the Bureau of Labor Statistics (BLS).
In the allocation procedures, the national or state control total for a component is allocated to states or counties in proportion to each state’s or county’s share of related data. In many cases the related data are modified or augmented before the allocation by preliminary estimation—for example, by the summation of wages, tips, and pay-in-kind, by the multiplication of average wages and the number of employees, or by interpolation or extrapolation.
Because the allocation procedures use the national control totals for the state estimates, and state control totals for county estimates, their use yields an additive system in which the county estimates sum to the state estimates which in turn sum to the national estimate.
The allocation procedure used to estimate a component of state personal income is
=
n
sns X
XYY )(
where sY is the estimator (that is, the statistical procedure used to derive an estimate) of the component of personal income for state s , nY is the national estimate of the component (which is used as the control total for the state estimates of the component),
sX is the value for state s from the data related to the component, and nX is the sum over all states of the related data ( ∑= s sn XX ).
In cases in which the national estimate is calculated as the sum of the state data plus an amount nA for which state data are unavailable, the allocation procedure may be represented by two equations:
=
n
sns X
XAA )(
sss AXY +=where sA Y
sY is the composite estimator consisting of sX , the best possible direct
November 2021 LOCAL AREA METHODOLOGY XII-2
estimator (100 percent sample) of the portion of Y for which state data are available, plus sA , the indirect estimator of the portion of Y for which state data are unavailable.
For example, the national estimates of wages and salaries for many industries consist of the sum of state data plus a few small adjustments, which taken together ( nA ) are allocated to the states in proportion to the state data. The small, allocated amount f or each state ( sA ) is added to the state datum ( sX ) to yield the state estimate ( sY ).
Dual Allocation Dual allocation is a statistical procedure that forces the elements of a matrix to sum to column and row control totals. It is used to adjust, for instance, a preliminary estimate of income by state and industry so that sum of income in an industry across all states equals a national control total for that industry and simultaneously the sum of income in a state across all industries equals a control total for that state. It is also used to adjust a preliminary estimate of quarterly state personal income so that it is consistent with both national control totals by quarter and annual state control totals. Specifically, dual allocation subtracts the sum of the algebraic values in a row from the row control total. It divides this difference by the sum of the absolute values in the row and then multiplies the resulting ratio by the absolute value of each element in the row and adds the result to the algebraic value of that element. This procedure is repeated for each row and then a parallel procedure is repeated for each column. The whole process is repeated five times. After the fifth repetition, any differences between the row and column control totals and the output matrix row and column sums are eliminated by a process called feathering. This is accomplished by selecting the first column with a non-zero difference and the first non-zero row difference with the same sign. The smaller of the two differences is subtracted from the element in that row and column and from the final row and column sums. This procedure forces the difference between either the final row sum and its corresponding control total or the final column sum and its corresponding control total to zero. Before performing any subtraction, the element in the row and column selected is checked for a zero value and to see if the subtraction would cause a change in the element’s sign. If either of these tests is true, the next non-zero row difference with like sign is selected. The entire feathering process is repeated until all differences between final column sums and column control totals have been forced to zero. At this point the row sums and row control totals will also be equal.
Disclosure-Avoidance Procedures Like other statistical agencies, the Bureau of Economic Analysis (BEA) is legally required to safeguard the confidentiality of the information that it receives. In addition, like other agencies, it must balance its responsibility to avoid disclosing confidential information with its responsibility to release as much information as possible. It balances these responsibilities by presenting the estimates for regions, states, and local areas only
November 2021 Technical Notes XII-3
at the North American Industry Classification System (NAICS) subsector level or Standard Industrial Classification (SIC) two-digit level, even though it receives source data at the NAICS four- and five-digit industry levels or SIC three- and four-digit levels. Most of the data that BEA receives from other agencies are not confidential. The agencies summarize their data by program, ZIP code, county, or state, so that each record, or data cell, contains data for enough individuals or establishments to preclude the identification of data for a specific individual or establishment and, therefore, to preclude disclosure of confidential information. However, the Quarterly Census of Employment and Wages (QCEW) tabulations that BEA receives from the BLS include records that would disclose confidential information. The confidential information on wages and salaries for some business f irms is identifiable from the state and county estimates of wages and salaries that are derived from the QCEW data. To prevent either the direct or the indirect disclosure of the confidential information, BEA uses the BLS state, county, and metropolitan statistical area nondisclosure file. BEA uses as many BLS nondisclosure cells as possible but cannot use some of them for various reasons. The most important reasons are that the industry structure published by BEA does not exactly match the NAICS subsector or SIC two-digit detail provided by BLS and that BEA does not use QCEW data for the farm sector. When BEA drops BLS nondisclosure cells, other cells must be selected to prevent the disclosure of confidential information. To determine which estimates should be suppressed, the total wages and salaries file and the wages-and-salaries-nondisclosure file are used to prepare a multidimensional matrix. This matrix is tested, and the estimates that should be suppressed are selected. 0F
1 BEA’s estimates for micropolitan and metropolitan statistical areas, metropolitan divisions, combined statistical areas, and the metropolitan and nonmetropolitan portions of states are aggregations of its county estimates. It often happens that an area consists of two or more counties with a relatively small amount of suppressed income or employment in a particular industry relative to the aggregate for all counties in the area. When the suppressed amount is below a certain percentage threshold, BEA publishes the portion of the aggregate which is disclosable and flags it with a code (E) indicating that the published amount constitutes the major portion of the aggregate for the area. For a given area, the number of counties that are aggregated in an (E) estimate can vary f rom industry to industry and from year to year.
Geocoding
Some of the data BEA uses to estimate personal income is available only by ZIP Code, which BEA then tabulates by county and state. For instance, BEA tabulates extracts from certain IRS tax returns by county and state based on the nine-digit ZIP code reported on the return (nine-digit ZIP codes do not cross county borders). About 95 percent of the Form 1065 returns and 35 percent of the Schedule C returns can be geocoded using their nine-digit ZIP codes. The remaining returns are geocoded using their five-digit ZIP codes. Since some five-digit ZIP codes comprise addresses in
1 In this test, computer programs impose a set of rules and priorities on this matrix so that the estimates that should be suppressed are selected until indirect disclosure is impossible.

November 2021 LOCAL AREA METHODOLOGY XII-4
multiple counties, the amounts reported on the returns are allocated to those counties in proportion to the number residential delivery addresses. Less than 1 percent of the returns cannot be geocoded by this method. An important feature of this method is the use of ZIP Code to county look-up files (the ZIP+4 product and the Delivery Stats File) that are updated annually by United States Postal Service.
Imputation One of the principles of the national income and product accounts (NIPA) is that they reflect market transactions. In a few instances, a comprehensive account of total income and production requires BEA to impute a value or a transaction. This keeps the NIPA invariant to how certain activities are carried out. For instance, some transactions, such as the provision of food, lodging, and clothing to employees have an element of barter—food is bartered for labor (at least in part). In this case, imputation involves placing a market value on the food employees received so that the estimate of their total compensation is comprehensive and invariant to changes in the proportions received in cash and in kind. In other transactions, such as the rental of housing to an owner-occupant, no transaction appears in the records of the economy. In this case, imputation involves constructing a transaction between a producer and a consumer (who happen to be the same person) and placing a market value on the housing services exchanged. If the imputation were not made, then housing output and consumption would fall if a household purchased the house it had been renting. A third type of imputation is the attribution of the income of one sector or legal form of organization to another. For instance, the NIPA attributes the property income life insurance carriers earn on annuity reserves to the persons who own the annuities. The imputations that are treated explicitly in state personal income include the following: Imputed pay-in-kind is added to the estimates of wages and salaries so that all the earnings of employees who receive part of their wages in pay-in-kind will be included in personal income. This imputation is an estimate of the value of the food, lodging, clothing, and other goods and services that are received by employees from their employers as partial or full payment for their services. Imputations for employer contributions for (a) federal employees’ unemployment insurance, (b) military medical insurance, and (c) federal workers’ compensation—equal to the benefits paid—are included in employer contributions for government social insurance funds. The imputation for employer-paid health and life insurance premiums is included in employer contributions for employee pension and insurance f unds, a component of supplements to wages and salaries. The imputed value of food and fuel produced and consumed on farms is included in farm proprietors’ income so that that measure reflects the income from all of the production of noncorporate farms. The imputed net rental income of owner-occupied housing is included in the rental income of persons with capital consumption adjustment (CCAdj). Imputed interest receipts from financial and insurance companies are included in personal interest income.

November 2021 Technical Notes XII-5
The imputed receipt of dividend and interest income from pension plans is included in personal dividend income and personal interest income.
Interpolation and Extrapolation Interpolation and extrapolation are used to prepare the first approximations of some components of personal income for the years in which direct source data are unavailable. Both procedures use the data for these components for benchmark years—the years for which the best data are available—and both frequently use other data that are related to the benchmark-year data for the components. Interpolation is used to derive the first approximation of estimates for years that are between benchmark years. For example, if data for wages and salaries for an industry were available only from the decennial Census of Population but employment data were available annually from another source, the first approximations of wages and salaries for 1981-1989 could be interpolated from the wages and salaries data for 1980 and 1990, the two census benchmark years, and from the annual employment data for 1980-1990. Extrapolation is used to derive first approximations for years that are beyond the most recent benchmark year. For example, the first approximations of wages f or 1991-1999 might be extrapolated from the census benchmark data for 1990 and from the employment data for 1990-1999. The estimates based on extrapolation are usually superseded by revised estimates when benchmark data become available for a more current year. For the preceding example, the estimates for 1991-1999 would be superseded by estimates based on interpolation when census benchmark data became available for 2000. Both interpolation and extrapolation are illustrated in the following examples. In the first two examples, interpolation is used to derive the first approximations of wages and salaries for an industry in areas A, B, and C for the years 2 and 3 that are between the benchmark years 1 and 4. In the third example, extrapolation is used to derive the approximations for year 5. In the first example, “straight-line interpolation” is used to derive the first approximations for years 2 and 3 from the data for benchmark years 1 and 4. 1 F
2 The first approximations for year 2 equals the amount for year 1 plus one-third of the increase from year 1 to year 4; the preliminary estimate for year 3 equals the amount f or year 1 plus two-thirds of the increase.
2 Straight-line interpolation assumes that the magnitude of the annual change is the same in each year in the interpolated time series, subject to modification by the adjustment to the national control totals. Straight-line interpolation is used as the default option, when no annual source data related to the income series are available.

November 2021 LOCAL AREA METHODOLOGY XII-6
Table K. Wages and salaries in thousands of dollars Year 1 Year 2 Year 3 Year 4 (benchmark) (interpolation) (interpolation) (benchmark) Area A ............ 28 34 40 46 Area B ............ 34 43 53 62 Area C ............ 74 81 87 94 In the second example, interpolation with a related series of data, the indicator series, is used to derive the first approximations for years 2 and 3 f rom the benchmark data for years 1 and 4 and from the indicator series for all four years. The data for wages and salaries are the benchmark data, the employment data are the indicator series, and the average wages (computed as wages and salaries divided by employment) are the interpolation ratios. 2 F
3 This method of interpolation is illustrated in three steps. First, average wages for years 1 and 4 are calculated from the wage and employment data for those years. Wages for each year are divided by the number of employees for the year to yield the average wages of the employees.
Table L. Employment and average wages Year 1 Year 4 Average Average Wages wages Employment in dollars Employment in dollars Area A .................. 4 7,000 4 11,500 Area B .................. 6 5,667 10 6,200 Area C .................. 11 6,727 10 9,400 Second, straight-line interpolation is used to derive average wages for years 2 and 3 from average wages for years 1 and 4.
Table M. Average wages in dollars Year 1 Year 2 Year 3 Year 4 (benchmark) (interpolation) (interpolation) (benchmark) Area A ......... 7,000 8,500 10,000 11,500 Area B ......... 5,667 5,845 6,022 6,200 Area C ......... 6,727 7,618 8,509 9,400
3 Using an indicator series for interpolation between two benchmark years assumes that any change in the relationship between the data for the income component for the benchmark years and the data from the indicator series for the benchmark years occurs uniformly over time. This relationship is embodied in the interpolation ratios, which in this example are the average wages. For this procedure, straight-line interpolation of the benchmark-year interpolation ratios is used to calculate the ratios for the intervening years. A benchmark-year interpolation ratio is the ratio of the datum for an income component for the benchmark year to the datum for the same year from the annual indicator series. The interpolation ratios for the intervening years are multiplied by the data for those years from the indicator series to yield the interpolated series for those years.

November 2021 Technical Notes XII-7
Third, the interpolated average wages for each year are multiplied by the employment data for each year to yield the first approximations.
Table N. Employment and wage approximations Year 2 Year 3 Wages Wages in thousands in thousands Employment of dollars Employment of dollars Area A ................ 5 43 4 40 Area B ................ 7 41 9 54 Area C................. 10 76 9 77 In the third example, extrapolation with an indicator series is used to derive the first approximations of wages for year 5 from average wages for year 4—used here as the extrapolation ratios—and employment data for year 5. 3 F
4 The average wages are multiplied by employment to yield the first approximations of wages for year 5.
Table O. First approximations of wages for year 5 Year 4 Year 5 Average Wages Wages in thousands in dollars Employment of dollars Area A................ 11,500 5 58 Area B................ 6,200 12 74 Area C................ 9,400 9 85 After interpolation or extrapolation is used to calculate the first approximations of a component of personal income, the approximations are adjusted proportionately to sum to the component’s control total.
4 Using an indicator series for extrapolation assumes that the relationship between the data for the income component for the latest benchmark year and the data from the indicator series for that year remains unchanged in the subsequent years.

X. APPENDIX
Concordance between BEA line codes and NAICS industry codes Line BEA Industry Description NAICS Code 0000 Total … 0081* Farm 111-112 0082* Nonfarm … 0090 Private 113-814 0100 Forestry, fishing, related activities 113-115 0101 Forestry and logging 113 0102 Fishing, hunting, and trapping 114 0103 Agriculture and forestry support activities 115 0200 Mining 21 0201 Oil and gas extraction 211 0202 Mining (except oil and gas) 212 0203 Support activities for mining 213 0300 Utilities 22 0400 Construction 23 0401 Construction of buildings 236 0402 Heavy and civil engineering construction 237 0403 Specialty trade contractors 238 0500 Manufacturing 31-33 0510 Durable goods manufacturing 321,327-339 0511 Wood product manufacturing 321 0512 Nonmetallic mineral product manufacturing 327 0513 Primary metal manufacturing 331 0514 Fabricated metal product manufacturing 332 0515 Machinery manufacturing 333 0516 Computer and electronic product manufacturing 334 0517 Electrical equipment and appliance manufacturing 335 0518 Motor vehicles, bodies & trailers, and parts manufacturing 3361-3363 0519 Other transportation equipment manufacturing 3364-3369 0521 Furniture and related product manufacturing 337 0522 Miscellaneous manufacturing 339 0530 Nondurable goods manufacturing 311-316,322-326 0531 Food manufacturing 311 0532 Beverage and tobacco product manufacturing 312 0533 Textile mills 313 0534 Textile product mills 314 0535 Apparel manufacturing 315 0536 Leather and allied product manufacturing 316 0537 Paper manufacturing 322 0538 Printing and related support activities 323 0539 Petroleum and coal products manufacturing 324

November 2021 LOCAL AREA METHODOLOGY
X-2
Line BEA Industry Description NAICS Code 0541 Chemical manufacturing 325 0542 Plastics and rubber products manufacturing 326 0600 Wholesale trade 42 0700 Retail Trade 44-45 0701 Motor vehicle and parts dealers 441 0702 Furniture and home furnishings stores 442 0703 Electronics and appliance stores 443 0704 Building material and garden supply stores 444 0705 Food and beverage stores 445 0706 Health and personal care stores 446 0707 Gasoline stations 447 0708 Clothing and clothing accessories stores 448 0709 Sporting goods, hobby, book and music stores 451 0711 General merchandise stores 452 0712 Miscellaneous store retailers 453 0713 Nonstore retailers 454 0800 Transportation and warehousing 48-49 0801 Air transportation 481 0802 Rail transportation 482 0803 Water transportation 483 0804 Truck transportation 484 0805 Transit and ground passenger transportation 485 0806 Pipeline transportation 486 0807 Scenic and sightseeing transportation 487 0808 Support activities for transportation 488 0809 Couriers and messengers 492 0811 Warehousing and storage 493 0900 Information 51 0901 Publishing industries, except Internet 511 0902 Motion picture and sound recording industries 512 0903 Broadcasting, except Internet 515 0904 Internet publishing and broadcasting 516 0905 Telecommunications 517 0906 Data processing, hosting, and related services 518 0907 Other information services 519 1000 Finance and insurance 52 1001 Monetary authorities - central bank 521 1002 Credit intermediation and related activities 522 1003 Securities, commodity contracts, investments 523 1004 Insurance carriers and related activities 524 1005 Funds, trusts, and other financial vehicles 525 1100 Real estate and rental and leasing 53 1101 Real estate 531 1102 Rental and leasing services 532 1103 Lessors of nonfinancial intangible assets 533

November 2021 Appendix
X-3
Line BEA Industry Description NAICS Code 1200 Professional, scientific and technical services 54 1300 Management of companies and enterprises 55 1400 Administrative and waste management services 56 1401 Administrative and support services 561 1402 Waste management and remediation services 562 1500 Educational services 61 1600 Health care and social assistance 62 1601 Ambulatory health care services 621 1602 Hospitals 622 1603 Nursing and residential care facilities 623 1604 Social assistance 624 1700 Arts, entertainment, and recreation 71 1701 Performing arts and spectator sports 711 1702 Museums, historical sites, zoos, and parks 712 1703 Amusement, gambling, and recreation 713 1800 Accommodation and food services 72 1801 Accommodation 721 1802 Food services and drinking places 722 1900 Other services, except public administration 81 1901 Repair and maintenance 811 1902 Personal and laundry services 812 1903 Membership associations and organizations 813 1904 Private households 814 2000 Government and government enterprises … 2001 Federal, civilian … 2002 Military … 2010 State and local … 2011 State government … 2012 Local government … * In Tables CA5N and CA6N farm has a line code of 0081 and nonfarm has a line code of 0082. In Table CA25N farm has a line code of 0070 and nonfarm has a line code of 0080.

November 2021 LOCAL AREA METHODOLOGY
X-4
Concordance between BEA line codes and SIC industry codes Line BEA Industry Description SIC Code 0000 Total … 0081* Farm 01-02 0082* Nonfarm … 0090 Private … 0100 Agricultural services, forestry, fishing … 0110 Agricultural services 07 0120 Forestry and fishing … 0121 Forestry 08 0122 Fishing … 0200 Mining B 0210 Metal mining 10 0220 Coal mining 12 0230 Oil and gas extraction 13 0240 Nonmetallic minerals, except fuels 14 0300 Construction C 0310 General building contractors 15 0320 Heavy construction contractors 16 0330 Special trade contractors 17 0400 Manufacturing D 0410 Durable goods … 0413 Lumber and wood products 24 0417 Furniture and fixtures 25 0420 Stone, clay, and glass products 32 0423 Primary metal industries 33 0426 Fabricated metal products 34 0429 Industrial machinery and equipment 35 0432 Electronic and other electric equipment 36 0435 Motor vehicles and equipment 371 0438 Other transportation equipment 372-379 0441 Instruments and related products 38 0444 Miscellaneous manufacturing industries 39 0447 Ordnance … 0450 Nondurable goods … 0453 Food and kindred products 20 0456 Tobacco products 21 0459 Textile mill products 22 0462 Apparel and other textile products 23 0465 Paper and allied products 26 0468 Printing and publishing 27 0471 Chemicals and allied products 28 0474 Petroleum and coal products 29

November 2021 Appendix
X-5
Line BEA Industry Description SIC Code 0477 Rubber and miscellaneous plastics products 30 0480 Leather and leather products 31 0500 Transportation and public utilities E 0510 Railroad transportation 40 0520 Trucking and warehousing 42 0530 Water transportation 44 0540 Other transportation 41, 45-47 0541 Local and interurban passenger transit 41 0542 Transportation by air 45 0543 Pipelines, except natural gas 46 0544 Transportation services 47 0560 Communications 48 0570 Electric, gas, and sanitary services 49 0610 Wholesale trade F 0620 Retail trade G 0621 Building materials and garden equipment 52 0622 General merchandise stores 53 0623 Food stores 54 0624 Automotive dealers and service stations 55 0625 Apparel and accessory stores 56 0626 Home furniture and furnishings stores 57 0627 Eating and drinking places 58 0628 Miscellaneous retail 59 0700 Finance, insurance, and real estate H 0710 Depository and nondepository institutions 60, 61 0730 Other finance, insurance, and real estate 62-65, 67 0731 Security and commodity brokers 62 0732 Insurance carriers 63 0733 Insurance agents, brokers, and services 64 0734 Real estate 65 0735 Combined real estate, insurance, etc. … 0736 Holding and other investment offices 67 0800 Services I 0805 Hotels and other lodging places 70 0810 Personal services 72 0815 Private households 88 0820 Business services 73 0825 Automotive repair, services, and parking 75 0830 Miscellaneous repair services 76 0835 Amusement and recreation services 79 0840 Motion pictures 78 0845 Health services 80 0850 Legal services 81 0855 Educational services 82 0860 Social services 83

November 2021 LOCAL AREA METHODOLOGY
X-6
Line BEA Industry Description SIC Code 0865 Museums, botanical, zoological gardens 84 0870 Membership organizations 86 0875 Engineering and management services 87 0880 Miscellaneous services 89 0900 Government and government enterprises … 0910 Federal, civilian … 0920 Military … 0930 State and local … 0931 State government … 0932 Local government … * In Tables CA5 and CA6 farm has a line code of 0081 and nonfarm has a line code of 0082. In Table CA25 farm has a line code of 0070 and nonfarm has a line code of 0080.

November 2021 Appendix
X-7
BEA Regions State State FIPS Region FIPS Region code State or Region name Abbreviation code code State or Region name Abbreviation code New England Region NENG 1 Southwest Region SWST 6 09 Connecticut CT 1 04 Arizona AZ 6 23 Maine ME 1 35 New Mexico NM 6 25 Massachusetts MA 1 40 Oklahoma OK 6 33 New Hampshire NH 1 48 Texas TX 6 44 Rhode Island RI 1 50 Vermont VT 1 Rocky Mountain Region RKMT 7 08 Colorado CO 7 Mideast Region MEST 2 16 Idaho ID 7 10 Delaware DE 2 30 Montana MT 7 11 District of Columbia DC 2 49 Utah UT 7 24 Maryland MD 2 56 Wyoming WY 7 34 New Jersey NJ 2 36 New York NY 2 Far West Region FWST 8 42 Pennsylvania PA 2 02 Alaska AK 8 06 California CA 8 Great Lakes Region GLAK 3 15 Hawaii HI 8 17 Illinois IL 3 32 Nevada NV 8 18 Indiana IN 3 41 Oregon OR 8 26 Michigan MI 3 53 Washington WA 8 39 Ohio OH 3 55 Wisconsin WI 3 Plains Region PLNS 4 19 Iowa IA 4 20 Kansas KS 4 27 Minnesota MN 4 29 Missouri MO 4 31 Nebraska NE 4 38 North Dakota ND 4 46 South Dakota SD 4 Southeast Region SEST 5 01 Alabama AL 5 05 Arkansas AR 5 12 Florida FL 5 13 Georgia GA 5 21 Kentucky KY 5 22 Louisiana LA 5 28 Mississippi MS 5 37 North Carolina NC 5 45 South Carolina SC 5 47 Tennessee TN 5 51 Virginia VA 5 54 West Virginia WV 5
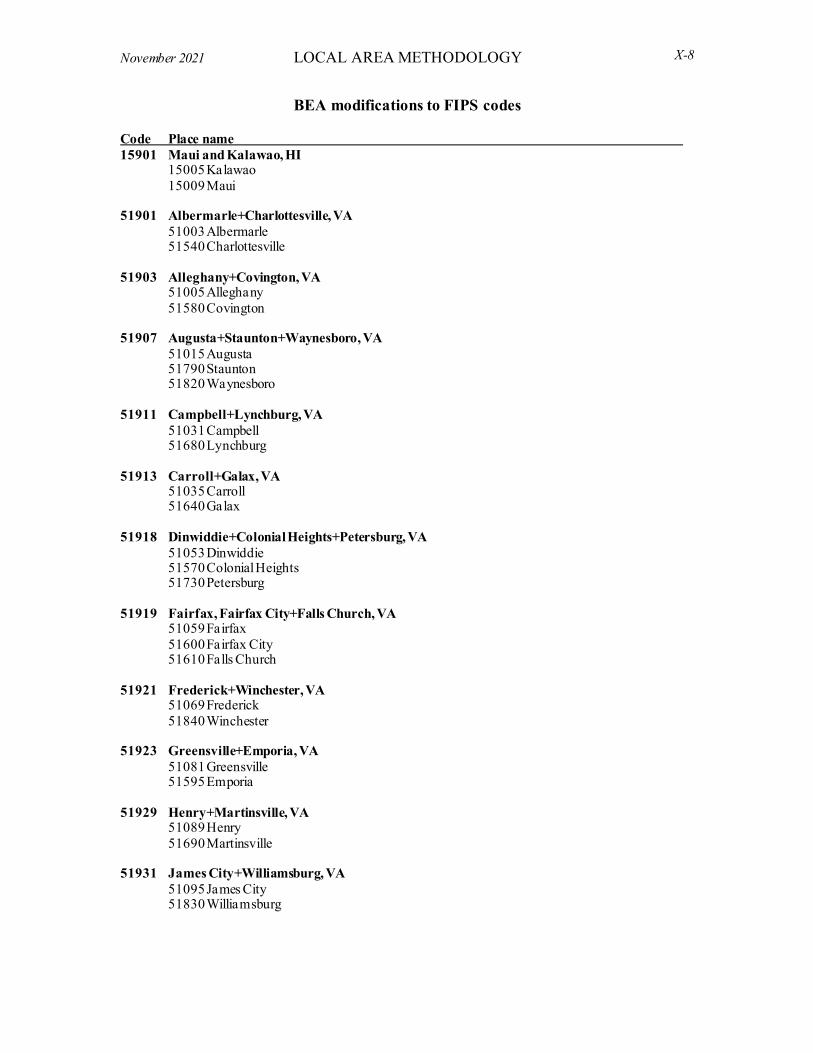
November 2021 LOCAL AREA METHODOLOGY
X-8
BEA modifications to FIPS codes Code Place name 15901 Maui and Kalawao, HI 15005 Kalawao 15009 Maui 51901 Albermarle+Charlottesville, VA 51003 Albermarle 51540 Charlottesville 51903 Alleghany+Covington, VA 51005 Alleghany 51580 Covington 51907 Augusta+Staunton+Waynesboro, VA 51015 Augusta 51790 Staunton 51820 Waynesboro 51911 Campbell+Lynchburg, VA 51031 Campbell 51680 Lynchburg 51913 Carroll+Galax, VA 51035 Carroll 51640 Galax 51918 Dinwiddie+Colonial Heights+Petersburg, VA 51053 Dinwiddie 51570 Colonial Heights 51730 Petersburg 51919 Fairfax, Fairfax City+Falls Church, VA 51059 Fairfax 51600 Fairfax City 51610 Falls Church 51921 Frederick+Winchester, VA 51069 Frederick 51840 Winchester 51923 Greensville+Emporia, VA 51081 Greensville 51595 Emporia 51929 Henry+Martinsville, VA 51089 Henry 51690 Martinsville 51931 James City+Williamsburg, VA 51095 James City 51830 Williamsburg

November 2021 Appendix
X-9
Code Place name 51933 Montgomery+Radford, VA 51121 Montgomery 51750 Radford 51939 Pittsylvania+Danville, VA 51143 Pittsylvania 51590 Danville 51941 Prince George + Hopewell, VA 51149 Prince George 51670 Hopewell 51942 Prince William+Manassas+Manassas Park, VA 51153 Prince William 51683 Manassas 51685 Manassas Park 51944 Roanoke+Salem, VA 51161 Roanoke 51775 Salem 51945 Rockbridge+Buena Vista+Lexington, VA 51163 Rockbridge 51530 Buena Vista 51678 Lexington 51947 Rockingham+Harrisonburg, VA 51165 Rockingham 51660 Harrisonburg 51949 Southampton+Franklin, VA 51175 Southampton 51620 Franklin 51951 Spotsylvania+Fredericksburg, VA 51177 Spotsylvania 51630 Fredericksburg 51953 Washington+Bristol, VA 51191 Washington 51520 Bristol 51955 Wise+Norton, VA 51195 Wise 51720 Norton 51958 York+Poquoson, VA 51199 York 51735 Poquoson 55901 Shawano (incl. Menominee), WI (prior to 1989) 55078 Menominee 55115 Shawano