Local Area Economic Profile - rdlg.gov.tt · City of San Fernando Local Area Economic Profile Final...
68
City of San Fernando Local Area Economic Profile Final Report
Transcript of Local Area Economic Profile - rdlg.gov.tt · City of San Fernando Local Area Economic Profile Final...
1
City of San Fernando
Local Area Economic Profile
Final Report

City of San Fernando
Local Area Economic Profile
Final Report
Submitted to:
Permanent Secretary Ministry of Rural Development and Local Government
Kent House, Maraval, Trinidad and Tobago
Submitted by:
Kairi Consultants Limited 14 Cochrane Street, Tunapuna,
TRINIDAD AND TOBAGO Tel: 1 868 663 2677; Fax: 1 868 663 1442
Email: [email protected]
March 11, 2016
i
Table of Contents
List of Figures ....................................................................................................................................... iv
List of Tables ......................................................................................................................................... v
Acronyms and Abbreviations ............................................................................................................... vi
1 Introduction .................................................................................................................................. 1
2 Area Information and Demography ........................................................................................... 2
2.1 Location ................................................................................................................................... 2
2.2 Geography ............................................................................................................................... 2
2.3 Population and Demography .................................................................................................. 3
2.3.1 Population and Household Size ...................................................................................... 3
2.3.2 Population Density ........................................................................................................... 3
2.3.3 Age Profile and Dependency ........................................................................................... 4
2.3.4 Ethnicity ........................................................................................................................... 5
2.3.5 Religious Affiliation .......................................................................................................... 6
2.4 Educational Attainment ........................................................................................................... 7
2.5 Living Conditions in San Fernando ....................................................................................... 10
2.5.1 Crime ............................................................................................................................. 13
3 Land Use and Land Resources ................................................................................................ 15
3.1 Land Use and Resources ..................................................................................................... 15
3.2 Coastal and Marine Resources ............................................................................................. 18
4 Municipal Physical and Social Assets .................................................................................... 19

ii
4.1 Physical Infrastructure........................................................................................................... 19
4.1.1 Information and Communications Technology Infrastructure ....................................... 19
4.1.2 Storm Water Management and Coastal Protection ...................................................... 19
4.1.3 Transportation ............................................................................................................... 19
4.1.4 Water Supply and Distribution ....................................................................................... 19
4.1.5 Electricity ....................................................................................................................... 19
4.1.6 Wastewater Management ............................................................................................. 20
4.1.7 Solid Waste Management ............................................................................................. 20
4.2 Social/Cultural Infrastructure ................................................................................................. 20
4.2.1 Dwelling and Building Stock .......................................................................................... 20
4.3 Social Facilities ..................................................................................................................... 20
4.3.1 Education ....................................................................................................................... 20
4.3.2 Health ............................................................................................................................ 21
4.3.3 Disaster Management ................................................................................................... 21
4.3.4 Social Services and Community Development ............................................................. 21
4.3.5 Recreation, Sports and Entertainment .......................................................................... 21
5 The Area Economy .................................................................................................................... 22
5.1 Gross Domestic Product of Trinidad and Tobago ................................................................ 22
5.2 Key Economic Drivers (Activities) ......................................................................................... 23
5.3 Employment and Unemployment Trends ............................................................................. 24
5.3.1 Levels and Trends ......................................................................................................... 24
5.3.2 By Occupational Groups ............................................................................................... 25
5.4 Key Business Activity ............................................................................................................ 26
6 Municipal MSME Profile ............................................................................................................ 27
6.1 Municipal MSME Survey (2015) ........................................................................................... 28
6.1.1 General Characteristics ................................................................................................. 28
6.1.2 Size of Enterprise .......................................................................................................... 29
6.1.3 Legal Status ................................................................................................................... 30
6.1.4 Primary Business Activities ........................................................................................... 31
6.1.5 Employment ................................................................................................................... 33
6.1.6 Markets and Annual Sales ............................................................................................ 33
6.1.7 Financing and Investment ............................................................................................. 34
6.1.8 Use of Internet ............................................................................................................... 35
6.1.9 Technical Support .......................................................................................................... 36

iii
6.1.10 Impediments to MSME Development ............................................................................ 37
6.2 Challenges and Opportunities Facing MSMEs ..................................................................... 38
6.3 Partners in Local Area Economic Development in Trinidad ................................................. 40
6.3.1 The Ministry of Labour and Small and Micro Enterprise Development ........................ 40
6.3.2 National Entrepreneurship Development Company Limited ......................................... 40
6.3.3 Micro-Enterprise Loan Facility (MEL) ............................................................................ 41
6.3.4 FairShare Programme ................................................................................................... 41
7 Local Government System in Trinidad and Tobago and the CARILED Model ................... 43
8 Promoting for Local Economic Development – Issues and Recommendations ................ 45
8.1 introduction ............................................................................................................................ 45
8.2 Strategic Sectors ................................................................................................................... 47
8.2.1 Energy ........................................................................................................................... 47
8.2.2 Agriculture and Food ..................................................................................................... 48
8.2.3 Cultural Tourism ............................................................................................................ 48
8.2.4 Commerce and Distribution ........................................................................................... 49
8.3 Proposed Projects and Implementation Plan ....................................................................... 49
8.3.1 Establishing Institutional Structures within the San Fernando City Corporation .......... 50
8.3.2 Recommended Sectoral Initiatives ................................................................................ 52
8.3.3 San Fernando LED Implementation Plan...................................................................... 53
8.4 Conclusion ............................................................................................................................. 57

iv
List of Figures
Figure 2.1: Location of the Municipality of San Fernando illustrating the distribution of Communities . 2
Figure 2.2: Age/Sex Composition of the Population of the City of San Fernando, 2000, 2011 ............ 5
Figure 2.3: Ethnic Composition of the City of San Fernando Population .............................................. 6
Figure 2.4: Religious Affiliations in City of San Fernando, 2011 ........................................................... 7
Figure 2.5: Non-Institutional Population of City of San Fernando by Educational Attainment .............. 8
Figure 2.6: National Human development Index 2008/2009 by Administrative Regions .................... 10
Figure 2.7: Inequality-adjusted National Human development Index .................................................. 11
2008/2009 by Administrative Regions ................................................................................................. 11
Figure 2.8: Police Divisions of Trinidad and Tobago ........................................................................... 13
Figure 2.9: Share of Serious Crimes by the Type of Crime in the Southern Police Division, 2010 .... 14
Figure 5.1: Employment of Household Heads 2014 Source: Central Statistical Office....................... 25
Figure 5.2: Household Heads by Occupational Groups ...................................................................... 25
Figure 6.1: Distribution of MSMEs by Ethnicity .................................................................................... 29
Figure 6.2: Male Ownership of MSMEs ............................................................................................... 30
Figure 6.3: Female Ownership of MSMEs ........................................................................................... 30
Figure 6.4: Length of Time in Operation .............................................................................................. 30
Figure 6.5: Distribution of Registered Versus Unregistered MSMEs .................................................. 30
Figure 6.6: Distribution of MSMEs by Primary Business Activities ...................................................... 32
Figure 6.7: Annual Sales for MSMEs ................................................................................................... 34
Figure 6.8: Amount Invested in Plant Equipment and Other Assets ................................................... 35
Figure 6.9: Reported Uses of Internet and Category of Business ....................................................... 36
Figure 6.10: Rating of Key Issues Faced by MSMEs .......................................................................... 38

v
List of Tables
Table 2.1: Changes in Non-institutional Population and Household Characteristics in the City of San
Fernando and Trinidad and Tobago, 2000-2011 ................................................................................... 3
Table 2.2: Population Density of the City of San Fernando, 2000 and 2011 ........................................ 4
Table 2.3: Percentage Distribution of Total Population of the City of San Fernando by Ethnic Group,
2011 ........................................................................................................................................................ 6
Table 2.4: Percentage Distribution of City of San Fernando Total Population by Religious Affiliation,
2011 ........................................................................................................................................................ 7
Table 2.5: Non-Institutional Population of City of San Fernando by Age Group and Educational
Attainment .............................................................................................................................................. 8
Table 2.6: Non-Institutional Population of City of San Fernando by Age Group and Highest
Qualification ............................................................................................................................................ 9
Table 2.7: Various Statistics on Living Conditions in City of San Fernando ........................................ 12
Table 5.2: Enterprises by Sector and Size ........................................................................................... 23
Table 6.1: Domestic Definition of Micro, Small and Medium-sized Enterprises .................................. 27
Table 6.2: Criteria Used to Define Mini-Micro, Micro and Small-sized Businesses ............................ 28
Table 6.3: Category of Business by Age of Respondent ..................................................................... 28
Table 6.4: Category of Business by Age of Respondent ..................................................................... 29
Table 6.5: Length of Time in Operation by Size of Business ............................................................... 31
Table 6.6: Legal Status of MSMEs by Size of Enterprise .................................................................... 31
Table 6.7: Key Business Activities by Size of Enterprise..................................................................... 32
Table 6.8: Key Business Activities for MSMEs by Gender .................................................................. 32
Table 6.9: Highest Level of Education Attained by Employees Generally by Category of Business .. 33
Table 6.10: Primary Markets for Goods and Services by Size of Enterprise ...................................... 33
Table 6.11: Key Suppliers of Financing for MSMEs by Size of Enterprise .......................................... 34
Table 6.12: Businesses Reporting Routine Use of Internet and Category of Business ...................... 35
Table 6.13: Sources of Technical Assistance and Training ................................................................. 36
Table 6.14: Type of Technical Assistance and Training Received ...................................................... 37

vi
Acronyms and Abbreviations
BDC - Business Development Company
CAPA - Crime and Problem Analysis Unit
CARILED - Caribbean Local Economic Development Project
CARIRI - Caribbean Industrial Research Institute
CBOs - Community Based Organisations
CBTT - Central Bank of Trinidad and Tobago
CEO - Chief Executive Officer
CARICOM - Caribbean Community
CSO - Central Statistical Office
CSEC - Caribbean Secondary Education Certificate
CSME - CARICOM Single Market and Economy
ECA - Employers’ Consultative Association of Trinidad and Tobago
EDD - Enterprise Development Division
EIF - Enterprise Investment Fund
ETIIC - Entrepreneurial Training Institute and Incubation Centre
GCE - General Certificate of Education
GORTT - Government of the Republic of Trinidad and Tobago
HDC - Housing Development Corporation
HDI - Human Development Index
HSC - Higher School Certificate
IBIS - National Integrated Business Incubation System
ICT - Information and Communications Technology
IFF - Innovation Financing Facility
INHDI - Inequality-adjusted National Human Development Index
LABIDCO - La Brea Industrial Development Company
LAEP - Local Area Economic Profile
LARPDU - Local Area and Regional Planning and Development Unit
LATT - Lake Asphalt Company of Trinidad and Tobago
LED - Local Economic Development
LEDO(s) - Local Economic Development Officer(s)
LEDU(s) - Local Economic Development Unit(s)

vii
MCD - Ministry of Community Development, Culture and the Arts
MDP - Municipal Development Plan
MEL - Micro Enterprise Loan
MIC - Metal Industries Company Limited
MLG - Ministry of Rural Development and Local Government
MOLSED - Ministry of Labour and Small Enterprise Development
MOOCs - Massive Open Online Courses
MSE(s) - Micro and Small Enterprise(s)
MSM - Micro, Small and Medium
MSME(s) - Micro, Small and Medium Enterprise(s)
NEDCO - National Entrepreneurship Development Company Limited
NESC - National Energy Skills Centre
NGC - National Gas Company of Trinidad and Tobago Ltd
NGO(s) - Non-Government Organisation(s)
NHDI - National Human Development Index
OJT - On-the-Training
SAPA - Southern Academy for the Performing Arts
SC - School Certificate
SWMCOL - Solid Waste Management Company Limited
TCPD - Town and Country Planning Division
THA - Tobago House of Assembly
TLA Trinidad Lake Asphalt
TT - Trinidad and Tobago
TT$ - Trinidad and Tobago Dollar
TVET - Technical Vocational Education and Training
UNDP - United Nations Development Programme
US$ - United States Dollar
UTT - University of Trinidad and Tobago
UWI - The University of the West Indies
WASA - Water and Sewerage Authority

1
1 Introduction
The Local Area Economic Profile (LAEP) for the City of San Fernando was developed with a view to
build on the existing Municipal Development Plan and to introduce the San Fernando City
Corporation1 to the Local Economic Development (LED) approach. The LED approach was
introduced to Trinidad and Tobago by the Federation of Canadian Municipalities through its
Caribbean Local Economic Development (CARILED) programme in collaboration with the Caribbean
Forum of Local Government Ministers, the Caribbean Association of Local Government Authorities
and the Commonwealth Local Government Forum.
The LED approach aims not only to enhance the economic capacity of a local area for the purpose
of improving living conditions but also strives to develop a business-friendly environment in which
micro-, small- and medium-sized enterprises (MSMEs) could prosper. This approach has been
advocated by the Local Area and Regional Planning and Development Unit (LARPDU) since it
creates a framework through which local government, civil society, the private sector and the local
community could collaborate to improve the local economy.
The profile for the City of San Fernando2 was developed with the aid of quantitative and qualitative
methodologies pioneered in the LED approach, which captured vital information from a range of
stakeholders in the municipality. The methodologies consisted of the following:
A review of secondary data for the City including its recent Spatial Development Plan, the
City of San Fernando Investment Plan, the National Medium-Term Policy Framework 2011 –
2014 and the National Spatial development Strategy (NSDS);
Capacity Workshops to train and sensitise the Local Economic Development Officer (LEDO)
about the approach to preparing a LAEP;
The conduct of a survey of MSMEs (120 MSME operators);
The conduct of discussions with members of the Municipal Council to glean useful insights
into opportunities for LED within San Fernando’s communities;
The conduct of focus group discussions with micro, small and medium entrepreneurs; and
The conduct of interviews with the State Agencies, Private Sector Agencies and NGOs
This draft LAEP report will profile the MSME sector and its physical and social assets in as great
detail as data permit.
1 San Fernando City Corporation means the body corporate constituted by the Chairman, Aldermen, Councilors and electors of Regional Municipality of X to which the Municipal Corporation Act (Act No. 21 of 1990) applies. 2 City of San Fernando (also called the Regional Municipality of X) refers to the geographic area (whose boundaries are applied under Section 4 of the Municipal Corporation Act (Act No. 21 of 1990).
2
2 Area Information and Demography
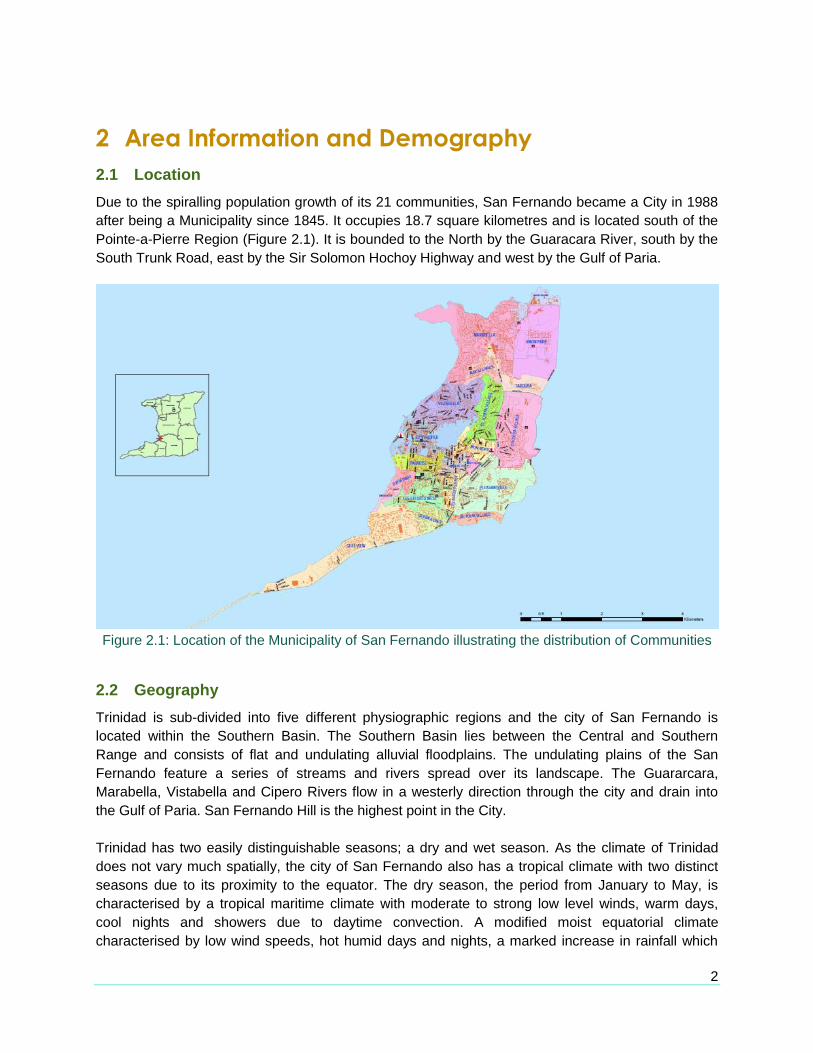
2.1 Location
Due to the spiralling population growth of its 21 communities, San Fernando became a City in 1988
after being a Municipality since 1845. It occupies 18.7 square kilometres and is located south of the
Pointe-a-Pierre Region (Figure 2.1). It is bounded to the North by the Guaracara River, south by the
South Trunk Road, east by the Sir Solomon Hochoy Highway and west by the Gulf of Paria.
Figure 2.1: Location of the Municipality of San Fernando illustrating the distribution of Communities
2.2 Geography
Trinidad is sub-divided into five different physiographic regions and the city of San Fernando is
located within the Southern Basin. The Southern Basin lies between the Central and Southern
Range and consists of flat and undulating alluvial floodplains. The undulating plains of the San
Fernando feature a series of streams and rivers spread over its landscape. The Guararcara,
Marabella, Vistabella and Cipero Rivers flow in a westerly direction through the city and drain into
the Gulf of Paria. San Fernando Hill is the highest point in the City.
Trinidad has two easily distinguishable seasons; a dry and wet season. As the climate of Trinidad
does not vary much spatially, the city of San Fernando also has a tropical climate with two distinct
seasons due to its proximity to the equator. The dry season, the period from January to May, is
characterised by a tropical maritime climate with moderate to strong low level winds, warm days,
cool nights and showers due to daytime convection. A modified moist equatorial climate
characterised by low wind speeds, hot humid days and nights, a marked increase in rainfall which

3
results mostly from migrating and latitudinal shifting equatorial weather systems, symbolizes the wet
season during June to December. Trinidad’s geographical location puts it on the southern periphery
of the North Atlantic hurricane basin.
Although the wet season is generally warmer than the dry season, Trinidad and Tobago's daily
temperature cycle is more pronounced than its seasonal cycle. The long term mean (1971 - 2000)
annual maximum and minimum temperatures are 31.3 ℃ and 22.7 ℃ respectively with a mean daily
temperature of 26.5 ℃. Trinidad’s rainfall pattern displays a distinct bi-modal behaviour with June
and November rainfall season maxima. Trinidad's primary rainfall mode occurs in June.
2.3 Population and Demography
2.3.1 Population and Household Size
According to the 2011 Population and Housing Census, the City of San Fernando has a population
of 48,838 persons. San Fernando, similarly to the city of Port of Spain and Diego Martin, showed a
population decrease of 11.9 percent. The city’s population is almost equally distributed in terms of
gender, with a female population of 25,047 (51.3%) and a male population of 23,791 (48.7%).
The 2011 census revealed that an average of three persons lived in the 15,110 recorded private
households in the City of San Fernando. The number of households decreased by 5.7 percent was
also reported from 16,016 in 2000. The household decline rate outpaced the population decline rate
and resulted in a decline in the size of the average household since the 2000 Census of 0.2 persons,
down from 3.5 persons per household (Table 2.1).
Table 2.1: Changes in Non-institutional Population and Household Characteristics in the City of San Fernando and Trinidad and Tobago, 2000-2011
Country/
Region
Non-Institutional
Population
Number of
Occupied Private
Households
Average
Household
Size
Average
Annual
Rate of
Growth in
Population
Average
Annual
Rate of
Growth In
Households
2011 2000 2011 2000 2011 2000 2000-2011 2000-2011
Trinidad and
Tobago
1,322,546 1,250,652 401,382 343,180 3.3 3.6 0.5% 1.5%
Trinidad 1,261,812 1,197,426 381,257 328,000 3.3 3.7 0.5% 1.4%
City of San
Fernando 48,635 55,042 15,110 16,016 3.2 3.4 -1.2% -0.6%
Source: CSO 2011 Population and Housing Census
2.3.2 Population Density
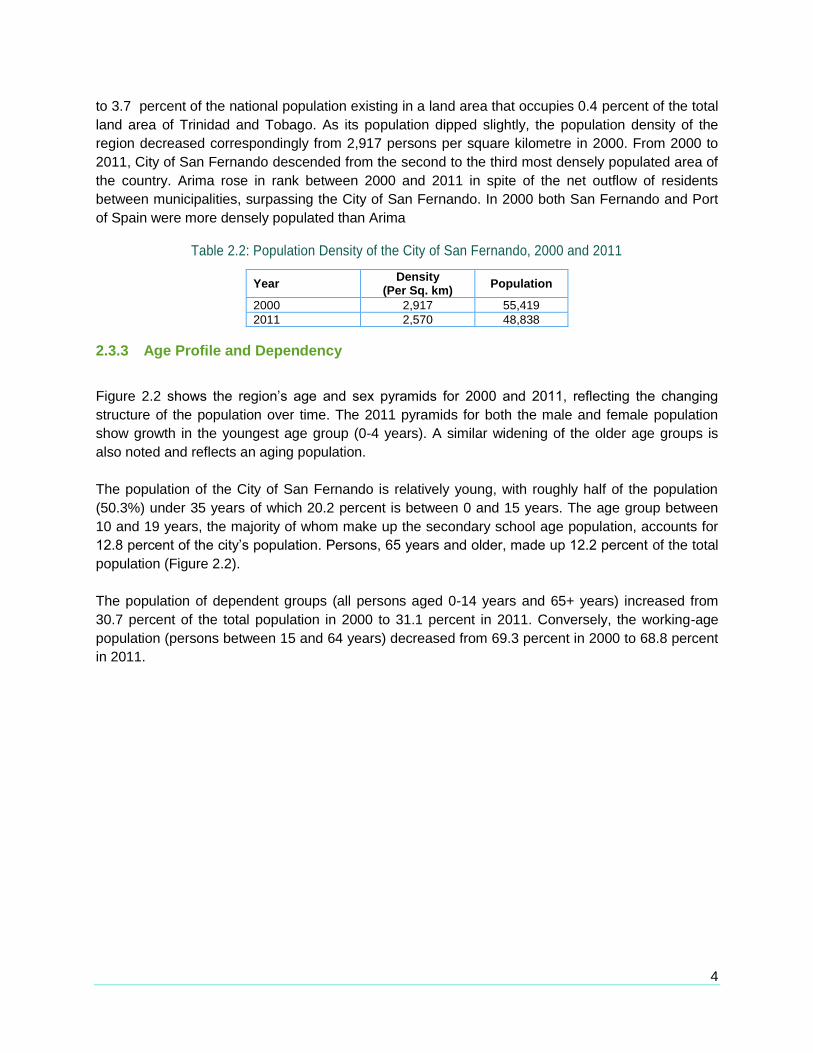
Table 2.2 highlighted that in 2011, the region of San Fernando was the third most densely populated
area of Trinidad and Tobago with a density of 2,570 persons per square kilometre. The region’s
population density is higher than the national average of 259 person per square kilometre and is due
4
to 3.7 percent of the national population existing in a land area that occupies 0.4 percent of the total
land area of Trinidad and Tobago. As its population dipped slightly, the population density of the
region decreased correspondingly from 2,917 persons per square kilometre in 2000. From 2000 to
2011, City of San Fernando descended from the second to the third most densely populated area of
the country. Arima rose in rank between 2000 and 2011 in spite of the net outflow of residents
between municipalities, surpassing the City of San Fernando. In 2000 both San Fernando and Port
of Spain were more densely populated than Arima
Table 2.2: Population Density of the City of San Fernando, 2000 and 2011
Year Density
(Per Sq. km) Population
2000 2,917 55,419
2011 2,570 48,838
2.3.3 Age Profile and Dependency
Figure 2.2 shows the region’s age and sex pyramids for 2000 and 2011, reflecting the changing
structure of the population over time. The 2011 pyramids for both the male and female population
show growth in the youngest age group (0-4 years). A similar widening of the older age groups is
also noted and reflects an aging population.
The population of the City of San Fernando is relatively young, with roughly half of the population
(50.3%) under 35 years of which 20.2 percent is between 0 and 15 years. The age group between
10 and 19 years, the majority of whom make up the secondary school age population, accounts for
12.8 percent of the city’s population. Persons, 65 years and older, made up 12.2 percent of the total
population (Figure 2.2).
The population of dependent groups (all persons aged 0-14 years and 65+ years) increased from
30.7 percent of the total population in 2000 to 31.1 percent in 2011. Conversely, the working-age
population (persons between 15 and 64 years) decreased from 69.3 percent in 2000 to 68.8 percent
in 2011.

5
Figure 2.2: Age/Sex Composition of the Population of the City of San Fernando, 2000, 2011
The age dependency ratio (the ratio of the population between 0 and 14 years and 65+ years to the
working- age population, between 15 and 65 years) for the City in 2011 stood at 45.1 percent; this
was above the national ratio of 41.9 percent and was due primarily to increased aging population.
This ratio represents an improvement compared to the 2000 figure of 47.6 percent. The child
dependency ratio in 2011 was estimated at 27.5 percent, and elderly dependency at 17.7 percent.
2.3.4 Ethnicity
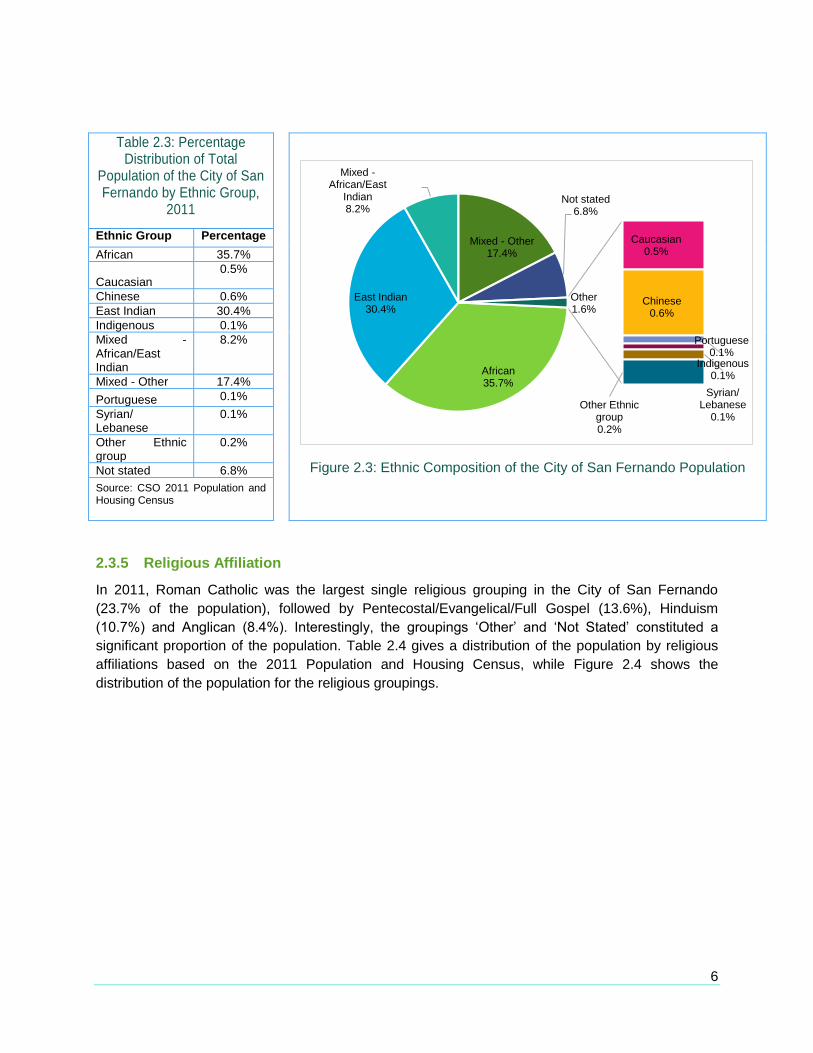
Trinidad and Tobago as a country, is a plural society and as such the City of San Fernando’s
population is diverse in terms of ethnic composition (Table 2.3). Africans and East Indians, with 35.7
and 30.4 percent of the total population respectively, are the predominant ethnic groups, followed by
the ‘Mixed- Other’ group which made up 17.4 percent and ‘Mixed- African/ East Indian’ group, which
account for 8.2 percent (Figure 2.3).
6
Table 2.3: Percentage Distribution of Total
Population of the City of San Fernando by Ethnic Group,
2011
Figure 2.3: Ethnic Composition of the City of San Fernando Population
Ethnic Group Percentage
African 35.7%
Caucasian 0.5%
Chinese 0.6%
East Indian 30.4%
Indigenous 0.1%
Mixed - African/East Indian
8.2%
Mixed - Other 17.4%
Portuguese 0.1%
Syrian/ Lebanese
0.1%
Other Ethnic group
0.2%
Not stated 6.8%
Source: CSO 2011 Population and Housing Census
2.3.5 Religious Affiliation
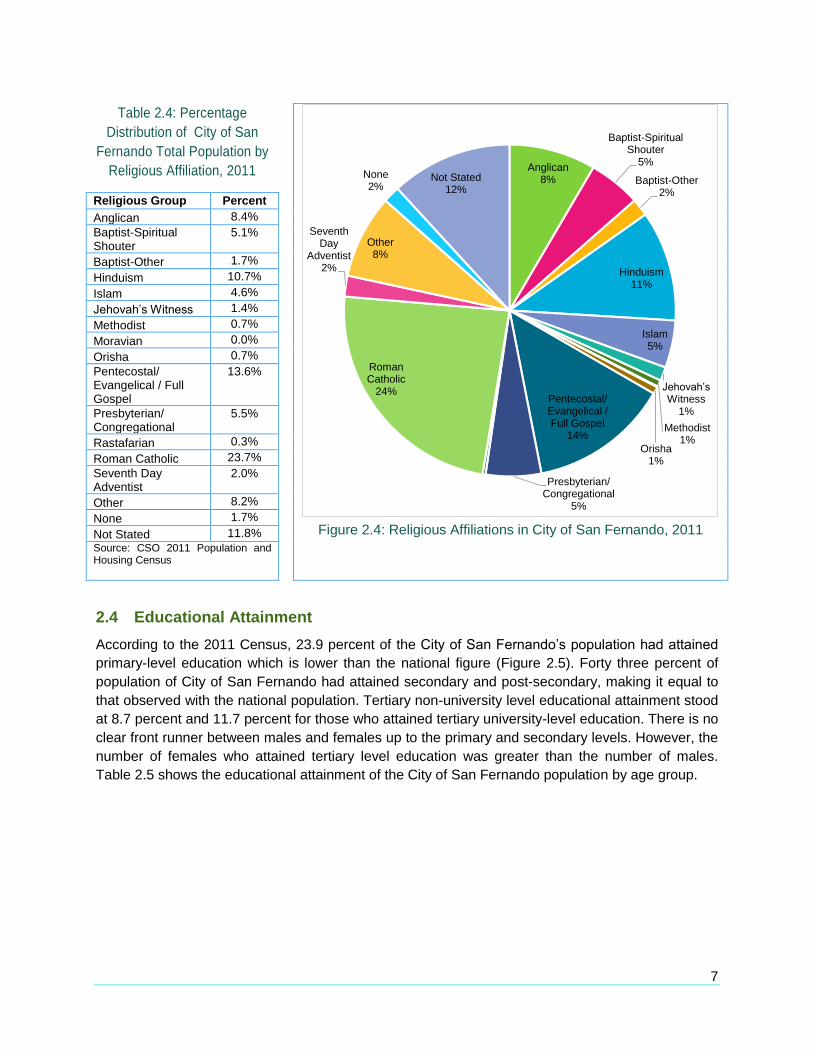
In 2011, Roman Catholic was the largest single religious grouping in the City of San Fernando
(23.7% of the population), followed by Pentecostal/Evangelical/Full Gospel (13.6%), Hinduism
(10.7%) and Anglican (8.4%). Interestingly, the groupings ‘Other’ and ‘Not Stated’ constituted a
significant proportion of the population. Table 2.4 gives a distribution of the population by religious
affiliations based on the 2011 Population and Housing Census, while Figure 2.4 shows the
distribution of the population for the religious groupings.
African35.7%
Caucasian0.5%
Chinese0.6%
East Indian30.4%
Indigenous0.1%
Mixed -African/East
Indian8.2%
Mixed - Other17.4%
Portuguese0.1%
Syrian/Lebanese
0.1%Other Ethnic
group0.2%
Not stated6.8%
Other1.6%
7
2.4 Educational Attainment
According to the 2011 Census, 23.9 percent of the City of San Fernando’s population had attained
primary-level education which is lower than the national figure (Figure 2.5). Forty three percent of
population of City of San Fernando had attained secondary and post-secondary, making it equal to
that observed with the national population. Tertiary non-university level educational attainment stood
at 8.7 percent and 11.7 percent for those who attained tertiary university-level education. There is no
clear front runner between males and females up to the primary and secondary levels. However, the
number of females who attained tertiary level education was greater than the number of males.
Table 2.5 shows the educational attainment of the City of San Fernando population by age group.
Table 2.4: Percentage
Distribution of City of San
Fernando Total Population by
Religious Affiliation, 2011
Figure 2.4: Religious Affiliations in City of San Fernando, 2011
Religious Group Percent
Anglican 8.4%
Baptist-Spiritual Shouter
5.1%
Baptist-Other 1.7%
Hinduism 10.7%
Islam 4.6%
Jehovah’s Witness 1.4%
Methodist 0.7%
Moravian 0.0%
Orisha 0.7%
Pentecostal/ Evangelical / Full Gospel
13.6%
Presbyterian/ Congregational
5.5%
Rastafarian 0.3%
Roman Catholic 23.7%
Seventh Day Adventist
2.0%
Other 8.2%
None 1.7%
Not Stated 11.8%
Source: CSO 2011 Population and Housing Census
Anglican8%
Baptist-Spiritual Shouter
5%
Baptist-Other2%
Hinduism11%
Islam5%
Jehovah’s Witness
1%
Methodist1%
Orisha1%
Pentecostal/ Evangelical / Full Gospel
14%
Presbyterian/ Congregational
5%
Roman Catholic
24%
Seventh Day
Adventist2%
Other8%
None2%
Not Stated12%

8
Figure 2.5: Non-Institutional Population of City of San Fernando by Educational Attainment
Source: CSO Population and Housing Census, 2011
Table 2.5: Non-Institutional Population of City of San Fernando by Age Group and Educational Attainment
Age Total
No
ne
Nu
rse
ry/
Kin
de
rga
rten
Pri
ma
ry
Se
co
nd
ary
Po
st-
Se
co
nd
ary
Te
rtia
ry/
No
n
Un
ive
rsit
y
Te
rtia
ry/
Un
ive
rsit
y
Oth
er
No
t
Ap
pli
ca
ble
No
t S
tate
d
City of San Fernando
48,635 601 1,313 11,644 19,670 1,516 4,227 5,674 577 2,073 1,341
0 – 4 3,122 - 1,032 17 - - - - - 2,073 - 5 - 9 3,138 60 227 2,809 - - - - - - 42
10 – 14 2,959 50 34 1,505 1,361 - - - - - 8
15 - 19 3,276 24 6 153 2,488 139 207 182 44 - 33
20 - 24 3,876 20 1 104 1,933 182 583 913 76 - 64
25 – 29 4,367 20 - 253 2,206 162 684 879 59 - 104
30 – 34 3,819 14 1 194 2,025 150 534 760 47 - 94
35 - 39 3,217 15 1 187 1,844 107 409 526 26 - 102
40 - 44 2,852 20 1 299 1,582 114 319 388 32 - 96
45 - 49 3,368 50 1 610 1,612 121 347 421 58 - 148
50 - 54 3,384 31 2 923 1,325 151 338 417 64 - 133
55 - 59 2,901 35 1 875 1,052 122 255 402 41 - 117
60 - 64 2,526 44 - 888 851 92 201 305 40 - 104
65 - 69 2,009 51 - 826 612 77 132 191 33 - 85
70 - 74 1,380 35 2 691 330 41 87 133 13 - 48
75 -79 1,039 51 2 512 208 28 77 84 11 - 64
80+ 1,401 79 - 798 238 30 54 72 33 - 99
Source: CSO Population and Housing Census, 2011
None; 1.2%Nursery Kinder-Garden;
2.7%
Primary; 23.9%
Secondary; 40.4%
Post Secondary; 3.1%
Tertiary/ Non University; 8.7%
Tertiary/ University;
11.7%
Other; 1.2%
Not Applicable; 4.3%
Not Stated; 2.8%

9
Examination of the highest qualification attained by the City of San Fernando’s population showed
that some 39.3 percent of those 15 years or older had no qualifications. This group would also
include some persons who may not have written examinations to receive certification. Table 2.6
shows that 3.4 percent indicated that their highest qualification attained was school leaving
certificate, with another 0.7 percent reporting that they attained CSEC Basic as their highest
qualification.
Just over one fifth of the population (22.3%) attained General Certificate of Education (GCE)
Ordinary (‘O’) level/CSEC General or Caribbean Advanced Proficiency Examinations (CAPE)/GCE
‘A’ Levels as their highest educational qualification, while 10.1 percent were granted Diplomas,
Associate Degrees or Equivalent Certification. Another 6.3 percent would have achieved, either a
Bachelor’s degree, Post Graduate Diploma/ Professional Qualification or a Master’s degree. Some
0.3 percent of the population 15 years and older earned doctorate degrees. More women attained
Bachelors, Masters and professional certification than their male counterparts. This can be seen in
Table 2.6.
Table 2.6: Non-Institutional Population of City of San Fernando by Age Group and Highest Qualification
City of San Fernando Female Population Male Population
No of Persons
Percentage of Population
No of Persons
Percentage of Population
No of Persons
Percentage of Population
Total 48,635 100 24,955 100.0% 23,680 100
None 19,129 39.3% 9,489 38.0% 9,640 40.7%
School Leaving Certification 1,648 3.4% 877 3.5% 772 3.3%
CSEC Basic 329 0.7% 153 0.6% 176 0.7%
GCE ‘O’/CSEC Gen/SC 9,701 19.9% 5,284 21.2% 4,417 18.7%
GCE “A”/CAPE/HSC 1,150 2.4% 628 2.5% 521 2.2%
Diploma or Equivalent Certificate of Achievement 3,811 7.8% 2,000 8.0% 1,811 7.6%
Associate Degree Higher Diploma 1,119 2.3% 641 2.6% 478 2.0%
Bachelor Degree 2,177 4.5% 1,213 4.9% 963 4.1%
Master Degree 581 1.2% 291 1.2% 289 1.2%
Post Graduate Diploma/ Professional Qualification 306 0.6% 164 0.7% 142 0.6%
Doctorate 133 0.3% 44 0.2% 89 0.4%
Other 290 0.6% 153 0.6% 138 0.6%
Not Stated 8,261 17.0% 4,017 16.1% 4,244 17.9%
SC: School Certificate; Higher School Certificate Source: CSO Population and Housing Census, 2011
About 62 percent of persons in the age groups 20-24 years to 40-44 years had qualifications of
CSEC/GCE ‘O’ levels and above. About 66 percent of the population in the 20-24 age grouping had
obtained CSEC/GCE “O” level passes and above, demonstrating higher levels of educational
qualification compared to the older age groups. Further, as much as 26 percent of the population
within the age group of 15-19 years to the 54-59 years reported that they did not have any
certification, thereby placing them in a “low skill trap” where they are not likely to participate in
certification programmes on their own unless motivated to do so.

10
2.5 Living Conditions in San Fernando
The United Nations Development Programme (UNDP)/CSO Trinidad and Tobago Human
Development Atlas notes, “Giving people the choice to enjoy a long and healthy life; being educated;
having access to resources that enable one to live in dignity; and being able to participate in
decisions that affect one’s community are core capacities for human development.” The National
Human Development Index (NHDI), developed by CSO is based on Human Development Index
(HDI) developed by UNDP and measures the level of human development of Trinidad and Tobago
and its sub-regions, using three basic dimensions of human development – a long and healthy life,
knowledge, and a decent standard of living. Figure 2.6 shows the NHDI for the various regions within
the country. City of San Fernando was ranked among the highest with an NHDI at 0.727.
Measurement of the Inequality-adjusted NHDI (INHDI)3 ranked City of San Fernando as the highest
in the country with respect to human development with a value of 0.666 (Figure 2.7). With regard to
the dimensions of health, education and income for the INHDI, City of San Fernando was ranked
among the highest.
Figure 2.6: National Human development Index 2008/2009 by Administrative Regions
Source: Trinidad and Tobago Human Development Profile, 2012
3 Trinidad and Tobago Human Development Profile, 2012. Website source: http://www.planning.gov.tt/sites/default/files/content/mediacentre/documents/Human_Development_Atlas.pdf.

11
Figure 2.7: Inequality-adjusted National Human development Index
2008/2009 by Administrative Regions
Source: Trinidad and Tobago Human Development Profile, 2012
Table 2.7 presents statistics highlighting living conditions in the City of San Fernando taken from the
Trinidad and Tobago Human Development Atlas. The Atlas provided information on the NHDI and its
dimension indicators, which were disaggregated at the sub-regional level to compare levels and
disparities among different sub-populations within the country. Data from the Atlas highlight the
following:
The City of San Fernando had the highest in household income per capita per annum.
The City of San Fernando, with an education attainment rate of 95.7 percent for both females
and males between the ages of 6 and 16 years, was among the regions with a high
education attainment rate. Similarly, the city had the highest educational attainment rate
(78.4%) for persons above 17 years and older who have attained secondary level education
and higher.
The City of San Fernando was among the regions that scored the lowest in the gender
inequality index indicating that gender inequalities was lower in the City of San Fernando
compared to other regions in the country.
The City of San Fernando had the lowest Multidimensional Poverty Index (MPI), indicating a
lower incidence and intensity of poverty compared to those areas with higher indices.
The city was among the regions which had a lower rate of adolescent births.
The City of San Fernando had the highest female labour force participation rate in the
country (54.9%).

12
The City of San Fernando recorded a low life expectancy, higher than the national average
of 73.2 years for both sexes; 70.2 years for males; and 76.5 years for females. The City of
San Fernando has a comparable incidence of chronic diseases of 21.5 percent.
Consumption of iodised salt was slightly lower in the City of San Fernando, indicating that
children from the island were at risk of iodine deficiency disorder, which in turn can decrease
susceptibility to miscarriages and still births.
The city recorded the lowest percentage without adequate sanitation facilities,4 with 2.5
percent of its households.5
Table 2.7: Various Statistics on Living Conditions in City of San Fernando
Indicators Value
Rank and Rating out of the Country’s 15
Administrative Regions
Total population, 2011 48,838 5th (low-medium)
National human development index, 2010 0.727 12th (medium-high)
Population having chronic illnesses6, 2008/2009 (%) 21.5 6th (low-medium)
Primary and secondary educational attainment rate7, 2008/2009 (%) 95.7 8th (low-medium)
Secondary and higher educational attainment rate ages 17 and above, 2008/2009 (%)
78.4 1st (high)
Household income per capita (TT$/US$) 34,467/ 7,477 15th (high)
Inequality-adjusted national human development index, 2010 0.666 15th (high)
Gender inequality index, 2010 0.312 2nd (low)
Adolescent fertility rate8, 2010 34.7 3rd (low)
Multidimensional poverty index (MPI), 2006 0.007 1st (low)
Intensity of multidimensional poverty, 2006 (%) 24.8 2nd (low)
Incidence of multidimensional poverty, 2006 (%) 2.7 1st (low)
Life expectancy at birth, 2010 (years) 69.6 14th (low)
Households in which a child died, 2006 (%) 2.3 3rd (low)
Population without electricity, 2006 (%) 0.6 2nd (low)
Population access to without clean drinking water, 2006 (%) 0 1st (low)
Population access to without improved sanitation9, 2006 (%) 2.5 15th (low)
Population not consuming iodised salt (%) 65.2 10th (medium-high)
Labour force population – male (%) 71.6 10th (low-medium)
Labour force population – female (%) 54.9 3rd (high)
Source: Trinidad and Tobago Human Development Profile, 2012
4 Trinidad and Tobago Human Development Profile, 2012. Website source: http://www.planning.gov.tt/sites/default/files/content/mediacentre/documents/Human_Development_Atlas.pdf. 5 Anecdotal evidence suggests that this situation may have greatly improved over the last eight years. 6 The chronic illnesses include: Heart Disease, Cancer, HIV/AIDS, Lupus, Kidney Disease, Sickle Cell Anemia, Lung Disease, Epilepsy, Neurological Disorder, Clinical Mental Disease. 7 Primary and secondary educational attainment rate refers to the percentage of children between ages 6-16 who have attained primary or secondary school level of education. 8 Number of birth among women 15-19 years per 1,000 women (CSO: Population, Social and Vital Statistics Division 2010) 9 Population without Access to improved Sanitation Facilities (2006) Population without access to improved sanitation facilities refers to the proportion of the population with sanitation facilities that are not improved or sanitation facilities which are improved but shared with other house-holds (the toilet is shared) (Ministry of the People and Social Development, Multiple Indicator Cluster Survey III, 2006). Improved sanitation facilities for excreta disposal are the followings: flush or pour-flush to a piped sewer system, septic tank, or latrine; ventilated improved pit (VIP) latrine and pit latrine with slab.

13
2.5.1 Crime
The Human Development Atlas acknowledges that “Crime and Violence continues to be one of the
most critical areas that need to be addressed in the context of national development. Economic
growth and meaningful democracy will not be possible unless crime and violence is brought under
control and all citizens can feel safe and secure.” For the City of San Fernando, where tourism is a
key economic driver and any incidence of crime against tourists can damage its reputation as a safe
destination, this is even more critical. Figure 2.8 illustrated that the City of San Fernando is policed
by the Southern Police Division. The 2010 Citizen Security Survey showed that in City of San
Fernando, compared to all other areas, had a comparable percentage of victims of crime (22.1%)
within the last 10 years and persons reporting that crime was a problem in their community (49.7%).
Thirteen percent of City of San Fernando’s respondents indicated that there was a gang in their
neighbourhood. Residents in City of San Fernando also did not feel safe and this was reflected in
the survey by the low percentage of persons who felt very secure (2.8%). However, more than one
half of respondents felt fearful in the last year about the possibility of becoming a victim of crime
(53.6%) and did not have much confidence in the police services in effectively controlling the crime
problem in the country (47.5%).
Figure 2.8: Police Divisions of Trinidad and Tobago

14
According to statistics on crime and violence in the various police divisions compiled by the Crime
and Problem Analysis Unit (CAPA) of the Trinidad and Tobago Police Service, City of San Fernando
had the third lowest level of reported serious crime per 100,000 persons in the country. It was less
than half the number reported in Port of Spain Division which had the highest reported level of
serious crime (4,800.5 reports). Figure 2.9 highlighted that serious crimes of major concern in City of
San Fernando included burglaries and break-ins, general larceny and robberies, with 286.4, 230.1
and 288 reported cases per 100,000 persons, respectively. With one of the highest number of
reported cases, it would also be important to pay particular attention to larceny of motor vehicles
(89.5 reported cases).
Figure 2.9: Share of Serious Crimes by the Type of Crime in the Southern Police Division, 2010
Source: Trinidad and Tobago Human Development Profile, 2012
Murder; 2.0%
Woundings and Shootings; 2.4%
Rape Incest, Sexual offences; 3.0%
Serious Indecency; 0.5%
Kidnapping; 0.7%
Burglaries and Breakings; 24.8%
Robberies; 25.0%
Fraud Offences; 2.0%General Larceny; 19.9%Larceny Motor Vechiles,
7.8%
Larceny Dwelling House; 3.5%
Narcotic Offences; 2.8%
Other serious crimes; 5.7%
15
3 Land Use and Land Resources The City of San Fernando is distinctive in its topography. The San Fernando Hill is a land-mark that
stands out in the distance and imposes a unique environment as the built development is on land
that tapers out from the hill to flat lands of the undulating plains on the north, east and south. Much
of the inner city is hilly by nature of physical development that has evolved and the contours that
have been set for streets and the arterial system of the City.
San Fernando is bounded on the north and east by the Couva/Tabaquite/Talparo Municipality, on
the east by the Princes Town Municipality and on the south by the Penal/Debe Municipality. The Gulf
of Paria sets its western limit, and constitutes its coastline. It has historically has been the second
city of Trinidad and continues to enjoy that status having regard to its location in the south of
Trinidad and to the nature of commercial and industrial development that has taken place in this part
of the country over the last century. It is regarded as the industrial capital of Trinidad and is the
commercial and trading centre for the south of the island.
3.1 Land Use and Resources
This municipality is a city comprised of 21 communities, with a downtown core and a number of
surrounding suburban neighbourhoods from the most elite districts of Gulf View in the south to inner
city settlements of lower income groups. The older settlements have evolved into commercial
developments, and suburban communities on the north and northeast account for almost half of the
land area and population of the city. Much of the suburban growth is accounted for by the expansion
of the petro-chemical industry initially at Pointe-a-Pierre and then subsequently with the
establishment of energy-intensive industry at Point Lisas. The largest of these communities is
Marabella. Other major communities are St. Joseph Village, Cocoyea Village, Maraj Lands, Tarouba,
Union Park and Union Village.
More recent developments on the south are Pleasantville, Victoria Village, Green Acres and the
high-end community of Gulf View. The latter is the location of a major mall and commercial node that
serves southern San Fernando and surrounding communities, but also attracts clientele from a wider
expanse in southern Trinidad. There are four squatter settlements located on State lands, but there
are also informal settlements on private lands. Embacadere is the only inner-city area of informal
settlement on state land. There has been major expansion of housing estates on the east and south
east of the city in the last few years, as part of the programme of the Housing Development
Corporation (HDC).
In line with the Town and Country Planning Act, the land use in the City of San Fernando is
governed and administered via the Town and Country Planning Division. Consequently, the lands
within the City of San Fernando are without usage for agriculture, particularly sugar cane, which was
very prominent in the region. The designation of the municipality as a city along with economic
prosperity in the past three decades have ensured a boom in urban and suburban growth that has
resulted in that its land use pattern seen in Figure 3.1. The vast majority of the city (87%) has been

16
used for residential purposes10. When taken together with institutional, industrial and commercial
buildings, it is not surprising that movement within the boundaries of the city allows for very limited
opportunities for encountering of greenfield sites.
Figure 3.1: Land Use in the Municipality of San Fernando
The Hill that dominates the skyline has been subjected to quarrying and the resulting degradation of
environment. However, there has been effort to restore the hill for its aesthetic value by the
replanting of tree and the encouragement of vegetation. It is now open to public use as an area for
sitting out and as a look out to the surrounding communities and the sea. The Guaracara River to
the north separates the City from the Municipality of Couva/Tabaquite/Talparo, and runs between
the community of Marabella and the Pointe-a-Pierre industrial complex. It has been heavily polluted
from residential run-off from Marabella and industrial waste from the oil refinery at Pointe-a-Pierre.
The City holds a unique environmental setting due to its coastal location and the strong visual
backdrop provided by the San Fernando Hill. With a view to restore the glory of the waterfront’s
historically rich significance, the redevelopment of San Fernando Waterfront and the subsequent
requirement for the preparation of a Feasibility Study has been undertaken within the context of the
Government of Trinidad and Tobago’s commitment to guide development by setting national
economic, environmental and social priorities. The study was done with a view to implement
measures that enable San Fernando to ensure that the waterfront is a truly public place that
welcomes all residents and visitors and respects the princiles of sustainable development, to regain
its identity as a coastal city, to restore the historic link between the waterfront and the city and lastly
to create an attractive healthy and secure environment by promoting functional, educational and
recreational activities. The Feasibility Study recommended that an Integrated Development
Programme be implemented in four phases over a 10 year period. Cabinet agreed to the
establishment of a Waterfront Redevelopment Board which will provide advice, guidance and
10 http://www.localgov.gov.tt/~/media/Resource%20Library/Spatial%20Development%20Plans%20Per%20Corporation/ San%20Fernando%20City%20Corporation%20Spatial%20Development%20Plan.ashx
Agriculture1%
Commercial3%
Environmentally Sensitive Area
1%Industrial
3%Institutional
2%
Recreational/ Open Space
3%
Residential87%

17
oversight to ensure that the various phases of the Waterfront development are in accordance with
the policies and legal requirements of the project.
The municipality benefits direct access from the north Trinidad via the Solomon Hochoy and the
Uriah Butler Highways in addition to the Southern Main Road and from the east by a number of
arterial links to communities in the east by the Naparima-Mayaro Road to Princes Town and Rio
Claro, and to the south by the South Trunk Road and to the south east by Golconda Road and the
extension of the major highway to Penal. In view of the moderate densities in the municipality,
moving forward it is likely that new developments will be forced to take the form of redevelopment of
current built infrastructure or infill.

18
3.2 Coastal and Marine Resources
The areas just outside of the city are defined largely by mangrove and coastal areas to the south
and north. The west coast of Trinidad is home to a large system of wetlands, a subset of which is
located within the municipality of San Fernando. The Godineau Swamp, which comprises roughly
3,171 hectares of mangrove swamp and tidal marsh, accounts for 31.4 percent of the west coast
wetlands of Trinidad.

19
4 Municipal Physical and Social Assets
4.1 Physical Infrastructure
4.1.1 Information and Communications Technology Infrastructure
The City is well supplied with a telecommunications infrastructure: the Telecommunications Services
of Trinidad and Tobago (TSTT) and Columbus Communications Trinidad Limited (CCTL) are the
main providers. As a hub of business and commerce in the south of Trinidad, the major providers set
a high premium on a reach to all areas of the City.
San Fernando has two radio stations, WACK Radio 90.1 FM and Vibe CT 105 FM. They provide
different genres of music including: soca, calypso and pop (local artistes). The Advanced Community
Television Station is streamed and is available on UHF. They stream international programmes and
religious programmes.
4.1.2 Storm Water Management and Coastal Protection
There are parts of the city that have been subjected to flooding in recent years. The concentration of
built development has reduced permeability with consequences for flow of water in rainfall events.
The drainage infrastructure is inadequate and needs to be addressed to avoid damage to property,
disruption of business activity including that of MSMEs, on the occasion of heavy rain episodes.
Moreover, in the light of sea level rise as a result of global warming, there is need to address the
protection of the mangrove as part of sea defences along the coast line of the city.
4.1.3 Transportation
The City is subject to traffic congestion, with negative impact on residents and commuters into and
outgoing from the city. Insufficient parking on-street and limited number of arterial roads create
congestion in local traffic flows. The build-up of carbon dioxide gas, petrol fumes and particles from
automobile and transport vehicles are a source of environmental pollution in the city.
The public transportation system has not been able to pace with the needs of the population.
Mobility within the city is provided largely by taxis and private cars. Most of the work-force in San
Fernando lives outside of the city, Secondary schools in the downtown area are attended by
hundreds of children from outside of the city. Commuters entering the city and others leaving the city
for employment all create a logjam. The costs and challenge in mobility all impact on doing business
in the city.
4.1.4 Water Supply and Distribution
Water supply and distribution have been the focus of attention in the more recent past and San
Fernando, like a number of areas, is now better served and with greater regularity.
4.1.5 Electricity
Electricity supply is universal in the area, and there would be few households without access to
electricity, unless they are in abject poverty.

20
4.1.6 Wastewater Management
Wastewater management and treatment remain a major problem to be addressed in the city. There
is uncontrolled waste discharge from residences and treatment plants are functioning below par.
Ultimately, Water and Sewerage Authority (WASA) is responsible for the development and
implementation of a Waste Water Plan for the City.
4.1.7 Solid Waste Management
The expansion of housing brings with it, expanded demand and need for solid waste management
for the city. The fact that the Solid Waste Management Company Limited (SWMCOL) has developed
a faecal waste system for the San Fernando City Corporation is identified as one of its successes.11
There are plans to establish a Trinidad and Tobago Solid Waste Management Authority, as part of
the strategy to engage the society in waste minimisation and waste separation, from which the city
will benefit.
4.2 Social/Cultural Infrastructure
4.2.1 Dwelling and Building Stock
The Municipality has had an expansion in its housing stock in recent years, with investments made
by the state through the Housing Development Corporation and by the private sector. Indeed, the
City is well represented in the distribution of homes being conducted by the Government through the
HDC.
The City has experienced some major building projects in the last two years. The San Fernando
Hospital has been expanded into a modern facility, and is now a Teaching Hospital. A major
Shopping Complex and entertainment centre involving some 20 acres are being constructed at
Corinth and will include a supermarket and Movie Towne. It will add substantially to the commercial
space in the city.
4.3 Social Facilities
4.3.1 Education
The city is well supplied with school places at primary and secondary levels relative to its population,
However, residents find themselves in competition from students in other locations, for the places in
the city especially at the secondary level. The four prestige schools attract students from outside of
the city and all over South and Central Trinidad.
At the tertiary level, there is a UWI Open Campus located in the city, where students can get a start
before they go to the Main Campus in St. Augustine for their final years. The UTT campus provides
students with the Process and Utilities Engineering Technology Certificates, Diplomas and Bachelor
of Engineering programmes. This campus has fully equipped laboratories and facilities. Neither UWI
nor UTT offer programmes that extend specifically to persons engaged in MSMEs.
11 http://www.swmcol.co.tt/events/153-successes.html

21
4.3.2 Health
Primary health care facilities are relatively readily accessible with Health Centres at Marabella and
Pleasantville. Secondary care services and tertiary services are available at San Fernando General
Hospital. The expansion of the latter with new facilities has brought an even wider range of services
to the City, and most of South Trinidad.
4.3.3 Disaster Management
Within the City Corporation, there exists the Disaster Management Unit which is linked to the Office
of Disaster Preparedness and Management, the national organisation charged with the responsibility
of disaster preparedness for the nation. The Disaster Management Plan recognises the possibilities
of natural and man-made disasters.
The Unit has to be sensitive to the presence in the neighbouring municipality of a number of major
industrial plants at Point Lisas and Savonetta, some utilising massive energy, as well as an industrial
port managing highly flammable exports. Catastrophic failure and major industrial accidents in that
area could impact adjoining communities in Marabella and Union Village.
4.3.4 Social Services and Community Development
Social services agencies beyond health and educational facilities are available across the various
communities. The Ministry of Social Development and Family Services established a Regional Social
& Human Development Council that brings together all the public social service providers of the area
as well as Private Sector Organisations and NGOs, to coordinate efforts at poverty reduction and
social services delivery. The Council’s remit is to:
Appraise, monitor and evaluate grants to NGO’s/CBO’s in the region under the Regional
Micro Project Funds (RMPF);
Identify and analyse the needs and responses in the regions; and
Develop integrated anti-poverty strategies for the regions;
Its work places it in direct contact with the MSMEs of the municipality. Residents can secure training
in basic and advanced computer literacy, and computer and business services.
4.3.5 Recreation, Sports and Entertainment
The City is the location of the Southern Academy for Performing Arts which seats 770 persons. The
UTT Campus for the Performing Arts is also housed at Southern Academy for the Performing Arts,
and offers an undergraduate programme previously only offered in the city of Port-of-Spain.
Skinner Park in the city is famous for hosting sport and cultural programmes. Around Carnival
season, Skinner Park is especially busy as it hosts many shows and competitions there. Cycling
events also take place at this venue.
Palmiste National Park, a 40 acre park situated on the edge of San Fernando, provides an ideal
setting for outdoor recreation. Features include a heart-shaped pond, jogging pathway, picnic areas,
gardens, nature trails, fields and parking facilities. There are four major parks, and fifteen playing
fields in the City,
22
5 The Area Economy
5.1 Gross Domestic Product of Trinidad and Tobago
The economy of Trinidad and Tobago witnessed reduced growth over the period January to
September 2014 of 0.7 percent which followed on a period of sustained expansion of 2.1 percent in
the fourth quarter of 2013, see Table 5.1 below. An unanticipated decline in the performance of the
energy sector during the first two quarters of 2014 was the largest factor contributing to the sluggish
growth observed. Nevertheless, this was largely offset by continued growth in the non-energy sector
for the same period. Increased production in petrochemicals and natural gas in the third quarter
resulted in an expansion of the energy sector of 2.8 percent subsequent to the previous two quarters
of decline. This third quarter expansion could be attributed to growth of 3.6 percent observed in
natural gas production when compared with the same period in 2013 when large-scale maintenance
activity occasioned a reduction of 4.6 percent.
The momentum in fourth quarter non-energy sector growth was sustained in 2013 of 1.9 percent
was sustained into the first three quarters of 2014 where an average growth rate of 2.2 percent was
observed. The continued growth resulted largely due to strong activity in the finance, distribution and
construction sectors. Substantial increases in local cement sales precipitated average growth rate of
3.1 percent observed in the construction sector over the first three quarters of 2014. Robust activity
in the construction sector was reflective of numerous continuing large-scale public sector
developments including but not limited to the Port at Point Galeota, the National Aquatic Centre, the
Children’s Hospital, and the Point Fortin Highway. Greater production of materials required for
construction as well as cement caused the growth observed in manufacturing sector growth of 1.2
percent. New car sales drove the growth observed in the distribution sector while resilient activity in
commercial banking stimulated financial sector growth of 3.2 percent. At the national level,
agriculture grow on average by 3.5 percent for the first 3 quarters of 2014.
The third quarter of also 2014 witnessed increased inflationary pressures following comparative calm
over the three preceding quarters. Inflationary pressures were propelled largely by prices of food and
greater spending by consumers as demonstrated by precipitous growth in new car sales, robust
growth in consumer lending and notable increases in government spending. Headline inflation by the
third quarter of 2014 increased from 3.4 percent for the first two quarters to roughly 8 percent by the
end of the third quarter of 2014. Food price inflation for the third quarter rose to 18.2 percent up from
an average of 4.4 percent over the preceding two quarters of 2014. Increases in the prices of
vegetables, fruit and other food products were the primary contributing factors. Furthermore, the
most recent official estimates on the labour force have indicated that unemployment is at a historic
low of 3.1 percent for the first quarter of 2014. Robust labour force participation and increasing job
creation have resulted in the improvement in the unemployment rate when compared to the rate of
3.7 percent observed in 2013. Increases in employment were most notable among personal
services, social services and community services. To a lesser extent, increased labour force
participation was observed in the agriculture, water and electricity and manufacturing sectors.

23
Table 5.1: Trinidad and Tobago Selected Economic Indicators
2009 2010 2011 2012 2013
Jan-Sep-14
Real GDP Growth (%) (2000 = 100)12 -3.4 -0.3 -1.2 0.3 2.1 0.7
Energy Sector 1.3 1.8 -3.7 -1.9 0.2 -1.5
Non-Energy Sector -6.6 -1.8 0.6 1.8 3.5 2.2
Agriculture -0.7 -15.7 1.2 -2.4 0.3 3.5
Manufacturing -6.6 0.8 1.7 -1.3 2.6 1.2
Construction -2.5 -5.8 -2.4 -0.9 3 3.1
Financial Services -1.8 2.5 0.9 2.5 4.8 3.2
Inflation Rate (%)13
(period average) 7 10.5 5.1 9.3 5.2 4.6
(end of period) 1.3 13.4 5.3 7.2 5.6 7.8
Unemployment Rate (%)14 5.3 5.9 4.9 5 3.7 3.115
Sources: Central Bank of Trinidad and Tobago, Central Statistical Office and Ministry of Finance
5.2 Key Economic Drivers (Activities)
Of the businesses formally registered in Trinidad and Tobago, those currently operating in the City of
San Fernando accounted for 6.91 percent ranking the municipality seventh overall in terms of
proportion of actively operating businesses. There was a notable concentration of businesses in the
municipality, with more than half of all registered businesses being located in San Fernando Proper
and as much as one-fifth of enterprises being located in Maraballa. Other communities with notable
concentrations of enterprises included Cocoyea Village (4.56%), Vistabella (3.33%), Pleasantville
(1.32%) and Mon Repos (1.23%). Table 5.2 shows the sectoral representation of enterprises in San
Fernando by Size. Consistent with that which has been observed both nationally and in
municipalities around the country, the retail and distribution was the single largest sector
represented among enterprises in San Fernando (47.92%). Other significant sector included
Personal Services (14.37%), Finance (14.13%), Construction (6.6%) and the Energy Sector (4.29%).
Table 5.2: Enterprises by Sector and Size
Sector
Size of Enterprise Grand Total
Micro (1 to 5)
Small (6 to 25)
Medium (26 to 50)
Large (50 and over)
Branch
Assembly Type And Related Industries
1.06% 1.48% 2.60% 1.33% 0.76% 1.24%
Chemicals And Non-Metallic Minerals
0.12% 0.85% 0.00% 2.67% 0.00% 0.44%
Construction 5.52% 8.05% 18.18% 9.33% 0.00% 6.60%
Distribution 54.17% 40.89% 36.36% 34.67% 46.97% 47.92%
Educational And Cultural Community
2.47% 3.39% 1.30% 1.33% 2.27% 2.61%
12 Growth rates are derived from the Central Bank’s Quarterly Index of Gross Domestic Product 13 Changes in the Index of Retail Prices (RPI), January 2003 = 100 14 This represents the average of the four quarters 15 For the period January - March

24
Sector
Size of Enterprise Grand Total
Micro (1 to 5)
Small (6 to 25)
Medium (26 to 50)
Large (50 and over)
Branch
Services
Finance, Insurance, Real Estate And Business Services
11.40% 13.77% 10.39% 12.00% 36.36% 14.13%
Food Processors And Drink
0.35% 1.48% 1.30% 2.67% 0.00% 0.81%
Hotels And Guest Houses
0.35% 0.85% 1.30% 1.33% 0.00% 0.56%
Miscellaneous Manufacturing
0.12% 0.85% 1.30% 0.00% 0.00% 0.37%
Personal Services 16.92% 14.19% 14.29% 5.33% 3.79% 14.37%
Petroleum And Other Mining Industries
2.00% 5.72% 6.49% 22.67% 2.27% 4.29%
Printing, Publishing And Paper Converters
1.29% 1.91% 1.30% 1.33% 0.76% 1.43%
Textiles, Garments, Footwear, Headwear
0.35% 0.42% 0.00% 1.33% 0.00% 0.37%
Transportation, Communication And Storage
3.41% 4.87% 5.19% 4.00% 6.06% 4.17%
Wood And Related Products
0.47% 1.27% 0.00% 0.00% 0.76% 0.68%
Grand Total 100.00% 100.00% 100.00% 100.00% 100.00% 100.00%
5.3 Employment and Unemployment Trends
5.3.1 Levels and Trends
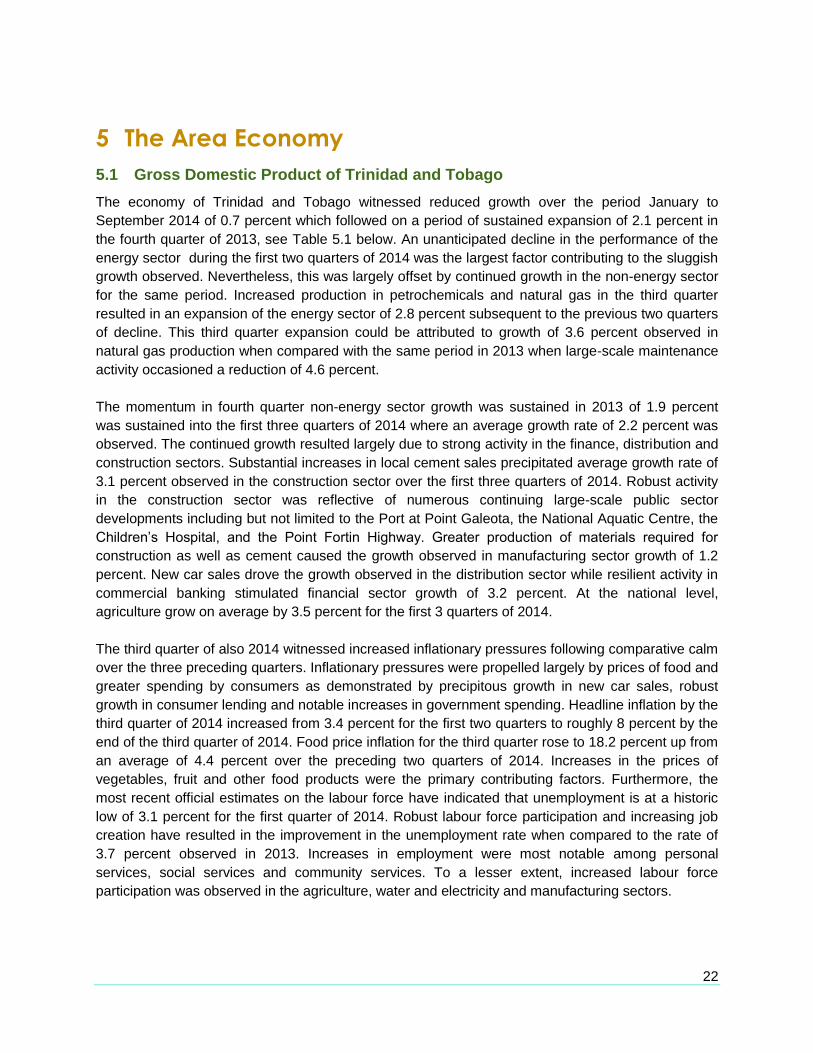
The local economy in San Fernando is driven by private enterprise, see Figure 5.1. Exactly half of all
household heads were engaged in private enterprise. Other key sources of employment in the
municipality include State Enterprises (18%), the self-employed (18%), and Central/Local
Government Bodies (6%).
25
Figure 5.1: Employment of Household Heads 2014
Source: Central Statistical Office
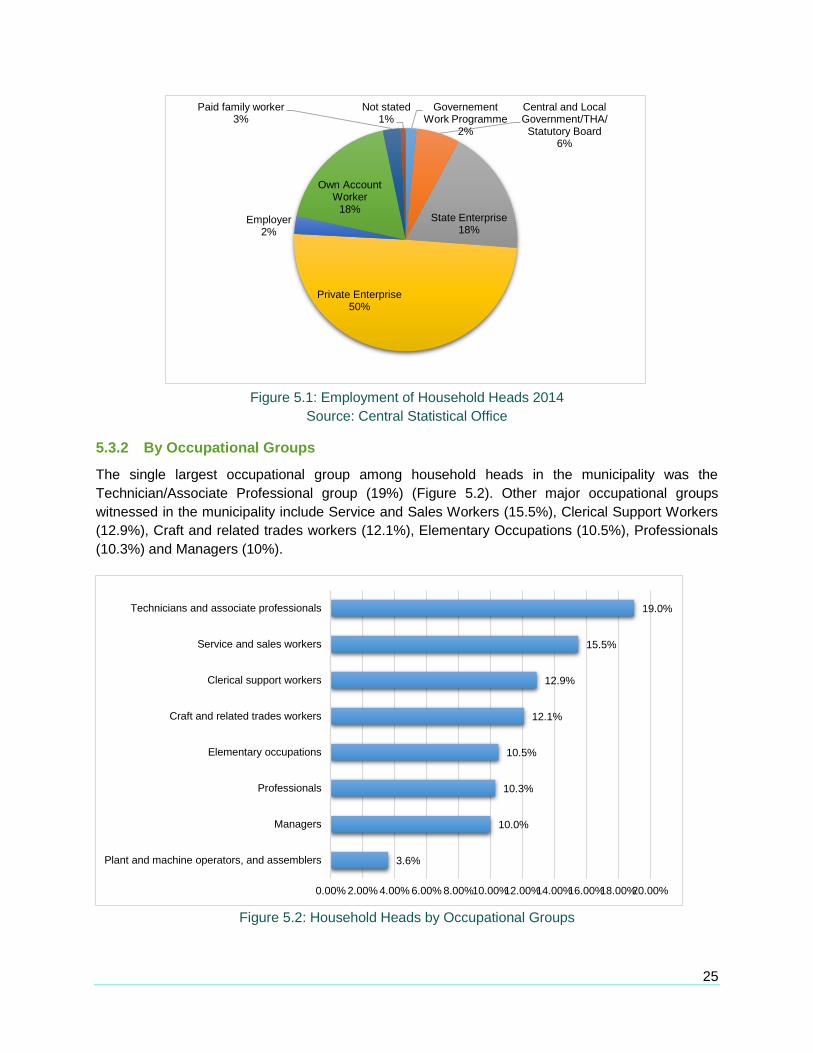
5.3.2 By Occupational Groups
The single largest occupational group among household heads in the municipality was the
Technician/Associate Professional group (19%) (Figure 5.2). Other major occupational groups
witnessed in the municipality include Service and Sales Workers (15.5%), Clerical Support Workers
(12.9%), Craft and related trades workers (12.1%), Elementary Occupations (10.5%), Professionals
(10.3%) and Managers (10%).
Figure 5.2: Household Heads by Occupational Groups
Governement Work Programme
2%
Central and Local Government/THA/
Statutory Board6%
State Enterprise18%
Private Enterprise50%
Employer2%
Own Account Worker
18%
Paid family worker3%
Not stated1%
3.6%
10.0%
10.3%
10.5%
12.1%
12.9%
15.5%
19.0%
0.00% 2.00% 4.00% 6.00% 8.00%10.00%12.00%14.00%16.00%18.00%20.00%
Plant and machine operators, and assemblers
Managers
Professionals
Elementary occupations
Craft and related trades workers
Clerical support workers
Service and sales workers
Technicians and associate professionals
26
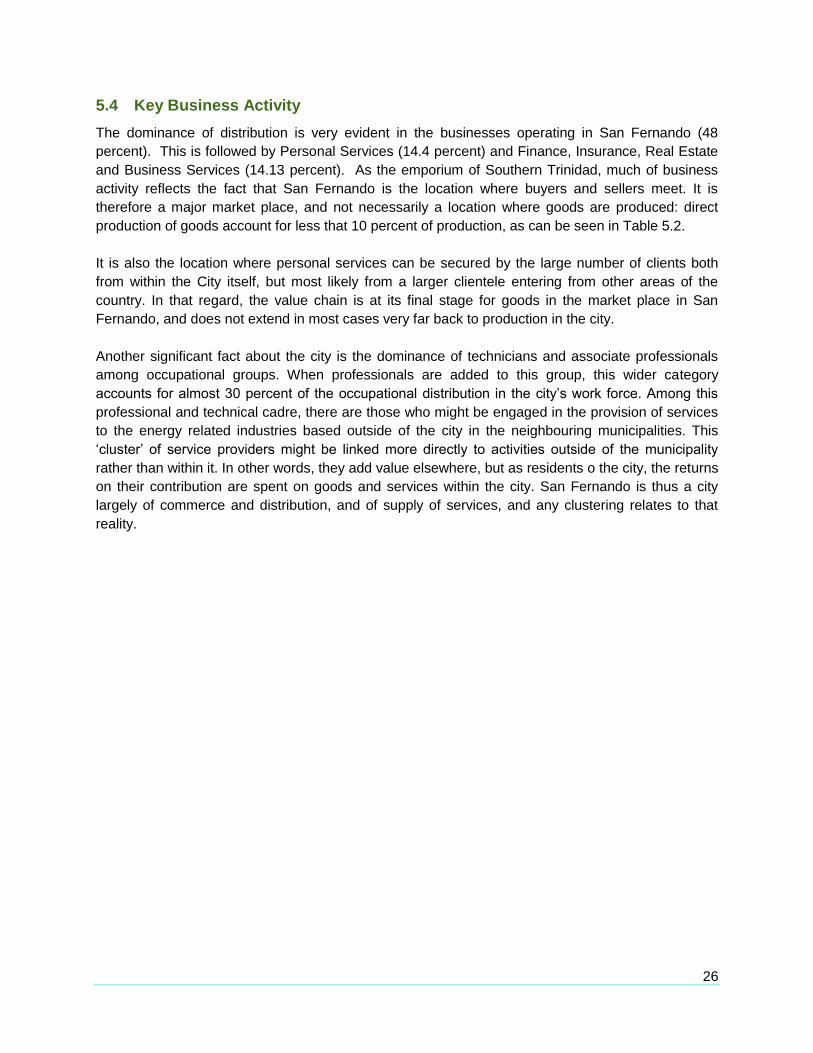
5.4 Key Business Activity
The dominance of distribution is very evident in the businesses operating in San Fernando (48
percent). This is followed by Personal Services (14.4 percent) and Finance, Insurance, Real Estate
and Business Services (14.13 percent). As the emporium of Southern Trinidad, much of business
activity reflects the fact that San Fernando is the location where buyers and sellers meet. It is
therefore a major market place, and not necessarily a location where goods are produced: direct
production of goods account for less that 10 percent of production, as can be seen in Table 5.2.
It is also the location where personal services can be secured by the large number of clients both
from within the City itself, but most likely from a larger clientele entering from other areas of the
country. In that regard, the value chain is at its final stage for goods in the market place in San
Fernando, and does not extend in most cases very far back to production in the city.
Another significant fact about the city is the dominance of technicians and associate professionals
among occupational groups. When professionals are added to this group, this wider category
accounts for almost 30 percent of the occupational distribution in the city’s work force. Among this
professional and technical cadre, there are those who might be engaged in the provision of services
to the energy related industries based outside of the city in the neighbouring municipalities. This
‘cluster’ of service providers might be linked more directly to activities outside of the municipality
rather than within it. In other words, they add value elsewhere, but as residents o the city, the returns
on their contribution are spent on goods and services within the city. San Fernando is thus a city
largely of commerce and distribution, and of supply of services, and any clustering relates to that
reality.

27
6 Municipal MSME Profile It is recognised that MSMEs are a key driver of socio-economic growth in national economies. The
Central Bank of Trinidad and Tobago in 2008/2009 undertook a comprehensive study of the small
and medium sized business in the country, the results of which were presented in the report entitled,
“Developing Viable Small and Medium-Sized Enterprises in Trinidad and Tobago: Challenges and
Priorities - The Structure, Performance and Networks of SMEs (Small and Medium Enterprises) in
Trinidad and Tobago.”
There is considerable variation about what constitutes a micro, small or medium-sized (MSME)
enterprise. There are various definitions in the literature that tend to be largely dependent on the
purpose of the study being undertaken at the time, or the use to which the results are to be put by
the particular author(s) or organisations. At the time of the study sponsored by the Central Bank,
there was no national definition on MSMEs. The study acknowledges that businesses tend to be
lumped either into one grouping called the “SME Sector” or further broken down into the
subcategories of “micro, small and medium-sized” enterprises.
The report revealed that the dated definition currently is used by the Central Bank, the then Business
Development Company (BDC) and the Ministry of Labour and Small Enterprise Development
(MOLSED) was based on the Report of the Cabinet-appointed Task Force on Small and Medium
Enterprise Development (June 1995). This considered three factors: number of employees, assets
and sales (Table 6.3). Because of the limited information available for SMEs on sales or assets, the
Central Bank’s study employed the approach of using “at least” the number of employees as a guide
for placing a firm into one category or another.
Table 6.1: Domestic Definition of Micro, Small and Medium-sized Enterprises
Size No. of Employees
TT$ Assets (Excluding Land and Buildings)
TT$ Sales
Micro 1 – 5 < $250,000 < $250,000
Small 6 – 25 > $250,000 - <$1,500,000 > $250,000 - <$5,000,000
Medium 26 – 50 > $1,500,000 - <$5,000,000 > $5,000,000 - <$10,000,000
Source: The Ministry of Labour and Small and Medium Enterprise Development quoted in the Report of the Cabinet Appointed Task Force on Small and Medium Enterprise Development (June 1995) as quoted in the report: Developing Viable Small and
Medium-Sized Enterprises in Trinidad and Tobago: Challenges and Priorities – The Structure, Performance and Networks of SMEs in Trinidad and Tobago
Currently, Trinidad and Tobago has a draft Micro and Small Enterprise (MSE) Policy which provides
definitions for micro- mini-micro and small-sized businesses which were equivalent to the categories
previously used. During this study on Tobago, it was clear that not many persons were aware of the
new definition. The criteria for the new MSE definition are provided in the table below (Table 6.2).

28
Table 6.2: Criteria Used to Define Mini-Micro, Micro and Small-sized Businesses
Size of Enterprise Number of Employees Asset Value (TT$) Turnover (per annum) (TT$)
Mini-micro ≤1 including owner/manager Up to $100,000 Up to $250,000
Micro ≤5 including owner/manager $100,001 - $500,000 Up to $2,000,000
Small ≤25 including owner/manager $500,001 - $5,000,000 Up to $10,000,000 Source: Ministry of Labour and Small and Micro Enterprise Development, Enterprise Development Division, 2013. Draft Micro and
Small Enterprise (MSE) Policy for Trinidad and Tobago 2013-2016, September 2013.
6.1 Municipal MSME Survey (2015)
The Municipal MSME Survey was conducted over the period April – May 2015 among 120 MSMEs
operating within the confines of the municipality. The results of this survey are presented in the
following categories:
General Characteristics;
Size of Enterprise;
Legal Status;
Primary Business Activities;
Employment;
Markets and Annual Sales;
Financing and Investment;
Use of Internet;
Technical Support; and
Impediments to MSME Development
6.1.1 General Characteristics
Of the 120 respondents, the vast majority (86.2%) were over the age of 36 years old (Table 6.3). Of
that group of entrepreneurs, roughly 54 percent fell into the 36-55 age category, and approximately
32 percent fell into the over 55 age category. Only a minority (13.8%) of entrepreneurs surveyed
were under the age of 35 years. No significant differences were observed among sizes of
enterprises surveyed.
Table 6.3: Category of Business by Age of Respondent
Category of Business
Age Last Birthday
Less than 35 years
36-55 years More
than 55 years
Total
Micro Mini 15.8% 55.3% 28.9% 100.0%
Micro 7.9% 55.3% 36.8% 100.0%
Small 17.5% 52.5% 30.0% 100.0%
Total 13.8% 54.3% 31.9% 100.0%

29
In conducting the MSME survey, equal numbers of micro mini, micro and small enterprises were
interviewed. The survey revealed almost equal proportions of male and female micro mini, micro and
small enterprises (Table 6.4). No significant differences were observed between sexes in respect of
the size of enterprise operated.
Table 6.4: Category of Business by Age of Respondent
Category of Business
Sex
Male Female Total
Micro Mini 32.9 34.0 33.3
Micro 35.7 30.0 33.3
Small 31.4 36.0 33.3
Total 100.0 100.0 100.0
In the City of San Fernando, enterprises were predominantly run by entrepreneurs who identified as
being of East Indian descent (51%), followed by persons who reported being of mixed ancestry
(25%), persons of African descent (16%), and persons of Chinese heritage (6%) (Figure 6.1).
Figure 6.1: Distribution of MSMEs by Ethnicity
6.1.2 Size of Enterprise
The survey revealed no notable differences between the proportions for Micro-mini, Micro and Small
enterprises by gender (Figure 6.2 and Figure 6.3).
African16%
East Indian51%
Mixed25%
Chinese6%
Caucasian2%

30
Figure 6.2: Male Ownership of MSMEs
Figure 6.3: Female Ownership of MSMEs
6.1.3 Legal Status
The majority of respondents (71%) reported being in business more than 10 years at the time the
survey was conducted (Figure 6.4). Just under 30 percent of respondents were in operation 5 years
or less, with roughly 2 percent being in operation for one year or less (Table 6.5). The vast majority
(94%) of entrepreneurs admitted to formally registering their business (Figure 6.5). Only a minority of
respondents (6%) admitted to being part of the informal sector16. Registration of businesses is
encouraged and affords operators the benefit from programmes geared at promoting and fostering
MSME development. Non-registration of unincorporated enterprises refers to absence of registration
under commercial, tax or social security laws, professional groups’ regulatory acts or similar
regulations established by national legislative bodies.
Figure 6.4: Length of Time in Operation
Figure 6.5: Distribution of Registered Versus
Unregistered MSMEs
16 The 1995 National Baseline Survey (Characteristics and Constraints of Small Businesses in Trinidad and Tobago prepared in 1996) defines an informal business as “a small firm with less than 5 workers (no more than 2 of whom are regular employees), which does not have any licence, permit or certification to operate” (p. 89).
Male Micro Mini33%
Male Micro36%
Male Small31%
Female Micro Mini34%
Female Micro30%
Female Small36%
One year or less2%
1-5 years27%
6-10 years0%
More than 10 years
71% Registered94%
Not Registered
6%
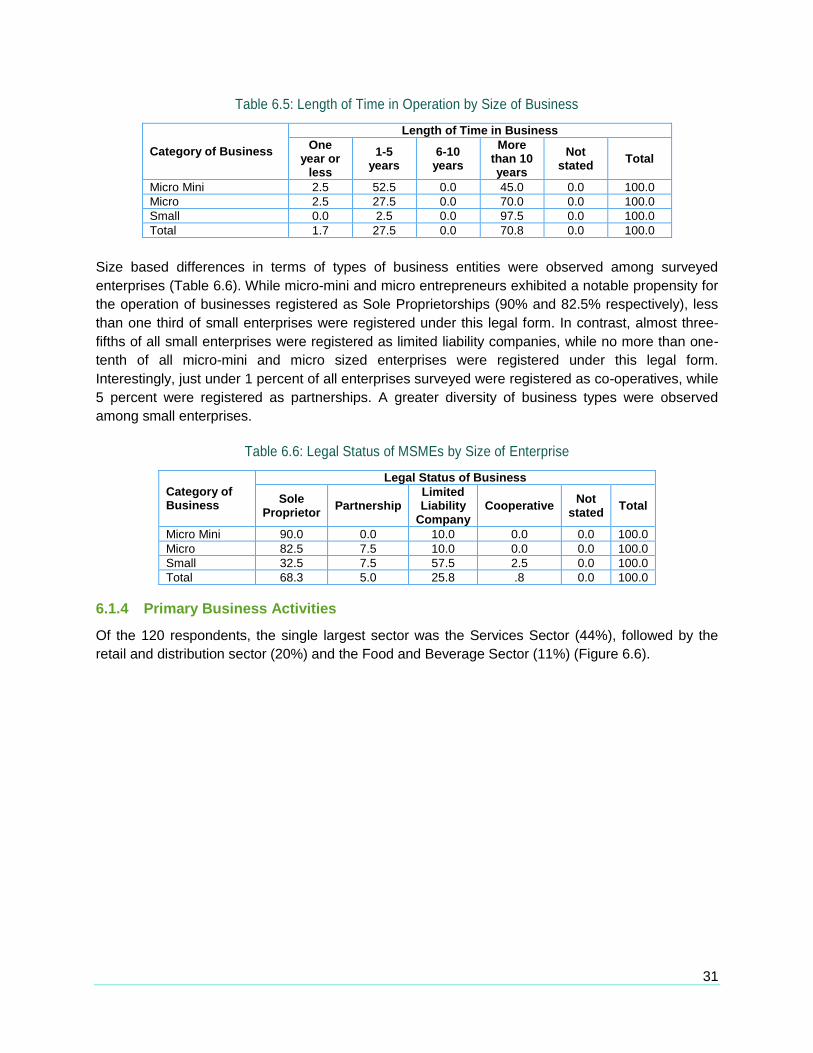
31
Table 6.5: Length of Time in Operation by Size of Business
Category of Business
Length of Time in Business
One year or
less
1-5 years
6-10 years
More than 10 years
Not stated
Total
Micro Mini 2.5 52.5 0.0 45.0 0.0 100.0
Micro 2.5 27.5 0.0 70.0 0.0 100.0
Small 0.0 2.5 0.0 97.5 0.0 100.0
Total 1.7 27.5 0.0 70.8 0.0 100.0
Size based differences in terms of types of business entities were observed among surveyed
enterprises (Table 6.6). While micro-mini and micro entrepreneurs exhibited a notable propensity for
the operation of businesses registered as Sole Proprietorships (90% and 82.5% respectively), less
than one third of small enterprises were registered under this legal form. In contrast, almost three-
fifths of all small enterprises were registered as limited liability companies, while no more than one-
tenth of all micro-mini and micro sized enterprises were registered under this legal form.
Interestingly, just under 1 percent of all enterprises surveyed were registered as co-operatives, while
5 percent were registered as partnerships. A greater diversity of business types were observed
among small enterprises.
Table 6.6: Legal Status of MSMEs by Size of Enterprise
Category of Business
Legal Status of Business
Sole Proprietor
Partnership Limited Liability
Company Cooperative
Not stated
Total
Micro Mini 90.0 0.0 10.0 0.0 0.0 100.0
Micro 82.5 7.5 10.0 0.0 0.0 100.0
Small 32.5 7.5 57.5 2.5 0.0 100.0
Total 68.3 5.0 25.8 .8 0.0 100.0
6.1.4 Primary Business Activities
Of the 120 respondents, the single largest sector was the Services Sector (44%), followed by the
retail and distribution sector (20%) and the Food and Beverage Sector (11%) (Figure 6.6).

32
Figure 6.6: Distribution of MSMEs by Primary Business Activities
Size based differences in the sectoral representation of businesses were observed among
respondents (Table 6.7). While the services sector accounted for the largest proportion of
enterprises overall, an inverse relationship was observed between enterprise size and operation in
the food and beverage sector with proportions of micro mini, micro and small enterprises of 17.5
percent, 10 percent and 5 percent respectfully.
Table 6.7: Key Business Activities by Size of Enterprise
Primary Business Activity or Sector
Category of Business
Micro Mini
Micro Small Total
Services (Other than retail) 52.5 37.5 42.5 44.2
Retail and Distribution 10.0 32.5 17.5 20.0
Food and Beverage 17.5 10.0 5.0 10.8
Other 20.0 20.0 35.0 25.0
Total 100.0 100.0 100.0 100.0
Gender based differences were also observed among respondents in respect of primary business
activities (Table 6.8). While both male and female entrepreneurs operated predominantly in the
services sector in San Fernando (45.7% and 42% respectfully), a substantially larger proportion of
female entrepreneurs operated in the food and beverage sector (14%) when compared to their male
counterparts.
Table 6.8: Key Business Activities for MSMEs by Gender
Primary Business Activity or Sector
Sex
Male Female Total
Services (Other than retail) 45.7 42.0 44.2
Retail and Distribution 20.0 20.0 20.0
Food and Beverage 8.6 14.0 10.8
Other 25.7 24.0 25.0
Total 100.0 100.0 100.0
Services (Other than retail)
44%
Retail and Distribution
20%
Food and Beverage
11%
Other25%

33
6.1.5 Employment
Employees working in the city attained a wide range of education levels (Table 6.9). It is noteworthy
that 50 percent of the micro-business operators received secondary school education as their
highest level of attainment, while 47.5 percent of the small operators attained tertiary level
education. Interestingly almost all the micro-mini operators did not respond when asked the
question.
Table 6.9: Highest Level of Education Attained by Employees Generally by Category of Business
Category of Business
Highest Level Education Attained by Employees Generally
Primary Post
Primary Secondary
Tertiary (non-
university)
Tertiary (university)
Other Not
stated Total
Micro Mini 0.0 0.0 2.5 0.0 0.0 2.5 95.0 100.0
Micro 7.5 0.0 50.0 12.5 15.0 12.5 2.5 100.0
Small 2.5 0.0 30.0 20.0 47.5 0.0 0.0 100.0
Total 3.3 0.0 27.5 10.8 20.8 5.0 32.5 100.0
6.1.6 Markets and Annual Sales
The market for the sales of goods produced and services rendered expanded throughout Trinidad
and Tobago (Table 6.10). Of the respondents, 10 percent identified the local community as the
primary market for their products and services. As much as 30 percent of respondents indicated that
their primary market extended as far as all areas within the Island of Trinidad. Interestingly, as much
as 22.5 percent of respondents reported their primary market being at the National level. Only a
minority of respondents (2.5%) indicated that their primary market was the nearest town/city.
Table 6.10: Primary Markets for Goods and Services by Size of Enterprise
Category of Business
Primary Market
Local community
Nearest town/city
All of Trinidad
Trinidad and
Tobago
Not stated
Total
Micro Mini 47.5 2.5 42.5 5.0 2.5 100.0
Micro 25.0 0.0 57.5 17.5 0.0 100.0
Small 10.0 5.0 40.0 45.0 0.0 100.0
Total 27.5 2.5 46.7 22.5 .8 100.0
Annual sales for respondents ranged from less than TT$ 100,000 to as much as TT$ 5,000,000
(Figure 6.7). Almost 55 percent of all respondents generated sales under TT$100,000, while roughly
18 percent generated sales in the TT$ 200,000 to TT$ 300,000 range. Interestingly, over a quarter of
respondents generated sales in the TT$ 500,000 to TT$5,000,000 range.

34
Figure 6.7: Annual Sales for MSMEs
6.1.7 Financing and Investment
Access to finance is perhaps one of the greatest challenges faced by enterprises of this size.
MSMEs require financing not only for “seed” capital required in business start-ups but also for
working capital and expansion (Table 6.11). Of the 120 respondents, the vast majority were financed
by commercial banks (56.9%), followed by self/family financing (41.3%) and other sources (1.2%).
Interestingly, size appeared to be a factor influencing the source of financing for MSMEs. Micro-Mini
enterprises depended substantially on self/family funds (56.3%) for financing as compared to their
small counterparts (28%). On the other hand, small enterprises turned to commercial banks (68%) to
a much greater extent than micro-mini enterprises (43.8%).
Table 6.11: Key Suppliers of Financing for MSMEs by Size of Enterprise
Source of Funds Category of Business
Micro Mini Micro Small Total
Self/Family 56.3% 35.8% 28.0% 41.3%
Commercial Bank 43.8% 62.3% 68.0% 56.9%
Business Development Unit 0.0% 0.0% 2.0% 0.6%
Other 0.0% 1.9% 2.0% 1.2%
Total 100.0% 100.0% 100.0% 100.0%
Roughly 83 percent of all respondents admitted that they invested less than TT$ 250,000 in plant
equipment and other assets (Figure 6.8). Some entrepreneurs invested no funds at all (8.3%) in
plant equipment while some invested as much as TT$250,001 to TT$2,000,000 (6.7%). Only a small
minority invested in excess of TT$ 2,000,000 (1.7%).
54.5%
18.2%
27.3%
0.0% 10.0% 20.0% 30.0% 40.0% 50.0% 60.0%
Less than 100,000
200,000-300,000
500,001-5,000,000

35
Figure 6.8: Amount Invested in Plant Equipment and Other Assets
6.1.8 Use of Internet
Almost three-fifths of respondents reported the routine use of the internet in their business (Table
6.12). The survey revealed that small enterprises (87.5%) used the internet to a substantially greater
extent than their micro-mini counterparts (42.5%).
Table 6.12: Businesses Reporting Routine Use of Internet and Category of Business
Routinely Use The Internet in Business
Category of Business
Micro Mini
Micro Small Total
Yes 42.5 47.5 87.5 59.2
No 57.5 52.5 12.5 40.8
Total 100.0 100.0 100.0 100.0
Of those respondents that indicated routine use of the internet in their operations, the majority used
it exclusively for e-mail (40.7%), followed by seeking product information (30.2%) and accessing
market information (29.1%) (Figure 6.9). This trend was indeed consistent among micro-mini, micro
and small enterprises interviewed.
8.3%
83.3%
6.7%
1.7%
0.0% 10.0% 20.0% 30.0% 40.0% 50.0% 60.0% 70.0% 80.0% 90.0%
None
Less then 250,000
250,001 to 2,000,000
Over 2,000,000

36
Figure 6.9: Reported Uses of Internet and Category of Business
6.1.9 Technical Support
Entrepreneurs received technical support from a wide variety of stakeholders within the municipality
This is seen in Table 6.13. Of the 120 respondents, roughly one third received assistance from
technical/vocational institutes. Almost 10 percent of respondents received technical assistance and
training from a university.
Table 6.13: Sources of Technical Assistance and Training
Sources of Technical Assistance and Training
Category of Business
Micro Mini Micro Small Total
Local Government 2.5% 0.0% 5.0% 2.5%
Ministry of Agriculture 2.5% 0.0% 0.0% 0.8%
Other Government 0.0% 0.0% 2.5% 0.8%
Bureau of Standards 0.0% 2.6% 10.0% 4.2%
University 7.5% 7.9% 12.5% 9.3%
Technical/Vocational Institute 40.0% 26.3% 35.0% 33.9%
Other 45.0% 50.0% 37.5% 44.1%
None 7.5% 15.8% 7.5% 10.2%
Not Stated 0.0% 2.6% 0.0% 0.8%
Total 100.0% 100.0% 100.0% 100.0%
Technical assistance provided covered areas including Business Plan Preparation (11.5%), Skills
Training (38.3%), Management Training, Quality Management (6.7%), Market Information (6.7%)
and ICT Training (0.5%) (Table 6.14).
39.5%
40.4%
41.5%
40.7%
32.6%
29.8%
26.8%
29.1%
27.9%
29.8%
31.7%
30.2%
0% 10% 20% 30% 40% 50% 60% 70% 80% 90% 100%
Micro Mini
Micro
Small
Total
Email Market Information Product Information

37
Table 6.14: Type of Technical Assistance and Training Received
Type of Technical Assistance/Training Received
Category of Business
Micro Mini Micro Small Total
Business Plan Preparation
15.8% 13.2% 4.6% 11.5%
Skills Training 44.7% 35.3% 33.8% 38.3%
ICT Training 0.0% 1.5% 0.0% 0.5%
Quality Management 5.3% 4.4% 10.8% 6.7%
Other 9.2% 8.8% 15.4% 11.0%
None 2.6% 7.4% 3.1% 4.3%
Mentoring 2.6% 1.5% 0.0% 1.4%
Product Development 1.3% 2.9% 1.5% 1.9%
Labelling/Packaging 0.0% 0.0% 1.5% 0.5%
Market Information 7.9% 7.4% 4.6% 6.7%
Market Access 3.9% 4.4% 1.5% 3.3%
Management Training 6.6% 10.3% 15.4% 10.5%
Book-Keeping 0.0% 1.5% 7.7% 2.9%
Not Stated 0.0% 1.5% 0.0% 0.5%
Total 100.0% 100.0% 100.0% 100.0%
6.1.10 Impediments to MSME Development
Figure 6.10 shows impediments, which challenged businesses directly. It is noteworthy that in
respect of problems where more than 5 percent of businesses felt extremely affected, Government
Regulation, energy cost, corruption, bureaucracy and crime posed extreme challenges, and 8.6
percent were strongly challenged by access to credit.
51.4
34.3
8.6
1.4
4.3
Not at all challenged
Slightly Challenged
Challenged
Strongly Challenged
Extremely Challenged
Market/Marketing
61.4
25.7
5.7
1.4
5.7
Not at all challenged
Slightly Challenged
Challenged
Strongly Challenged
Extremely Challenged
Government Regulation
45.7
25.7
15.7
8.6
4.3
Not at all challenged
Slightly Challenged
Challenged
Strongly Challenged
Extremely Challenged
Access to Credit
18.6
27.1
31.4
15.7
5.7
Not at all challenged
Slightly Challenged
Challenged
Strongly Challenged
Extremely Challenged
Energy Cost

38
Figure 6.10: Rating of Key Issues Faced by MSMEs
6.2 Challenges and Opportunities Facing MSMEs
With a view to explore the strengths, weaknesses, challenges and opportunities facing MSMEs,
discussions were held with stakeholders in the municipality. Emerging from these interactions was
the fact that access to finance continues to be one of the most significant challenges facing MSMEs.
Though firms generally thought that there existed sufficient options for debt and equity financing in
65.7
20.0
11.4
1.4
0.0
Not at all challenged
Slightly Challenged
Challenged
Strongly Challenged
Extremely Challenged
Management Skills
37.1
37.1
20.0
2.9
2.9
Not at all challenged
Slightly Challenged
Challenged
Strongly Challenged
Extremely Challenged
Transport and Infrastructure
38.6
44.3
14.3
0.0
1.4
Not at all challenged
Slightly Challenged
Challenged
Strongly Challenged
Extremely Challenged
Business Support Services
48.6
32.9
10.0
1.4
4.3
Not at all challenged
Slightly Challenged
Challenged
Strongly Challenged
Extremely Challenged
Raw Materials
42.9
31.4
14.3
2.9
8.6
Not at all challenged
Slightly Challenged
Challenged
Strongly Challenged
Extremely Challenged
Corruption
51.4
30.0
8.6
2.9
7.1
Not at all challenged
Slightly Challenged
Challenged
Strongly Challenged
Extremely Challenged
Crime
42.9
31.4
14.3
2.9
8.6
Not at all challenged
Slightly Challenged
Challenged
Strongly Challenged
Extremely Challenged
Bureaucracy
88.6
7.1
1.4
0.0
0.0
Not at all challenged
Slightly Challenged
Challenged
Strongly Challenged
Extremely Challenged
Family Support

39
the municipality, the capacity to access these financing options was not simple for MSMEs. Complex
procedures, restrictive collateral requirements and high transaction fees generally acted as a barrier
to accessing finance by enterprises of this size. Consequently, firms relied to a substantial extent on
personal savings and funds obtained from family members and friends to establish their businesses.
While stakeholders indicated that they had benefitted at from the services offered by NEDCO, the
Agricultural Development Bank, and some government ministries, entrepreneurs still believed that
greater levels of government incentives and subsidies should be available for new and growing
firms.
MSMEs were of the belief that government policies, particularly those guiding public procurement,
consistently favoured large firms as opposed to micro, small and medium sized firms. It was
suggested that the process should be such that not only would the best firm for the job be selected
but also that firms of different sizes would have equal opportunity in the public procurement process.
Stakeholders also believed that policy should be developed at both the local government and
national level to promote and support the development of micro, small and medium sized
enterprises. While taxes and other government regulations were applied consistently to micro, small,
medium and large enterprises, it was generally thought that licencing requirements and government
bureaucracy were unduly difficult for growing and new firms.
In respect of government initiatives to assist MSMEs, it was thought that a wider range of
government programmes should be developed and channelled through a single government
institution. A likely candidate for such an initiative could be NEDCO since it is already well positioned
to provide both financial and technical assistance to news and growing firms. It was also firmly
believed that there should be greater collaboration among public institutions providing services to
MSMEs. Representatives within existing institutions must have relationships with key members of
other institutions to ensure maximisation of the impact of government resources allocated towards
the promotion of the growth and development of MSMEs in the country. It is generally agreed that
while certain agencies may specialise in the provision of certain services, all institutions catering to
the needs of enterprises of this size must have readily be able to assist MSMEs to find information
needed to grow and flourish. The provision of loanable funds was thought inadequate to contribute
to the development and expansion of MSMEs to a stage where they could indeed be self-sufficient
and competitive. Consequently, it was agreed that loans and grants should be provided along with
business support services for firms at this nascent stage of development.
Many MSMEs expressed that finding reliable labour posed a serious challenge to their business.
Even though the national education system ensures free education for persons up to a first degree, it
was firmly believed that teaching at the primary and secondary not only discouraged personal
initiative, self-sufficiency and creativity but also was lacking in explaining the nuances of new firm
creation and entrepreneurship. Even at the tertiary level, firms believed that universities, colleges
and technical institutes did not provide sound and adequate preparation for the establishment and
growth of new businesses. Firms thought that many persons with degrees may have the knowledge
necessary to contribute meaningfully to a business but generally lacked the soft skills to work well in
teams and the practical skills to take what was earned into the classroom and apply it to their unique
working situation.

40
The national Physical Infrastructure was thought to be very propitious to the establishment and
growth of new enterprises. Firms were generally satisfied with the state of the roads, utilities,
communications, and waste disposal. It was not considered expensive for MSMEs to gain access to
communication technology such as the internet, landlines or cell phones. Furthermore, there exists
ready access to electricity, fuel and water at a very affordable rate to both residents and commercial
enterprises.
Social and Cultural Norms however were indicated as factors that do have an influence on the size
of the private sector and the profile of enterprises observed throughout the country. While it is
believed that the national culture is indeed supportive of individual success, it is not believed that it
places significant emphasis on personal initiative, autonomy nor self-sufficiency. It is believed the
average person in the country are averse to entrepreneurial risk taking, while the more affluent in
society are encouraged from a very young age to enter into entrepreneurial endeavours.
6.3 Partners in Local Area Economic Development in Trinidad
6.3.1 The Ministry of Labour and Small and Micro Enterprise Development
The MOLSED is specifically designed by the Government to foster and implement labour strategies
on a national level. Whist MOLSED is multidimensional, its major focus is establishing and
maintaining a steady industrial relations environment in the work place which promotes productivity
and sustainability.
6.3.2 National Entrepreneurship Development Company Limited
The National Entrepreneurship Development Company Limited (NEDCO) was established in July
2002 under the Ministry of Labour and Small and Micro Enterprise Development (MOLSED) to assist
small and micro businesses with regard to the accessing of loans for business start-up and
expansion purposes. Skills, training and financial support for entrepreneurs are also offered by
NEDCO as they seek to diversify the economic landscape of Trinidad and Tobago.
Six Strategic Objectives of MOLSED:
Facilitation of labour market equilibrium
Promotion of opportunities for poverty reduction, employment and wealth creation
Promotion of the application of the principles of decent work in the workplace
Promotion of industrial relations peace in the economy
Enhancement of the capacity of the MOLSED to undertake an expanded role in
formulating and implementing national development goals and strategies
Management of Government’s regional and international commitments and
responsibilities with respect to the Labour Market Agenda, in particular, CARICOM Single
Market and Economy (CSME), the Inter-American Conference of Ministers of Labour and
the International Labour Organization (ILO).

41
NEDCO’s office in San Fernando provides a host of assistance for businesses. The loan facility does
not however, make funds available for primary agriculture, bars, professional services or casinos.
NEDCO funding is specifically designed to assist those who face difficulty in accessing fund from
commercial banks or other commercial lending agencies, and as such, its loan facility is
characterised by simple procedures and minimal collateral requirements.
NEDCO has increased their loan entry ceiling from $100,000 to $250,000 for first time borrowers
and a maximum of $500,000 for second time borrowers. NEDCO’s Sangre Grande office also
provides business advisory services and information in areas such as Marketing, Financial
Management, Business Planning and Records Management.
The Entrepreneurial Training Institute and Incubation Centre (ETIIC) is an institution under NEDCO,
which provides entrepreneurial training, basic support, mentoring, and marketing and distribution
support to SMEs. The institute also offers start-up business support, onsite IT, administrative and
business services as well as office, computer labs and virtual office services. In addition, users can
avail themselves of the reference library services which have publications covering a range of SME
development and entrepreneurship topics.
The recently established EIF is a project-based mechanism which aims to provide a strengthened
support system for the MSE sector by providing funding to entrepreneurship-support programmes
developed by the private sector, academic institutions and other NGOs so that they can utilise their
expertise to play a greater role in MSE development.
6.3.3 Micro-Enterprise Loan Facility (MEL)
The client can also seek the services of the Micro Enterprise Loan (MEL) Facility for accessing
business grants and loans for business starts and expansion.
The MEL Facility is a community empowerment and poverty reduction initiative, which equips
Community Based Organisations (CBOs) to actively engage in promoting sustainable livelihoods
among the poor through the provision of micro loans and support to micro entrepreneurs. A grant is
given to a CBO to on-lend to individuals in their communities. The individuals start new or expand
existing micro enterprises and repay the loans at a minimal interest rate.
This programme aims to contribute to the reduction of poverty by facilitating the creation of
sustainable livelihoods; empower CBOs to discharge micro credit services; and support and promote
entrepreneurship at the community level. This programme is aimed at persons in receipt of public
assistance; persons earning at subsistence level or at the minimum wage; or unemployed persons
who live under impoverished conditions.
MEL provides borrowers with community based business loan services; business training for all
interested persons and after-loan services and business support.
6.3.4 FairShare Programme
The FairShare Programme, launched in January 2011, is a set-aside programme that enables MSEs
to access opportunities to do work with the Government for contracts valued up to TT$1.0M to
MSEs. Simultaneously, the FairShare Programme provides some training to MSEs to improve
business management, use of technology and understanding of legal obligations. FairShare utilises

42
an online platform where Government Ministries post opportunities and where MSEs search for and
bid on those opportunities. However, MSEs can only register with the FairShare programme for to a
maximum of six years. The objective of the FairShare Programme is to create independent and
strong MSEs by allowing MSEs to participate in Government spending over a fixed period of time
during which time they should have increased their capacity, skill, product quality and other
capabilities. Additionally, the FairShare programme:
Is an incentive for formalisation because it is only open to registered MSEs, compliant with
state regulations;
Compiles an online registry of micro and small businesses categorised by economic sector;
Creates a real-time, online listing of all Ministry contracts worth up to a maximum of $1M;
Provides automated notification of opportunities to SMEs for the purpose of bidding
Provides a space for MSEs to market their products and services through online profiles; and
Offers training to MSEs in procurement, business management and other important areas of
relevance to improve their ability to win contracts.
6.3.4.1 Employers’ Consultative Association
This agency seeks to quality representation for employers and to ensure the strength and success of
the Employer Community, which will auger well for the socio-economic well-being of Trinidad and
Tobago. The Employers’ Consultative Association of Trinidad and Tobago (ECA) was formed with
21 firms in 1960 primarily to assist and support Employers in industrial relations matters and to give
them an association that would speak on their behalf on matters of similar interest. Since then, the
ECA has built a strong reputation for handling all issues concerning Employers in Trinidad and
Tobago. Today, the ECA is still a not-for-profit enterprise whose membership grows yearly and
includes companies that belong to a variety of sectors.
6.3.4.2 Trinidad and Tobago Manufactures Association
The Trinidad and Tobago Manufactures Association (TTMA) acts as a representative of the
manufacturing sector in dealing with local and foreign governments and in the monitoring of
legislation affecting manufacturers. Members are provided with information on all local, regional and
international trade related matters of relevance and they act as a liaison between the membership
and the Government, specifically the Ministry of Trade and Industry. Members are encouraged to
maintain and adhere to the required standards and grades of quality in all manufactured goods and
services.
6.3.4.3 South Trinidad Chamber of Industry and Commerce
The South Trinidad Chamber of Industry and Commerce’s goal is to further the interests of
businesses within the region by lobbying for favourable policies for their members. Regular
dialogues with government to advocate, provide feedback on, and help fine-tune policies and
legislations affecting business practices are held. Strategic alliances are forged with local and
sometimes foreign organisations to establish and develop mutually beneficial business relationships.
The Chamber also provides their members with efforts to trouble-shoot, address, and solve common
problems and issues affecting business operations. On-going recruitment and sustaining the
membership is important to the Chamber’s growth and development.

43
7 Local Government System in Trinidad and
Tobago and the CARILED Model
The City of San Fernando was established and operates under the Municipal Corporations Act
Chapter 25:04. This Act was enacted in 1990 and has been amended over time, the last amendment
being in 2013. The Councils are allocated funds by the Ministry of Rural Development and Local
Government, and are responsible for House Rates and Local Taxes, Finance, Planning, and
allocation of Resources, Public Health and Physical Infrastructure, maintenance of markets,
slaughterhouses, pastures, commons, recreation grounds or cemeteries and crematoria, the
distribution of truck-borne water subject to the provisions of the Water and Sewerage Act, oversight
of Pedlars, Hawkers and Hucksters.
The Tobago House of Assembly (THA) enjoys wider powers than the Municipal Corporations. The
THA exercises considerable authority in respect of business development and economic planning. In
that regard, the THA has developed a comprehensive economic development plan (CEDP 2.0) in a
participatory process, and which provides structure to its initiatives deriving from its annual
budgetary exercises.
The Division of Finance and Enterprise of the THA promoted business development through its
Business Development Unit which provides funding to micro businesses and SMEs. It has
established an eco-industrial park, on which small and medium sized enterprises can be established.
There is also a Venture Capital Company which provides funding for certain types of businesses.
There is much in the existing paradigm of the THA that conforms to the CARILED Model.
The Government of Trinidad and Tobago has promoted in recent years, the idea of devolution
through the development of growth poles and the alignment between national priorities and regional
priorities within the 14 local government jurisdictions and the House of Assembly in Tobago, as well
as with the 585 communities identified throughout Trinidad and Tobago. In its Medium Term
Framework, the Government pledged to transform “Local Government Services through the
devolution of authiroty from Ministries to ensure increased efficiency”.17
CARILED has been inspired by the experience of the Federation of Canadian Municipalities. The
Federation is the “national voice” representing the vast majority of the municipal population of
Canada. The membership includes Canada’s largest cities, small urban and rural communities and
19 municipal associations and has been functioning since 1901.18 The Federation is thus steeped in
the philosophy of federalism and in the advocacy of deep involvement of people in the planning and
organisation in the place in which they reside. In that regard, local economic development is
premised on a participatory process involving communities, civil society organisations and the
private sector in partnership with local governance authorities or local government.
17 Ministry of Planning and the Economy, 2011, Medium-Term Policy Framework 2011-2014, Government of Trinidad and Tobago, pg. 19. 18 http://www.fcm.ca/home.htm

44
CARILED Initiatives in the Caribbean have involved:
1. Helping communities establish and manage committees of government, private-sector and
community representatives to lead local economic development
2. Increasing the capacity of local governments (and decentralised agencies of central
governments) to facilitate private-sector growth in a sustainable and equitable manner
3. Strengthening the ability of local government officials to engage civil society in local
economic development planning and implementation
4. Collaborating with business support organisations and educational institutions to provide
training to micro, small- and medium-sized enterprises
5. Funding pilot LED projects with the potential to show how local governments, the private
sector and communities can work together to create jobs, increase micro-, small- and
medium-sized enterprise revenues, and bring economic and social benefits to communities
6. Working with national governments, local government associations and regional
organisations to replicate good practices and successful LED models, and institute policy
reforms to support LED
The partnerships provide for the harnessing of local resources, encouragement of investment and
the stimulation of local commercial activities including the involvement of micro, small and medium-
sized enterprises. The experience is that local commercial activities contribute to job creation,
business development and improved quality of life for citizens.19
Adoption of CARILED represents signalling of decentralisation and further devolution in economic
planning and more particularly in implementation in the Trinidad and Tobago and will require further
changes in the existing legislation in the Act establishing the Municipal Council and Regional
Authorities.
19 http://cariled.org/about-led/definitions/
45
8 Promoting for Local Economic Development –
Issues and Recommendations
8.1 introduction
The City of San Fernando has been a growth pole in Southern Trinidad, dating back to the 19th
century. For much of the 20th century, local economic development was, in part, driven by the
involvement of the residents of the City in the supply of services and goods to the oil and asphalt
industries as they developed and expanded. The city became the industrial capital of the country
with a number of the firms and contractors servicing these industries setting up their headquarters in
San Fernando. In that regard, local economic development involved indirectly and directly, the
economic relations between Trinidad and Tobago and the rest of the world.
The latter half of the 20th century witnessed the transformation of the oil sector from land based
exploration and extraction to off-shore drilling operations. As Point Lisas emerged to the north of
Pointe-a-Pierre, as the hub for the processing of the output and the exports deriving from the off-
shore operations, the standing of San Fernando seems to have waned as the industrial capital and
as the locus for firms serving the energy sector of the country. Indeed, the major transnational firms
that made significant investments in the off-shore oil and gas sector, elected to set up their
headquarters in Port-of-Spain.
The city of San Fernando has remained the commercial hub of Southern Trinidad. This means that it
is a central market place sought on both sides of market transactions – demand and supply.
Entrepreneurs and business operators from other locations seek a presence in San Fernando in
order to market their goods and services. Customers in search of goods and services access the city
to have their needs satisfied. Thus, in addition to residents of the City who may seek to engage in
entrepreneurial endeavours, there is a large number of non-residents whose businesses are based
in the city, some of them becoming long term businesses of San Fernando.
Notwithstanding the present vibrancy of the city, there are possibilities to be realised through
MSMEs, which in their realisation, take account of the need for diversification of the economy of
Trinidad and Tobago. There is possible substantial local economic development around a number of
initiatives on the part of the San Fernando City Council, and the clusters being promoted as official
policy and strategy of diversification of the National Government. The present concluding section
identifies issues to be addressed in the way forward for the City of San Fernando.
The Medium Term Framework supports the goal of economic diversification, while promoting the
principle of social equity across the various groups that comprise the society, all in the context of
participatory modes with devolution and decentralisation of decision-making from an earlier
governance structure of the national. However, the City of San Fernando has had a long tradition in
defining the path for development and in decision-making about its space.

46
The sense of identity and distinctiveness was born out of the competition of the burgesses and their
Council with the capital city in the latter years of the 19th century. The City had its own newspaper,
the San Fernando Gazette which was a respectable rival of the Port-of-Spain Gazette of the time,
and its copy reflected a keen sense of a people who were proud of their space. That self-identity still
exists and can support the thrust of the Council in charting a course for business development of
residents and those from the rest of the country that it attracts to locate their businesses in the City.
There are physical infrastructure issues that confront the Municipal Corporation and which have a
bearing on business in the area. The road system, the provision of parking and transportation within
and into and out of San Fernando have to be addressed, given that traffic congestion imposes costs
on the delivery of goods and in the provision of some services. There might be need to expand the
frequency of service and the point of call of the sea ferries that now connect the City with San
Fernando. The population of the City and those who do business in it might have to be weaned to a
system that is more heavily weighted in favour of a public transport system. However, there will be
need for investment to ensure that this is very reliable and is well administered such that it presents
an attractive choice to commuters and the resident population.
The port facilities will need to be appropriately upgraded, to handle the passenger traffic, as well as
the City becoming a genuine port of call for visitors between the East of Venezuela and Trinidad.
There are attendant risks, with the presence of narco-traffickers in the flow of visitors between
Venezuela and Trinidad, but designated entry and exit of San Fernando as a full port for Customs
and Immigration Services, and robust policing of the waters to ensure a high probability of detection
will be imperative.
This points to the importance of support from other institutions and the institutional infrastructure that
need to be addressed. If local economic empowerment is to be driven by the City Corporation and if
the planning and facilitation of business activity become part of its remit, there is need to ensure that
the services of a number of agencies become available to the Corporation and to its residents. The
cooperation of the Customs and Immigration Services will be necessary if the City is going to be
promoted as a centre for business with residents from Eastern Venezuela. The collaboration and
support of the Ministries of Works and Infrastructure and of Transport will be critical in dealing with
the management of trafficking and in reorganisation of the road infrastructure of the City.
There is the generalised challenge of the upgrading of the human resources of would-be
entrepreneurs and persons involved in MSMEs. The Census data for the country and the survey
conducted in the present exercise establish that while most of the population is literate, there is a
deficiency in the educational base relative to the demands of a competitive economy. The fact that
persons may need to engage in MSMEs does not absolve them of the need to have a sound
educational base on which training and retraining programmes can be mounted. Although the City of
San Fernando has the highest percentage of residents with superior education, this should not
suggest that the majority of the working-age population is well endowed to participate in the
knowledge economy of the 21st century, especially in the context where local is global in respect of
much of business and Economics.
The City Corporation has to ensure that there are user friendly programmes accessible to groups of
residents in deprived communities who might not have had the opportunity of a good secondary

47
education in their earlier educational career. Internet access in telecentres or in Adult Education
Programmes in the Schools might need to be made available in some of the inner-city communities,
and encouragement given to those with deficiency in their educational background, to avail
themselves of the wide array of free on-line educational programmes.
There is also the issue of informal sector operators who, with adequate support, might be able to
formalise their operations. The City Corporation has to be provided with the assistance to promote
the transition of informal activities into structured businesses. There are NGOs and CBOs which are
familiar with its communities, which might be able to provide services in communities, and which can
complement or supplement what is available from agencies like NEDCO and IBIS.
In the following subsections, the alignment of initiatives of the City with national goals is addressed.
8.2 Strategic Sectors
8.2.1 Energy
The City of San Fernando has been linked historically to the growth and development of the oil and
gas sector, and became the industrial capital of the country largely as a result of this. While the
official policy of the country is the diversification from the reliance on the Energy Sector, Trinidad and
Tobago cannot avoid exploiting opportunities that its participation in the sector will provide over the
medium term. The underlying strategy for the country is likely to be built around continuing
exploitation of the sector, in the traditional mode of extraction and processing, diversification within
oil and gas, along with diversification from the sector as a whole.
A number of enterprises resident in the City continue to serve the sector even as the latter has
transformed from on land exploitation to off-shore operations. In that regard, oil and gas will continue
to have a significant place in the economy of San Fernando, with the sector providing employment
for some of its residents, and with MSMEs engaged in servicing some of the demands created by
the sector. A City Corporation of San Fernando adopting the shaping of industrial policy as part of its
remit would do well to examine the experience of Houston in the USA and Glasgow in Scotland.
There are a range of services that require technical experience by the Energy Sector that involve
know-how but personnel in immediate access. Some of these service firms and start-ups can be
promoted and encouraged to establish in San Fernando. For example, there can be densification of
service providers in the City with the presence of model makers involved in high quality 3D
visualisations, engineers specialising in finding technical solutions, contractors in geophysical and
seismic studies, drilling contractors, and well logging and testing experts. A forward thinking City
Corporation can build San Fernando as a source for specialised skills in one location, while Point
Lisas remains the locus for actual production and processing.
The experience garnered in servicing the sector in the municipality will allow some MSMEs to extend
their operations into other neighbouring municipalities and even into the off-shore operations which
are now the location of much of the extraction conducted in the country.

48
It will continue to be necessary to support the educational and training preparation within the
municipality for the technical and professional occupations relevant to the sector. This underlines the
importance of the reach of programmes offered through UTT, NESC, MIC and OJT to residents of
San Fernando. It is training and work experience in the related fields that eventually will provide the
training for the more entrepreneurial to create new start-ups that will eventually develop into vibrant
firms and enterprises, as the nature of the industry changes. With some skills being fungible across
sectors, some of those engaged in servicing the Energy Sector will switch to alternative activities as
demand for their specific skills and expertise declines and increases in other sectors.
8.2.2 Agriculture and Food
The City bounds Municipalities that are engaged in substantial Agriculture. This affords it the
opportunity of promoting processing operations in its midst.
Agro-processing: The City can cultivate its incorporation in value chain to final consumers in Trinidad
and in external markets in respect of some products, by promoting interested residents with capacity
in agro-processing. While domestic markets are likely to be the target, with HACCP certification, it is
possible that the city can get engaged in exports. The City Corporation will need to enlist the
services of CARIRI to ensure that its agro-processing operations observe appropriate standards,
thereby allowing access to widening of markets.
8.2.3 Cultural Tourism
The City has had a proud history, and there is no shortage cultural expression. The City has
contributed to national culture in particular in the field of Calypso, the Steelband and the Carnival. It
can attract some share of the visitors to Trinidad on the basis of its place in the festival calendar of
the country.
There might have been failure in saving the historic buildings. However, the San Fernando Hill
remains a landmark site and is being restored to its pristine beauty. Harris Promenade and the San
Fernando Wharf still remind of its past and along with other sites can be deemed a heritage district.
The Southern Academy for the Performing Arts (SAPA), churches, temples, mosques pan yards and
mas camps. A number of national sporting events are held in the City.
As the main city in the south, San Fernando can be seen as an access point and base for
accommodation for visitors seeking to visit the other municipalities, which have their own elements of
interest – the Pitch Lake in La Brea and the mud volcanoes in the Siparia Municipality – as well as
their own festivities. The City Corporation in association with the Tourism Development Company
and the Ministry of Tourism can market the city for its distinctiveness and for its access and
accommodation for international visitors seeking to enjoy the richness of life of Southern Trinidad.
The ethnic mix of the city lends to a range of culinary offerings, and supports restaurant services
catering to any palate, including those seeking a new experience.
There will be need for the Corporation to recognise these possibilities to support residents to
become involved in the tour-guiding services, craft good production and in the running of guest
establishments, catering to guests from the rest of the country and from the rest of the world. A
number of MSMEs can develop around the cultural tourism and the amenity resources of the city
and the neighbouring municipalities.
49
Business Tourism: The city is already an entry point for Venezuelans resident on the western shores
of the Gulf of Paria. Given that an increasing number come to Trinidad for shopping, it is in the
interest of the City and its residents that businesses exploit the opportunity that they offer as foreign
clientele. There is need to promote bilingualism with residents learning Spanish to ease
communications. The name San Fernando recalls the earlier presence of Spain in the history of
Trinidad. It is an attribute that can be exploited.
There is legitimate business to be conducted between the countries, and the Municipality can play
an important role, care being exercised to protect the country from its ports being used as a conduit
for the underground economy. The City Corporation will need to ensure that the authorities
responsible for National Security invest the area with the appropriate infrastructure and facilities to
dissuade engagement in illegitimate activities, even as it promotes MSMEs in the supply of goods
visitors from eastern Venezuela.
8.2.4 Commerce and Distribution
Commerce and distribution will expand with economic activity in the city itself and in the
neighbouring municipalities in its continued role as the emporium of the South. There will be
employment opportunities for residents and workers entering the city. Inflows of new residents and
expansion of the population will create a widening of the market for commerce and distribution.
However, these are sectors, which, because of relative ease of entry, attract considerable numbers
of micro entrepreneurs both from within and from outside of the City. The result is often a particular
sequel of excess supply as many seek to copy the success of first entrants. With oversupply, some
find themselves in debt since their businesses which might have appeared attractive at first blush,
end up in most of them sharing work or custom from the same level of clients. The Corporation will
need to exercise care in the promotion of entry of micro and small businesses. The allocation of
business licences to operate might be the best mechanism to prevent oversupply, and to control
congestion caused by informal businesses that remains unregulated.
Support for the development and expansion of commercial and distributional activities will require
interventions on the part of agencies involved in the provision of credit and training in
entrepreneurship, micro and small business development, but will need to be tempered with
constant review of levels of involvement to protect the city and some of the potential entrepreneurs
from losses because of oversupply in sectors that might appear to be easy in terms of market entry.
8.3 Proposed Projects and Implementation Plan
San Fernando City Corporation will have greater responsibility for the economic and social outcomes
within City and is expected a proactive role in LED. The preparation of the LAEP for the City of San
Fernando is a first step in directing investment for business and economic development. However,
further work is now needed to build the necessary institutional structures within the Corporation to
lead and coordinate LED. There is also the need to identify business and economic opportunities in
the strategic sectors identified as part of this study. Therefore, the Corporation must work with local
and external partners in developing and implementing sectoral projects that can lead to positive
economic growth, provide employment and the expansion of the local MSME sector.
50
8.3.1 Establishing Institutional Structures within the San Fernando City Corporation
The following recommendations are provided to create support mechanisms that would allow the
Corporation to play a greater role in economic development of the City:
1. Establishing a San Fernando LED Group – This Group should operate out of the City
Corporation and provide a municipal platform to facilitate and support the implementation of
targeted local economic activities. The main functions of the Group should be as follows:
a. To listen and interact with local and external stakeholders on LED related matters;
b. To identify and tackle the challenges to local business and economic development;
c. To recommend new initiatives and investments (to be implemented by the City
Corporation, Central Government Agencies and others) that would improve the local
business environment, foster innovation and strengthen the municipal economy;
d. To monitor, advise on and support the implementation of LED activities undertaken
by the Corporation; and
e. To provide guidance on the use of Corporation’s resources to achieve the objectives
of Municipal LED.
The Group should meet on monthly or at least quarterly basis and should comprise:
Councillors/Aldermen;
Representatives of the private sector and the NGO and community sector (inclusive
of the South Trinidad Chamber of Industry and Commerce, representatives from the
banking sector and the local MSME sector);
Local knowledge and research institutions (UTT and UWI); and
Public sector business support agencies (such as NEDCO and the Cooperative
Division).
2. Strengthening the capacity of the San Fernando City Corporation to facilitate local
business and economic development - The goal here is to build technical capacity within
the Corporation that would allow the Corporation to effectively lead and coordinate
sustainable LED of the City .
This calls for the establishment of the LEDU which would be lead by a LEDO and assisted by
an Assistant LEDO. These officers should be seen as the nucleus of industrial, commercial
and business development within the Municipality. The LEDO should be charged with the
following responsibilities, among others:
To facilitate LED planning in order to identify and establish business and development
economic opportunities;
To collaborate with stakeholders inside and outside of the City in engaging in scenario
planning and identifying possibilities for local resource use and mobilisation that might
otherwise remain untapped. The LEDO should be instrumental in organising and
recording discussions between the City Council and MSME and institutional stakeholders
within their jurisdiction.
Work with local businesses, organisations, schools, and communities in supporting and
promoting LED and individual, school and community-led entrepreneurship;
51
Identify opportunities that will allow the Corporation and its stakeholders to develop the
local MSME sector, programmes and projects;
Identify and secure funding for MSME and LED initiatives;
Assist local organisations, communities, businesses and individuals to develop project
proposals and business plans for financing; and
Assist with communities and businesses to establish business groups and other support
networks, including working closely with stakeholders in the informal economy in and
around main commercial districts.
3. Preparing a comprehensive LED strategy and action plan – One of the efforts in
supporting municipal LED, is the formulation of an LED strategy and action plan for the
municipality. The preparation of this strategy should be the responsibility of the LEDO. This
strategy and action plan should be tailored to the needs of the City and provide a
comprehensive agenda for LED including the identification of potential areas where the
Corporation and its partners can focus investment, additional actions to create enabling
mechanisms to support the work of local organisations, businesses, communities and
individuals within the City. The strategy should also identify and contain concrete proposals
for creating and expanding economic and business opportunity in the strategic sectors
identified earlier in this chapter.
The strategy should also provide the necessary baseline information to be used for
monitoring and evaluation and strategic LED decision-making.
4. Developing a database of municipal entrepreneurs (of all sizes) – This should be
developed based on the sector within which these business establishments operate. This will
serve well, not only in terms of the conduct of research activities, but will also be required for
collaborative and promotional partnership activities. The Corporation should actively
encourage informal MSME business owners to register with the Corporation to ensure that
all can access benefits from future business programming. The LEDO should be charged
with the responsibility for developing and regularly updating of the databases, and
maintaining contact with the local MSM businesses.
5. Establishing Strategic Partnerships with Neighbouring Municipal Corporations – The
Corporation should seek strategic partnerships and collaborate with neighbouring Local
Governments to explore joint economic opportunities, that can lead to mutual benefits and
spin-offs, for example in the areas of industrial development, tourism development and
development of professional services.
6. Establishing a Municipal Business Support Programme for Local MSMEs – The
success of this programme depends heavily on the commitment and cooperation between
the Corporation and the national business support service providers. The approach here is
not to duplicate the work of the MSME support agencies, but rather to bridge the current gap
in services identified during the study. The goal is to provide a one-stop-shop platform within
the Corporation.

52
The model for service provisioning should allow clients to have easy access to the various
services provided by agencies.20 The Corporation should work closely with providers to
create a system where clients can access information on the full range of business support
services available and to connect them to the services they need. Moreover, the Programme
should facilitate the implementation of the sectoral projects implemented by the Corporation.
Therefore, the Corporation should approach and work with service providers to seek their
assistance in establishing this one-stop-shop mechanism. For example, the platform can be:
The main source for accessing information on business support services offered by
the various providers. In addition, several Municipal Corporations should collaborate
in developing an app that would provide information and facilitate clients’ more ready
access to services.
Locate suitable space for the conduct of specific business training programmes as
identified in the LAEP study that would facilitate the increase use of ICT and the
Internet in business and to foster personal development of entrepreneurs. The
objective here should be to address the entrepreneurial characteristics and functional
competencies of participants through effective training programmes.
Provide access to business advisory and mentoring services through the
establishment of municipal business support networks, business associations and
business support cooperatives. A lack of business mentorship and business advisory
programmes was highlighted by MSMEs as a major barrier to the survival of
businesses.
Facilitate business cluster development and establishment industry and marketing
cooperatives as vehicles for achieving critical mass in specific sectors.
Offer business Incubator support services - the MOLSED and NEDCO should use
the Municipal Programme to expand the reach of the IBIS, ETIIC and Women in
Business programmes.
Special attention must be paid to the findings of the study with regards to the challenges
faced by women and youth in setting up and operating their own business. The objective
would be to put mechanisms in place that would eliminate any barriers to women’s and
youth’s entrepreneurship.
The programme should be audited and its impact monitored regularly to ensure it remains attractive,
relevant and accessible to its target clients.
8.3.2 Recommended Sectoral Initiatives
There was insufficient data collected to clear identify the sectoral business projects at this stage. The
recommendation here is to identify the local sectoral initiatives in the City of San Fernando during
the LED strategic planning phase and should be based on the strategic sectors identified. All the
projects developed should be based on an inclusive model which ensures the participation of
residents of the Municipality, including the poor, women and youths.
20 Finance and markets, entrepreneurial skill development, training (soft and technical skills), and mentoring and coaching, etc.

53
8.3.3 San Fernando LED Implementation Plan
Project Activities Implementing Agencies
Collaborating agencies
Time Frame Resources Requirement
Priority Rating (1-2)
Establishment of a San Fernando Local Economic Development Group
Develop scope, responsibility, function and reporting procedures of the Group.
Identify the prospective agencies/individuals to comprise the Group.
Prepare and issue invitations to prospective Group members/agencies.
Hold inaugural meeting and orientation session.
Hold regular/monthly meetings.
Monitor and provide advice on on-going LED programmes and projects
San Fernando City Corporation (SFCC) (through its Municipal Council) South Trinidad Chamber of Industry and Commerce
o Ministry of Agriculture o Ministry of Tourism
Economic Development Board
o NEDCO o TTInvest, o ExporTT Cooperative
Division o Ministry of Local
Government o National Council of
Village and Community Councils
o Local MSME owners representative
o CARILED Project o UTT o LABIDCO
4 months to establishment and ongoing
Representatives who are decision makers in their organisations
1
Strengthening the capacity of the San Fernando City Corporation to facilitate local business and economic development
Recruit the LEDO
Establish a Chairman’s Advisory Subcommittee to oversee the establishment of the LEDU, comprised of two other Councillors, and the CEO with the LEDO as Secretary.
Prepare requisite documentation for establishing the LEDU - rationale for its establishment, resources requirement (staffing, furniture, equipment, software, training, etc.); and estimated cost.
Obtain the necessary approvals for establishment of the Unit.
Recruit additional staff and procure the necessary resources
Officially establish the LEDU.
SFCC o Ministry of Local Government
o Ministry of Public Administration
o CARILED Project
12 Months Ministry of Public Administration and Consulting Services to assist the Council in developing a business oriented focus to support the emergence of businesses in the area. Provision for appointment of a LEDO, two Assistant LEDOs and supporting staff – Statistical Assistant and Clerk/Typist
1

54
8.3.3 San Fernando LED Implementation Plan
Project Activities Implementing Agencies
Collaborating agencies
Time Frame Resources Requirement
Priority Rating (1-2)
Preparing a comprehensive strategy and action plan for the City of San Fernando
Hold San Fernando LED workshop on way forward and the LED and MSME creation.
Hold consultations with specific industry stakeholders to elaborate strategies and actions agreed on at the workshop
Prepare a local economic development strategy and action plan in collaboration with relevant stakeholders. This plan should include cost estimates, funding sources and mechanism for continuous monitoring and evaluation.
San Fernando Local Economic Development Group SFCC-LEDU
o South Trinidad Chamber of Industry and Commerce
o Local business owners
o MOLSED o NEDCO o TTInvest, o ExporTT Cooperative
Division o Ministry of Rural
Development and Local Government
o MCD o National Council of
Village and Community Councils
o MSME owners representatives
o CARILED Project o UTT o LABIDCO
6 months Consultancy – San Fernando LED Strategy and Action Plan
Establishing a San Fernando Business Establishments Database
Hold discussion with the CSO, NEDCO and other relevant agencies on the establishment of the database.
Identify resource requirement for database.
Acquire software and other support tools.
Determine the type of information to be recorded in the database - business owner name and contact details for communications, gender of owner; type of business; years in operation; size of business/number of employees, etc.
Advertise and encourage business
SFCC LEDU/ LEDO
o CSO o South Trinidad
Chamber of Industry and Commerce
o NEDCO o MOLSED
3 months to establish database and ongoing
Computer Spreadsheet or database software Clerk Campaign to encourage business registration
1
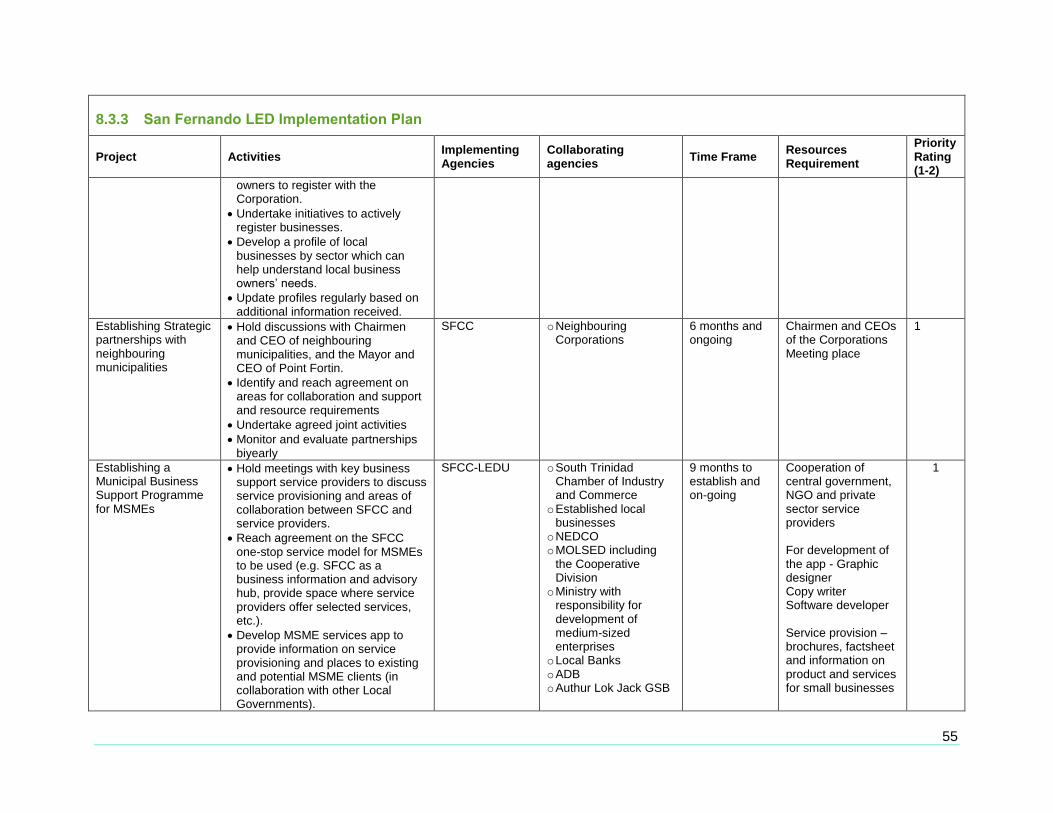
55
8.3.3 San Fernando LED Implementation Plan
Project Activities Implementing Agencies
Collaborating agencies
Time Frame Resources Requirement
Priority Rating (1-2)
owners to register with the Corporation.
Undertake initiatives to actively register businesses.
Develop a profile of local businesses by sector which can help understand local business owners’ needs.
Update profiles regularly based on additional information received.
Establishing Strategic partnerships with neighbouring municipalities
Hold discussions with Chairmen and CEO of neighbouring municipalities, and the Mayor and CEO of Point Fortin.
Identify and reach agreement on areas for collaboration and support and resource requirements
Undertake agreed joint activities
Monitor and evaluate partnerships biyearly
SFCC
o Neighbouring Corporations
6 months and ongoing
Chairmen and CEOs of the Corporations Meeting place
1
Establishing a Municipal Business Support Programme for MSMEs
Hold meetings with key business support service providers to discuss service provisioning and areas of collaboration between SFCC and service providers.
Reach agreement on the SFCC one-stop service model for MSMEs to be used (e.g. SFCC as a business information and advisory hub, provide space where service providers offer selected services, etc.).
Develop MSME services app to provide information on service provisioning and places to existing and potential MSME clients (in collaboration with other Local Governments).
SFCC-LEDU o South Trinidad Chamber of Industry and Commerce
o Established local businesses
o NEDCO o MOLSED including
the Cooperative Division
o Ministry with responsibility for development of medium-sized enterprises
o Local Banks o ADB o Authur Lok Jack GSB
9 months to establish and on-going
Cooperation of central government, NGO and private sector service providers For development of the app - Graphic designer Copy writer Software developer Service provision – brochures, factsheet and information on product and services for small businesses
1

56
8.3.3 San Fernando LED Implementation Plan
Project Activities Implementing Agencies
Collaborating agencies
Time Frame Resources Requirement
Priority Rating (1-2)
Launch San Fernando MSME Support Programme.

57
8.4 Conclusion
Decentralised Governance: The adoption of the CARILED Model involves a widening and
deepening of decentralisation and devolution in the governance structure of the country. The
Municipal Corporations are at the epicentre of this process. The authorities and the elected
representatives of residents in municipalities have to embrace responsibilities that will extend to the
economic development within the municipalities.
Business Facilitation: There is evidence that the country does not lack agencies that are formally
entrusted with the responsibility for the facilitation of business and enterprise and for the provision of
such supports as credit supply and training. However, their reach into communities is limited and
constrained. In the context of the CARILED Model, the authorities in Municipal Corporations will have
the responsibility for coordinating and enlisting the services of these agencies, and mediating their
support for residents in municipalities as they seek to create productive activity within the economic
space of the respective municipality.
In this regard, CARIRI has to be available to collaborate with the City Corporation in the promotion of
agro-processing activities, assuming that it might be a location for some of such production activities.
The City has to enlist the support of Tourism Business Development Company in planning and
implementation of the initiatives to realise the tourism potential of the City in respect of its own
cultural and business tourism possibilities, as well as its providing accommodation for visitors to the
South of Trinidad.
Competitiveness: Historically, residents have been involved with firms engaged in the heavy
industries with production geared to the international market. Some of its MSMEs have long been
involved in the provision of services to international companies. As the Energy Sector adapts to the
changing international market for fossil fuels, domestic firms servicing the sector will need to adjust.
As the Corporation mounts its own strategy in support of the diversification policy of the national
government, and efforts are mounted to promote the non-oil sector, there will be need for sensitivity
to the requirements imposed on large and small firms including micro-enterprises.
Structuring Economic Equity: The survey data show that there is differential participation of ethnic
groups in the area of business and enterprise. On the grounds of social equity, there will be need to
ensure that state involvement in the provision of support for business and enterprise does not
contribute to the creation of structural barriers and marginalisation of non-traditional participants in
business and enterprise.
Information, Training and Educational Upgrading: The Census Data and the survey data
collected in the course of this exercise establish that there does exist a human capital challenge in
the country. While the city is the best endowed among the municipalities, in terms of the percentages
with secondary and tertiary education and training, there is still a large number of residents who are
not equipped for participation in a knowledge economy. This imposes a constraint on the capacity of
residents in the establishment of viable business and productive enterprises. There is need to
institutionalise a support system that would allow those with educational deficiencies to catch up, to
embrace technology and access information, and, most importantly, initiate themselves on the path
58
of lifelong education and upgrading such that they can correct for previous marginalisation in the
education system.
The task is to ensure that the resident of Embacadere is no less knowledgeable and no less
technically competent as a worker in an MSME Israel. While this may not be currently the case, the
measures and initiatives undertaken by the Municipality with the Ministry of Education and with the
cooperation of UTT’s COURSERA or the Distance Education Programme of UWI, would allow such
transformation to take place in less than a decade. Moreover, those interested in undertaking the
provision of high level information services from a base in San Fernando, must be readily equipped
to develop the start-ups based on the infrastructure provided by the City Corporation or with the
assistance that it can mobilise from agencies at the national level to support local economic
empowerment.
Paradigm Shift: The CARILED Model involves a major paradigm shift in thinking in local
governance. The responsibilities of Municipal Councils require perspectives that extend beyond what
seems to be incorporated in the current legislation. At the level of the Ministry, there is need to win
the resources including the fiscal space for Municipalities to become entrepreneurial in implementing
national policy relating to the economy.
There is need to recognise the enormity of the task of investing people in their communities with the
capacity to transform their economic reality with the resources that reside in their community such
that they can create a high quality of life from their respective spaces.