
The Role of Coal Generation in a World of Greenhouse Gas Regulation

4401 Fair Lakes Court Fairfax, VA 22033 USA Phone: 1.703.818.9100 www.paceglobal.com
Setting the Pace in energy since 1976
LNG and Coal Life Cycle Assessment of
Greenhouse Gas Emissions
Prepared for:
Center for Liquefied Natural Gas
October 2015

Proprietary & Confidential Page 1
TABLE OF CONTENTS
Chapter 1 – Executive Summary .................................................................................................................. 8
Chapter 2 – Introduction .............................................................................................................................. 16 Study Objective ....................................................................................................................................... 16 Study Assumptions and Methodology .................................................................................................... 18
LNG Life Cycle Analysis ..................................................................................................................... 18 Coal Life Cycle Analysis ..................................................................................................................... 20
Chapter 3 – GHG Emissions from Natural Gas Production ........................................................................ 23 Well Installation and Drilling.................................................................................................................... 23 Venting and Flaring During Natural Gas Extraction and Gathering ....................................................... 25
Well Completion ................................................................................................................................. 26 Well Workovers .................................................................................................................................. 27 Liquid Unloading ................................................................................................................................. 27 Other Point Source Emissions............................................................................................................ 28 Fugitive Emissions from Pneumatic Devices and Other Sources ...................................................... 28
Chapter 4 – GHG Emissions from Natural Gas Processing ....................................................................... 31 Dehydration ............................................................................................................................................ 32 Other Processing Steps .......................................................................................................................... 33
Other Point Source Emissions and Flaring During Natural Gas Processing ..................................... 34 Fugitive Emissions from Pneumatic Devices and Other Sources ...................................................... 35 Natural Gas Compression at the Processing Plant ............................................................................ 35
Chapter 5 – GHG Emissions from Natural Gas Pipeline Transport ............................................................ 38
Chapter 6 – GHG Emissions from Natural Gas Treatment and Liquefaction ............................................. 42 NGL Recovery Unit ................................................................................................................................. 43
Chapter 7 – GHG Emissions from Shipping LNG ....................................................................................... 54
Chapter 8 – GHG Emissions from Regasification ....................................................................................... 57
Chapter 9 – Natural Gas Combined Cycle Power Plant GHG Emissions .................................................. 59
Chapter 10 – Country-Level Results for Coal Life Cycle GHG Emissions ................................................. 63 Western Europe ...................................................................................................................................... 63
GHG Emissions from Coal Mining ...................................................................................................... 63 GHG Emissions from Transport ......................................................................................................... 64 GHG Emissions from Coal Use in Power Generation ........................................................................ 64 Total GHG Emissions – Western Europe (Installed and New-Build Plants) ...................................... 65
China....................................................................................................................................................... 66 Coal Mining Emissions ....................................................................................................................... 66 GHG Emissions from Transport ......................................................................................................... 66 GHG Emissions from Coal Use in Power Generation ........................................................................ 67 Total GHG Emissions – China (Installed and New-Build Plants) ....................................................... 68
India ........................................................................................................................................................ 69 Coal Mining Emissions ....................................................................................................................... 69 GHG Emissions from Transport ......................................................................................................... 69 GHG Emissions from Coal Use in Power Generation ........................................................................ 70 Total GHG Emissions – India (Installed and New-Build Plants) ......................................................... 70
Japan and South Korea .......................................................................................................................... 71 Coal Mining Emissions ....................................................................................................................... 71
Proprietary & Confidential Page 2
GHG Emissions from Transport ......................................................................................................... 71 GHG Emissions from Coal Use in Power Generation ........................................................................ 72 Total GHG Emissions – Japan and South Korea (Installed and New-Build Plants) .......................... 74
Chapter 11 – Conclusion ............................................................................................................................. 75 LNG Life Cycle Emissions Assessment ................................................................................................. 75 Coal Life Cycle Emissions Assessment ................................................................................................. 76
References .................................................................................................................................................... 1
Appendix A – Summary Life cycle GHG Emissions Assuming 20-Year Time Horizon GWP Factors ......... 4

Proprietary & Confidential Page 3
EXHIBITS
Exhibit 1-1: Comparison of LCA Results (LNG and Coal) ................................................................... 10
Exhibit 1-2: Overview of Low and High GHG Cases for LNG .............................................................. 11
Exhibit 1-3: Summary of LNG Life Cycle Analysis ............................................................................... 12
Exhibit 1-4: Summary of Natural Gas Loss and Use during the LNG Life Cycle Analysis .................. 13
Exhibit 1-5: Summary of Emissions for the Coal Life Cycle Analysis .................................................. 15
Exhibit 2-1: 100-Year Time Horizon GWP Factors Utilized In This Study ........................................... 16
Exhibit 2-2: LCA Description ................................................................................................................ 18
Exhibit 2-3: Assumptions for Installed Power Plant Emissions (Coal) ................................................. 22
Exhibit 3-1: Summary of GHG Emissions and Relevant Inputs from Well Drilling .............................. 24
Exhibit 3-2: Generic Upstream Natural Gas Composition ................................................................... 26
Exhibit 3-3: Summary of Emission Factors for Flared Gas at the Extraction Site ............................... 26
Exhibit 3-4: Summary of GHG Emissions and Relevant Inputs from Natural Gas Extraction ............. 30
Exhibit 4-1: Assumed Natural Gas Composition Post-Processing ...................................................... 31
Exhibit 4-2: Summary of GHG Emissions and Relevant Inputs from Natural Gas Dehydration .......... 33
Exhibit 4-3: Summary of Emission Factors for Flared Gas at the Processing Plant ............................ 34
Exhibit 4-4: Summary of GHG Emissions and Relevant Inputs from Natural Gas Processing ........... 37
Exhibit 5-1: Summary of GHG Emissions and Relevant Inputs from Natural Gas Transmission to the Liquefaction Plant Gate ........................................................................................... 40
Exhibit 5-2: Summary of GHG Emissions and Relevant Inputs from Natural Gas Transmission from the LNG Receiving Terminal to the Power Generation Plant Gate .................................. 41
Exhibit 6-1: Summary of GHG Emissions and Relevant Inputs for Natural Gas Liquefaction – 2 X GE Frame 7EA Gas Turbines, No Waste Heat Recovery, No NGL Recovery .......... 44
Exhibit 6-2: Summary of GHG Emissions and Relevant Inputs for Natural Gas Liquefaction – 2 X GE Frame 7EA Gas Turbines, No Waste Heat Recovery, With NGL Recovery ........ 45
Exhibit 6-3: Summary of GHG Emissions and Relevant Inputs for Natural Gas Liquefaction – 2 X GE Frame 7EA Gas Turbines, With Waste Heat Recovery, No NGL Recovery ........ 46
Exhibit 6-4: Summary of GHG Emissions and Relevant Inputs for Natural Gas Liquefaction – 2 X GE Frame 7EA Gas Turbines, With Waste Heat Recovery, With NGL Recovery ..... 47
Exhibit 6-5: Summary of GHG Emissions and Relevant Inputs for Natural Gas Liquefaction – 5 X GE LM2500+G4 Gas Turbines, No Waste Heat Recovery, No NGL Recovery ......... 48
Exhibit 6-6: Summary of GHG Emissions and Relevant Inputs for Natural Gas Liquefaction – 5 X GE LM2500+G4 Gas Turbines, No Waste Heat Recovery, With NGL Recovery ...... 49
Exhibit 6-7: Summary of GHG Emissions and Relevant Inputs for Natural Gas Liquefaction – 5 X GE LM2500+G4 Gas Turbines, With Waste Heat Recovery, No NGL Recovery ...... 50
Exhibit 6-8: Summary of GHG Emissions and Relevant Inputs for Natural Gas Liquefaction – 5 X GE LM2500+G4 Gas Turbines, With Waste Heat Recovery, With NGL Recovery ... 51
Exhibit 6-9: Summary of GHG Emissions and Relevant Inputs for Natural Gas Liquefaction – Electric Motors, No NGL Recovery ................................................................................... 52
Exhibit 6-10: Summary of GHG Emissions and Relevant Inputs for Natural Gas Liquefaction – Electric Motors, With NGL Recovery ................................................................................ 53
Exhibit 7-1: Summary of GHG Emissions and Relevant Inputs for LNG Shipping .............................. 56

Proprietary & Confidential Page 4
Exhibit 8-1: Summary of GHG Emissions and Relevant Inputs for Natural Gas Regasification – Multiple Cases ................................................................................................................... 58
Exhibit 9-1: Summary of GHG Emissions, Relevant Inputs, and Natural Gas Requirements to Generate 1 MWh – Combined Cycle Gas-Fired Generation ............................................ 61
Exhibit 9-2: Summary of GHG Emissions, Relevant Inputs, and Natural Gas Requirements to Generate 1 MWh – Simple Cycle Gas-Fired Generation .................................................. 62
Exhibit 10-1: German Coal Mining Map ................................................................................................. 63
Exhibit 10-2: Estimate of GHG Emissions from New-Build Power Plant (Western Europe).................. 65
Exhibit 10-3: Total Emissions - Germany ............................................................................................... 65
Exhibit 10-4: China Coal Mining Map and Transportation Bottlenecks.................................................. 67
Exhibit 10-5: Estimate of GHG Emissions from New-Build Power Plant (China) .................................. 68
Exhibit 10-6: Total Emissions - China .................................................................................................... 68
Exhibit 10-7: India Coal Mining Map ...................................................................................................... 69
Exhibit 10-8: Estimate of GHG Emissions from New-Build Power Plant (India) .................................... 70
Exhibit 10-9: Total Emissions - India ...................................................................................................... 70
Exhibit 10-10: Australian Coal Mining Map .............................................................................................. 71
Exhibit 10-11: Estimate of GHG Emissions from New-Build Power Plant (Japan) .................................. 73
Exhibit 10-12: Estimate of GHG Emissions from New-Build Power Plant (South Korea) ........................ 74
Exhibit 10-13: Total Emissions - Japan and South Korea (Installed Plant) ............................................. 74
Exhibit 11-1: Summary of GHG Emissions from the LNG LCA ............................................................. 76
Exhibit 11-2: Summary of GHG Emissions from the Coal LCA ............................................................. 77
Exhibit A-1: 20-Year Time Horizon GWP Factors Utilized In This Study ............................................... 4
Exhibit A-2: Comparison of LCA Results (LNG and Coal) ..................................................................... 5
Exhibit A-3: Summary of LNG LCA ........................................................................................................ 6
Exhibit A-4: Summary of GHG Emissions from the Coal LCA ............................................................... 7

Proprietary & Confidential Page 5
GLOSSARY
CBM Coalbed methane
CCS Carbon capture and sequestration
CH4 Methane
CMM Coal mine methane
CO2 Carbon dioxide
CO2-e Carbon dioxide equivalent
DWT Deadweight Tons
EF Emission Factor
EIA Energy Information Administration
Flaring Emissions from the flaring of natural gas/methane. The natural gas/methane is piped to a flare stack where it is combusted to the atmosphere.
Fugitive Emissions
Emissions from accidental discharges, equipment leaks, filling losses, incomplete combustion during flaring, pipeline leaks, storage losses, venting, and all other direct emissions except those from fuel use.
g Gram
GHG Greenhouse Gas
HHV Higher Heating Value (gross calorific value)
IEA International Energy Agency
IGCC Integrated Gasification Combined Cycle
kg Kilogram
km Kilometer
LCA Life Cycle Assessment
LHV Lower Heating Value (net calorific value)
MMBtu Million British thermal units
MWh Megawatt hour
NM Non-Methane
NMVOC Non-Methane Volatile Organic Carbon
N2O Nitrous oxide
SCPC Supercritical pulverized coal plant
toe Tonne of Oil Equivalent
Venting Emissions from the venting of natural gas/methane. The natural gas/methane is released uncombusted to the atmosphere via a manual valve, control valve, or pressure relief valve.
NG Natural Gas
NGL Natural Gas Liquids
C3MR Propane-Precooled Mixed Refrigerant (liquefaction process technology)
DMR Dual Mixed Refrigerant (liquefaction process technology)
SMR Single Mixed Refrigerant (liquefaction process technology)

Proprietary & Confidential Page 6
AHV Air-Heated Vaporization (regasification system design)
ORV Seawater-Heated Open Rack Vaporizers (regasification system design)
SCV Submerged Combustion Vaporizers (regasification system design)

Proprietary & Confidential Page 7
CONVERSIONS
Note 1: For an assumed crude oil, natural gas, or LNG composition.
Description Value Unit
barrel to gallon 42 gal/bbl
barrel to liter 158.987 l/bbl
bbl crude oil to MMBtu 5.8 bbl/MMBtu
Carbon dioxide density conversion factor
1.808 kg/m3
g to kg 0.001 kg/g
gal crude oil to lb (Note 1) 7.29 lb/gal
kcal to Btu 3.96566 Btu/kcal
kilogram to lb 2.2046 lb/kg
kJ to Btu 1.055 kJ/Btu
km to mile 0.621 km/mile
kWh to Btu 3412 Btu/kWh
Methane density conversion factor 0.657 kg/m3
MJ to Btu 947.8 Btu/MJ
Mtoe to MMBtu 39683205 MMBtu/Mtoe
MW to hp 1341 hp/MW
MWh to KWh 1000 kWh/MWh
nautical mile to mile 1.151 nm/mile
sf3 natural gas to kg (Note 1) 0.0190509 kg/sf
3
sf3 natural gas to lb (Note 1) 0.042 lb/sf
3
short ton to kg 907.185 ton/kg
short ton to lb 2000 lb/short ton
short ton to metric tonne 0.907 ton/tonne
sm3 natural gas to kg (Note 1) 0.6727763 kg/sm
3
sm3 to sf
3 35.3145 sf
3/sm
3
tonne LNG to MMBtu (Note 1) 51.1 MMBtu/tonne LNG
The authors of the study provide the following guidelines and restrictions regarding appropriate use of the study results: This study is a technical analysis focused on the GHG emissions from LNG sourced in the U.S. and coal for use in power generation in potential world markets. While this study considers all life cycle phases of LNG and coal, the study lacks elements of a life cycle assessment (LCA) as prescribed by the International Organization for Standardization (ISO) guidelines (ISO 14040:2006 and 14044:2006). Therefore, the results should not be used as the sole basis for comparative environmental claims or purchasing decisions.
Proprietary & Confidential Page 8
CHAPTER 1 – EXECUTIVE SUMMARY
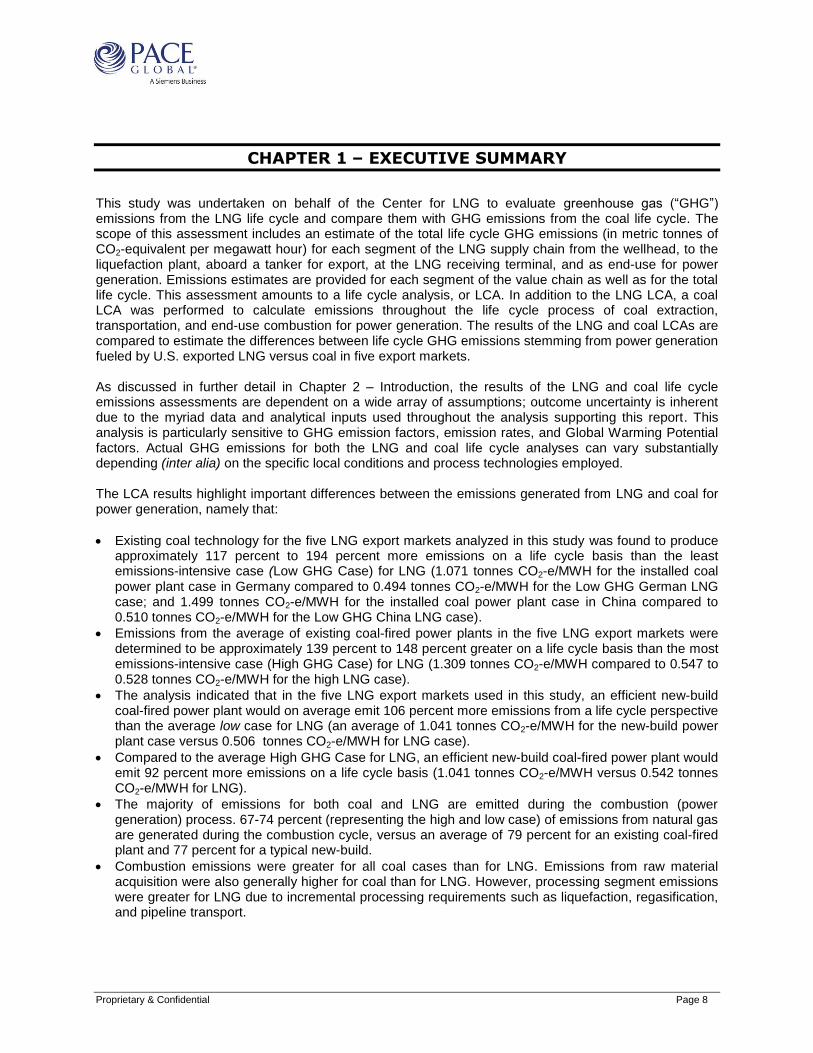
This study was undertaken on behalf of the Center for LNG to evaluate greenhouse gas (“GHG”) emissions from the LNG life cycle and compare them with GHG emissions from the coal life cycle. The scope of this assessment includes an estimate of the total life cycle GHG emissions (in metric tonnes of CO2-equivalent per megawatt hour) for each segment of the LNG supply chain from the wellhead, to the liquefaction plant, aboard a tanker for export, at the LNG receiving terminal, and as end-use for power generation. Emissions estimates are provided for each segment of the value chain as well as for the total life cycle. This assessment amounts to a life cycle analysis, or LCA. In addition to the LNG LCA, a coal LCA was performed to calculate emissions throughout the life cycle process of coal extraction, transportation, and end-use combustion for power generation. The results of the LNG and coal LCAs are compared to estimate the differences between life cycle GHG emissions stemming from power generation fueled by U.S. exported LNG versus coal in five export markets. As discussed in further detail in Chapter 2 – Introduction, the results of the LNG and coal life cycle emissions assessments are dependent on a wide array of assumptions; outcome uncertainty is inherent due to the myriad data and analytical inputs used throughout the analysis supporting this report. This analysis is particularly sensitive to GHG emission factors, emission rates, and Global Warming Potential factors. Actual GHG emissions for both the LNG and coal life cycle analyses can vary substantially depending (inter alia) on the specific local conditions and process technologies employed. The LCA results highlight important differences between the emissions generated from LNG and coal for power generation, namely that:
Existing coal technology for the five LNG export markets analyzed in this study was found to produce approximately 117 percent to 194 percent more emissions on a life cycle basis than the least emissions-intensive case (Low GHG Case) for LNG (1.071 tonnes CO2-e/MWH for the installed coal power plant case in Germany compared to 0.494 tonnes CO2-e/MWH for the Low GHG German LNG case; and 1.499 tonnes CO2-e/MWH for the installed coal power plant case in China compared to 0.510 tonnes CO2-e/MWH for the Low GHG China LNG case).
Emissions from the average of existing coal-fired power plants in the five LNG export markets were determined to be approximately 139 percent to 148 percent greater on a life cycle basis than the most emissions-intensive case (High GHG Case) for LNG (1.309 tonnes CO2-e/MWH compared to 0.547 to 0.528 tonnes CO2-e/MWH for the high LNG case).
The analysis indicated that in the five LNG export markets used in this study, an efficient new-build coal-fired power plant would on average emit 106 percent more emissions from a life cycle perspective than the average low case for LNG (an average of 1.041 tonnes CO2-e/MWH for the new-build power plant case versus 0.506 tonnes CO2-e/MWH for LNG case).
Compared to the average High GHG Case for LNG, an efficient new-build coal-fired power plant would emit 92 percent more emissions on a life cycle basis (1.041 tonnes CO2-e/MWH versus 0.542 tonnes CO2-e/MWH for LNG).
The majority of emissions for both coal and LNG are emitted during the combustion (power generation) process. 67-74 percent (representing the high and low case) of emissions from natural gas are generated during the combustion cycle, versus an average of 79 percent for an existing coal-fired plant and 77 percent for a typical new-build.
Combustion emissions were greater for all coal cases than for LNG. Emissions from raw material acquisition were also generally higher for coal than for LNG. However, processing segment emissions were greater for LNG due to incremental processing requirements such as liquefaction, regasification, and pipeline transport.

Proprietary & Confidential Page 9
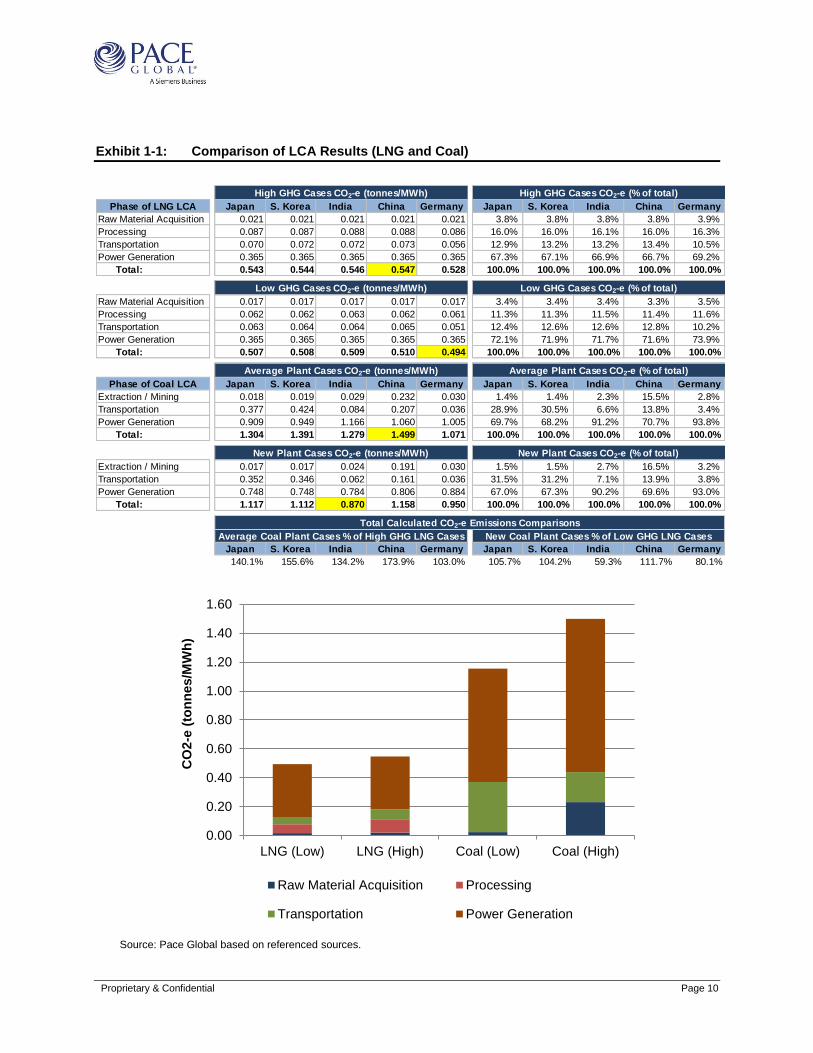
Exhibit 1-1 below presents the total emissions for each stage of the life cycle for power generation from LNG and coal for each market. The data are also presented as a range of potential estimated emissions for each segment of the LNG and coal scenarios. Please note that the Coal LCA results for “All Countries” in Exhibit 1-1 represent low and high GHG calculations for each of the life cycle stages for both installed power plants and new-build power plants. The “Total Life Cycle” does not represent a summation of the low and high GHG calculations in the previous stages, but rather the calculated low and high life cycle GHG emissions for the five export markets analyzed in this study. China, for example, was calculated to have the highest calculated life cycle GHG emissions for the Average Plant case; however, India was calculated to have higher GHG emissions at the power generation stage.
Proprietary & Confidential Page 10
Exhibit 1-1: Comparison of LCA Results (LNG and Coal)
Source: Pace Global based on referenced sources.
High GHG Cases CO2-e (tonnes/MWh) High GHG Cases CO2-e (% of total)
Phase of LNG LCA Japan S. Korea India China Germany Japan S. Korea India China Germany
Raw Material Acquisition 0.021 0.021 0.021 0.021 0.021 3.8% 3.8% 3.8% 3.8% 3.9%
Processing 0.087 0.087 0.088 0.088 0.086 16.0% 16.0% 16.1% 16.0% 16.3%
Transportation 0.070 0.072 0.072 0.073 0.056 12.9% 13.2% 13.2% 13.4% 10.5%
Power Generation 0.365 0.365 0.365 0.365 0.365 67.3% 67.1% 66.9% 66.7% 69.2%
Total: 0.543 0.544 0.546 0.547 0.528 100.0% 100.0% 100.0% 100.0% 100.0%
Low GHG Cases CO2-e (tonnes/MWh) Low GHG Cases CO2-e (% of total)
Raw Material Acquisition 0.017 0.017 0.017 0.017 0.017 3.4% 3.4% 3.4% 3.3% 3.5%
Processing 0.062 0.062 0.063 0.062 0.061 11.3% 11.3% 11.5% 11.4% 11.6%
Transportation 0.063 0.064 0.064 0.065 0.051 12.4% 12.6% 12.6% 12.8% 10.2%
Power Generation 0.365 0.365 0.365 0.365 0.365 72.1% 71.9% 71.7% 71.6% 73.9%
Total: 0.507 0.508 0.509 0.510 0.494 100.0% 100.0% 100.0% 100.0% 100.0%
Average Plant Cases CO2-e (tonnes/MWh) Average Plant Cases CO2-e (% of total)
Phase of Coal LCA Japan S. Korea India China Germany Japan S. Korea India China Germany
Extraction / Mining 0.018 0.019 0.029 0.232 0.030 1.4% 1.4% 2.3% 15.5% 2.8%
Transportation 0.377 0.424 0.084 0.207 0.036 28.9% 30.5% 6.6% 13.8% 3.4%
Power Generation 0.909 0.949 1.166 1.060 1.005 69.7% 68.2% 91.2% 70.7% 93.8%
Total: 1.304 1.391 1.279 1.499 1.071 100.0% 100.0% 100.0% 100.0% 100.0%
New Plant Cases CO2-e (tonnes/MWh) New Plant Cases CO2-e (% of total)
Extraction / Mining 0.017 0.017 0.024 0.191 0.030 1.5% 1.5% 2.7% 16.5% 3.2%
Transportation 0.352 0.346 0.062 0.161 0.036 31.5% 31.2% 7.1% 13.9% 3.8%
Power Generation 0.748 0.748 0.784 0.806 0.884 67.0% 67.3% 90.2% 69.6% 93.0%
Total: 1.117 1.112 0.870 1.158 0.950 100.0% 100.0% 100.0% 100.0% 100.0%
Total Calculated CO2-e Emissions Comparisons
Average Coal Plant Cases % of High GHG LNG Cases New Coal Plant Cases % of Low GHG LNG Cases
Japan S. Korea India China Germany Japan S. Korea India China Germany
140.1% 155.6% 134.2% 173.9% 103.0% 105.7% 104.2% 59.3% 111.7% 80.1%
0.00
0.20
0.40
0.60
0.80
1.00
1.20
1.40
1.60
LNG (Low) LNG (High) Coal (Low) Coal (High)
CO
2-e
(to
nn
es/M
Wh
)
Raw Material Acquisition Processing
Transportation Power Generation
Proprietary & Confidential Page 11
Notes: 1. Yellow highlighted cells indicate the calculated minimum and maximum CO2-e emission ranges for the LNG life cycle
analysis and Coal life cycle analysis. 2. Raw material acquisition includes all segments in the LCA that involve extracting the natural resource from the earth. 3. Processing includes all segments in the LCA that involve changing the resource’s molecular makeup or its state of matter.
For LNG, this includes all processing steps prior to initial pipeline distribution, liquefaction, and regasification. 4. Transportation includes all segments in the LCA that involve transporting the natural resource. This comprises pipeline
transportation, both to the liquefaction plant and also to the power generation plant; and LNG shipping. 5. Power Gen. represents the final segment in the LCA where the natural resource is combusted for electricity production. 6. “Coal (Low)” and “Coal (High)” in the above chart refer to the lowest-emitting option (whether country/region or
existing/new build plant) and the highest-emitting option, respectively.
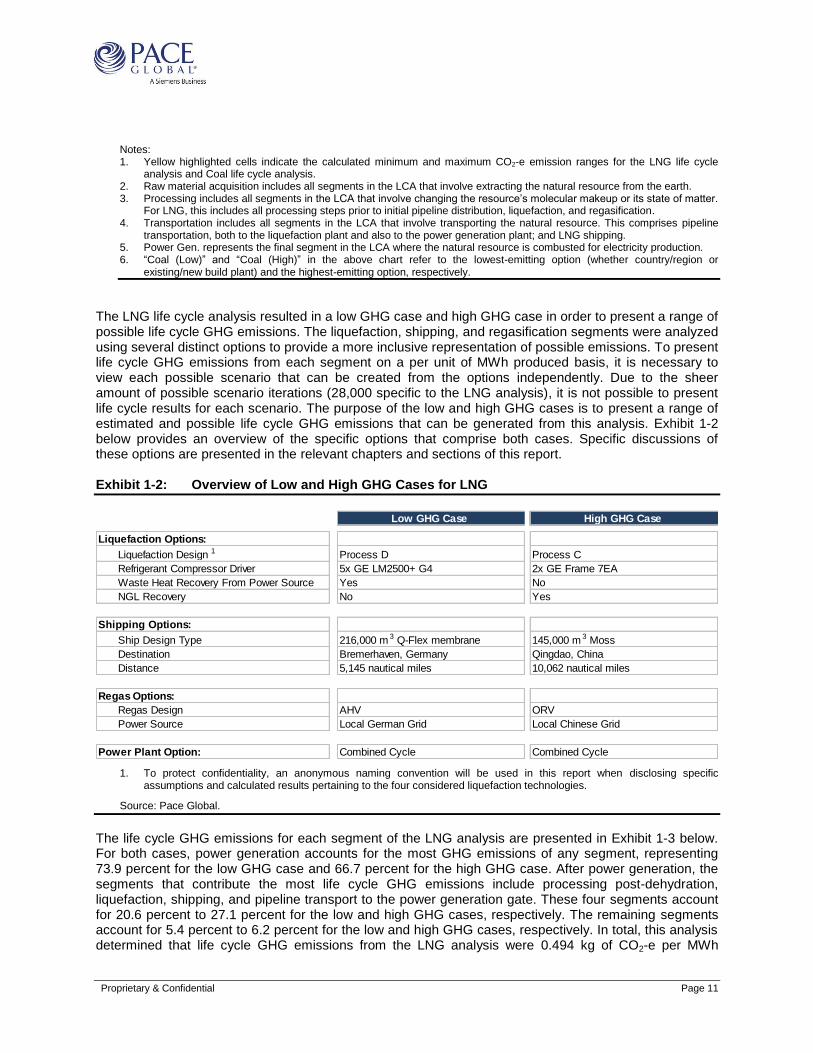
The LNG life cycle analysis resulted in a low GHG case and high GHG case in order to present a range of possible life cycle GHG emissions. The liquefaction, shipping, and regasification segments were analyzed using several distinct options to provide a more inclusive representation of possible emissions. To present life cycle GHG emissions from each segment on a per unit of MWh produced basis, it is necessary to view each possible scenario that can be created from the options independently. Due to the sheer amount of possible scenario iterations (28,000 specific to the LNG analysis), it is not possible to present life cycle results for each scenario. The purpose of the low and high GHG cases is to present a range of estimated and possible life cycle GHG emissions that can be generated from this analysis. Exhibit 1-2 below provides an overview of the specific options that comprise both cases. Specific discussions of these options are presented in the relevant chapters and sections of this report. Exhibit 1-2: Overview of Low and High GHG Cases for LNG
1. To protect confidentiality, an anonymous naming convention will be used in this report when disclosing specific assumptions and calculated results pertaining to the four considered liquefaction technologies.
Source: Pace Global.
The life cycle GHG emissions for each segment of the LNG analysis are presented in Exhibit 1-3 below. For both cases, power generation accounts for the most GHG emissions of any segment, representing 73.9 percent for the low GHG case and 66.7 percent for the high GHG case. After power generation, the segments that contribute the most life cycle GHG emissions include processing post-dehydration, liquefaction, shipping, and pipeline transport to the power generation gate. These four segments account for 20.6 percent to 27.1 percent for the low and high GHG cases, respectively. The remaining segments account for 5.4 percent to 6.2 percent for the low and high GHG cases, respectively. In total, this analysis determined that life cycle GHG emissions from the LNG analysis were 0.494 kg of CO2-e per MWh
Low GHG Case High GHG Case
Liquefaction Options:
Liquefaction Design 1 Process D Process C
Refrigerant Compressor Driver 5x GE LM2500+ G4 2x GE Frame 7EA
Waste Heat Recovery From Power Source Yes No
NGL Recovery No Yes
Shipping Options:
Ship Design Type 216,000 m 3 Q-Flex membrane 145,000 m 3 Moss
Destination Bremerhaven, Germany Qingdao, China
Distance 5,145 nautical miles 10,062 nautical miles
Regas Options:
Regas Design AHV ORV
Power Source Local German Grid Local Chinese Grid
Power Plant Option: Combined Cycle Combined Cycle

Proprietary & Confidential Page 12
produced for the low GHG case and 0.547 kg of CO2-e per MWh produced for the high GHG case. Alternatively, the high GHG case generated life cycle GHG emissions that were 10.8 percent higher than the low GHG case. Exhibit 1-3: Summary of LNG Life Cycle Analysis
Source: Pace Global.
Critical in integrating each segment of the life cycle analysis was determining the amount of gas loss or use for each segment. Gas loss occurs from vented emissions during routine processes or unplanned fugitive emissions inherent in several stages of the LNG analysis. Gas use occurs from using natural gas as fuel to power the operations of various categories of equipment. Exhibit 1-4 below presents the results of natural gas loss and use over the entire life cycle analysis for the low and high GHG cases. Exhibit 1-4 also shows the mass of gas required to exit each process before entering the gate of the subsequent segment in order for one MWh to be produced.
0.0E+00
1.0E-01
2.0E-01
3.0E-01
4.0E-01
5.0E-01
6.0E-01
7.0E-01
8.0E-01
9.0E-01
To
nn
es
CO
2 E
qu
iva
len
t P
er
MW
h
Low GHG Case High GHG Case
Low GHG Case High GHG Case
Phase of LCA
CO2-e
(tonnes/MWh) % Of Total
CO2-e
(tonnes/MWh)
% Of
Total
Well Drilling 2.05×10⁻³ 0.4% 2.48×10⁻³ 0.5%
Extraction 1.50×10⁻² 3.0% 1.82×10⁻² 3.3%
Processing - Dehydration 8.51×10⁻⁵ 0.0% 1.03×10⁻⁴ 0.0%
Processing - All Other 2.47×10⁻² 5.0% 2.99×10⁻² 5.5%
Transport (To Liquefaction) 8.78×10⁻³ 1.8% 1.06×10⁻² 1.9%
Liquefaction 3.55×10⁻² 7.2% 5.53×10⁻² 10.1%
Shipping 1.61×10⁻² 3.3% 3.72×10⁻² 6.8%
Regasification 7.49×10⁻⁴ 0.2% 2.38×10⁻³ 0.4%
Transport (To Power Gen) 2.57×10⁻² 5.2% 2.57×10⁻² 4.7%
Power Generation 0.365 73.9% 0.365 66.7%
Total: 0.494 100.0% 0.547 100.0%

Proprietary & Confidential Page 13
Exhibit 1-4: Summary of Natural Gas Loss and Use during the LNG Life Cycle Analysis
Source: Pace Global.
Ultimately, both the low and high GHG cases are estimated to require 7.2 MCF (136.9 kg) of natural gas to reach the power plant gate to produce one MWh of electricity. For the low GHG case, over the course of the life cycle boundaries, 8.1 MCF (153.6 kg) of gas is the estimated resource requirement that needs to be extracted from the well because the steps involved in delivering electrical power via the LNG value chain will result in an estimated total of 0.9 MCF (16.7 kg) of natural gas loss or use per MWh produced. Since both the low and high GHG cases are both using the same assumptions for a combined cycle power plant, the high GHG case also requires 7.2 MCF (136.9 kg) of natural gas to reach the power plant gate to produce one MWh of electricity. Over the course of the life cycle boundaries, 9.8 MCF (186.2 kg) of gas was the estimated resource requirement that needs to be extracted from the well because the steps involved in the LNG value chain will result in an estimated total of 2.6 MCF (49.3 kg) of natural gas loss or use per MWh produced. As presented earlier in Exhibit 1-2, this analysis assumes a combined cycle power plant is being utilized in both the low and high GHG cases because these types of power plants will represent the majority of capacity of future gas-fired generation facilities. An analysis for simple cycle gas-fired power plants is presented in Chapter 9. Simple cycle power plants were calculated to require 11.1 MCF (211.2 kg) of natural gas to produce one MWh of electricity, representing a 54.2 percent increase in fuel consumption relative to a combined cycle power plant. This is a substantial difference; its effects cascaded throughout the life cycle analysis as each segment prior to power generation would require substantially more natural gas throughput, thus increasing GHG emissions from every segment in the life cycle. The increase in fuel consumption rate alone would result in 14.1 percent increase in life cycle GHG emissions for the low
Phase
NG Loss/Use
Per Reference
Flow Unit
Mass Of Gas
Required To Exit
This Process (kg)
Actual NG Loss
Per MWh
produced
% Share of
Total Lifecycle
NG Loss/Use
Well Drilling 0.0 kg/kg of NG produced 153.6 0.00 0.0%
Extraction 5.05×10⁻³ kg/kg of NG produced 152.9 0.77 4.6%
Processing - Dehydration 1.46×10⁻⁴ kg/kg dehydrated NG 152.8 0.02 0.1%
Processing - All Other 4.19×10⁻² kg/kg processed NG 146.7 6.15 36.8%
Transport (To Liquefaction) 4.87×10⁻³ kg/kg thruput NG 146.0 0.71 4.3%
Liquefaction 5.03×10⁻² kg/kg liquefied 139.0 6.99 41.8%
Shipping 0.0 kg/kg-nm of feed LNG 139.0 0.00 0.0%
Regasification 0.0 kg/kg regas output 139.0 0.00 0.0%
Transport (To Power Gen) 1.52×10⁻² kg/kg thruput NG 136.9 2.08 12.5%
Power Generation N/A N/A 0.0 0.00 0.0%
Total: 16.7 100.0%
Well Drilling 0.0 kg/kg of NG produced 186.2 0.00 0.0%
Extraction 5.05×10⁻³ kg/kg of NG produced 185.2 0.94 1.9%
Processing - Dehydration 1.46×10⁻⁴ kg/kg dehydrated NG 185.2 0.03 0.1%
Processing - All Other 4.19×10⁻² kg/kg processed NG 177.7 7.45 15.1%
Transport (To Liquefaction) 4.87×10⁻³ kg/kg thruput NG 176.9 0.86 1.7%
Liquefaction 0.273 kg/kg liquefied 139.0 37.89 76.9%
Shipping 4.98×10⁻⁶ kg/kg-nm of feed LNG 139.0 0.00 0.0%
Regasification 0.0 kg/kg regas output 139.0 0.00 0.0%
Transport (To Power Gen) 1.52×10⁻² kg/kg thruput NG 136.9 2.08 4.2%
Power Generation N/A N/A 0.0 0.00 0.0%
Total: 49.3 100.0%
Lo
w G
HG
Case
Hig
h G
HG
Case
Proprietary & Confidential Page 14
GHG case, highlighting the importance of power plant efficiency at the end of the life cycle analysis. This illustrates the importance that natural gas loss or use has on total life cycle GHG emissions. The more gas loss or use from any segment necessitates more gas in each previous segment. Simple cycle gas-fired power generation plants were not included in the presentation of the high GHG case because there is a low likelihood that exported LNG from the U.S. will ultimately be consumed in a simple cycle plant and thus would not produce a likely representative estimated GHG emission range. Simple cycle power plants represent older and less efficient technology, and the relative inefficiency of this type of power plant is such that there are limited applications where a simple cycle plant would be preferable to a combined cycle power plant, particularly for developers building new power plants. Simple cycle power plants exist and can be viable in specific circumstances, but represent a small percentage of installed gas-fired generation capacity, and are a low probability choice for future installations. The results of the coal LCA show that power generation produces the majority of GHG emissions from the coal life cycle, averaging 78.7 percent among the five countries/regions analyzed for the ‘average’ installed plant and 77.4 percent for the new-build option. Emissions from power generation as a percentage of the country/regional total were the highest for Western Europe and India, with emissions of 1.005 CO2-e/MWh (94 percent of the total) and 1.166 CO2-e/MWh (91 percent of the total), respectively, for the existing plant option. Emissions from coal transport varied significantly among the countries, due to the different distances travelled and the various transport modes employed. South Korea and Japan had the highest emissions from transportation for both power plant options, averaging 0.401 tonnes CO2-e/MWh for the installed plant and 0.349 tonnes CO2-e/MWh for the new-build option. Emissions from coal extraction and mining, which include fugitive emissions from both mining and post-mining operations, ranged from approximately 1.4 – 1.5 percent of the total for Japan and South Korea (which source their coal primarily from Australia) to 15.5 – 16.5 percent for domestically sourced Chinese coal.

Proprietary & Confidential Page 15
Exhibit 1-5: Summary of Emissions for the Coal Life Cycle Analysis
Source: Pace Global based on referenced sources.
0.0
0.2
0.4
0.6
0.8
1.0
1.2
1.4
1.6
Japan S. Korea India China Europe
ton
neC
O2e /
MW
h
Average Installed Plant Life Cycle Emissions
Power Generation Coal Transportation Coal Extraction / Mining
0.0
0.2
0.4
0.6
0.8
1.0
1.2
1.4
1.6
Japan S. Korea India China Europe
ton
neC
O2e /
MW
h
New Plant Life Cycle Emissions
Power Generation Coal Transportation Coal Extraction / Mining
Proprietary & Confidential Page 16
CHAPTER 2 – INTRODUCTION
STUDY OBJECTIVE
This study was undertaken on behalf of the Center for LNG to evaluate GHG emissions from the full LNG life cycle and compare them with GHG emissions from the full coal life cycle. The scope of this assessment includes an estimate of the total life cycle GHG
1 emissions (in metric tonnes of CO2-
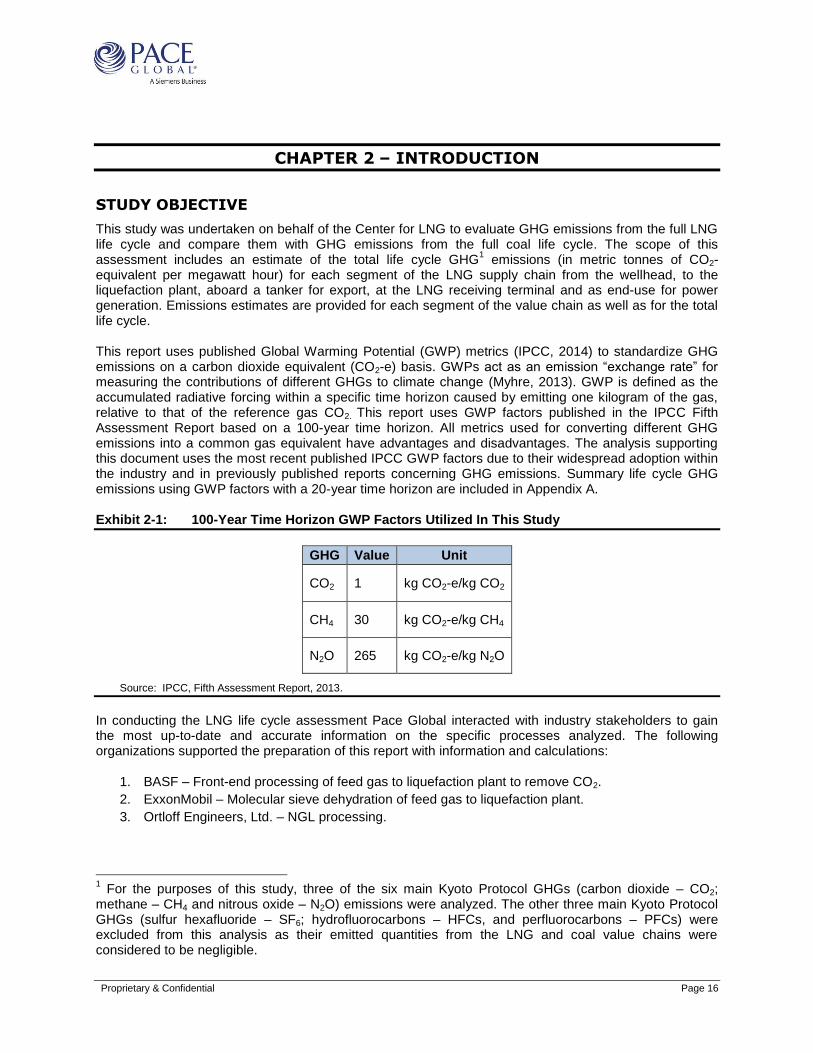
equivalent per megawatt hour) for each segment of the LNG supply chain from the wellhead, to the liquefaction plant, aboard a tanker for export, at the LNG receiving terminal and as end-use for power generation. Emissions estimates are provided for each segment of the value chain as well as for the total life cycle. This report uses published Global Warming Potential (GWP) metrics (IPCC, 2014) to standardize GHG emissions on a carbon dioxide equivalent (CO2-e) basis. GWPs act as an emission “exchange rate” for measuring the contributions of different GHGs to climate change (Myhre, 2013). GWP is defined as the accumulated radiative forcing within a specific time horizon caused by emitting one kilogram of the gas, relative to that of the reference gas CO2. This report uses GWP factors published in the IPCC Fifth Assessment Report based on a 100-year time horizon. All metrics used for converting different GHG emissions into a common gas equivalent have advantages and disadvantages. The analysis supporting this document uses the most recent published IPCC GWP factors due to their widespread adoption within the industry and in previously published reports concerning GHG emissions. Summary life cycle GHG emissions using GWP factors with a 20-year time horizon are included in Appendix A. Exhibit 2-1: 100-Year Time Horizon GWP Factors Utilized In This Study
GHG Value Unit
CO2 1 kg CO2-e/kg CO2
CH4 30 kg CO2-e/kg CH4
N2O 265 kg CO2-e/kg N2O
Source: IPCC, Fifth Assessment Report, 2013.
In conducting the LNG life cycle assessment Pace Global interacted with industry stakeholders to gain the most up-to-date and accurate information on the specific processes analyzed. The following organizations supported the preparation of this report with information and calculations:
1. BASF – Front-end processing of feed gas to liquefaction plant to remove CO2. 2. ExxonMobil – Molecular sieve dehydration of feed gas to liquefaction plant. 3. Ortloff Engineers, Ltd. – NGL processing.
1 For the purposes of this study, three of the six main Kyoto Protocol GHGs (carbon dioxide – CO2;
methane – CH4 and nitrous oxide – N2O) emissions were analyzed. The other three main Kyoto Protocol GHGs (sulfur hexafluoride – SF6; hydrofluorocarbons – HFCs, and perfluorocarbons – PFCs) were excluded from this analysis as their emitted quantities from the LNG and coal value chains were considered to be negligible.
Proprietary & Confidential Page 17
4. ConocoPhillips – Optimized Cascade liquefaction process.2
5. Air Products and Chemicals, Inc. – SMR, C3MR, and DMR liquefaction processes.2
6. Herbert Engineering Corp. – LNG transport by ship. 7. KBR – LNG Regasification.
In parallel, Pace Global undertook the same analysis across the coal life cycle, from mining to cross-country land transport within the country of the coal’s origin, export via ocean-vessel ships (where relevant), and as final use in power generation. Fugitive emissions from mining and post-mining activities were also considered. The coal-fired power plant emissions for each region
3 are represented both for an
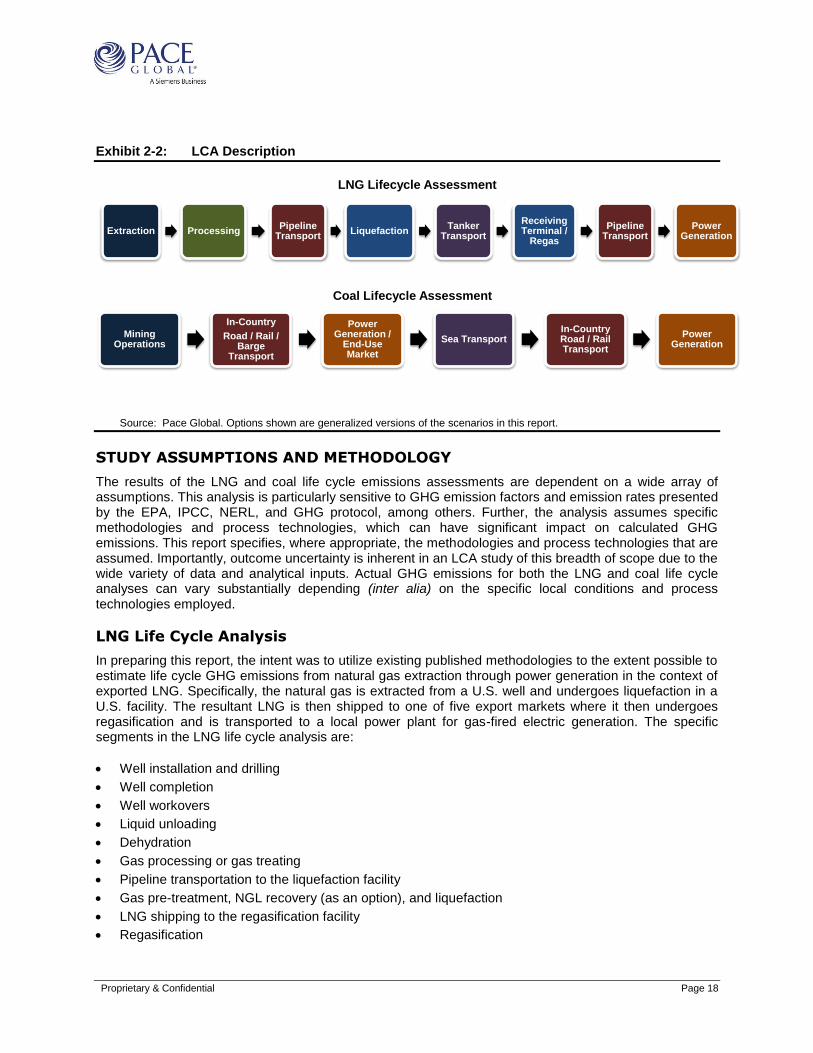
‘average’ installed plant and for a typical new-build coal-fired power plant in terms of mass of CO2 equivalent per unit of energy output. The LCA included only emissions related to operation of the facilities and equipment comprising the value chain from source through power generation from each fuel source, and did not include emissions from the construction or decommissioning of infrastructure. Further, the LCA only included emissions from the operation of infrastructure directly attributable to the fuel combusted in the selected end-use power plant. For the LNG value chain, for example, the emissions from manufacturing the equipment used to drill and complete gas wells or from constructing pipelines and power plants were not included in this analysis, while emissions from pipeline compressor stations, locomotives, and LNG tankers were included. Exhibit 2-2 below presents a general schematic of the emission cycles included in this report.
2 To protect confidentiality, an anonymous naming convention was used in this report when disclosing
specific assumptions and calculated results pertaining to the four considered liquefaction technologies. Further, certain assumptions that could be used to infer a specific liquefaction process technology, such as energy requirements and LNG output, were not disclosed in order to protect confidentiality. 3 For the LCA, the following five countries/regions were analyzed: Western Europe, China, India, South
Korea, and Japan.
Proprietary & Confidential Page 18
Exhibit 2-2: LCA Description
Source: Pace Global. Options shown are generalized versions of the scenarios in this report.
STUDY ASSUMPTIONS AND METHODOLOGY
The results of the LNG and coal life cycle emissions assessments are dependent on a wide array of assumptions. This analysis is particularly sensitive to GHG emission factors and emission rates presented by the EPA, IPCC, NERL, and GHG protocol, among others. Further, the analysis assumes specific methodologies and process technologies, which can have significant impact on calculated GHG emissions. This report specifies, where appropriate, the methodologies and process technologies that are assumed. Importantly, outcome uncertainty is inherent in an LCA study of this breadth of scope due to the wide variety of data and analytical inputs. Actual GHG emissions for both the LNG and coal life cycle analyses can vary substantially depending (inter alia) on the specific local conditions and process technologies employed.
LNG Life Cycle Analysis
In preparing this report, the intent was to utilize existing published methodologies to the extent possible to estimate life cycle GHG emissions from natural gas extraction through power generation in the context of exported LNG. Specifically, the natural gas is extracted from a U.S. well and undergoes liquefaction in a U.S. facility. The resultant LNG is then shipped to one of five export markets where it then undergoes regasification and is transported to a local power plant for gas-fired electric generation. The specific segments in the LNG life cycle analysis are:
Well installation and drilling
Well completion
Well workovers
Liquid unloading
Dehydration
Gas processing or gas treating
Pipeline transportation to the liquefaction facility
Gas pre-treatment, NGL recovery (as an option), and liquefaction
LNG shipping to the regasification facility
Regasification
Coal Lifecycle Assessment
Extraction ProcessingPipeline
TransportLiquefaction
Tanker Transport
Receiving Terminal /
Regas
Pipeline Transport
Power Generation
LNG Lifecycle Assessment
Mining Operations
In-Country
Road / Rail / Barge
Transport
Power Generation /
End-Use Market
Sea TransportIn-Country Road / Rail Transport
Power Generation

Proprietary & Confidential Page 19
Pipeline transportation to the power generation plant
Power generation at a gas-fired power plant
To that aim, this analysis derived its methodology primarily from reports published by the American Petroleum Institute (API) and the U.S. National Energy Technology Laboratory (NETL). Specifically, the August 2009 API report: “Compendium of Greenhouse Gas Emissions for the Oil and Natural Gas Industry” (API compendium) and the May 2014 NETL report: “Life Cycle Analysis of Natural Gas Extraction and Power Generation” were heavily relied upon to devise a credible, industry-accepted methodology of estimating GHG emissions. The assumptions and inputs required to complete this life cycle analysis were obtained from multiple sources of published data and reports, and are described in more detail in their respective sections of this report. Published emission factors were sourced primarily from reports published by the U.S. Environmental Protection Agency (EPA) and, to a lesser extent, the API and NETL. The 2011 EPA document: “Background Technical Support Document” (background technical support document) was of particular importance in deriving emission factors. Emission factors were also heavily sourced from the EPA’s AP-42 documents. Additional sources of assumptions and inputs are specifically cited throughout this document. This report assumes the origination of the natural gas exported from the U.S. is extracted from an average, representative well located in the Haynesville Shale. The Haynesville Shale was chosen as a representative well due to its insignificant production of oil and its proximity to planned LNG export facilities in the U.S. Gulf Coast region. The Haynesville Shale is an active shale play with several oil and gas production companies owning acreage. The liquefaction segment includes a turbo-expander based NGL recovery unit as an option. Emissions associated with liquefaction were assumed to be based on a two train design, adjacent to the gas treating and optional NGL recovery units, based on the following liquefaction technologies:
ConocoPhillips Optimized Cascade
Air Products Single Mixed Refrigerant (SMR)
Air Products Propane-Precooled Mixed Refrigerant (C3MR)
Air Products Dual Mixed Refrigerant (DMR)
Further, the liquefaction segment provides emissions from power generation sources and drivers for the liquefaction unit’s refrigerant compressors of the following types:
Two GE Frame 7EA gas turbines per train, no waste heat recovery
Two GE Frame 7EA gas turbines per train, with waste heat recovery to provide process heat
requirements
Five GE LM2500+ G4 aero-derivative gas turbines per train, no waste heat recovery
Five GE LM2500+ G4 aero-derivative gas turbines per train, with waste heat recovery to provide
process heat requirements
Electric motors
Sources of calculated GHG emissions from LNG shipping include ship loading, the laden voyage, ship offloading, the ballast voyage, and support vessels needed while approaching and at port. The ship design types analyzed in this report are as follows:
145,000 cubic meter conventional steam propulsion Moss ships using LNG boil-off gas (laden) and
boil-off/bunker fuel (ballast)

Proprietary & Confidential Page 20
165,000 cubic meter Dual Fuel Diesel Electric membrane ship using LNG boil-off gas (laden) and
boil-off/bunker fuel (ballast)
216,000 cubic meter Q-Flex membrane ship using bunker fuel (laden and ballast) with shipboard boil-
off gas reliquefaction
266,000 cubic meter Q-Max membrane ship using bunker fuel (laden and ballast) with shipboard boil-
off gas reliquefaction
Emissions from the laden and ballast voyages were provided on a per nautical mile basis to allow adaptation of the analysis to any combination of liquefaction plant and receiving terminal locations. LNG life cycle emissions were estimated for China, India, Western Europe (represented as Germany), Japan, and South Korea. Emissions from LNG regasification and receiving terminal operations assume an onshore terminal location. Boil-off gas generated from a ship unloading operation is assumed to be recovered. The regasification segment analysis considers several regasification system designs:
Seawater-heated open rack vaporizers
Submerged combustion vaporizers
Air-heated vaporization using a closed loop glycol / water system heated by air
Air-heated vaporization using and an open loop air-heated water system
LNG vaporization via waste heat from a co-located power plant
The gas-fired power generation segment includes an analysis of combined-cycle and simple-cycle power plants. However, as discussed in Chapter 1 – Executive Summary, simple-cycle power plants were not considered in the development of the High GHG case. Segment emissions from natural gas and LNG cases were calculated and summed in terms of “adjusted metric tonnes (tonnes) of carbon dioxide equivalent (CO2-e) per MWh.” Pace Global adjusted the GHG emissions at each segment of the supply chain to accurately reflect the emissions resulting from 1 MWh of electricity generation.
4
Coal Life Cycle Analysis
Pace Global estimated the emissions throughout the life cycle process of coal extraction, transportation, and end-use combustion for power generation for both an existing installed coal-fired power plant and an efficient new-build coal-fired power plant. Coal life cycle emissions were estimated for China, India, Western Europe (represented as Germany), Japan, and South Korea.
5
To the extent that the information was publically available, the assumptions used represent the country or regional average coal supply pathway and combustion characteristics. This information included the main type of coal used;
6 the main region or country of origin; the dominant mining method (i.e., surface or
4 An emission factor in the production segment, for example, was adjusted by a certain percentage to
reflect the fact that a given portion of the produced gas would be combusted during the life cycle and thus would not be available for combustion in the power plant. While a unit of gas at the production segment would produce a certain amount of emissions per MWh at the power plant, a fraction would be combusted before it gets to the power plant. 5 These countries were chosen as they are major LNG-importing countries.
6 i.e., anthracite, bituminous, sub-bituminous, or lignite.
Proprietary & Confidential Page 21
underground); and the prevailing mode of transport for both in-country land transportation and export (where applicable). Country-specific, average coal plant combustion emission rates were assumed.
GHG Emissions from Coal Mining
Pace Global used publically available data to estimate the emissions attributable to the coal supply chain. Key assumptions used in this assessment were as follows:
As the majority of coal consumed in Germany, China, and India is produced domestically, mining emissions were estimated assuming local conditions for both mining operations and transport. Coal consumed in Japan and South Korea is almost entirely imported, with Australia being the main country of origin (EIA, 2013).
Data sources indicate that surface mining is the dominant mining method in four out of the five countries analyzed (with the exception being China).
The main activities carried out at open-cut coal mines that could lead to GHG emissions were assumed to include the removal of vegetation and topsoil; drilling and blasting overburden of coal; removal and placement of coal overburden; the breakage and sizing of coal; extraction and transport of coal at the mine site; and washery and workshop operations (Australian Government, Department of Sustainability, Environment, Water, Population, and Communities for Mining, 2012). GHG emissions from underground coal mines were primarily assumed to be the result of earthmoving; shaft/drift access and ventilation development; underground drilling and blasting; the breakage and sizing of coal; washery, workshop, and power plant operations; extraction and transport of coal at the mine site; and wind erosion.
Fugitive Emissions from Mining
Fugitive emissions were considered to be from the liberation of stored gas (methane) from the breakage of coal and the surrounding strata during mining operations. Fugitive emissions from underground mines generally arise from ventilation and degasification systems, while fugitive emissions from surface mining are generally from seam gases emitted through the breakage of the coal and overburden, low temperature oxidation of waste coal and/or low quality coal in dumps, and uncontrolled combustion (IPCC, Guidelines for National Greenhouse Gas Inventories, 2006). The amount of methane released during coal mining depends on a number of factors, namely coal rank, the gas content of the coal, and the mining method employed,
with emission rates varying with mine depth and being considerably higher
for underground mines (UNFCCC). Post-mining fugitive emission rates will also depend on the gas content of the coal. As individual mine methane data were either not available or not directly relevant, average methane emission factors representative of surface mining and underground mining from the IPCC (IPCC, Guidelines for National Greenhouse Gas Inventories) were used.
GHG Emissions from Coal Transport
Once coal has been mined and processed, it is typically loaded onto railroad cars, barges, or heavy-duty trucks for domestic consumption and/or export. The transport method used generally depends on the total transport distance and the available infrastructure, with rail and barge being the preferred options for longer hauls when infrastructure is available, and trucking, which is preferred for shorter movements. The scope of this LCA includes the GHG emissions associated with the transport of coal within the country of origin to a major transfer point (where applicable) and/or point of export, the shipping of coal from the country of origin to the importing country (where applicable), and the transport of coal to the end-use power plant within the country of consumption. In-country land transport was assumed to be via diesel-powered rail or truck and international coal transport was assumed via bulk carrier. In all cases, average distances and transportation modes were
Proprietary & Confidential Page 22
assumed. Emission factors for truck, rail, and ship transport were sourced from the GHG Protocol (GHG Protocol (WRI), 2005).
GHG Emissions from Coal Use in Power Generation
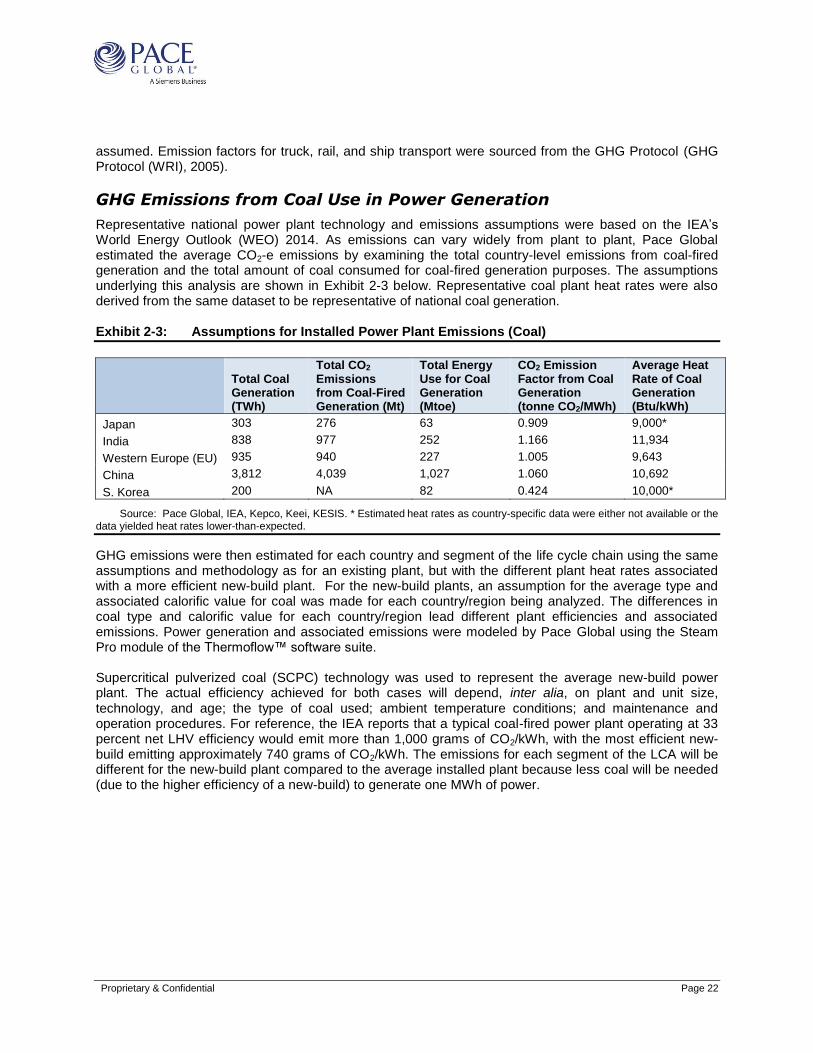
Representative national power plant technology and emissions assumptions were based on the IEA’s World Energy Outlook (WEO) 2014. As emissions can vary widely from plant to plant, Pace Global estimated the average CO2-e emissions by examining the total country-level emissions from coal-fired generation and the total amount of coal consumed for coal-fired generation purposes. The assumptions underlying this analysis are shown in Exhibit 2-3 below. Representative coal plant heat rates were also derived from the same dataset to be representative of national coal generation. Exhibit 2-3: Assumptions for Installed Power Plant Emissions (Coal)
Total Coal Generation (TWh)
Total CO2 Emissions from Coal-Fired Generation (Mt)
Total Energy Use for Coal Generation (Mtoe)
CO2 Emission Factor from Coal Generation (tonne CO2/MWh)
Average Heat Rate of Coal Generation (Btu/kWh)
Japan 303 276 63 0.909 9,000*
India 838 977 252 1.166 11,934
Western Europe (EU) 935 940 227 1.005 9,643
China 3,812 4,039 1,027 1.060 10,692
S. Korea 200 NA 82 0.424 10,000*
Source: Pace Global, IEA, Kepco, Keei, KESIS. * Estimated heat rates as country-specific data were either not available or the data yielded heat rates lower-than-expected.
GHG emissions were then estimated for each country and segment of the life cycle chain using the same assumptions and methodology as for an existing plant, but with the different plant heat rates associated with a more efficient new-build plant. For the new-build plants, an assumption for the average type and associated calorific value for coal was made for each country/region being analyzed. The differences in coal type and calorific value for each country/region lead different plant efficiencies and associated emissions. Power generation and associated emissions were modeled by Pace Global using the Steam Pro module of the Thermoflow™ software suite. Supercritical pulverized coal (SCPC) technology was used to represent the average new-build power plant. The actual efficiency achieved for both cases will depend, inter alia, on plant and unit size, technology, and age; the type of coal used; ambient temperature conditions; and maintenance and operation procedures. For reference, the IEA reports that a typical coal-fired power plant operating at 33 percent net LHV efficiency would emit more than 1,000 grams of CO2/kWh, with the most efficient new-build emitting approximately 740 grams of CO2/kWh. The emissions for each segment of the LCA will be different for the new-build plant compared to the average installed plant because less coal will be needed (due to the higher efficiency of a new-build) to generate one MWh of power.

Proprietary & Confidential Page 23
CHAPTER 3 – GHG EMISSIONS FROM NATURAL GAS PRODUCTION
The boundaries for modeling GHG emissions from natural gas production7 begin with the drilling and
completion of a generic natural gas well using horizontal drilling and hydraulic fracturing, averaged over the life of a typical well per unit of production, and end when the natural gas is extracted, gathered, and transported to the processing plant gate. This analysis does not consider GHG emissions generated before the well is drilled, such as wellpad construction or indirect emissions from the fabrication and transportation of drilling tubulars, well casing, production tubulars, and drilling materials. GHG emissions include the combustion emissions from drilling rigs using diesel-fuel engines with internal combustion (IC). This segment also includes vented and flared emissions generated during the extraction of natural gas, and is inclusive of well completions, well workovers, liquid unloading, point source venting, and fugitive emissions from pneumatic devices and other sources. The results of our analysis show that the production segment, from well drilling through raw gas gathering, results in the loss or use of 5.05x10
-3 MCF of natural gas per MCF of natural gas produced.
Specifically, it requires production of 1.005 units of natural gas for each 1.0 unit of natural gas to reach the gas processing gate. This is a result of natural gas venting and flaring during several stages of the extraction segment that is discussed in more detail in subsequent sections of this chapter. In total, this segment of the life cycle analysis accounts for 1.9 percent (high GHG case) to 4.6 percent (low GHG case) of the natural gas lost over the complete life cycle analysis. No fugitive emissions occur during the drilling stage, as this analysis assumes the drilling rigs have diesel-fired engines. Venting and flaring of gas occurs during well completions, well workovers, liquid unloading, and fugitive or flared emissions from various types of essential equipment throughout the post-drilling extraction stage. Total GHG emissions from this segment were calculated to be 0.112 kg of CO2-e per kg of natural gas produced, irrespective of the low and high GHG cases. Well drilling accounted for 11.9 percent of the GHG emission total, which is entirely attributable to emissions generated from diesel combustion from operating drilling rigs. Details of the results from this stage of the production segment are presented in Exhibit 4-1 later in this chapter. Post-drilling emissions during the production segment accounted for 88.1 percent of this segment’s total GHG emissions, which is attributable to vented and flared emissions. Details of the results from the post-drilling stage of the production segment are presented in Exhibit 3-4 later in this chapter.
WELL INSTALLATION AND DRILLING
Well installation includes drilling of the well and installation of the well casing (NETL, 2014). For the purpose of this report, a generic gas well drilled in the Haynesville Shale (Haynesville) was chosen as a representative well due to its insignificant production of oil and its proximity to planned LNG export facilities in the U.S. Gulf Coast region. The Gulf Coast region is widely considered to have the most promising prospects for LNG exports from the U.S. due to the high concentration of approvals from the U.S. Department of Energy (DOE) to export domestically produced LNG to countries that do not have a Free Trade Agreement (FTA) with the U.S.
8
In this segment, the report considers the combustion emissions generated from a generic drilling rig using a diesel-fueled internal combustion engine. The following assumptions were used:
7 Natural gas production is synonymous with natural gas extraction in the context of this report.
8 There are nine total LNG export facility projects in the United States with non-FTA approval, six of which
are located on the U. S. Gulf Coast (DOE, 2014).
Proprietary & Confidential Page 24
A modern drilling rig with a drilling rate of penetration of 17.8 m/hr (Reum & al., 2008) published
in the Word Oil magazine. Well depth is assumed to be 12,000 feet (3,659 meters),
The estimated ultimate recovery (EUR) per well is assumed to be 4.9 BCF (93.3 million kg) over
an average well lifespan of 30 years, derived using data from the Post Carbon Institute (Hughes,
2014).
A typical diesel engine for horizontally drilling a shale gas well has a power of 3,500 hp, or 2.61
MW (Pring & Baker, 2009) and a heat rate of 7,000 Btu/hp-hr (EPA, 1995).
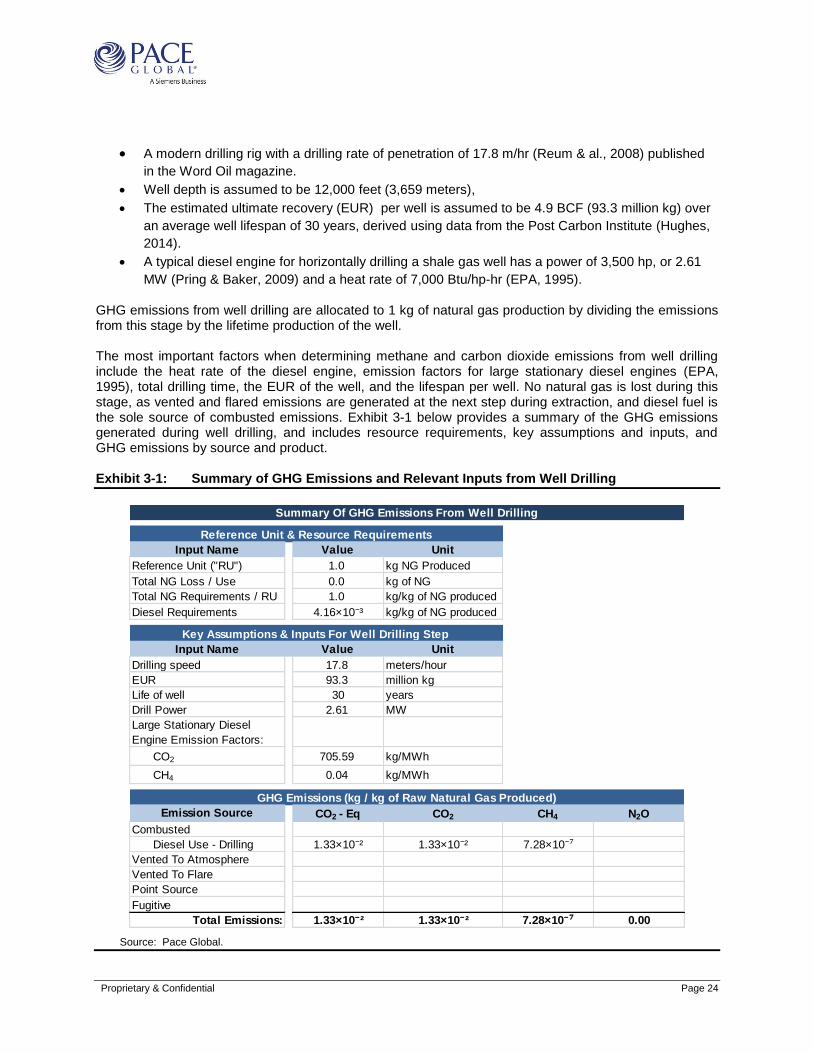
GHG emissions from well drilling are allocated to 1 kg of natural gas production by dividing the emissions from this stage by the lifetime production of the well. The most important factors when determining methane and carbon dioxide emissions from well drilling include the heat rate of the diesel engine, emission factors for large stationary diesel engines (EPA, 1995), total drilling time, the EUR of the well, and the lifespan per well. No natural gas is lost during this stage, as vented and flared emissions are generated at the next step during extraction, and diesel fuel is the sole source of combusted emissions. Exhibit 3-1 below provides a summary of the GHG emissions generated during well drilling, and includes resource requirements, key assumptions and inputs, and GHG emissions by source and product. Exhibit 3-1: Summary of GHG Emissions and Relevant Inputs from Well Drilling
Source: Pace Global.
Summary Of GHG Emissions From Well Drilling
Reference Unit & Resource Requirements
Input Name Value Unit
Reference Unit ("RU") 1.0 kg NG Produced
Total NG Loss / Use 0.0 kg of NG
Total NG Requirements / RU 1.0 kg/kg of NG produced
Diesel Requirements 4.16×10⁻³ kg/kg of NG produced
Key Assumptions & Inputs For Well Drilling Step
Input Name Value Unit
Drilling speed 17.8 meters/hour
EUR 93.3 million kg
Life of well 30 years
Drill Power 2.61 MW
Large Stationary Diesel
Engine Emission Factors:
CO2 705.59 kg/MWh
CH4 0.04 kg/MWh
GHG Emissions (kg / kg of Raw Natural Gas Produced)
Emission Source CO2 - Eq CO2 CH4 N2O
Combusted
Diesel Use - Drilling 1.33×10⁻² 1.33×10⁻² 7.28×10⁻⁷
Vented To Atmosphere
Vented To Flare
Point Source
Fugitive
Total Emissions: 1.33×10⁻² 1.33×10⁻² 7.28×10⁻⁷ 0.00

Proprietary & Confidential Page 25
Actual production from any well is highest initially, eventually tapering downward until the production rate no longer justifies the operating cost. For the purposes of this analysis, this is irrelevant since GHG emissions are being allocated over the lifetime production of the well to estimate an average GHG emission rate representative of a well’s productive lifespan. Correspondence with several gas production companies active in shale plays has indicated that emissions from well drilling are trending downward relative to numbers that have been derived from historically reported fuel consumption rates in U.S. unconventional well drilling. Thus, the estimated GHG emissions calculations from well drilling above should be considered conservative. The industry has demonstrated continuous improvements in GHG emissions reduction and efficiency, GHG emissions from well drilling are expected to be declining from current calculated estimates due to both increased drilling efficiency, and also increased resource acquisition per well. Importantly, the EUR assumed in this analysis is representative of an average well in the Haynesville Shale based on compiled data and analysis from the Post Carbon Institute. The actual EUR from any well is highly variable and is based on assumptions and estimates. EUR varies markedly between different shale plays, as well as within shale plays. Further, correspondence with gas production companies in dry shale gas plays has indicated that the average EUR per well in a given resource (e.g.; shale play) is increasing with advances in drilling and completion technology, and that other resources could have an average EUR per well that is either higher or lower than the Haynesville Shale.
VENTING AND FLARING DURING NATURAL GAS EXTRACTION AND GATHERING
Once the well is drilled, raw natural gas is extracted from the well and gathered and sent to a nearby processing facility. GHG emissions from this step of the life cycle include vented and flared emissions from:
Well completions;
Well workovers;
Liquid unloading;
Point source venting; and
Fugitive emissions from pneumatic devices and other sources.
Fugitive emissions from pneumatic devices and other sources are vented directly to the atmosphere. This analysis assumes emissions from well completions, liquid unloading, and point sources are assumed to be routed to a flare at a rate of 51 percent, and the remaining emissions are vented directly to the atmosphere. Well workovers are assumed to have 100 percent of emissions routed to a flare. The well workover flare rate assumption originates from correspondence with petroleum engineers at a major U.S.-based oil and gas company. The composition of the natural gas at this stage affects the amount of GHG emissions vented into the atmosphere and combusted in a flare stack. This report assumes an industry standard for upstream (i.e., raw) quality natural gas put forth by the US Environmental Protection Agency (EPA) and is presented below in Exhibit 3-2 (EPA, 2011). This composition is representative of natural gas that is co-produced with condensate or light oil, which is considerably richer in non-methane hydrocarbon components than gas from a non-associated gas well, and relative to typical pipeline gas specifications.
Proprietary & Confidential Page 26
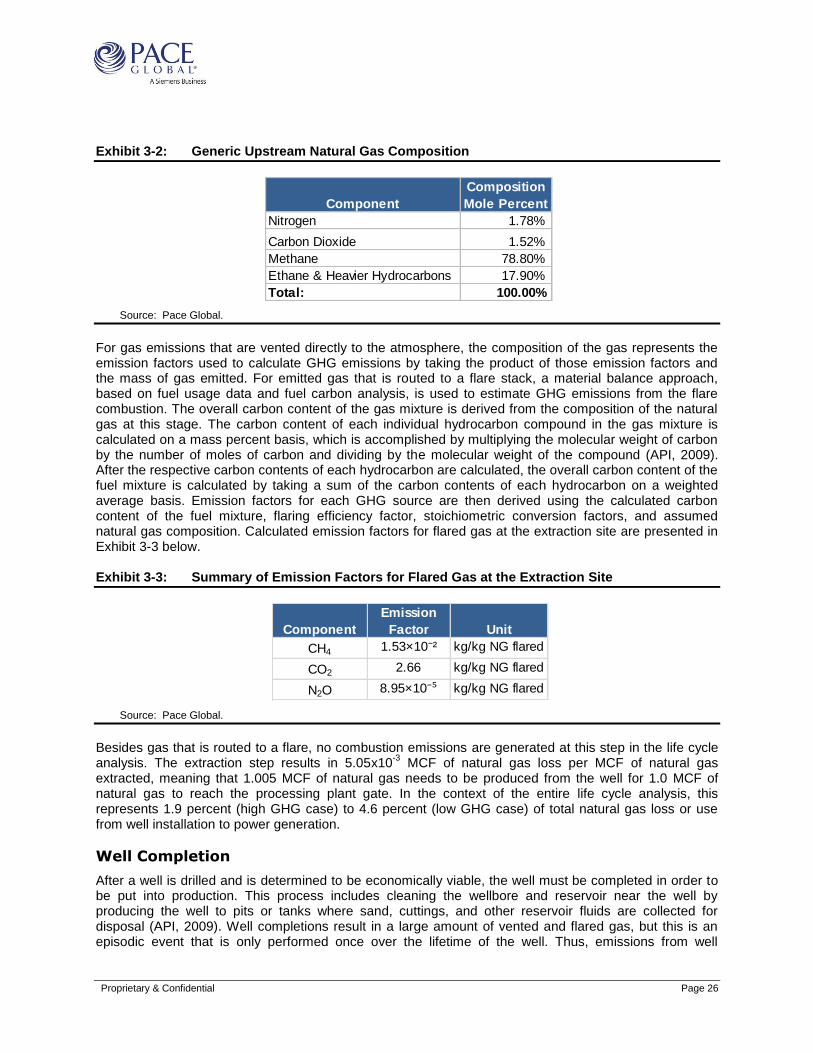
Exhibit 3-2: Generic Upstream Natural Gas Composition
Source: Pace Global.
For gas emissions that are vented directly to the atmosphere, the composition of the gas represents the emission factors used to calculate GHG emissions by taking the product of those emission factors and the mass of gas emitted. For emitted gas that is routed to a flare stack, a material balance approach, based on fuel usage data and fuel carbon analysis, is used to estimate GHG emissions from the flare combustion. The overall carbon content of the gas mixture is derived from the composition of the natural gas at this stage. The carbon content of each individual hydrocarbon compound in the gas mixture is calculated on a mass percent basis, which is accomplished by multiplying the molecular weight of carbon by the number of moles of carbon and dividing by the molecular weight of the compound (API, 2009). After the respective carbon contents of each hydrocarbon are calculated, the overall carbon content of the fuel mixture is calculated by taking a sum of the carbon contents of each hydrocarbon on a weighted average basis. Emission factors for each GHG source are then derived using the calculated carbon content of the fuel mixture, flaring efficiency factor, stoichiometric conversion factors, and assumed natural gas composition. Calculated emission factors for flared gas at the extraction site are presented in Exhibit 3-3 below. Exhibit 3-3: Summary of Emission Factors for Flared Gas at the Extraction Site
Source: Pace Global.
Besides gas that is routed to a flare, no combustion emissions are generated at this step in the life cycle analysis. The extraction step results in 5.05x10
-3 MCF of natural gas loss per MCF of natural gas
extracted, meaning that 1.005 MCF of natural gas needs to be produced from the well for 1.0 MCF of natural gas to reach the processing plant gate. In the context of the entire life cycle analysis, this represents 1.9 percent (high GHG case) to 4.6 percent (low GHG case) of total natural gas loss or use from well installation to power generation.
Well Completion
After a well is drilled and is determined to be economically viable, the well must be completed in order to be put into production. This process includes cleaning the wellbore and reservoir near the well by producing the well to pits or tanks where sand, cuttings, and other reservoir fluids are collected for disposal (API, 2009). Well completions result in a large amount of vented and flared gas, but this is an episodic event that is only performed once over the lifetime of the well. Thus, emissions from well
Component
Composition
Mole Percent
Nitrogen 1.78%
Carbon Dioxide 1.52%
Methane 78.80%
Ethane & Heavier Hydrocarbons 17.90%
Total: 100.00%
Component
Emission
Factor Unit
CH4 1.53×10⁻² kg/kg NG flared
CO2 2.66 kg/kg NG flared
N2O 8.95×10⁻⁵ kg/kg NG flared

Proprietary & Confidential Page 27
completion are allocated over the lifetime production of the well. Additionally, emitted gas during the well completion step is assumed to be flared at a flare ratio of 51 percent, which further mitigates the impact of GHG emissions from this step. The emission rate for determining the mass of emitted gas per well completion was derived from an industry survey that gathered data on GHG emissions from the completions of 2,613 wells, resulting in an average emission rate of 2.0 MMCF (3.87x10
4 kg) of emitted gas per completion (Shires & Lev-On,
2012). The lifetime and EUR of the generic well utilized in this analysis is consistent with the assumptions used in the well installation step. In this analysis, well completions result in the loss of 4.15x10
-4 MCF per
MCF of natural gas produced. Exhibit 3-4, presented at the end of this chapter, provides a summary of the GHG emissions generated from well completions, and includes resource requirements, key assumptions and inputs, and GHG emissions by source and product.
Well Workovers
Well workovers are undertaken in order to restore or increase the production from a natural gas well. Gas emitted when the well tubing is removed from the open surface casing (API, 2009) is partially captured and flared, with the remainder vented to the atmosphere. While the economic benefits of well workovers can vary, multiple natural gas production companies operating in dry gas shale plays, including the Haynesville Shale, are utilizing well workovers to increase ultimate gas recovery in a given well. Several companies currently operating in the Haynesville Shale are investing in well workover programs, particularly for wells that are identified as under-stimulated. Performing a well workover is cheaper than drilling a new well, but there is less certainty regarding how much additional production a well workover will induce. Similar to well completions, well workovers are an episodic event resulting in a large amount of GHG emissions from vented and flared gas that are allocated over the lifetime production of the well. However, well workovers are not a single event and occur in variable intervals specific to the maintenance requirements of individual wells. Workover frequency and the amount of emitted gas per workover are highly variable for each individual well. For this analysis, the assumption for the emission rate of well workovers was obtained from EPA’s background technical support document. The assumption for the frequency of well workovers was obtained from results from a combined API and ANGA survey for well workovers on unconventional wells. For unconventional wells, this analysis assumes 9.2 MMCF (1.75x10
5 kg) of emitted gas per workover
(EPA, 2011) at a rate of 1.15x10⁻²
workovers per year (Shires & Lev-On, 2012). Emissions from well workovers are assumed to be flared at a rate of 100 percent. In this analysis, well workovers result in the loss of 6.47x10
-4 MCF per MCF of natural gas produced. Exhibit 3-4, presented at the end of this chapter,
provides a summary of the GHG emissions generated from well workovers, and includes resource requirements, key assumptions and inputs, and GHG emissions by source and product.
Liquid Unloading
Emissions from liquid unloading come from process vents where natural gas is vented to the atmosphere and/or combusted in a flare stack. Liquid unloading refers to the process of removing water and other condensates from wellbores in order to improve the flow of natural gas in wells. While certain industry participants, including NETL, contend that shale gas wells do not require liquids unloading (NETL, 2014), this report assumes that the type of producing formation is not relevant. Conditions for liquids unloading are a function of the physics of flow up the wellbore and the fluids’ properties (Shires & Lev-On, 2012). During the process of liquid unloading, the well is opened to the atmosphere in order to remove accumulated water, resulting in vented and flared emissions.

Proprietary & Confidential Page 28
Liquid unloading represents another episodic emission event which is undertaken more frequently than completions and workovers at a rate of 19.1 episodes per year. This is an assumption derived from data from an industry survey conducted by API/ANGA (Shires & Lev-On, 2012). The emission rate of 2.3 MCF (43.6 kg) per episode was also derived from this survey. As an episodic process, total emissions are allocated over the lifetime production of the well. Additionally, emitted natural gas from liquids unloading is assumed to be flared at a rate of 51 percent. In this analysis, liquid unloading results in the loss of 2.68x10
-4 MCF per MCF of natural gas produced. Exhibit 3-4, presented at the end of this chapter,
provides a summary of the GHG emissions generated from liquid unloading and includes resource requirements, key assumptions and inputs, and GHG emissions by source and product.
Other Point Source Emissions
Point source emissions during the natural gas extraction segment include routine, vented emissions from wellhead and gathering equipment. Vented emissions from fugitive sources are discussed in the following section of this chapter. The distinction between ‘other point source’ emissions and ‘other fugitive emissions’ at the extraction segment is determined by the feasibility of routing vented emissions to a flare. Point source emissions at the extraction stage are assumed to be captured and flared at a rate of 51 percent, whereas fugitive emissions are vented directly to atmosphere. Emission rates were derived from the domestic annual gross onshore extraction data (EIA, 2009e) and EPA’s Inventory of Methane Emissions from Natural Gas Systems (inventory data), which is included in the background technical support document (EPA, 2011). To derive the relevant emission rates, the relevant points of EPA’s inventory data, which represents total domestic emissions for onshore gas production by process and equipment, is allocated over the total annual gross onshore extraction figures provided by the EIA. Importantly, EPA’s inventory data represent domestic emissions for 2006, and are correspondingly allocated over EIA withdrawal data from 2006. In this analysis, ‘other point source’ emissions result in the loss of 7.49 x10
-5 MCF per MCF of natural gas
produced. Since the only natural gas loss from this step occurs from vented and flared gas, this figure also represents the emission rate used to calculate the mass of emitted gas.
Fugitive Emissions from Pneumatic Devices and Other Sources
Fugitive emissions from pneumatic devices and other sources are comprised of fugitive emissions from extraction-related equipment that are vented straight to the atmosphere and not routed to flaring. Fugitive emissions from pneumatic devices required for natural gas extraction are generated from the opening and closing of valves and control systems. Most of the pneumatic devices used in the extraction segment are valve actuators and controllers that use natural gas pressure as the force for the valve movement (API, 2009). When a valve is opened or closed, natural gas is vented to the atmosphere. As it is currently not feasible to install vapor recovery equipment on valves and control devices at the extraction site, these emissions are not captured for flaring. Other fugitive emission sources included in this stage are generated from fugitive venting from equipment that is not accounted for elsewhere in the production segment. These are considered non-routine emissions from unplanned events. Emission rates for these non-routine emissions are categorized by specific equipment or activity in Exhibit 3-4 below. The derivation of the fugitive emission rates mirrors the procedure for ‘other point source’ emissions in which the national emissions from the relevant points in EPA’s inventory data are allocated over national production data from the EIA. The only differences between fugitive emissions and ‘other point source’ emissions at the extraction stage lie in the equipment being analyzed, and that 100 percent of fugitive emissions are vented directly to the atmosphere. Since these emissions are not routed to a flare, the GHG emission factors from the vented gas are determined by the raw natural gas composition assumed for this analysis and presented in Exhibit 3-2. Specific emission rates for each piece of relevant equipment are presented below in Exhibit 3-4.

Proprietary & Confidential Page 29
In this analysis, fugitive emissions during the extraction segment result in the loss of 3.65x10
-3 MCF per
MCF of natural gas produced. Since the only natural gas loss from this step occurs from vented gas, this figure also represents the emission rate used to calculate the mass of vented emissions. Exhibit 3-4 below provides a summary of GHG emissions from well completion, well handling, liquid unloading, ‘other point’ and fugitive sources and includes resource requirements, key assumptions and inputs, and GHG emissions by source and product.
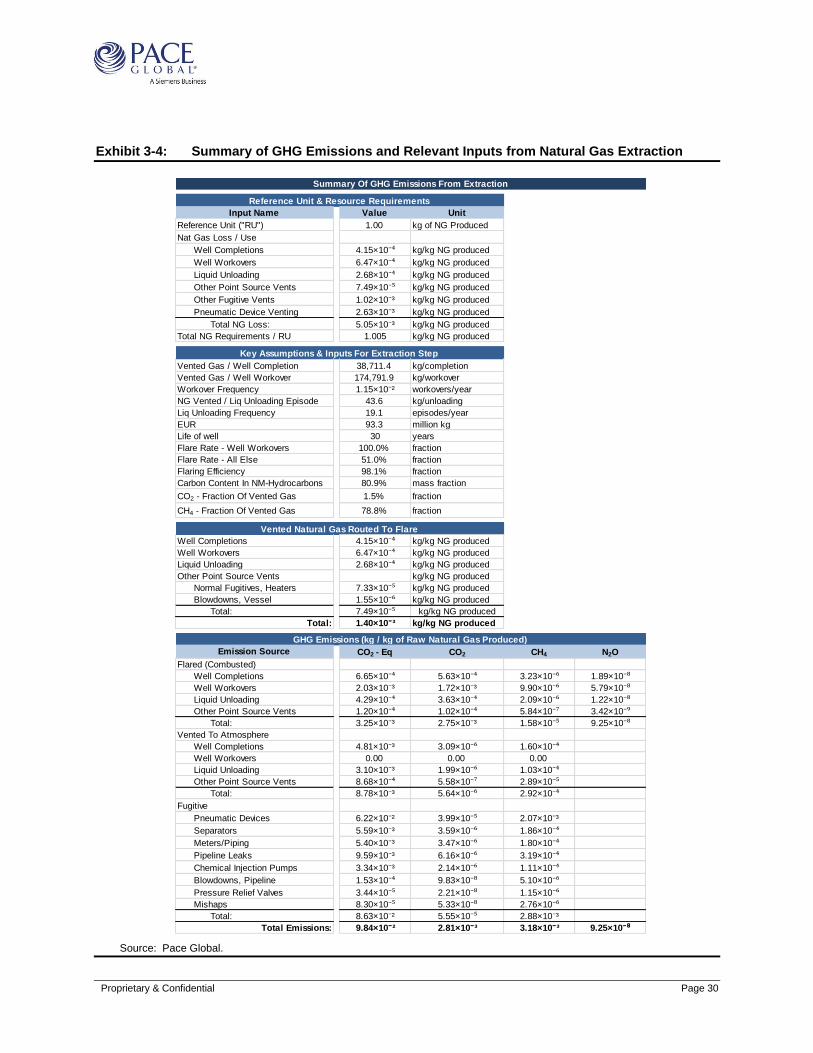
Proprietary & Confidential Page 30
Exhibit 3-4: Summary of GHG Emissions and Relevant Inputs from Natural Gas Extraction
Source: Pace Global.
Summary Of GHG Emissions From Extraction
Reference Unit & Resource Requirements
Input Name Value Unit
Reference Unit ("RU") 1.00 kg of NG Produced
Nat Gas Loss / Use
Well Completions 4.15×10⁻⁴ kg/kg NG produced
Well Workovers 6.47×10⁻⁴ kg/kg NG produced
Liquid Unloading 2.68×10⁻⁴ kg/kg NG produced
Other Point Source Vents 7.49×10⁻⁵ kg/kg NG produced
Other Fugitive Vents 1.02×10⁻³ kg/kg NG produced
Pneumatic Device Venting 2.63×10⁻³ kg/kg NG produced
Total NG Loss: 5.05×10⁻³ kg/kg NG produced
Total NG Requirements / RU 1.005 kg/kg NG produced
Key Assumptions & Inputs For Extraction Step
Vented Gas / Well Completion 38,711.4 kg/completion
Vented Gas / Well Workover 174,791.9 kg/workover
Workover Frequency 1.15×10⁻² workovers/year
NG Vented / Liq Unloading Episode 43.6 kg/unloading
Liq Unloading Frequency 19.1 episodes/year
EUR 93.3 million kg
Life of well 30 years
Flare Rate - Well Workovers 100.0% fraction
Flare Rate - All Else 51.0% fraction
Flaring Efficiency 98.1% fraction
Carbon Content In NM-Hydrocarbons 80.9% mass fraction
CO2 - Fraction Of Vented Gas 1.5% fraction
CH4 - Fraction Of Vented Gas 78.8% fraction
Vented Natural Gas Routed To Flare
Well Completions 4.15×10⁻⁴ kg/kg NG produced
Well Workovers 6.47×10⁻⁴ kg/kg NG produced
Liquid Unloading 2.68×10⁻⁴ kg/kg NG produced
Other Point Source Vents kg/kg NG produced
Normal Fugitives, Heaters 7.33×10⁻⁵ kg/kg NG produced
Blowdowns, Vessel 1.55×10⁻⁶ kg/kg NG produced
Total: 7.49×10⁻⁵ kg/kg NG produced
Total: 1.40×10⁻³ kg/kg NG produced
GHG Emissions (kg / kg of Raw Natural Gas Produced)
Emission Source CO2 - Eq CO2 CH4 N2O
Flared (Combusted)
Well Completions 6.65×10⁻⁴ 5.63×10⁻⁴ 3.23×10⁻⁶ 1.89×10⁻⁸
Well Workovers 2.03×10⁻³ 1.72×10⁻³ 9.90×10⁻⁶ 5.79×10⁻⁸
Liquid Unloading 4.29×10⁻⁴ 3.63×10⁻⁴ 2.09×10⁻⁶ 1.22×10⁻⁸
Other Point Source Vents 1.20×10⁻⁴ 1.02×10⁻⁴ 5.84×10⁻⁷ 3.42×10⁻⁹
Total: 3.25×10⁻³ 2.75×10⁻³ 1.58×10⁻⁵ 9.25×10⁻⁸
Vented To Atmosphere
Well Completions 4.81×10⁻³ 3.09×10⁻⁶ 1.60×10⁻⁴
Well Workovers 0.00 0.00 0.00
Liquid Unloading 3.10×10⁻³ 1.99×10⁻⁶ 1.03×10⁻⁴
Other Point Source Vents 8.68×10⁻⁴ 5.58×10⁻⁷ 2.89×10⁻⁵
Total: 8.78×10⁻³ 5.64×10⁻⁶ 2.92×10⁻⁴
Fugitive
Pneumatic Devices 6.22×10⁻² 3.99×10⁻⁵ 2.07×10⁻³
Separators 5.59×10⁻³ 3.59×10⁻⁶ 1.86×10⁻⁴
Meters/Piping 5.40×10⁻³ 3.47×10⁻⁶ 1.80×10⁻⁴
Pipeline Leaks 9.59×10⁻³ 6.16×10⁻⁶ 3.19×10⁻⁴
Chemical Injection Pumps 3.34×10⁻³ 2.14×10⁻⁶ 1.11×10⁻⁴
Blowdowns, Pipeline 1.53×10⁻⁴ 9.83×10⁻⁸ 5.10×10⁻⁶
Pressure Relief Valves 3.44×10⁻⁵ 2.21×10⁻⁸ 1.15×10⁻⁶
Mishaps 8.30×10⁻⁵ 5.33×10⁻⁸ 2.76×10⁻⁶
Total: 8.63×10⁻² 5.55×10⁻⁵ 2.88×10⁻³
Total Emissions: 9.84×10⁻² 2.81×10⁻³ 3.18×10⁻³ 9.25×10⁻⁸

Proprietary & Confidential Page 31
CHAPTER 4 – GHG EMISSIONS FROM NATURAL GAS PROCESSING
GHG emissions from natural gas processing are modeled in this analysis by cataloging key gas processing procedures and emission rates of vented and flared gas and vented methane from processing equipment. The boundaries for the natural gas processing segment begin when the raw natural gas enters the gas processing plant gate and ends when the processed gas is sufficiently compressed to enter the pipeline transportation gate. In gas processing, high value liquid products are recovered from the gas stream and treated to meet pipeline specifications (API, 2009). Specifically, GHG emissions from gas processing result from:
Fugitive emissions from pneumatic devices and other essential processing equipment;
Point source emissions that are routed to a flare for combustion;
Combustion emissions from the use of a glycol re-boiler in the dehydration step; and
Gas-fired reciprocating compressors at the end of the gas processing segment.
Over the entire life cycle analysis, natural gas processing produces 15.2 percent (high GHG case) to 36.9 percent (low GHG case) of total natural gas loss or use. The overwhelming majority, 96.7 percent, of gas loss or use from processing is generated from reciprocating compressors at the end of the processing plant that are necessary to increase the gas pressure for pipeline transportation. The assumed composition of the natural gas at this stage is a variable that affects the amount of GHG emissions vented into the atmosphere or combusted in a flare stack. This report assumes a natural gas composition for post-processed (i.e., pipeline quality) quality natural gas presented below in Exhibit 4-1. Exhibit 4-1: Assumed Natural Gas Composition Post-Processing
Source: Pace Global.
The produced gas in this analysis is assumed to contain negligible sulfur species (i.e., four parts per million hydrogen sulfide and no mercaptans). According to published research from EPA, natural gas is considered ‘sour’ if hydrogen sulfide is present in amounts greater than 5.7 mg per normal cubic meter (EPA, 1995), which can be translated to 4.0 parts per million in natural gas (Galvanic Applied Sciences,
Component
Composition
Mole Percent
Nitrogen 1.00%
Carbon Dioxide 2.00%
Hydrogen Sulfide 0.00%
Methane 88.00%
Ethane 6.00%
Propane 2.00%
Isobutane 0.50%
n-Butane 0.50%
Isopentane 0.00%
n-Pentane 0.00%
n-Hexane 0.00%
Heptanes-Plus 0.00%
Total: 100.00%
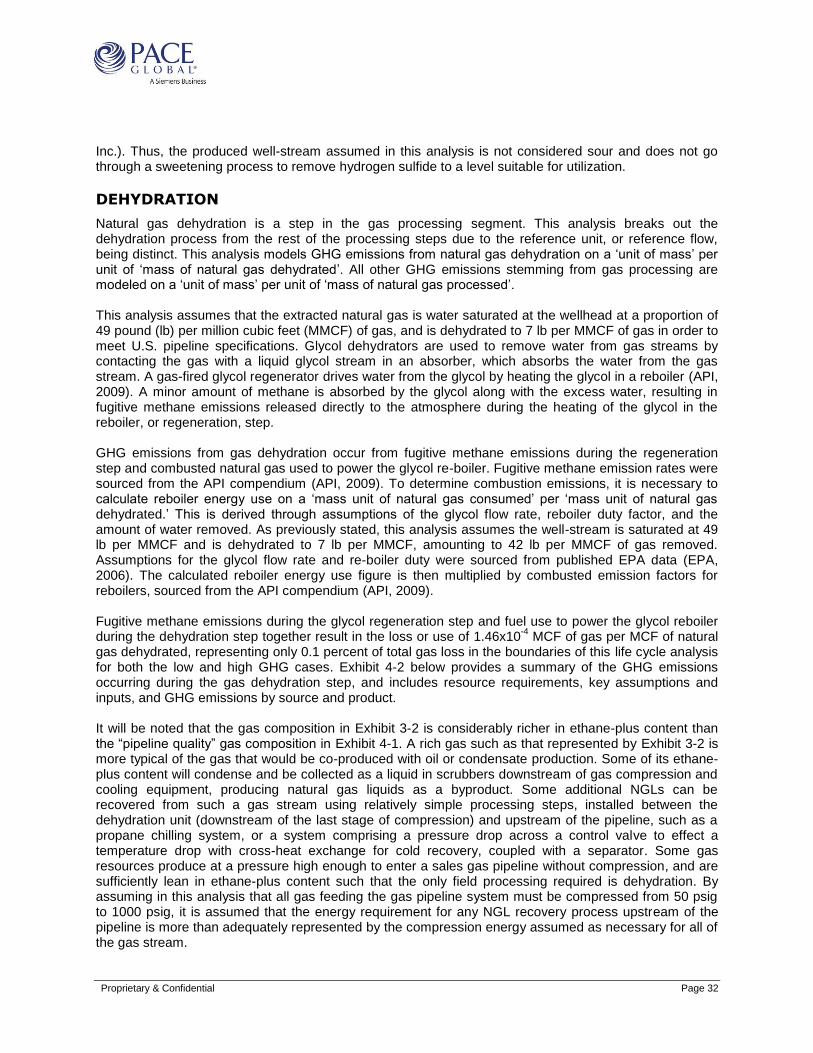
Proprietary & Confidential Page 32
Inc.). Thus, the produced well-stream assumed in this analysis is not considered sour and does not go through a sweetening process to remove hydrogen sulfide to a level suitable for utilization.
DEHYDRATION
Natural gas dehydration is a step in the gas processing segment. This analysis breaks out the dehydration process from the rest of the processing steps due to the reference unit, or reference flow, being distinct. This analysis models GHG emissions from natural gas dehydration on a ‘unit of mass’ per unit of ‘mass of natural gas dehydrated’. All other GHG emissions stemming from gas processing are modeled on a ‘unit of mass’ per unit of ‘mass of natural gas processed’. This analysis assumes that the extracted natural gas is water saturated at the wellhead at a proportion of 49 pound (lb) per million cubic feet (MMCF) of gas, and is dehydrated to 7 lb per MMCF of gas in order to meet U.S. pipeline specifications. Glycol dehydrators are used to remove water from gas streams by contacting the gas with a liquid glycol stream in an absorber, which absorbs the water from the gas stream. A gas-fired glycol regenerator drives water from the glycol by heating the glycol in a reboiler (API, 2009). A minor amount of methane is absorbed by the glycol along with the excess water, resulting in fugitive methane emissions released directly to the atmosphere during the heating of the glycol in the reboiler, or regeneration, step. GHG emissions from gas dehydration occur from fugitive methane emissions during the regeneration step and combusted natural gas used to power the glycol re-boiler. Fugitive methane emission rates were sourced from the API compendium (API, 2009). To determine combustion emissions, it is necessary to calculate reboiler energy use on a ‘mass unit of natural gas consumed’ per ‘mass unit of natural gas dehydrated.’ This is derived through assumptions of the glycol flow rate, reboiler duty factor, and the amount of water removed. As previously stated, this analysis assumes the well-stream is saturated at 49 lb per MMCF and is dehydrated to 7 lb per MMCF, amounting to 42 lb per MMCF of gas removed. Assumptions for the glycol flow rate and re-boiler duty were sourced from published EPA data (EPA, 2006). The calculated reboiler energy use figure is then multiplied by combusted emission factors for reboilers, sourced from the API compendium (API, 2009). Fugitive methane emissions during the glycol regeneration step and fuel use to power the glycol reboiler during the dehydration step together result in the loss or use of 1.46x10
-4 MCF of gas per MCF of natural
gas dehydrated, representing only 0.1 percent of total gas loss in the boundaries of this life cycle analysis for both the low and high GHG cases. Exhibit 4-2 below provides a summary of the GHG emissions occurring during the gas dehydration step, and includes resource requirements, key assumptions and inputs, and GHG emissions by source and product. It will be noted that the gas composition in Exhibit 3-2 is considerably richer in ethane-plus content than the “pipeline quality” gas composition in Exhibit 4-1. A rich gas such as that represented by Exhibit 3-2 is more typical of the gas that would be co-produced with oil or condensate production. Some of its ethane-plus content will condense and be collected as a liquid in scrubbers downstream of gas compression and cooling equipment, producing natural gas liquids as a byproduct. Some additional NGLs can be recovered from such a gas stream using relatively simple processing steps, installed between the dehydration unit (downstream of the last stage of compression) and upstream of the pipeline, such as a propane chilling system, or a system comprising a pressure drop across a control valve to effect a temperature drop with cross-heat exchange for cold recovery, coupled with a separator. Some gas resources produce at a pressure high enough to enter a sales gas pipeline without compression, and are sufficiently lean in ethane-plus content such that the only field processing required is dehydration. By assuming in this analysis that all gas feeding the gas pipeline system must be compressed from 50 psig to 1000 psig, it is assumed that the energy requirement for any NGL recovery process upstream of the pipeline is more than adequately represented by the compression energy assumed as necessary for all of the gas stream.
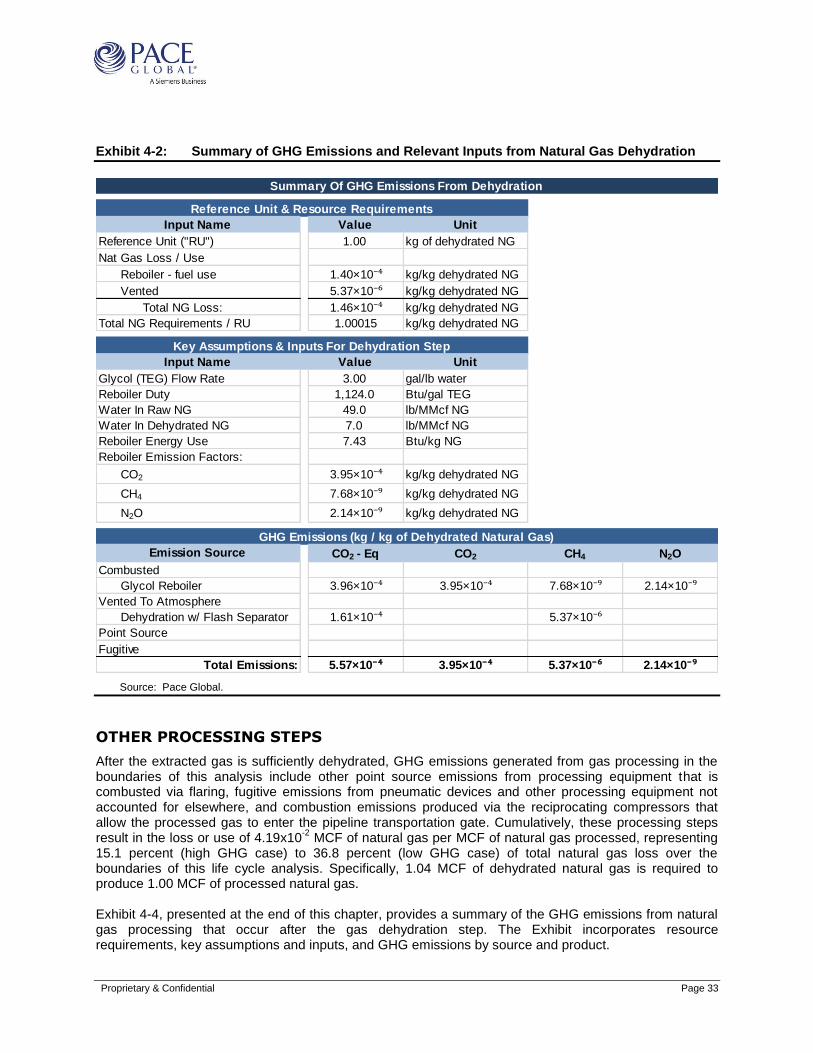
Proprietary & Confidential Page 33
Exhibit 4-2: Summary of GHG Emissions and Relevant Inputs from Natural Gas Dehydration
Source: Pace Global.
OTHER PROCESSING STEPS
After the extracted gas is sufficiently dehydrated, GHG emissions generated from gas processing in the boundaries of this analysis include other point source emissions from processing equipment that is combusted via flaring, fugitive emissions from pneumatic devices and other processing equipment not accounted for elsewhere, and combustion emissions produced via the reciprocating compressors that allow the processed gas to enter the pipeline transportation gate. Cumulatively, these processing steps result in the loss or use of 4.19x10
-2 MCF of natural gas per MCF of natural gas processed, representing
15.1 percent (high GHG case) to 36.8 percent (low GHG case) of total natural gas loss over the boundaries of this life cycle analysis. Specifically, 1.04 MCF of dehydrated natural gas is required to produce 1.00 MCF of processed natural gas. Exhibit 4-4, presented at the end of this chapter, provides a summary of the GHG emissions from natural gas processing that occur after the gas dehydration step. The Exhibit incorporates resource requirements, key assumptions and inputs, and GHG emissions by source and product.
Summary Of GHG Emissions From Dehydration
Reference Unit & Resource Requirements
Input Name Value Unit
Reference Unit ("RU") 1.00 kg of dehydrated NG
Nat Gas Loss / Use
Reboiler - fuel use 1.40×10⁻⁴ kg/kg dehydrated NG
Vented 5.37×10⁻⁶ kg/kg dehydrated NG
Total NG Loss: 1.46×10⁻⁴ kg/kg dehydrated NG
Total NG Requirements / RU 1.00015 kg/kg dehydrated NG
Key Assumptions & Inputs For Dehydration Step
Input Name Value Unit
Glycol (TEG) Flow Rate 3.00 gal/lb water
Reboiler Duty 1,124.0 Btu/gal TEG
Water In Raw NG 49.0 lb/MMcf NG
Water In Dehydrated NG 7.0 lb/MMcf NG
Reboiler Energy Use 7.43 Btu/kg NG
Reboiler Emission Factors:
CO2 3.95×10⁻⁴ kg/kg dehydrated NG
CH4 7.68×10⁻⁹ kg/kg dehydrated NG
N2O 2.14×10⁻⁹ kg/kg dehydrated NG
GHG Emissions (kg / kg of Dehydrated Natural Gas)
Emission Source CO2 - Eq CO2 CH4 N2O
Combusted
Glycol Reboiler 3.96×10⁻⁴ 3.95×10⁻⁴ 7.68×10⁻⁹ 2.14×10⁻⁹
Vented To Atmosphere
Dehydration w/ Flash Separator 1.61×10⁻⁴ 5.37×10⁻⁶
Point Source
Fugitive
Total Emissions: 5.57×10⁻⁴ 3.95×10⁻⁴ 5.37×10⁻⁶ 2.14×10⁻⁹
Proprietary & Confidential Page 34
Other Point Source Emissions and Flaring During Natural Gas Processing
Point source emissions during the natural gas processing segment include:
Routine vented emissions from condensate tanks;
Blowdowns and venting; and
Unaccounted emissions vented from pressure release valves from the processing plant.
Using guidance from NETL, other point source emissions at the processing stage are assumed to be flared at a rate of 100 percent (NETL, 2014). Fugitive emission sources from the gas processing segment, which vent directly to the atmosphere, are discussed in the next section of this chapter. To determine the GHG emissions from flaring during the processing segment, it is necessary to calculate the mass of gas that is routed to the flare for combustion. Deriving these emission rates is relatively straightforward, and is calculated by using GHG emissions inventory data from the EPA’s background technical support document for each relevant piece of equipment (EPA, 2011) and then dividing it by the total amount of gas processed as reported by the EIA (EIA, 2009c). The derived emission rates from each point source routed to flare are presented in Exhibit 4-4 at the end of this chapter. To calculate GHG emissions from point sources routed to a flare, it is necessary to derive appropriate combustion emission factors for this stage of the analysis. The same material balance approach, discussed in detail in the ‘Venting and Flaring During Natural Gas Extraction and Gathering’ section in the previous chapter, is utilized to derive GHG emission factors for flare combustion at the natural gas processing stage. Importantly, the natural gas composition at the extraction segment is different than at the processing stage (Exhibit 3-2 and Exhibit 4-1, respectively), resulting in different emission factors. Additionally, as previously stated, the flare rate for emissions from ‘point sources’ is assumed to be 100 percent at the processing stage, versus 51 percent at the extraction segment. The combustion efficiency of the flare is assumed to be 98.1 percent during both extraction and processing. Calculated emission factors for flared gas at the gas processing plant are presented in Exhibit 4-3 below. Exhibit 4-3: Summary of Emission Factors for Flared Gas at the Processing Plant
Source: Pace Global based on referenced sources.
Other point source emissions from gas processing result in the loss of 3.82x10
-4 MCF of gas per MCF of
gas processed. Since the only natural gas loss from this step occurs from emitted gas routed to a flare, this figure also represents the emission rate used to calculate the mass of flared emissions, which is the product of the emission rate and emission factors presented in Exhibit 4-3 above. Exhibit 4-4, presented at the end of this chapter, provides a summary of the GHG emissions occurring from other point source emissions and includes resource requirements, key assumptions and inputs, and GHG emissions by source and product.
Component
Emission
Factor Unit
CH4 1.71×10⁻² kg/kg NG flared
CO2 2.65 kg/kg NG flared
N2O 5.03×10⁻⁵ kg/kg NG flared

Proprietary & Confidential Page 35
Fugitive Emissions from Pneumatic Devices and Other Sources
Fugitive emissions from pneumatic devices and other sources are comprised of vented emissions from processing related equipment that are released directly to the atmosphere. Similar to the extraction stage, fugitive emissions from pneumatic devices required for natural gas processing are generated from the opening and closing of valves and other process control systems. NETL states that it is not feasible to install vapor recovery equipment on the valves and other control devices at a gas processing plant, the lack of which results in fugitive gas emissions (NETL, 2014). Other fugitive emission sources at the gas processing plant include sources that are not captured elsewhere in this stage of the analysis. Specifically, the sources include:
Kimray glycol pumps for the dehydrator;
Venting required to maintain the compressors; and
Venting associated with compressor trips and restarts.
The derivation of the fugitive emission factors from pneumatic devices and other fugitive sources from gas processing is the same as the methodology used for deriving fugitive emission factors from the gas extraction segment. The national emissions from the relevant sources reported in EPA’s inventory data (EPA, 2011) were allocated over the amount of total annual processed gas, which is reported by the EIA. Since the emissions are not routed to a flare, GHG emissions are determined by the processed natural gas composition that was assumed for this analysis and presented earlier in Exhibit 4-1. Vented emission rates and the resulting GHG emissions from each source of fugitive emissions at the processing stage are presented at the end of this chapter in Exhibit 4-4. In this analysis, fugitive emissions during the processing segment result in the loss of 8.62x10
-4 MCF per MCF of natural gas processed (6.57x10
-6
MCF per MCF of gas processed for pneumatic devices and 8.56x10⁻⁴
MCF per MCF of gas processed from other fugitive sources). This represents only 2.1 percent of total natural gas loss or use during the gas processing stage.
Natural Gas Compression at the Processing Plant
Prior to finished process gas entering the pipeline transportation gate to the liquefaction plant, processed gas must be compressed to increase pressure for pipeline transport. GHG emissions from this stage are a result of combusted natural gas used to fuel reciprocating compressors. Vented emissions occur as well, but these emissions are included in the fugitive emissions category discussed in the preceding section. Fugitive GHG emissions originating from compressors are presented along with the other sources of fugitive emissions in Exhibit 4-4 below. This analysis assumes reciprocating compressors are utilized at the processing plant. Reciprocating compressors generate GHG emissions via the combustion of natural gas to power their operation. The first step in determining GHG emissions from compressors at the processing stage entails estimating the relevant compressor heat rate, i.e. the required power output for a compressor per unit of gas throughput. The amount of power required is contingent upon the compression ratio, which is the ratio of outlet to inlet pressures (NETL, 2014). This analysis assumes an inlet pressure of 50 psig and an outlet pressure of 1,000 psig. Utilizing a compressor horsepower selection chart published by GE Oil and Gas (GE Oil and Gas, 2005), which shows the relationship among power, fuel throughput, and the compression ratio, compressor brake horsepower was determined to be 196 hp per MMCF/D of gas throughout. This figure was then converted to 1.84x10
-4 MWh per kg of gas throughput. The estimate of compression power
requirements presented above should be considered conservative due to some facilities being designed to utilize several stages of pressure letdown in the condensate or oil recovery process; such facilities feed considerable portions of gas into the compression system at a higher pressure, requiring less total compression power for the same amount of gas.
Proprietary & Confidential Page 36
The next step was to determine the natural gas fuel requirements for relevant compressor types. The relevant compressor type for this analysis is assumed to use four-stroke, lean-burn engines that are typical of modern reciprocating engine installations. Using data for compressor throughput requirements published by the Houston Advanced Research Center (Houston Advanced Research Center, 2006), fuel gas requirements for compressors at this stage were calculated to be 11.6 MCF (220.9 kg) of natural gas per MWh. Natural gas fuel used by compressors per unit of gas processed was calculated by taking the product of the derived heat rate and throughput requirements. GHG emissions factors were sourced from published EPA emission factors for natural gas-fired reciprocating engines (EPA, 1995). GHG emissions were calculated by taking the product of the emission factors and the calculated gas fuel requirements. In this analysis, fuel use from compressors during the processing stage results in the loss of 4.07x10
-2
MCF of natural gas per MCF of natural gas processed, representing 96.7 percent of the total natural gas loss or use from the processing stage. A summary of the GHG emissions occurring from reciprocating compressors during the processing stage is provided in Exhibit 4-4 below, and includes resource requirements, key assumptions and inputs, and GHG emissions by source and product.
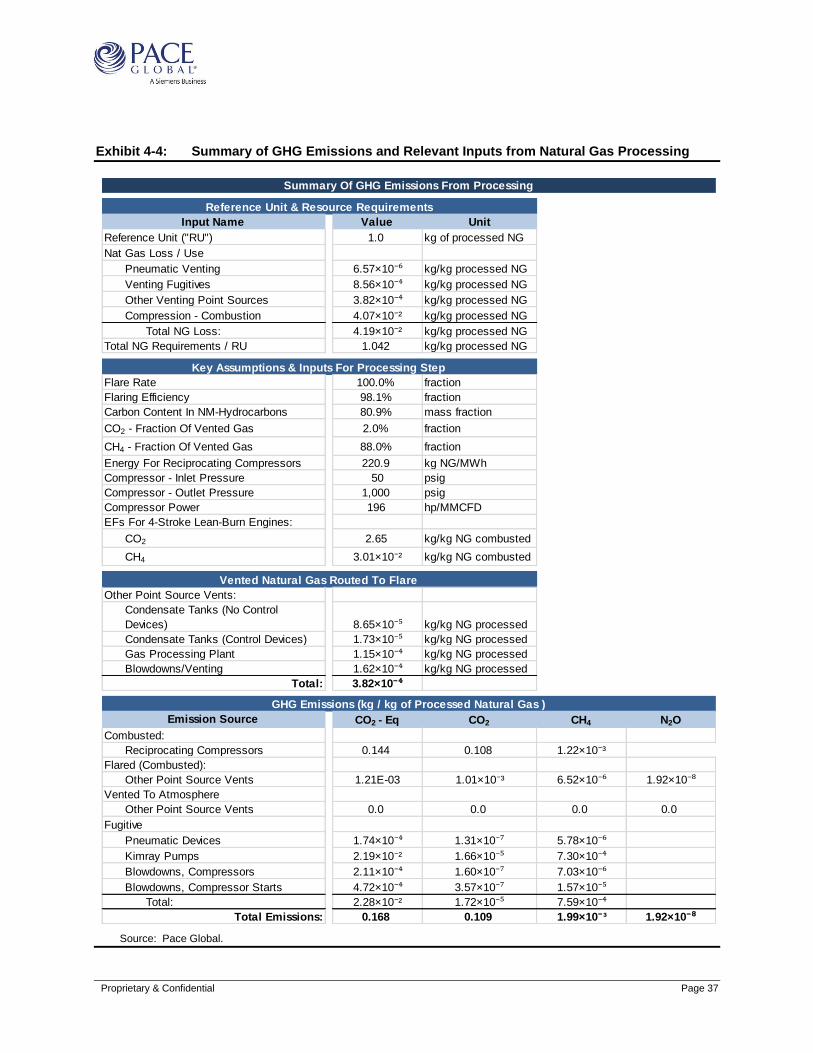
Proprietary & Confidential Page 37
Exhibit 4-4: Summary of GHG Emissions and Relevant Inputs from Natural Gas Processing
Source: Pace Global.
Summary Of GHG Emissions From Processing
Reference Unit & Resource Requirements
Input Name Value Unit
Reference Unit ("RU") 1.0 kg of processed NG
Nat Gas Loss / Use
Pneumatic Venting 6.57×10⁻⁶ kg/kg processed NG
Venting Fugitives 8.56×10⁻⁴ kg/kg processed NG
Other Venting Point Sources 3.82×10⁻⁴ kg/kg processed NG
Compression - Combustion 4.07×10⁻² kg/kg processed NG
Total NG Loss: 4.19×10⁻² kg/kg processed NG
Total NG Requirements / RU 1.042 kg/kg processed NG
Key Assumptions & Inputs For Processing Step
Flare Rate 100.0% fraction
Flaring Efficiency 98.1% fraction
Carbon Content In NM-Hydrocarbons 80.9% mass fraction
CO2 - Fraction Of Vented Gas 2.0% fraction
CH4 - Fraction Of Vented Gas 88.0% fraction
Energy For Reciprocating Compressors 220.9 kg NG/MWh
Compressor - Inlet Pressure 50 psig
Compressor - Outlet Pressure 1,000 psig
Compressor Power 196 hp/MMCFD
EFs For 4-Stroke Lean-Burn Engines:
CO2 2.65 kg/kg NG combusted
CH4 3.01×10⁻² kg/kg NG combusted
Vented Natural Gas Routed To Flare
Other Point Source Vents:
Condensate Tanks (No Control
Devices) 8.65×10⁻⁵ kg/kg NG processed
Condensate Tanks (Control Devices) 1.73×10⁻⁵ kg/kg NG processed
Gas Processing Plant 1.15×10⁻⁴ kg/kg NG processed
Blowdowns/Venting 1.62×10⁻⁴ kg/kg NG processed
Total: 3.82×10⁻⁴
GHG Emissions (kg / kg of Processed Natural Gas )
Emission Source CO2 - Eq CO2 CH4 N2O
Combusted:
Reciprocating Compressors 0.144 0.108 1.22×10⁻³
Flared (Combusted):
Other Point Source Vents 1.21E-03 1.01×10⁻³ 6.52×10⁻⁶ 1.92×10⁻⁸
Vented To Atmosphere
Other Point Source Vents 0.0 0.0 0.0 0.0
Fugitive
Pneumatic Devices 1.74×10⁻⁴ 1.31×10⁻⁷ 5.78×10⁻⁶
Kimray Pumps 2.19×10⁻² 1.66×10⁻⁵ 7.30×10⁻⁴
Blowdowns, Compressors 2.11×10⁻⁴ 1.60×10⁻⁷ 7.03×10⁻⁶
Blowdowns, Compressor Starts 4.72×10⁻⁴ 3.57×10⁻⁷ 1.57×10⁻⁵
Total: 2.28×10⁻² 1.72×10⁻⁵ 7.59×10⁻⁴
Total Emissions: 0.168 0.109 1.99×10⁻³ 1.92×10⁻⁸

Proprietary & Confidential Page 38
CHAPTER 5 – GHG EMISSIONS FROM NATURAL GAS PIPELINE
TRANSPORT
This portion of the analysis models GHG emissions from two separate stages of pipeline transport. The first stage begins when natural gas exits the processing plant and enters a natural gas pipeline, and ends when the gas arrives at the liquefaction facility gate. The second stage begins once the exported LNG is regasified at the LNG receiving terminal and enters a natural gas pipeline, and ends when the gas arrives at the power generation plant gate (see Exhibit 2-2). Both of these transport stages share the same analytical methodology and assumptions, except for the distance the natural gas travels from the gas processing plant to the liquefaction gate, compared to the distance the regasified product travels from the LNG receiving terminal to the power generation plant gate. Similar assumptions were used for both stages as the data required for this stage were not readily available in the various foreign countries to which U.S. LNG is likely to be exported. Further, pipeline transportation accounts for a relatively small portion of overall GHG emissions over this life cycle analysis, and minor adjustments to emission rates relevant to the transportation segment would result in immaterial differences. This analysis includes GHG emissions from the operation of the pipeline and assumes that the pipeline is already in commercial operation, thus excluding any emissions related to the construction of the pipeline. Emissions from pipeline transport occur from pipeline fugitive emissions and the use of compressors at compressor stations. Fugitive venting from pipeline equipment releases methane emissions to the atmosphere. The fugitive emission rate for this analysis is based on dividing total methane emissions from pipeline transportation by the total amount of natural gas transported on a mass-distance basis, which allows for the calculation of fugitive methane emissions based on the distance the natural gas has to travel. Data for the amount of natural gas transported via pipeline were sourced from a published report by the Bureau of Transportation Statistics (BTS) (Dennis, 2005) and data for the total amount of methane emissions from pipeline transport were sourced from a published report from the EPA (EPA, 2010a). The total amount of natural gas transported in the U.S. for the year 2003 was reported to be 2.53x10
11 ton-
miles per year (Dennis, 2005), which corresponds to 3.69x10¹⁴
kg-km per year. This represents data for 2003 and is the most recent published figure. Total methane emissions from U.S. pipeline operations were calculated to be 1.99x10
9 kg/year
9 (EPA, 2010a). From these figures, Pace Global calculated a
methane emission rate of 5.37x10⁻⁶
kg/kg-km of transported gas. Fugitive emissions account for the majority of GHG emissions occurring from the pipeline transport of natural gas. Other than fugitive emissions, emissions from compressors comprise the remainder of GHG emissions from natural gas transport. Natural gas needs to be constantly repressurized at intervals of 40 to 100 miles (NaturalGas.org, 2013) while being transported through a pipeline. The first step in estimating GHG emissions from compressors is determining the natural gas fuel use factor, which is expressed on a mass-unit-of-fuel-use per mass-distance-unit-of-gas-transported basis. This calculation requires analyzing total pipeline compressor fuel use. Using published data from the Federal Energy Regulatory Commission’s (FERC) Form 2 and 2A, Pace Global determined that 0.96 percent of transported gas is used as compressor fuel by dividing total compressor station fuel use by the total amount of delivered gas on 28 major interstate pipelines, which collectively represented 81 percent of total natural gas transmission in 2009. This factor was applied to total pipeline deliveries reported in 2009 by the EIA (EIA, 2011b) on a mass basis to calculate total US compressor fuel use. Data for total U.S. pipeline transport on a mass-distance basis from the BTS
9 Methane emissions data was reported for the years 2000 and 2005. An average was used to get to a
representative emission rate for 2003, which corresponds to the year of the latest available data for gas transported on a mass-distance basis.
Proprietary & Confidential Page 39
(Dennis, 2005) was used to derive the denominator in the fuel use factor calculation. The analysis resulted in a fuel use factor of 1.02x10
-5 MCF of natural gas use per MCF-km of natural gas transported.
Reciprocating compressors, centrifugal compressors, and motor-driven (i.e., powered via electricity) compressors represent the three basic types of compressors used in the pipeline transportation of gas. All three types were considered in this analysis in order to derive a representative emission factor for a generic U.S. pipeline. Reciprocating compressors are powered by natural gas-reciprocating engines, while centrifugal compressors are powered by stationary gas turbines. Reciprocating and centrifugal compressors generate GHG emissions through the combustion of natural gas, while motor-driven compressors generate indirect GHG emissions via the electricity procured from the grid. The Interstate Natural Gas Association (INGAA) maintains a database of pipeline compressor units that includes the vast majority of units in interstate gas transmission service as well as some units in intrastate service (Hedman, 2008). This data was used to determine the relative frequencies of reciprocating versus centrifugal compressors. The INGAA report references a small but growing number of motor-driven compressor stations, but does not provide a figure to compare with the other two types. The relative frequency of motor-driven compressors was assumed to be three percent, based on written communication from Kinder Morgan and NETL (NETL, 2014). Using this data, this analysis calculates that reciprocating, centrifugal, and motor-driven compressors account for 82 percent, 15 percent, and 3 percent of the total U.S. compressor population. The calculated natural gas fuel use factor is then used to determine the total natural fuel use by reciprocating and centrifugal compressors. This is determined by calculating the product of the fuel use factor, the distance the natural gas is being transported, and the fraction of each compressor station type in the overall population. GHG emission factors were sourced from published EPA data (EPA, 1995) for natural gas-fired reciprocating engines (i.e.; reciprocating compressors) and stationary gas turbines (i.e.; centrifugal compressors). To estimate emissions from motor-driven compressors, Pace Global used published data from the EIA to calculate electricity consumption on a unit of power per unit of mass of gas transported. The EIA report provided the mass flow rate of natural gas that is compressed by motor-driven compressors as well as the average installed horsepower (EIA, 2007a). Data published by INGAA provided assumptions for the efficiency and operating capacity of electric motors that are used to power pipeline compressors (Hedman, 2008). This data, along with the previously calculated representative fraction of total compressor energy supplied by motor-driven compressors, was used to calculate the electricity requirement for motor-driven compressors on a unit of power per unit of mass of gas transported. Since electricity is procured from the grid, it is considered to emit emissions indirectly. GHG emission factors for electricity use were sourced from published data from the EPA. Annual total output GHG emission factors are reported on a unit of mass of GHG per unit of power consumed (EPA, 2010b). In this analysis, fugitive pipeline emissions and fuel use for compression systems during transportation to the liquefaction plant gate result in the loss of 4.87x10
-3 MCF per MCF of natural gas transported,
representing 1.7 percent (high GHG case) to 4.3 percent (low GHG case) of the total natural gas loss or use from extraction to power generation. For pipeline transportation to the power generation plant gate, total natural gas loss is calculated to be 1.52x10
-2 MCF per MCF of natural gas transported, representing
4.2 percent (high GHG case) to 12.5 (low GHG case) percent of the total natural gas loss or use from extraction to power generation. The differences between each transportation stage are a result of different assumptions for the distance the natural gas has to be transported. The processing plant to liquefaction plant gate is assumed to be 320 km, and the regasification plant to power generation plant gate is assumed to be 1,000 km. The assumed 1000 km consuming country pipeline length is conservative; in some LNG importing countries, a majority of the gas-fired power plants and other end users are within relatively close proximity to its LNG receiving terminal(s). In others, the receiving terminal(s) feed into the national gas pipeline grid. A summary of the GHG emissions generated from pipeline transportation is provided in Exhibit 5-1 (first stage) and Exhibit 5-2 (second stage) below and includes resource requirements, key assumptions and inputs, and GHG emissions by source and product.
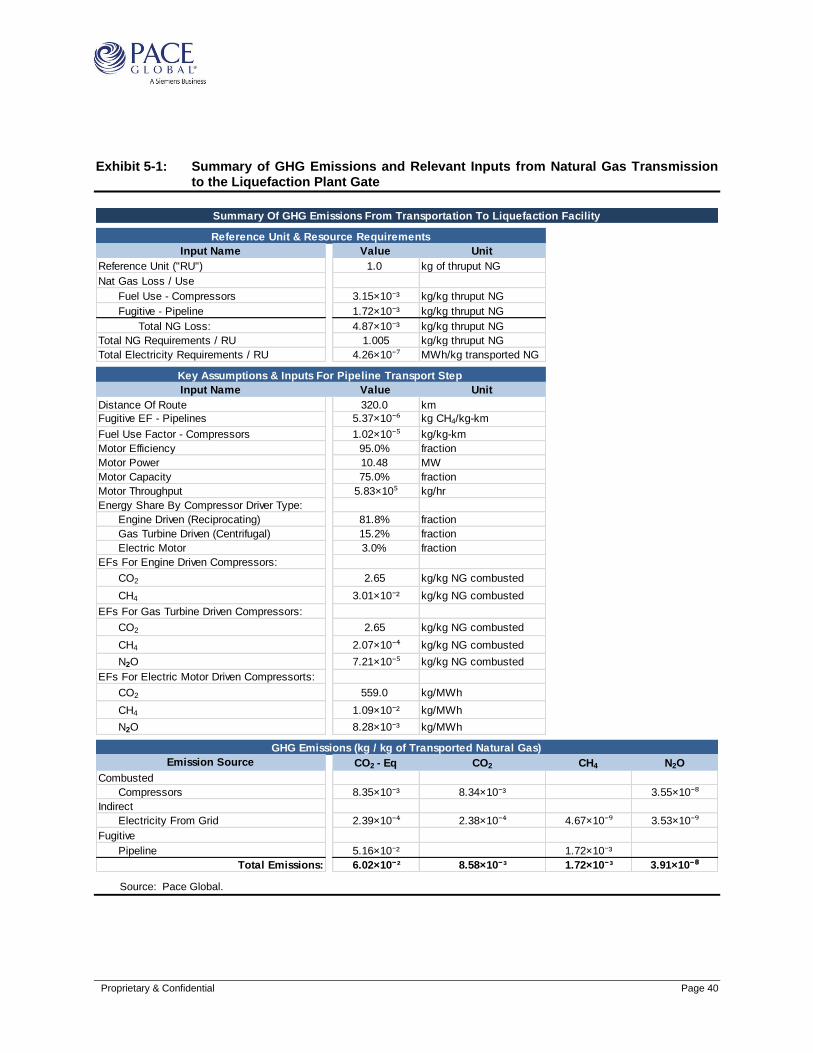
Proprietary & Confidential Page 40
Exhibit 5-1: Summary of GHG Emissions and Relevant Inputs from Natural Gas Transmission
to the Liquefaction Plant Gate
Source: Pace Global.
Summary Of GHG Emissions From Transportation To Liquefaction Facility
Reference Unit & Resource Requirements
Input Name Value Unit
Reference Unit ("RU") 1.0 kg of thruput NG
Nat Gas Loss / Use
Fuel Use - Compressors 3.15×10⁻³ kg/kg thruput NG
Fugitive - Pipeline 1.72×10⁻³ kg/kg thruput NG
Total NG Loss: 4.87×10⁻³ kg/kg thruput NG
Total NG Requirements / RU 1.005 kg/kg thruput NG
Total Electricity Requirements / RU 4.26×10⁻⁷ MWh/kg transported NG
Key Assumptions & Inputs For Pipeline Transport Step
Input Name Value Unit
Distance Of Route 320.0 km
Fugitive EF - Pipelines 5.37×10⁻⁶ kg CH4/kg-km
Fuel Use Factor - Compressors 1.02×10⁻⁵ kg/kg-km
Motor Efficiency 95.0% fraction
Motor Power 10.48 MW
Motor Capacity 75.0% fraction
Motor Throughput 5.83×10⁵ kg/hr
Energy Share By Compressor Driver Type:
Engine Driven (Reciprocating) 81.8% fraction
Gas Turbine Driven (Centrifugal) 15.2% fraction
Electric Motor 3.0% fraction
EFs For Engine Driven Compressors:
CO2 2.65 kg/kg NG combusted
CH4 3.01×10⁻² kg/kg NG combusted
EFs For Gas Turbine Driven Compressors:
CO2 2.65 kg/kg NG combusted
CH4 2.07×10⁻⁴ kg/kg NG combusted
N2O 7.21×10⁻⁵ kg/kg NG combusted
EFs For Electric Motor Driven Compressorts:
CO2 559.0 kg/MWh
CH4 1.09×10⁻² kg/MWh
N2O 8.28×10⁻³ kg/MWh
GHG Emissions (kg / kg of Transported Natural Gas)
Emission Source CO2 - Eq CO2 CH4 N2O
Combusted
Compressors 8.35×10⁻³ 8.34×10⁻³ 3.55×10⁻⁸
Indirect
Electricity From Grid 2.39×10⁻⁴ 2.38×10⁻⁴ 4.67×10⁻⁹ 3.53×10⁻⁹
Fugitive
Pipeline 5.16×10⁻² 1.72×10⁻³
Total Emissions: 6.02×10⁻² 8.58×10⁻³ 1.72×10⁻³ 3.91×10⁻⁸

Proprietary & Confidential Page 41
Exhibit 5-2: Summary of GHG Emissions and Relevant Inputs from Natural Gas Transmission from the LNG Receiving Terminal to the Power Generation Plant Gate
Source: Pace Global.
Summary Of GHG Emissions From Transportation To Liquefaction Facility
Reference Unit & Resource Requirements
Input Name Value Unit
Reference Unit ("RU") 1.0 kg of thruput NG
Nat Gas Loss / Use
Fuel Use - Compressors 9.85×10⁻³ kg/kg thruput NG
Fugitive - Pipeline 5.37×10⁻³ kg/kg thruput NG
Total NG Loss: 0.0152 kg/kg thruput NG
Total NG Requirements / RU 1.015 kg/kg thruput NG
Total Electricity Requirements / RU 4.26×10⁻⁷ MWh/kg transported NG
Key Assumptions & Inputs For Pipeline Transport Step
Input Name Value Unit
Distance Of Route 1,000.0 km
Fugitive EF - Pipelines 5.37×10⁻⁶ kg CH4/kg-km
Fuel Use Factor - Compressors 1.02×10⁻⁵ kg/kg-km
Motor Efficiency 95.0% fraction
Motor Power 10.48 MW
Motor Capacity 75.0% fraction
Motor Throughput 5.83×10⁵ kg/hr
Energy Share By Compressor Driver Type:
Engine Driven (Reciprocating) 78.0% fraction
Gas Turbine Driven (Centrifugal) 19.0% fraction
Electric Motor 3.0% fraction
EFs For Engine Driven Compressors:
CO2 2.65 kg/kg NG combusted
CH4 3.01×10⁻² kg/kg NG combusted
EFs For Gas Turbine Driven Compressors:
CO2 2.65 kg/kg NG combusted
CH4 2.07×10⁻⁴ kg/kg NG combusted
N2O 7.21×10⁻⁵ kg/kg NG combusted
EFs For Electric Motor Driven Compressorts:
CO2 559.0 kg/MWh
CH4 1.09×10⁻² kg/MWh
N2O 8.28×10⁻³ kg/MWh
GHG Emissions (kg / kg of Transported Natural Gas)
Emission Source CO2 - Eq CO2 CH4 N2O
Combusted
Compressors 2.61×10⁻² 2.61×10⁻² 1.39×10⁻⁷
Indirect
Electricity From Grid 2.39×10⁻⁴ 2.38×10⁻⁴ 4.67×10⁻⁹ 3.53×10⁻⁹
Fugitive
Pipeline 0.161 5.37E-03
Total Emissions: 0.188 2.63×10⁻² 5.37×10⁻³ 1.43×10⁻⁷

Proprietary & Confidential Page 42
CHAPTER 6 – GHG EMISSIONS FROM NATURAL GAS TREATMENT AND
LIQUEFACTION
Once the gas enters the liquefaction plant gate, it is treated, cooled, and condensed to LNG for tanker transport. The boundaries of the liquefaction segment begin once the gas exits the pipeline and enters the liquefaction facility’s treatment plant which includes acid gas treatment using activated methyl diethanol amine for CO2 removal and dehydration using molecular sieves. It ends after the LNG is produced and stored in tanks, from which it is eventually loaded onto a LNG tanker for marine transport. Excepting power generation, the liquefaction segment generated the most GHG emissions in this life cycle analysis, accounting for 7.2 percent (low GHG case) to 10.1 percent (high GHG case) of total GHG emissions. Additionally, the liquefaction segment accounts for 41.8 percent (low GHG case) to 76.9 percent (high GHG case) of total natural gas loss or use over the life cycle analysis, representing the largest amount of any segment. Several liquefaction scenarios were analyzed in this report. The different liquefaction scenarios are based on the type of liquefaction technology, the type of refrigerant compressors used, the power source for plant electrical demand, and the option of an NGL recovery unit. Four separate liquefaction processes have been evaluated, each of which entail two different scenarios, one assuming no NGL recovery, and the second assuming NGL recovery. The emissions from each combination of liquefaction process and power generation source were modeled by Pace Global using information on the specific power consumption (kWh/tonne of LNG produced) for liquefaction and the resulting quantity of LNG produced per hour given the specific mode of power generation. ConocoPhillips provided process-specific power assumptions for the Optimized Cascade process. Air Products and Chemicals, Inc. provided process-specific power calculations for the SMR, C3MR, and DMR processes. To protect confidentiality, an anonymous naming convention is utilized in this report so that specific assumptions and calculated results are not directly associated with one of the aforementioned liquefaction process technologies. Certain assumptions that could be used to infer a specific liquefaction process technology, such as energy requirements and LNG output, are not disclosed. Calculations and data on process heat requirements for front-end feed gas treatment to remove CO2 were provided by BASF. Process heat requirements for molecular sieve dehydration prior to liquefaction were provided by ExxonMobil. Power generation from each of the power sources and the resulting GHG emissions were modeled by Pace Global using the GT Pro module in the Thermoflow™ software suite, except for the case where the power source for the liquefaction plant is the electric grid. For the electric grid-sourced power case, emissions were assumed to be equal to the average CO2-e emissions from the U.S. grid as reported by the EPA (EPA, 2010b). When comparing the estimated liquefaction GHG emissions presented here to potential emissions summaries found in air permit applications that U.S. LNG export project developers file with FERC, it is important to consider the specific technologies being used for liquefaction design and refrigerant compressors, as well as assumptions for power source, waste heat recovery, and NGL recovery. Other optional processes that were not considered in this analysis, such as nitrogen stripping units and front-end feed gas heating units, can create material differences in GHG estimates. Further, air permit applications will typically indicate emission rates higher than actual expectations as a result of many project developers desiring permits for emissions beyond a facility’s typical steady state operational mode to account for higher emissions events that can occur outside the facility’s normal operations. For example, auxiliary boilers and emergency generators might be included in emission estimates assuming utilization rates much higher than required for normal operations. Additionally, differences in the feed gas composition can have a material impact on the efficiency of the liquefaction process and consequently the estimated GHG emissions. Feed gas composition and the related impact on process efficiency is generally unknown when evaluating air permit applications.
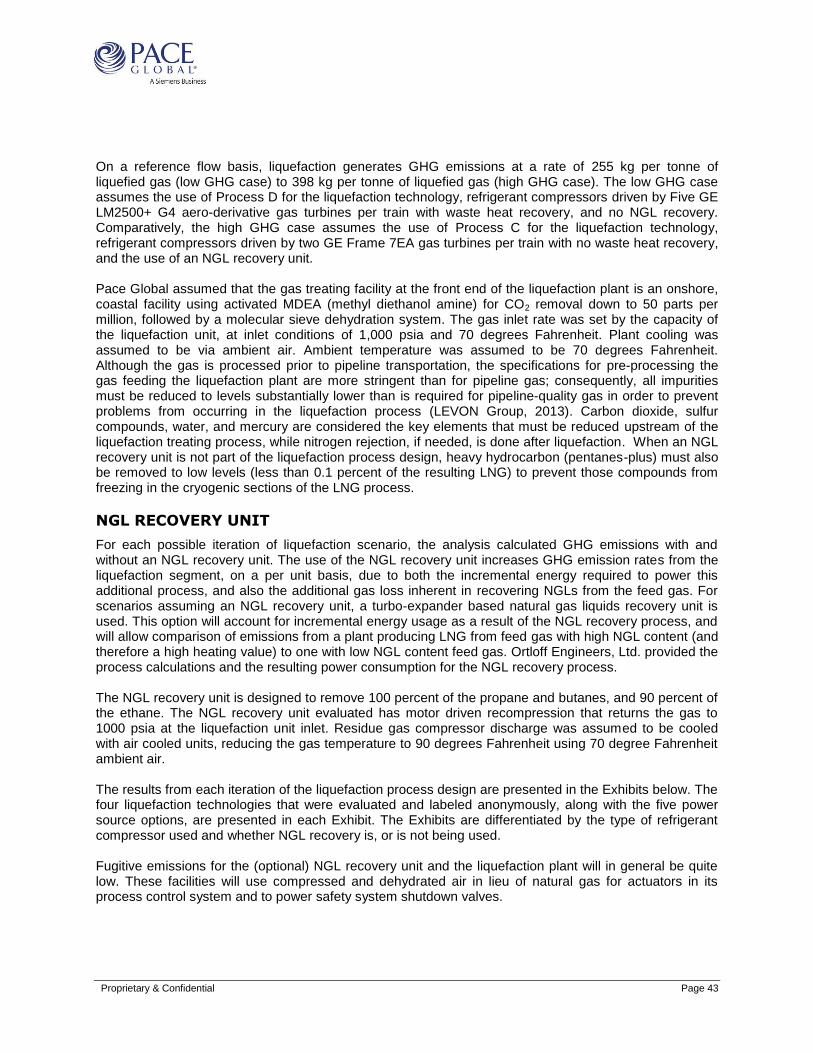
Proprietary & Confidential Page 43
On a reference flow basis, liquefaction generates GHG emissions at a rate of 255 kg per tonne of liquefied gas (low GHG case) to 398 kg per tonne of liquefied gas (high GHG case). The low GHG case assumes the use of Process D for the liquefaction technology, refrigerant compressors driven by Five GE LM2500+ G4 aero-derivative gas turbines per train with waste heat recovery, and no NGL recovery. Comparatively, the high GHG case assumes the use of Process C for the liquefaction technology, refrigerant compressors driven by two GE Frame 7EA gas turbines per train with no waste heat recovery, and the use of an NGL recovery unit. Pace Global assumed that the gas treating facility at the front end of the liquefaction plant is an onshore, coastal facility using activated MDEA (methyl diethanol amine) for CO2 removal down to 50 parts per million, followed by a molecular sieve dehydration system. The gas inlet rate was set by the capacity of the liquefaction unit, at inlet conditions of 1,000 psia and 70 degrees Fahrenheit. Plant cooling was assumed to be via ambient air. Ambient temperature was assumed to be 70 degrees Fahrenheit. Although the gas is processed prior to pipeline transportation, the specifications for pre-processing the gas feeding the liquefaction plant are more stringent than for pipeline gas; consequently, all impurities must be reduced to levels substantially lower than is required for pipeline-quality gas in order to prevent problems from occurring in the liquefaction process (LEVON Group, 2013). Carbon dioxide, sulfur compounds, water, and mercury are considered the key elements that must be reduced upstream of the liquefaction treating process, while nitrogen rejection, if needed, is done after liquefaction. When an NGL recovery unit is not part of the liquefaction process design, heavy hydrocarbon (pentanes-plus) must also be removed to low levels (less than 0.1 percent of the resulting LNG) to prevent those compounds from freezing in the cryogenic sections of the LNG process.
NGL RECOVERY UNIT
For each possible iteration of liquefaction scenario, the analysis calculated GHG emissions with and without an NGL recovery unit. The use of the NGL recovery unit increases GHG emission rates from the liquefaction segment, on a per unit basis, due to both the incremental energy required to power this additional process, and also the additional gas loss inherent in recovering NGLs from the feed gas. For scenarios assuming an NGL recovery unit, a turbo-expander based natural gas liquids recovery unit is used. This option will account for incremental energy usage as a result of the NGL recovery process, and will allow comparison of emissions from a plant producing LNG from feed gas with high NGL content (and therefore a high heating value) to one with low NGL content feed gas. Ortloff Engineers, Ltd. provided the process calculations and the resulting power consumption for the NGL recovery process. The NGL recovery unit is designed to remove 100 percent of the propane and butanes, and 90 percent of the ethane. The NGL recovery unit evaluated has motor driven recompression that returns the gas to 1000 psia at the liquefaction unit inlet. Residue gas compressor discharge was assumed to be cooled with air cooled units, reducing the gas temperature to 90 degrees Fahrenheit using 70 degree Fahrenheit ambient air. The results from each iteration of the liquefaction process design are presented in the Exhibits below. The four liquefaction technologies that were evaluated and labeled anonymously, along with the five power source options, are presented in each Exhibit. The Exhibits are differentiated by the type of refrigerant compressor used and whether NGL recovery is, or is not being used. Fugitive emissions for the (optional) NGL recovery unit and the liquefaction plant will in general be quite low. These facilities will use compressed and dehydrated air in lieu of natural gas for actuators in its process control system and to power safety system shutdown valves.

Proprietary & Confidential Page 44
Exhibit 6-1: Summary of GHG Emissions and Relevant Inputs for Natural Gas Liquefaction – 2 X GE Frame 7EA Gas Turbines, No Waste Heat Recovery, No NGL Recovery
Source: Pace Global.
Summary Of GHG Emissions From Liquefaction - 2x 7E.03 No Waste Heat Recovery
Reference Unit & Resource Requirements
Input Name Value Unit
Reference Unit ("RU") 1.0 kg of liquefied NG
Nat Gas Loss / Use 0.0503 kg/kg liquefied NG
Total NG Requirements / RU 1.0503 kg/kg liquefied NG
Key Assumptions & Inputs For Liquefaction Step
Input Name Process A Process B Process C Process D Unit
Net Power Per Train 166,422.0 166,422.0 166,422.0 166,422.0 kW
NG Boiler For Process Heat 8,000.0 8,000.0 8,000.0 8,000.0 kg/h
Emis. Rate For Refrigerant Compressors 104,881.0 104,881.0 104,881.0 104,881.0 kg/h
Emis. Rate For Flaring - CO2 84,698.0 84,698.0 77,728.8 85,978.1 kg/hour
Emis. Rate For Flaring - CH4 304.8 304.8 279.8 309.5 kg/hour
GHG Emissions (kg / kg of Liquefied Natural Gas)
Emission Source CO2 - Eq CO2 CH4 N2O
Combusted - Refrigerant Compressors
Process A 0.178 0.178
Process B 0.178 0.178
Process C 0.194 0.194
Process D 0.175 0.175
Flared (Combusted)
Process A 0.148 0.133 4.80×10⁻⁴
Process B 0.148 0.133 4.80×10⁻⁴
Process C 0.148 0.133 4.80×10⁻⁴
Process D 0.148 0.133 4.80×10⁻⁴
Vented To Atmosphere
Point Source
Fugitive
Total Emissions:
Process A 0.326 0.311 4.80×10⁻⁴
Process B 0.326 0.311 4.80×10⁻⁴
Process C 0.342 0.327 4.80×10⁻⁴
Process D 0.323 0.309 4.80×10⁻⁴

Proprietary & Confidential Page 45
Exhibit 6-2: Summary of GHG Emissions and Relevant Inputs for Natural Gas Liquefaction – 2 X GE Frame 7EA Gas Turbines, No Waste Heat Recovery, With NGL Recovery
Source: Pace Global.
Summary Of GHG Emissions From Liquefaction - 2x 7E.03 No Waste Heat Recovery
Reference Unit & Resource Requirements
Input Name Value Unit
Reference Unit ("RU") 1.0 kg of liquefied NG
Nat Gas Loss / Use 0.273 kg/kg liquefied NG
Total NG Requirements / RU 1.273 kg/kg liquefied NG
Key Assumptions & Inputs For Liquefaction Step
Input Name Process A Process B Process C Process D Unit
Net Power Per Train 166,422.0 166,422.0 166,422.0 166,422.0 kW
NG Boiler For Process Heat 8,000.0 8,000.0 8,000.0 8,000.0 kg/h
Emis. Rate For Refrigerant Compressors 104,881.0 104,881.0 104,881.0 104,881.0 kg/h
Emis. Rate For Flaring - CO2 89,827.2 89,827.2 83,276.1 91,241.6 kg/hour
Emis. Rate For Flaring - CH4 323.3 323.3 299.7 328.4 kg/hour
GHG Emissions (kg / kg of Liquefied Natural Gas)
Emission Source CO2 - Eq CO2 CH4 N2O
Combusted - Refrigerant Compressors
Process A 0.203 0.203
Process B 0.203 0.203
Process C 0.219 0.219
Process D 0.200 0.200
Flared (Combusted)
Process A 0.179 0.162 5.82×10⁻⁴
Process B 0.179 0.162 5.82×10⁻⁴
Process C 0.179 0.162 5.82×10⁻⁴
Process D 0.179 0.162 5.82×10⁻⁴
Vented To Atmosphere
Point Source
Fugitive
Total Emissions:
Process A 0.382 0.365 5.82×10⁻⁴
Process B 0.382 0.365 5.82×10⁻⁴
Process C 0.398 0.381 5.82×10⁻⁴
Process D 0.379 0.362 5.82×10⁻⁴

Proprietary & Confidential Page 46
Exhibit 6-3: Summary of GHG Emissions and Relevant Inputs for Natural Gas Liquefaction – 2 X GE Frame 7EA Gas Turbines, With Waste Heat Recovery, No NGL Recovery
Source: Pace Global.
Summary Of GHG Emissions From Liquefaction - 2x 7E.03 With Waste Heat Recovery
Reference Unit & Resource Requirements
Input Name Value Unit
Reference Unit ("RU") 1.0 kg of liquefied NG
Nat Gas Loss / Use 0.0503 kg/kg liquefied NG
Total NG Requirements / RU 1.0503 kg/kg liquefied NG
Key Assumptions & Inputs For Liquefaction Step
Input Name Process A Process B Process C Process D Unit
Net Power Per Train 240,673.0 240,673.0 240,673.0 240,673.0 kW
Emis. Rate For Refrigerant Compressors 104,964.0 104,964.0 104,964.0 104,964.0 kg/h
Emis. Rate For Flaring - CO2 122,487.0 122,487.0 112,408.4 124,338.1 kg/hour
Emis. Rate For Flaring - CH4 440.9 440.9 404.6 447.5 kg/hour
GHG Emissions (kg / kg of Liquefied Natural Gas)
Emission Source CO2 - Eq CO2 CH4 N2O
Combusted - Refrigerant Compressors
Process A 0.114 0.114
Process B 0.114 0.114
Process C 0.125 0.125
Process D 0.113 0.113
Flared (Combusted)
Process A 0.148 0.133 4.80×10⁻⁴
Process B 0.148 0.133 4.80×10⁻⁴
Process C 0.148 0.133 4.80×10⁻⁴
Process D 0.148 0.133 4.80×10⁻⁴
Vented To Atmosphere
Point Source
Fugitive
Total Emissions:
Process A 0.262 0.248 4.80×10⁻⁴
Process B 0.262 0.248 4.80×10⁻⁴
Process C 0.272 0.258 4.80×10⁻⁴
Process D 0.260 0.246 4.80×10⁻⁴

Proprietary & Confidential Page 47
Exhibit 6-4: Summary of GHG Emissions and Relevant Inputs for Natural Gas Liquefaction – 2 X GE Frame 7EA Gas Turbines, With Waste Heat Recovery, With NGL Recovery
Source: Pace Global.
Summary Of GHG Emissions From Liquefaction - 2x 7E.03 With Waste Heat Recovery
Reference Unit & Resource Requirements
Input Name Value Unit
Reference Unit ("RU") 1.0 kg of liquefied NG
Nat Gas Loss / Use 0.273 kg/kg liquefied NG
Total NG Requirements / RU 1.273 kg/kg liquefied NG
Key Assumptions & Inputs For Liquefaction Step
Input Name Process A Process B Process C Process D Unit
Net Power Per Train 240,673.0 240,673.0 240,673.0 240,673.0 kW
Emis. Rate For Refrigerant Compressors 104,964.0 104,964.0 104,964.0 104,964.0 kg/h
Emis. Rate For Flaring - CO2 130,001.7 130,001.7 120,520.8 131,950.0 kg/hour
Emis. Rate For Flaring - CH4 467.9 467.9 433.8 474.9 kg/hour
GHG Emissions (kg / kg of Liquefied Natural Gas)
Emission Source CO2 - Eq CO2 CH4 N2O
Combusted - Refrigerant Compressors
Process A 0.131 0.131
Process B 0.131 0.131
Process C 0.141 0.141
Process D 0.129 0.129
Flared (Combusted)
Process A 0.179 0.162 5.82×10⁻⁴
Process B 0.179 0.162 5.82×10⁻⁴
Process C 0.179 0.162 5.82×10⁻⁴
Process D 0.179 0.162 5.82×10⁻⁴
Vented To Atmosphere
Point Source
Fugitive
Total Emissions:
Process A 0.310 0.292 5.82×10⁻⁴
Process B 0.310 0.292 5.82×10⁻⁴
Process C 0.320 0.302 5.82×10⁻⁴
Process D 0.308 0.290 5.82×10⁻⁴

Proprietary & Confidential Page 48
Exhibit 6-5: Summary of GHG Emissions and Relevant Inputs for Natural Gas Liquefaction – 5 X GE LM2500+G4 Gas Turbines, No Waste Heat Recovery, No NGL Recovery
Source: Pace Global.
Summary Of GHG Emissions From Liquefaction - 5x LM2500 No Waste Heat Recovery
Reference Unit & Resource Requirements
Input Name Value Unit
Reference Unit ("RU") 1.0 kg of liquefied NG
Nat Gas Loss / Use 0.0503 kg/kg liquefied NG
Total NG Requirements / RU 1.0503 kg/kg liquefied NG
Key Assumptions & Inputs For Liquefaction Step
Input Name Process A Process B Process C Process D Unit
Net Power Per Train 151,704.0 151,704.0 151,704.0 151,704.0 kW
NG Boiler For Process Heat 8,000.0 8,000.0 8,000.0 8,000.0 kg/h
Emis. Rate For Refrigerant Compressors 83,968.0 83,968.0 83,968.0 83,968.0 kg/h
Emis. Rate For Flaring - CO2 75,451.5 75,451.5 69,183.2 77,726.8 kg/hour
Emis. Rate For Flaring - CH4 271.6 271.6 249.0 279.8 kg/hour
GHG Emissions (kg / kg of Liquefied Natural Gas)
Emission Source CO2 - Eq CO2 CH4 N2O
Combusted - Refrigerant Compressors
Process A 0.163 0.163
Process B 0.163 0.163
Process C 0.177 0.177
Process D 0.158 0.158
Flared (Combusted)
Process A 0.148 0.133 4.80×10⁻⁴
Process B 0.148 0.133 4.80×10⁻⁴
Process C 0.148 0.133 4.80×10⁻⁴
Process D 0.148 0.133 4.80×10⁻⁴
Vented To Atmosphere
Point Source
Fugitive
Total Emissions:
Process A 0.310 0.296 4.80×10⁻⁴
Process B 0.310 0.296 4.80×10⁻⁴
Process C 0.325 0.311 4.80×10⁻⁴
Process D 0.306 0.291 4.80×10⁻⁴

Proprietary & Confidential Page 49
Exhibit 6-6: Summary of GHG Emissions and Relevant Inputs for Natural Gas Liquefaction – 5 X GE LM2500+G4 Gas Turbines, No Waste Heat Recovery, With NGL Recovery
Source: Pace Global.
Summary Of GHG Emissions From Liquefaction - 5x LM2500 No Waste Heat Recovery
Reference Unit & Resource Requirements
Input Name Value Unit
Reference Unit ("RU") 1.0 kg of liquefied NG
Nat Gas Loss / Use 0.273 kg/kg liquefied NG
Total NG Requirements / RU 1.273 kg/kg liquefied NG
Key Assumptions & Inputs For Liquefaction Step
Input Name Process A Process B Process C Process D Unit
Net Power Per Train 151,704.0 151,704.0 151,704.0 151,704.0 kW
NG Boiler For Process Heat 8,000.0 8,000.0 8,000.0 8,000.0 kg/h
Emis. Rate For Refrigerant Compressors 83,968.0 83,968.0 83,968.0 83,968.0 kg/h
Emis. Rate For Flaring - CO2 80,225.6 80,225.6 74,302.4 82,485.8 kg/hour
Emis. Rate For Flaring - CH4 288.8 288.8 267.4 296.9 kg/hour
GHG Emissions (kg / kg of Liquefied Natural Gas)
Emission Source CO2 - Eq CO2 CH4 N2O
Combusted - Refrigerant Compressors
Process A 0.185 0.185
Process B 0.185 0.185
Process C 0.200 0.200
Process D 0.180 0.180
Flared (Combusted)
Process A 0.179 0.162 5.82×10⁻⁴
Process B 0.179 0.162 5.82×10⁻⁴
Process C 0.179 0.162 5.82×10⁻⁴
Process D 0.179 0.162 5.82×10⁻⁴
Vented To Atmosphere
Point Source
Fugitive
Total Emissions:
Process A 0.364 0.347 5.82×10⁻⁴
Process B 0.364 0.347 5.82×10⁻⁴
Process C 0.379 0.362 5.82×10⁻⁴
Process D 0.359 0.342 5.82×10⁻⁴

Proprietary & Confidential Page 50
Exhibit 6-7: Summary of GHG Emissions and Relevant Inputs for Natural Gas Liquefaction – 5 X GE LM2500+G4 Gas Turbines, With Waste Heat Recovery, No NGL Recovery
Source: Pace Global.
Summary Of GHG Emissions From Liquefaction - 5x LM2500 With Waste Heat Recovery
Reference Unit & Resource Requirements
Input Name Value Unit
Reference Unit ("RU") 1.0 kg of liquefied NG
Nat Gas Loss / Use 0.0503 kg/kg liquefied NG
Total NG Requirements / RU 1.0503 kg/kg liquefied NG
Key Assumptions & Inputs For Liquefaction Step
Input Name Process A Process B Process C Process D Unit
Net Power Per Train 203,108.0 203,108.0 203,108.0 203,108.0 kW
Emis. Rate For Refrigerant Compressors 83,880.0 83,880.0 83,880.0 83,880.0 kg/h
Emis. Rate For Flaring - CO2 101,017.8 101,017.8 92,625.5 104,064.1 kg/hour
Emis. Rate For Flaring - CH4 363.6 363.6 333.4 374.6 kg/hour
GHG Emissions (kg / kg of Liquefied Natural Gas)
Emission Source CO2 - Eq CO2 CH4 N2O
Combusted - Refrigerant Compressors
Process A 0.111 0.111
Process B 0.111 0.111
Process C 0.121 0.121
Process D 0.108 0.108
Flared (Combusted)
Process A 0.148 0.133 4.80×10⁻⁴
Process B 0.148 0.133 4.80×10⁻⁴
Process C 0.148 0.133 4.80×10⁻⁴
Process D 0.148 0.133 4.80×10⁻⁴
Vented To Atmosphere
Point Source
Fugitive
Total Emissions:
Process A 0.259 0.244 4.80×10⁻⁴
Process B 0.259 0.244 4.80×10⁻⁴
Process C 0.269 0.254 4.80×10⁻⁴
Process D 0.255 0.241 4.80×10⁻⁴
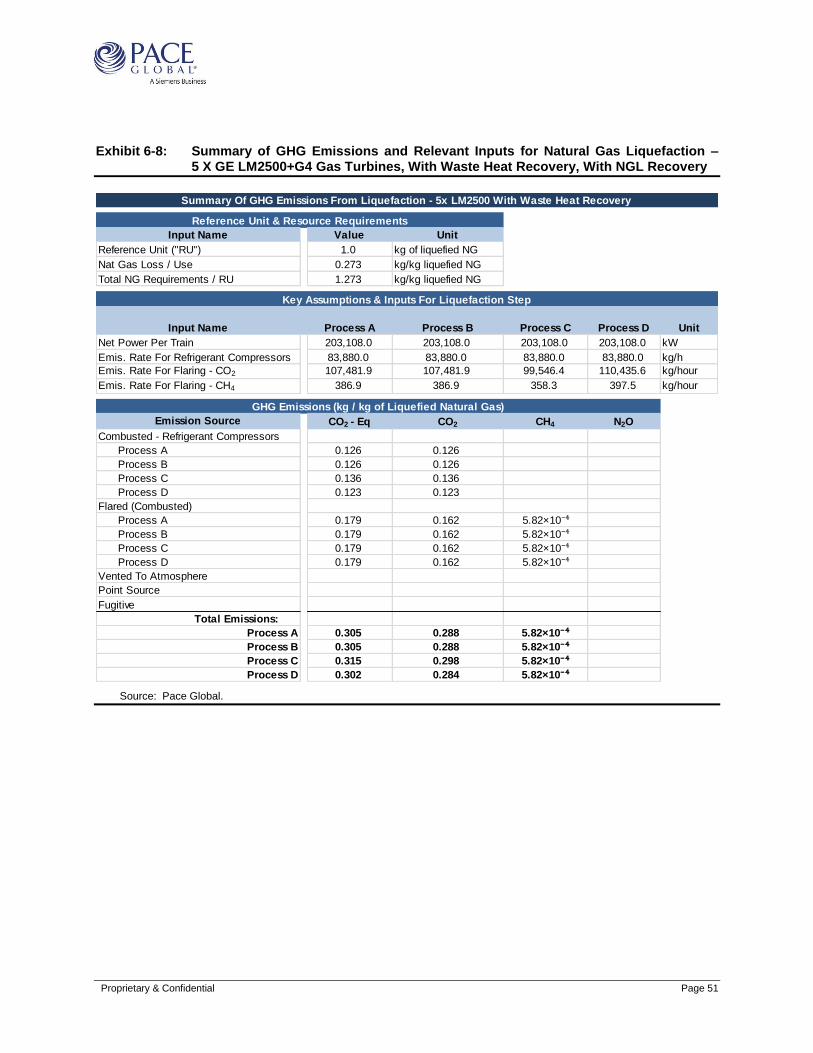
Proprietary & Confidential Page 51
Exhibit 6-8: Summary of GHG Emissions and Relevant Inputs for Natural Gas Liquefaction – 5 X GE LM2500+G4 Gas Turbines, With Waste Heat Recovery, With NGL Recovery
Source: Pace Global.
Summary Of GHG Emissions From Liquefaction - 5x LM2500 With Waste Heat Recovery
Reference Unit & Resource Requirements
Input Name Value Unit
Reference Unit ("RU") 1.0 kg of liquefied NG
Nat Gas Loss / Use 0.273 kg/kg liquefied NG
Total NG Requirements / RU 1.273 kg/kg liquefied NG
Key Assumptions & Inputs For Liquefaction Step
Input Name Process A Process B Process C Process D Unit
Net Power Per Train 203,108.0 203,108.0 203,108.0 203,108.0 kW
Emis. Rate For Refrigerant Compressors 83,880.0 83,880.0 83,880.0 83,880.0 kg/h
Emis. Rate For Flaring - CO2 107,481.9 107,481.9 99,546.4 110,435.6 kg/hour
Emis. Rate For Flaring - CH4 386.9 386.9 358.3 397.5 kg/hour
GHG Emissions (kg / kg of Liquefied Natural Gas)
Emission Source CO2 - Eq CO2 CH4 N2O
Combusted - Refrigerant Compressors
Process A 0.126 0.126
Process B 0.126 0.126
Process C 0.136 0.136
Process D 0.123 0.123
Flared (Combusted)
Process A 0.179 0.162 5.82×10⁻⁴
Process B 0.179 0.162 5.82×10⁻⁴
Process C 0.179 0.162 5.82×10⁻⁴
Process D 0.179 0.162 5.82×10⁻⁴
Vented To Atmosphere
Point Source
Fugitive
Total Emissions:
Process A 0.305 0.288 5.82×10⁻⁴
Process B 0.305 0.288 5.82×10⁻⁴
Process C 0.315 0.298 5.82×10⁻⁴
Process D 0.302 0.284 5.82×10⁻⁴
Proprietary & Confidential Page 52
Exhibit 6-9: Summary of GHG Emissions and Relevant Inputs for Natural Gas Liquefaction – Electric Motors, No NGL Recovery
Source: Pace Global.
Summary Of GHG Emissions From Liquefaction - Electric Motors
Reference Unit & Resource Requirements
Input Name Value Unit
Reference Unit ("RU") 1.0 kg of liquefied NG
Nat Gas Loss / Use 0.0503 kg/kg liquefied NG
Total NG Requirements / RU 1.0503 kg/kg liquefied NG
Key Assumptions & Inputs For Liquefaction Step
Input Name Process A Process B Process C Process D Unit
Net Power Per Train 166,422.0 166,422.0 166,422.0 166,422.0 kW
NG Boiler For Process Heat 8,000.0 8,000.0 8,000.0 8,000.0 kg/h
Emis. Rate For Refrigerant Compressors 93,493.1 93,493.1 93,493.1 93,493.1 kg/h
Emis. Rate For Flaring - CO2 83,859.4 83,859.4 76,959.2 85,126.8 kg/hour
Emis. Rate For Flaring - CH4 301.8 301.8 277.0 306.4 kg/hour
GHG Emissions (kg / kg of Liquefied Natural Gas)
Emission Source CO2 - Eq CO2 CH4 N2O
Combusted - Refrigerant Compressors
Process A 0.161 0.161
Process B 0.161 0.161
Process C 0.176 0.176
Process D 0.159 0.159
Flared (Combusted)
Process A 0.148 0.133 4.80×10⁻⁴
Process B 0.148 0.133 4.80×10⁻⁴
Process C 0.148 0.133 4.80×10⁻⁴
Process D 0.148 0.133 4.80×10⁻⁴
Vented To Atmosphere
Point Source
Fugitive
Total Emissions:
Process A 0.309 0.295 4.80×10⁻⁴
Process B 0.309 0.295 4.80×10⁻⁴
Process C 0.324 0.309 4.80×10⁻⁴
Process D 0.307 0.292 4.80×10⁻⁴

Proprietary & Confidential Page 53
Exhibit 6-10: Summary of GHG Emissions and Relevant Inputs for Natural Gas Liquefaction – Electric Motors, With NGL Recovery
Source: Pace Global.
Summary Of GHG Emissions From Liquefaction - Electric Motors
Reference Unit & Resource Requirements
Input Name Value Unit
Reference Unit ("RU") 1.0 kg of liquefied NG
Nat Gas Loss / Use 0.273 kg/kg liquefied NG
Total NG Requirements / RU 1.273 kg/kg liquefied NG
Key Assumptions & Inputs For Liquefaction Step
Input Name Process A Process B Process C Process D Unit
Net Power Per Train 166,422.0 166,422.0 166,422.0 166,422.0 kW
NG Boiler For Process Heat 8,000.0 8,000.0 8,000.0 8,000.0 kg/h
Emis. Rate For Refrigerant Compressors 93,493.1 93,493.1 93,493.1 93,493.1 kg/h
Emis. Rate For Flaring - CO2 88,937.8 88,937.8 82,451.6 79,875.4 kg/hour
Emis. Rate For Flaring - CH4 320.1 320.1 296.8 287.5 kg/hour
GHG Emissions (kg / kg of Liquefied Natural Gas)
Emission Source CO2 - Eq CO2 CH4 N2O
Combusted - Refrigerant Compressors
Process A 0.184 0.184
Process B 0.184 0.184
Process C 0.199 0.199
Process D 0.183 0.183
Flared (Combusted)
Process A 0.179 0.162 5.82×10⁻⁴
Process B 0.179 0.162 5.82×10⁻⁴
Process C 0.179 0.162 5.82×10⁻⁴
Process D 0.179 0.162 5.82×10⁻⁴
Vented To Atmosphere
Point Source
Fugitive
Total Emissions:
Process A 0.364 0.346 5.82×10⁻⁴
Process B 0.364 0.346 5.82×10⁻⁴
Process C 0.378 0.361 5.82×10⁻⁴
Process D 0.363 0.345 5.82×10⁻⁴

Proprietary & Confidential Page 54
CHAPTER 7 – GHG EMISSIONS FROM SHIPPING LNG
After the gas is liquefied and stored, it must be loaded onto tankers and shipped in its liquid state to its destination market. LNG tankers are the only viable method of transporting LNG from the U.S. to markets in Asia and Europe. The boundaries for the LNG shipping segment begin once the LNG exits the liquefaction facility’s storage tanks and is loaded onto the LNG tanker. The segment ends after the ship concludes its ballast voyage and returns to the original loading location. Calculated emissions from LNG shipping in this analysis include ship loading, the laden voyage, ship offloading, and the ballast voyage. Herbert Engineering Corp. provided calculations for the various ship types, operating modes, and the resulting GHG emissions that are analyzed in this report. The first step in the LNG shipping segment is loading the ship with LNG at the marine loading terminal located adjacent to the liquefaction plant. Unloading occurs after the laden voyage and prior to regasification, but since both processes are similar they are discussed together in this report. According to a report published by the API (LEVON Group, 2013), the operations at a loading or unloading terminal are comprised of the following steps:
Positioning an LNG carrier using tug boats such that the LNG carrier can be connected to a berth suitably equipped for LNG transfer;
Mooring the LNG carrier at the terminal marine berth;
Connecting cryogenic loading arms to the LNG carrier; these loading arms are used to transfer LNG from the liquefaction plant storage tanks to the ship, or from the ship to the receiving terminal tanks, and to connect / enable gas transfer between the vapor space in the ship’s tanks and the vapor space in the export or import terminal’s tanks;
Transfer of LNG from the liquefaction plant’s storage tanks to the ship, or from the ship to the receiving terminal’s storage tanks, via the cryogenic loading arms and a loading or unloading piping system between the LNG storage tanks and the LNG carrier (note that the initial LNG transfer rate onto a ship at the liquefaction plant depends on the temperature of the tanks within the ship upon its arrival);
Compressing boil-off gas, with or without flaring, venting, or tank to tank transfer of displaced tank gas during the transfer process;
Stopping of the LNG transfer operation, followed by draining of the liquid-filled loading arms; and
Disconnection of the LNG carrier from the loading arms and the berth mooring systems for its onward sea journey (LEVON Group, 2013).
After LNG is loaded onto the tanker at the liquefaction plant, the ship begins the laden voyage to the LNG receiving terminal, where the LNG will be offloaded and regasified. After the LNG unloading operation at the receiving terminal, the ship returns on its ballast voyage without cargo, excluding any minor quantities retained to facilitate ship tank cooldown prior to arriving at the export facility, to its original loading location. Emission sources from LNG shipping include the venting of unconsumed and un-reliquefied boil-off gas (BOG) during voyage, combustion emissions from power generation, venting from the compressors used to recover the BOG, fugitive emissions from compressors, emissions from fuel combustion used for ship propulsion, emissions for other vessels, e.g. tugs, used to position the LNG ship near or at port, and combustion emissions from the power plant used to power the ship’s other systems (LEVON Group, 2013). The primary factors that determine the level of overall GHG emissions generated from LNG shipping are the ship design and the total distance traveled. The ship design types analyzed in this report include:
Proprietary & Confidential Page 55
145,000 m3 conventional steam propulsion Moss ships using LNG boil-off gas for ship propulsion
system fuel (laden) and boil-off/bunker fuel (ballast);
165,000 m3 Dual-Fuel Diesel Electric (DFDE) membrane ships using LNG boil-off gas (laden) and
boil-off/bunker fuel (ballast)
216,000 m3 Q-Flex membrane ships using bunker fuel (laden and ballast) with shipboard boil-off
gas reliquefaction; and
266,000 m3 Q-Max membrane ships using bunker fuel (laden and ballast) with shipboard boil-off
gas reliquefaction. The ship design determines the amount and type of fuel combusted as well as the amount of feed LNG that can be transported in one laden voyage. The destination market will influence the amount of GHG emissions due to the distance traveled, which determines the amount of fuel required over the course of both the laden and ballast voyages. LNG shipping emissions were calculated on a per nautical mile basis. Total emissions were calculated assuming U.S. exports originate at Galveston, Texas, to markets in Japan, South Korea, China, India, and Europe, the latter represented by Bremerhaven, Germany. Galveston was selected due to its proximity to several U.S. LNG export projects currently being developed. Calculated GHG emissions from LNG shipping were determined to be 116 kg per tonne of feed LNG for the low GHG case, represented by a 216,000 m
3 Q-Flex membrane ship transporting LNG from
Galveston, Texas to Bremerhaven, Germany at a distance of 5,145 nautical miles, and 267 kg per tonne of feed LNG for the high GHG case, represented by a 145,000 m
3 conventional steam propulsion Moss
ship transporting LNG from Galveston, Texas to Qingdao, China at a distance of 10,062 nautical miles. For the life cycle analysis, LNG shipping accounted for 3.3 percent (low GHG case) and 6.8 percent (high GHG case) of total GHG emissions. A summary of the GHG emissions generated from LNG shipping for the options under consideration is provided below in Exhibit 7-1 and includes resource requirements, key assumptions and inputs, and GHG emissions by source and product. It is recognized that a Q-Max ship will not be able to navigate the Panama Canal for LNG transport from Galveston to markets in the Far East. Q-Max ships can currently navigate through the Suez Canal. It is further recognized that while Q-Flex ships cannot currently navigate the Panama Canal, they will be able to do so after completion of the ongoing Panama Canal expansion project. That expansion project is scheduled for completion in 2016.

Proprietary & Confidential Page 56
Exhibit 7-1: Summary of GHG Emissions and Relevant Inputs for LNG Shipping
1. With scrubber for use in the U.S. ECA. 2. Units in kg per kg of feed LNG, irrespective of total nautical miles traveled during the laden and ballast voyages. 3. The value in the table given for Total Power Consumption is the sum for all engines (main + auxiliary engines) during the
entire laden or ballast voyage. 4. The value in the table given for Total Fuel Consumption is the sum for all engines (main + auxiliary engines) during the
entire laden or ballast voyage.
Source: Pace Global.
Summary Of GHG Emissions From LNG Shipping From Galveston, TX
Reference Unit & Resource Requirements
Input Name Moss DFDE Membrane Q-Flex Membrane Q-Max Membrane Unit
Reference Unit ("RU") 1.0 1.0 1.0 1.0 kg-nm of feed LNG
Nat Gas Loss or Use 4.98×10⁻⁶ 3.65×10⁻⁶ 0.00 0.00 kg/kg-nm of feed LNG
Total NG Requirements per RU 1.000005 1.000004 1.00 1.00 kg/kg-nm of feed LNG
Key Assumptions & Inputs For Shipping Step
Vessel Particulars:
LNG Capacity 145,000 165,000 216,000 266,000 m3
Main Engine Type Steam Boiler
Medium Speed DF
Diesel Low Speed Diesel1 Low Speed Diesel1 N/A
# of Main Engines 2 4 2 2 N/A
Main Engine MCR (Each) 15,000 10,000 18,600 24,000 kW
Auxiliary Engine Type - -
Medium Speed
Diesel1Medium Speed
Diesel1 N/A
# of Auxiliary Engines - - 3 3 N/A
Auxiliary Engine MCR (Each) - - 3,000 3,900 kW
Laden Voyage:
Laden Voyage Fuel Boil Off Gas Boil Off Gas/Pilot Oil HFO HFO N/A
Laden Voyage Ship Speed 19.5 19.5 19.5 19.5 knots
Boil Off Gas 320.4 270.3 0.00 0.00 kg/nm
Ballast Voyage:
Ballast Voyage Fuel Boil Off Gas Boil Off Gas/Pilot Oil HFO HFO N/A
Ballast Voyage Ship Speed 20.7 20.7 20.9 20.9 knots
Boil Off Gas 301.9 254.7 0.00 0.00 kg/nm
Loading/Unloading - Each:
Fuel MGO MGO HFO HFO N/A
Round Trip Voyage:
Voyage Fuel Boil Off Gas/MGO Boil Off Gas/MGO HFO HFO N/A
Voyage Total Power Consumption3 2.47×10⁷ 3.29×10⁷ 3.81×10⁷ 4.96×10⁷ kWh
Voyage Total Fuel Consumption4
3.015x10¹¹ /
4.362x10⁹
2.546x10¹¹ /
5.006x10⁹ 2.74×10¹¹ 3.58×10¹¹ kJ
GHG Emissions
Emission Source CO2 - Eq CO2 CH4 N2O Unit
Laden Voyage
Moss 1.34×10⁻⁵ 1.34×10⁻⁵ 0.00 kg/kg-nm of feed LNG
DFDE Membrane 1.16×10⁻⁵ 1.01×10⁻⁵ 5.07×10⁻⁸ kg/kg-nm of feed LNG
Q-Flex Membrane 1.13×10⁻⁵ 1.13×10⁻⁵ 0.00 kg/kg-nm of feed LNG
Q-Max Membrane 1.18×10⁻⁵ 1.18×10⁻⁵ 0.00 kg/kg-nm of feed LNG
Ballast Voyage
Moss 1.27×10⁻⁵ 1.27×10⁻⁵ 0.00 kg/kg-nm of feed LNG
DFDE Membrane 1.09×10⁻⁵ 9.49×10⁻⁶ 4.77×10⁻⁸ kg/kg-nm of feed LNG
Q-Flex Membrane 1.05×10⁻⁵ 1.05×10⁻⁵ 0.00 kg/kg-nm of feed LNG
Q-Max Membrane 1.14×10⁻⁵ 1.14×10⁻⁵ 0.00 kg/kg-nm of feed LNG
Loading/Unloading2
Moss 4.87×10⁻³ 4.87×10⁻³ kg/kg of feed LNG
DFDE Membrane 3.05×10⁻³ 3.05×10⁻³ kg/kg of feed LNG
Q-Flex Membrane 3.53×10⁻³ 3.53×10⁻³ kg/kg of feed LNG
Q-Max Membrane 3.17×10⁻³ 3.17×10⁻³ kg/kg of feed LNG
CO2 Equivalent Emissions By Destination (kg / kg feed LNG)
Input Name Mumbai, India Qingdao, China Busan, Korea Tokyo, Japan Bremerhaven, Germany
Nautical Miles From Galveston, TX: 9,684 10,062 9,550 9,177 5,145
Moss 0.258 0.267 0.254 0.244 0.139
DFDE Membrane 0.221 0.230 0.218 0.210 0.119
Q-Flex Membrane 0.215 0.223 0.212 0.204 0.116
Q-Max Membrane 0.228 0.236 0.225 0.216 0.122
Proprietary & Confidential Page 57
CHAPTER 8 – GHG EMISSIONS FROM REGASIFICATION
The boundaries for calculating emissions from the LNG regasification (regasification) segment start when the LNG is offloaded from the LNG tanker and enters the LNG receiving terminal gate, and ends when the regasified fuel enters the second transportation pipeline gate. Regasification is necessary to return the LNG back into a pressurized, gaseous state so it is suitable for pipeline transportation to reach end-users. This analysis assumes that the only processes the regasification plant will perform are pumping and vaporizing LNG. KBR, Inc. provided calculations for the power consumption for each regasification plant option analyzed in this report. These include:
Seawater-heated open rack vaporizers (ORV).
Submerged combustion vaporizers (SCV).
Air-heated vaporization using a closed loop glycol / water system heated by air (AHV).
Air-heated vaporization using and an open loop air-heated water system, also known as Shell & Tube Vaporizer with air exchange tower (STV + AET).
LNG vaporization via waste heat from a co-located power plant (HRV). Emissions from power consumption for the simple and combined cycle power sources were modeled by Pace Global using the GT Pro module of the Thermoflow™ software suite. For the cases where the power source is assumed to be the local grid, the following reports were used to source average grid emission factors:
CO2 Baseline Database for the Indian Power Sector. User Guide Version 9. Government of India, Ministry of Power.
International Comparison of Fossil Fuel Power Efficiency and CO2 Intensity (Charlotte Hussy, Erik Klaassen, Joris Koornneef, and Fabian Wigand) – Ecofys.
LNG is initially pumped from the LNG tanker into the receiving terminal’s storage tanks, where it is stored at slightly above atmospheric pressure. To convert the stored LNG into high pressure gas, the LNG is then pumped to higher pressure through in-tank and high pressure pumps, vaporized at high pressure, and delivered into the send-out gas pipeline (LEVON Group, 2013). Boil-off gas generated via heat gain into the terminal’s storage tanks is compressed to the same outlet pressure as the LNG leaving the in-tank pumps, combined with that intermediate pressure LNG, and thereby reliquefied. The primary factors in determining GHG emissions from the regasification segment are the choice of vaporization design and the power source for the electricity demand from the LNG receiving terminal. Emissions from LNG receiving terminal operations assume an onshore terminal location, with 70 degree Fahrenheit ambient air and 50 degree Fahrenheit seawater. Boil-off gas generated from a ship unloading operation will be assumed to be recovered and either sold at the terminal outlet flange or consumed as terminal fuel. Regasification generates a low amount of GHG emissions in the context of the LNG life cycle analysis. In the low GHG case, GHG emissions were calculated to be 5.39x10
-3 kg of CO2-e per kg of regasified fuel.
In the high GHG case, GHG emissions were calculated to be 1.71x10⁻²
kg of CO2-e per kg of regasified fuel. For the total life cycle analysis, regasification accounts for 0.2 percent (low GHG case) to 0.4 percent (high GHG case) of total life cycle GHG emissions. A summary of the GHG emissions generated from regasification is provided in Exhibit 8-1 below and includes resource requirements, key assumptions and inputs, and GHG emissions by source and product.

Proprietary & Confidential Page 58
Product gas from the receiving terminal enters a pipeline to the power generation plant, as previously discussed in Chapter 5 of this report. Exhibit 8-1: Summary of GHG Emissions and Relevant Inputs for Natural Gas Regasification –
Multiple Cases
Source: Pace Global.
Summary Of GHG Emissions From Regasification
Reference Unit & Resource Requirements
Input Name Value
Reference Unit ("RU") 1.0
Nat Gas Loss / Use 0.0
Total NG Requirements / RU 1.0
Key Assumptions & Inputs For Regasification Step
Input Name
Combined
Cycle
Simple
Cycle Grid - India
Grid -
China
Grid -
Korea
Grid -
Japan
Grid -
Germany Unit
CO2 Emis. Rate For
Vaporizers:
ORV 7,832.0 8,286.0 14,924.0 14,017.4 9,149.5 8,681.6 4,753.0 kg/hour
SCV 7,749.0 8,154.0 14,760.0 13,863.3 9,049.0 8,586.2 4,700.8 kg/hour
AHV 7,303.0 7,723.0 13,858.0 13,016.1 8,496.0 8,061.5 4,413.5 kg/hour
STV+AET 7,424.0 7,841.0 14,104.0 13,247.2 8,646.8 8,204.6 4,491.9 kg/hour
HRV 7,424.0 7,841.0 14,104.0 13,247.2 8,646.8 8,204.6 4,491.9 kg/hour
Feed Gas Flow 41.7 41.7 41.7 41.7 41.7 41.7 41.7 mmscf/hour
Feed Gas Density 1.97×10⁻² 1.97×10⁻² 1.97×10⁻² 1.97×10⁻² 1.97×10⁻² 1.97×10⁻² 1.97×10⁻² kg/scf
CO2 Equivalent Emissions (kg / kg of Regasified Natural Gas)
Emission Source
Combined
Cycle
Simple
Cycle Grid - India
Grid -
China
Grid -
Korea
Grid -
Japan
Grid -
Germany
Combusted - Vaporizers
ORV 9.56×10⁻³ 1.01×10⁻² 1.82×10⁻² 1.71×10⁻² 1.12×10⁻² 1.06×10⁻² 5.80×10⁻³
SCV 9.46×10⁻³ 9.96×10⁻³ 1.80×10⁻² 1.69×10⁻² 1.11×10⁻² 1.05×10⁻² 5.74×10⁻³
AHV 8.92×10⁻³ 9.43×10⁻³ 1.69×10⁻² 1.59×10⁻² 1.04×10⁻² 9.85×10⁻³ 5.39×10⁻³
STV+AET 9.07×10⁻³ 9.58×10⁻³ 1.72×10⁻² 1.62×10⁻² 1.06×10⁻² 1.00×10⁻² 5.49×10⁻³
HRV 9.07×10⁻³ 9.58×10⁻³ 1.72×10⁻² 1.62×10⁻² 1.06×10⁻² 1.00×10⁻² 5.49×10⁻³
Vented To Atmosphere
Point Source
Fugitive
Total Emissions:
ORV 9.56×10⁻³ 1.01×10⁻² 1.82×10⁻² 1.71×10⁻² 1.12×10⁻² 1.06×10⁻² 5.80×10⁻³
SCV 9.46×10⁻³ 9.96×10⁻³ 1.80×10⁻² 1.69×10⁻² 1.11×10⁻² 1.05×10⁻² 5.74×10⁻³
AHV 8.92×10⁻³ 9.43×10⁻³ 1.69×10⁻² 1.59×10⁻² 1.04×10⁻² 9.85×10⁻³ 5.39×10⁻³
STV+AET 9.07×10⁻³ 9.58×10⁻³ 1.72×10⁻² 1.62×10⁻² 1.06×10⁻² 1.00×10⁻² 5.49×10⁻³
HRV 9.07×10⁻³ 9.58×10⁻³ 1.72×10⁻² 1.62×10⁻² 1.06×10⁻² 1.00×10⁻² 5.49×10⁻³
kg of NG regasified
kg/kg of NG regasified
kg/kg of NG regasified
Unit

Proprietary & Confidential Page 59
CHAPTER 9 – NATURAL GAS COMBINED CYCLE POWER PLANT GHG
EMISSIONS
GHG emissions from gas-fired generation were calculated using methodologies and assumptions set forth in the September 2013 NETL report: “Cost and Performance Baseline for Fossil Energy Plants, Volume 1: Bituminous Coal and Natural Gas to Electricity” (NETL/DOE, 2013). This segment of the analysis represents the final portion of the life cycle chain being evaluated, and accounts for 66.7 percent (high GHG case) to 73.9 percent (low GHG case) of total LNG life cycle GHG emissions. The boundaries for this segment of the analysis begin when natural gas enters the power plant gate via pipeline transport from the regasification facility, and ends with the production of 1 MWh of gas-fired electricity. The heat rate of the power plant, where the natural gas will ultimately be combusted for power generation, is one of the most important factors in determining the overall life cycle GHG emissions for natural gas-fired power generation. For this analysis, the heat rate of the power plant is defined by the total mass of fuel used by the power plant to generate one MWh of electricity. It can be described as the overall efficiency of the power plant. The heat rate of a gas-fired power plant is most heavily influenced by the process the plant uses to turn the turbines that generate electricity. The two main categories of gas-fired power plants examined in this analysis are simple cycle and combined cycle gas turbine-driven power plants, the latter of which represent the majority of gas-fired power plants currently in operation. Simple cycle plants represent older technology and are less efficient than more modern combined cycle plants. In a simple cycle plant, compressed air and natural gas are combusted to produce a hot gas stream that expands through a gas turbine in order to spin a generator to produce electricity. Simple cycle plants can be advantageous due to their ability to reach full power in a relatively small time frame, and the short amount of time they are required to be online once started. This attribute makes simple cycle plants suitable for peak-load power generation. Additionally, simple cycle plants are less expensive to install than combined cycle plants and can be constructed in a shorter time frame. While a simple cycle power plant can be viable for a peak demand application that is capitally constrained, these types of power plants will not be representative of the majority of future gas-fired power generation facilities. There is low incentive for power plant developers to design and install new simple cycle power plants fueled by gas from LNG because of the high fuel consumption rate relative to combined cycle power plants. Usually, the higher fuel consumption rate of simply cycle power plants increases fuel purchase costs to the point that it is more economically viable to instead install a combined cycle power plant despite the incremental capital cost. Combined cycle plants comprise both a gas turbine and a waste heat boiler coupled with a steam turbine. The operation of the gas turbine is similar to the simple cycle plants described above. However, waste heat generated from the gas turbine exhaust is used to produce steam, which in turn powers the steam turbine-driven generator. Steam turbines operate much like gas turbines, in that the steam expands through a turbine to produce shaft power, which in turn is used to drive a generator to produce electricity. The result of having two power cycles, and of efficiently using waste heat that would otherwise be lost, is a power plant design that has substantially higher energy efficiency than simple cycle plants. In this analysis, the assumed higher heating value (HHV) heat rate of a simple cycle plant is 10,485 Btu per kWh, compared to 6,798 Btu per kWh for a combined cycle plant. In terms of efficiency, a combined cycle plant requires only 64.8 percent of the natural gas required to produce a unit of electrical power relative to a simple cycle plant. In addition to turbines, both types of power plants can also use natural gas to power auxiliary boilers. The function of auxiliary boilers is to assist in the startup of either gas or steam turbines. For both combined

Proprietary & Confidential Page 60
cycle and simple cycle plants, auxiliary boilers represent only about 0.1 percent of total gas use for either type of power plant. The gas consumption rate for auxiliary boilers was derived from a product description from the Wabash Power Equipment Company for a 40,000 pounds of steam per hour (PPH) mobile trailer-mounted watertube boiler (Wabash Power Equipment Co, 2010). GHG emission factors used to calculate combustion emissions from auxiliary boilers were sourced from the EPA and are representative of a large wall-fired boiler (EPA, 1995). Alternatively, electric motors can be used to start the gas turbines. The combined fuel use requirement to produce 1 MWh of electricity for a combined cycle power plant was calculated to be 7.2 MCF (136.9 kg) per MWh, compared to 11.1 MCF (211.2 kg) per MWh for a simple cycle plant. Natural gas consumption per MWh of electricity rates were derived from data published in a NETL report (NETL/DOE, 2013) by taking the quotient of the net power output and natural gas flowrate for the appropriate power plant design. The capacity factor was assumed to be 85 percent for both combined cycle and simple cycle plants. The power generation segment generates the most GHG emissions of any segment in this life cycle analysis by a substantial margin, accounting for 66.7 percent (high GHG case) and 73.9 percent (low GHG case) of total LNG life cycle GHG emissions. Additionally, this segment uses the most amount of natural gas fuel since all gas entering the power plant gate is combusted for power generation. Thus, the efficiency of the power plant is critical for the entire life cycle analysis because it has a considerable effect on the amount of gas that must pass through the entire supply chain in order to generate one MWh of electricity. Summaries of the GHG emissions generated from gas-fired generation are provided in Exhibit 9-1 (Combined Cycle) and Exhibit 9-2 (Simple Cycle) below, and include resource requirements, key assumptions and inputs, and GHG emissions by source and product.
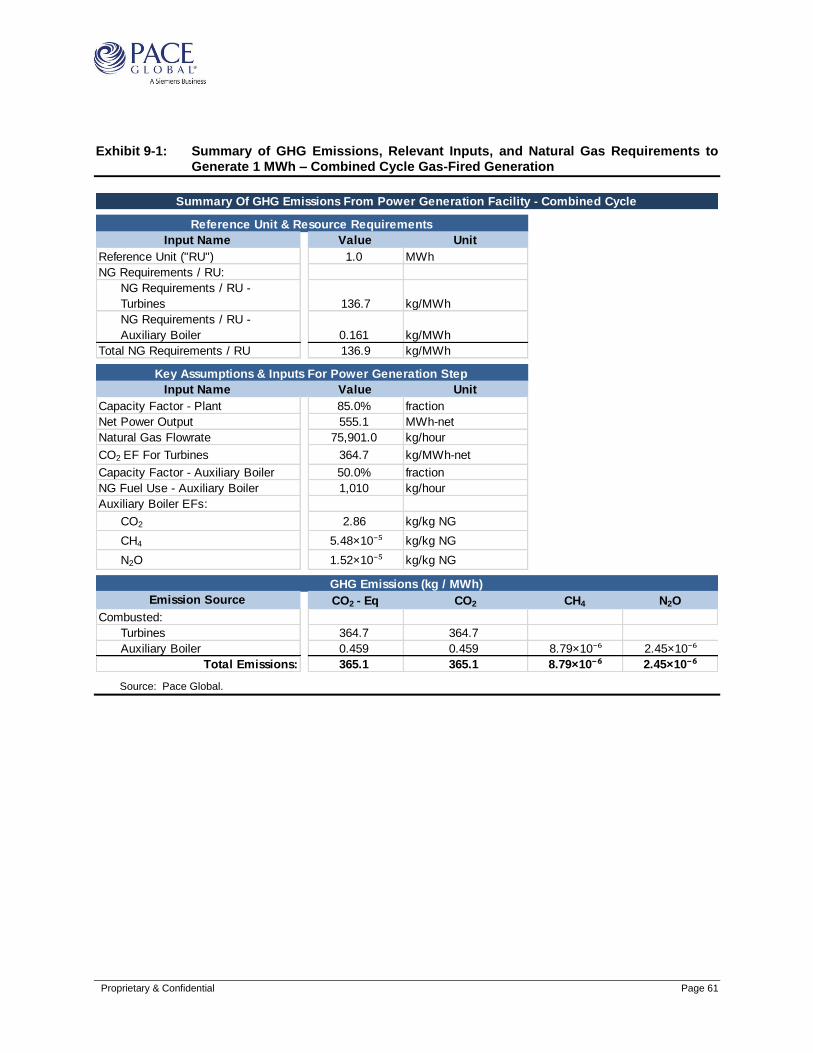
Proprietary & Confidential Page 61
Exhibit 9-1: Summary of GHG Emissions, Relevant Inputs, and Natural Gas Requirements to Generate 1 MWh – Combined Cycle Gas-Fired Generation
Source: Pace Global.
Summary Of GHG Emissions From Power Generation Facility - Combined Cycle
Reference Unit & Resource Requirements
Input Name Value Unit
Reference Unit ("RU") 1.0 MWh
NG Requirements / RU:
NG Requirements / RU -
Turbines 136.7 kg/MWh
NG Requirements / RU -
Auxiliary Boiler 0.161 kg/MWh
Total NG Requirements / RU 136.9 kg/MWh
Key Assumptions & Inputs For Power Generation Step
Input Name Value Unit
Capacity Factor - Plant 85.0% fraction
Net Power Output 555.1 MWh-net
Natural Gas Flowrate 75,901.0 kg/hour
CO2 EF For Turbines 364.7 kg/MWh-net
Capacity Factor - Auxiliary Boiler 50.0% fraction
NG Fuel Use - Auxiliary Boiler 1,010 kg/hour
Auxiliary Boiler EFs:
CO2 2.86 kg/kg NG
CH4 5.48×10⁻⁵ kg/kg NG
N2O 1.52×10⁻⁵ kg/kg NG
GHG Emissions (kg / MWh)
Emission Source CO2 - Eq CO2 CH4 N2O
Combusted:
Turbines 364.7 364.7
Auxiliary Boiler 0.459 0.459 8.79×10⁻⁶ 2.45×10⁻⁶
Total Emissions: 365.1 365.1 8.79×10⁻⁶ 2.45×10⁻⁶

Proprietary & Confidential Page 62
Exhibit 9-2: Summary of GHG Emissions, Relevant Inputs, and Natural Gas Requirements to Generate 1 MWh – Simple Cycle Gas-Fired Generation
Source: Pace Global.
Summary Of GHG Emissions From Power Generation Facility - Simple Cycle
Reference Unit & Resource Requirements
Input Name Value Unit
Reference Unit ("RU") 1.0 MWh
NG Requirements / RU:
NG Requirements / RU -
Turbines 210.9 kg/MWh
NG Requirements / RU -
Auxiliary Boiler 0.248 kg/MWh
Total NG Requirements / RU 211.2 kg/MWh
Key Assumptions & Inputs For Power Generation Step
Input Name Value Unit
Capacity Factor - Plant 85.0% fraction
Net Power Output 359.9 MW-net
Natural Gas Flowrate 75,901.0 kg/hour
CO2 EF For Turbines 560.0 kg/MWh
Capacity Factor - Auxiliary Boiler 7.5% fraction
NG Fuel Use - Auxiliary Boiler 1,010 kg/hour
Auxiliary Boiler EFs:
CO2 2.86 kg/kg NG
CH4 5.48×10⁻⁵ kg/kg NG
N2O 1.52×10⁻⁵ kg/kg NG
GHG Emissions (kg / MWh)
Emission Source CO2 - Eq CO2 CH4 N2O
Combusted:
Turbines 560.0 560.0
Auxiliary Boiler 0.709 0.708 1.36×10⁻⁵ 3.77×10⁻⁶
Total Emissions: 560.7 560.7 1.36×10⁻⁵ 3.77×10⁻⁶

Proprietary & Confidential Page 63
CHAPTER 10 – COUNTRY-LEVEL RESULTS FOR COAL LIFE CYCLE GHG
EMISSIONS
This chapter provides a detailed overview of the calculated estimated emissions for the coal life cycle analysis used in this study. The coal life cycle encompasses coal extraction, transportation, and end-use combustion for power generation for both an existing coal-fired power plant and an efficient new-build coal-fired power plant. Coal life cycle emissions were estimated for China, India, Western Europe (represented by Germany), Japan, and South Korea. This chapter is structured to examine the stages in the coal life cycle by each stated country or region. A detailed overview of the different coal life cycle stages is included in the Coal Life Cycle Analysis section of Chapter 2– Introduction.
WESTERN EUROPE
GHG Emissions from Coal Mining
Germany was selected to serve as a proxy for Western Europe as it is the leading coal-consuming country in the region and specificity was needed to develop assumptions for the coal supply chain. According to statistics from Euracoal, 25.7 percent of Germany’s gross power generation was from lignite and 18.5 percent from hard coal for the year 2012 (Euracoal). While the number of surface and underground mines is equal (each numbering eight), approximately 90 percent of domestic production is from surface mines (Statistik, 2007). Lignite production is centered in four mining regions, namely the Rhineland region around Cologne; the Lusatian mining area in south-eastern Brandenburg and north-eastern Saxony; the Central German mining area of south-eastern Saxon; and the Helmstedt mining area in Lower Saxony (Statistik, 2007), as shown in Exhibit 10-1 below. Exhibit 10-1: German Coal Mining Map
Source: Euracoal, 2011.

Proprietary & Confidential Page 64
Based on a mining emissions factor of 0.009 tonne CO2/MWh (NREL, 1999) and a fugitive emissions factor of 0.0008 tonne CH4 per tonne of coal production (IPCC), Pace Global estimated the total GHG emissions from coal extraction/mining in Germany to be 0.030 tonnes CO2-e/MWh.
GHG Emissions from Transport
As the majority of German coal consumption is mined domestically, GHG emissions were estimated from the transport of coal from an indicative mine site located near Leipzig, Saxony to the 250-300 MW capacity “Jänschwalde" coal-fired power plant in Brandenburg (Vattenfall) for consumption in the Cottbus region. The transport distance from the mine site to the power plant was calculated to be 377 kilometers (km) round-trip and assumed to be via diesel-powered rail, with the distance from the power plant to the average end-user estimated at approximately 29 km and assumed to be via heavy-duty truck. This resulted in estimated rail emissions of 0.0096 tonnes CO2-e/MWh and estimated truck emissions of 0.0264 tonnes CO2-e/MWh, based on a rail transport emission factor of 0.3 kgCO2/tonne-km and a truck emission factor of 1.072 kgCO2/tonne-km (GHG Protocol (WRI), 2005). These transport emission factors were also used for the other countries in this analysis.
GHG Emissions from Coal Use in Power Generation
Based on data from the IEA WEO 2014, Pace Global estimated German coal-fired power plant emissions to be approximately 1.005 tonnes CO2-e/MWh per year. For comparison purposes, GHG emissions from a more efficient, new-build power plant are shown below in Exhibit 10-2. Power generation and associated emissions from the assumed new-build plant were modeled by Pace Global using the Steam Pro module of the Thermoflow™ software suite.

Proprietary & Confidential Page 65
Exhibit 10-2: Estimate of GHG Emissions from New-Build Power Plant (Western Europe)
Source: Pace Global based on referenced sources.
Total GHG Emissions – Western Europe (Installed and New-Build Plants)
Exhibit 10-3: Total Emissions - Germany
Source: Pace Global based on referenced sources.
Western Europe (representative new plant)
Coal Needed to Generate 1 MWh Data Unit
heat rate (new plant) 9,723 Btu/kWh coal calorific value 5,151 Btu/lb
Coal Needed to Generate 1 MWh 0.856 tonnes coal
Coal Extraction/Mining
mining emission factor 0.0090 tonnes CO2/MWh
mining fugitive emission factor 0.0008 tonnes CH4/tonnes coal production
post-mining fugitive methane emission factor 0.0001 tonnes CH4/tonnes coal production
Total Emissions - Coal Extraction/Mining 0.0301 tonnes CO2-e/MWh
Coal Transportation
rail emission factor 0.03 kgCO2/tonne-km
truck emission factor 1.072 kgCO2/tonne-km
rail emissions 0.0097 tonnes CO2-e/MWh
truck emissions 0.0266 tonnes CO2-e/MWh
Total Emissions - Coal Transportation 0.0363 tonnes CO2-e/MWh
Power Generation (representative new plant)
coal combustion emission factor 0.884 tonnes CO2-e/MWh
Total Emissions - Coal Combustion 0.884 tonnes CO2-e/MWh
Total Emissions 0.950 tonnes CO2-e/MWh
Germany (installed plant) 1.071 tonnes CO2-e/MWh
Germany (new-build plant) 0.950 tonnes CO2-e/MWh

Proprietary & Confidential Page 66
CHINA
Coal Mining Emissions
As with Germany, the majority of coal consumed in China is sourced domestically (EIA, 2013), with approximately 90 percent coming from underground mines (The World Security Institute, 2007). Bituminous coal is the main type of coal produced (EIA, 2013). China’s bituminous coal has a much higher calorific value (Btu/lb) than does Germany’s average lignite and hard coal. Using assumptions for underground mining and associated fugitive emissions from the IPCC and the Journal of Industrial Engineering and Management, Pace Global estimated the total GHG emissions from coal extraction/mining in China to be 0.2318 tonnes CO2-e/MWh (Journal of Industrial Engineering and Management, 2014; IPCC, Guidelines for National Greenhouse Gas Inventories, 2006). The calculated emissions are inclusive of mining emissions and mining and post-mining fugitive emissions, and are based on a mining emissions factor of 0.0503 tonnes CO2/MWh (Journal of Industrial Engineering and Management, 2014), a fugitive emissions factor of 0.0115 tonnes CH4 per tonne of coal production (IPCC), and a post-mining fugitive emission rate of 0.0016 tonnes CH4 per tonne of coal production
GHG Emissions from Transport
As shown in Exhibit 10-4 below, the main coal-producing regions in China are located in the north, distant from the main metropolitan regions located on the east coast. Given the significant distance from production region to the average end-user, coal transport was first assumed to occur from the mine site to an indicative transfer point, and from the transfer point for end-use consumption in power generation. The transport distance from the mine site to the transfer point was calculated to be 334 km round-trip. Coal transport to that transfer point is assumed to be via diesel-powered heavy-duty truck. The distance from the transfer point to the average power plant end-user is estimated at approximately 3,038 km round-trip; that segment of coal transport is assumed to be via rail.
10 For the purposes of this analysis, a
Shenhua Group-operated mine located in Baorixile (also spelled Bao Ri Xi Le Lu), Inner Mongolia was taken as the ‘average’ mine, with a transport point located at Manzhouli, Inner Mongolia,
11 and end-use
consumption assumed to be at the Shijingshan Power Station located in the Beijing metropolitan area. This resulted in estimated rail emissions of 0.0421 tonnes CO2-e/MWh and estimated truck emissions of 0.1652 tonnes CO2-e/MWh based on the transport emission factors described earlier in this report. Notably, the Chinese government plans to produce as much as 50 percent of domestic coal-fired electricity at plants located near the mouths of the coal mines, which could reduce GHG emissions from the transport segment substantially (Scientific American, 2011), neglecting the negative life cycle emissions impact of power losses in transmission from the power plants in the north of China to the main power consumers on the east coast.
10
While China transported 1.7 billion tonnes coal (or approximately 45 percent of the country’s total output) of in 2011, the government has set a plan to achieve 3 billion tonnes of rail coal transporting capacity by the end of 2015 period, making rail the main mode of transport (National Bureau of Statistics of China). 11
According to Scientific American, Inner Mongolia became China's top coal producer in 2009 and is on track to provide about one-quarter of domestic supply by 2015 (Scientific American, 2011).

Proprietary & Confidential Page 67
Exhibit 10-4: China Coal Mining Map and Transportation Bottlenecks
Source: Deutsche Bank.
GHG Emissions from Coal Use in Power Generation
Based on data from the IEA’s 2014 World Energy Outlook, Pace Global estimated power plant emissions from the average installed coal-fired power plant in China to be 1.060 tonnes CO2/MWh. For comparison purposes, GHG emissions from a more efficient, new-build power plant are shown below in Exhibit 10-5. Power generation and associated emissions from the assumed new-build plant were modeled by Pace Global using the Steam Pro module of the Thermoflow™ software suite.

Proprietary & Confidential Page 68
Exhibit 10-5: Estimate of GHG Emissions from New-Build Power Plant (China)
China (representative new plant)
Coal Needed to Generate 1 MWh Data Unit
heat rate (new plant) 8,298 Btu/kWh coal calorific value 10,508 Btu/lb Coal Needed to Generate 1 MWh 0.358 tonnes coal
Coal Extraction/Mining
mining emission factor 0.0503 tonnes CO2/MWh
mining fugitive emission factor 0.0115 tonnes CH4/tonne coal production
post-mining fugitive methane emission factor 0.0016 tonnes CH4/tonne coal production
Total Emissions Coal Extraction/Mining 0.1912 tonnes CO2-e/MWh
Coal Transportation
truck emission factor 1.072 kgCO2/tonne-km
rail emission factor 0.0300 kgCO2/tonne-km
truck emissions 0.1282 tonnes CO2-e/MWh
rail emissions 0.0326 tonnes CO2-e/MWh
Total Emissions Coal Transportation 0.1608 tonnes CO2-e/MWh
Power Generation (representative new plant)
coal combustion emission factor 0.806 tonnes CO2-e/MWh
Total Emissions Coal Combustion 0.806 tonnes CO2-e/MWh
Total Emissions 1.158 tonnes CO2-e/MWh
Source: Pace Global based on referenced sources.
Total GHG Emissions – China (Installed and New-Build Plants)
Exhibit 10-6: Total Emissions - China
Source: Pace Global based on referenced sources.
China (installed plant) 1.499 tonnes CO2-e/MWh
China (new-build plant) 1.158 tonnes CO2-e/MWh
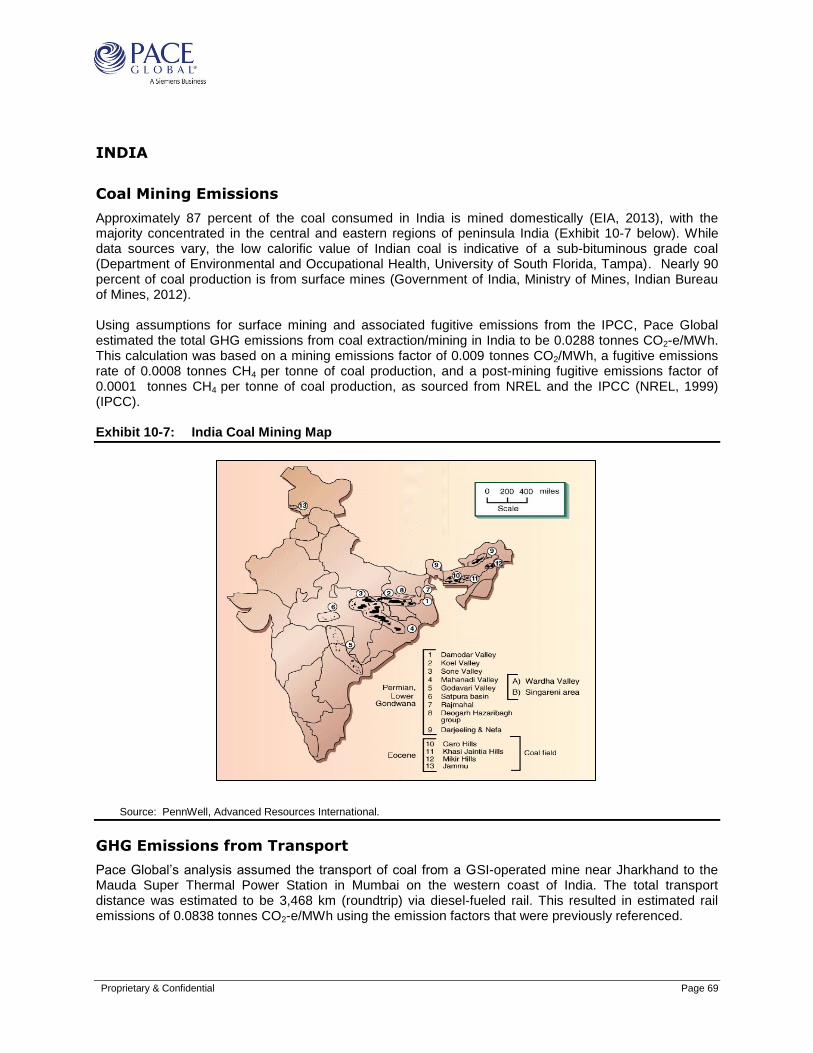
Proprietary & Confidential Page 69
INDIA
Coal Mining Emissions
Approximately 87 percent of the coal consumed in India is mined domestically (EIA, 2013), with the majority concentrated in the central and eastern regions of peninsula India (Exhibit 10-7 below). While data sources vary, the low calorific value of Indian coal is indicative of a sub-bituminous grade coal (Department of Environmental and Occupational Health, University of South Florida, Tampa). Nearly 90 percent of coal production is from surface mines (Government of India, Ministry of Mines, Indian Bureau of Mines, 2012). Using assumptions for surface mining and associated fugitive emissions from the IPCC, Pace Global estimated the total GHG emissions from coal extraction/mining in India to be 0.0288 tonnes CO2-e/MWh. This calculation was based on a mining emissions factor of 0.009 tonnes CO2/MWh, a fugitive emissions rate of 0.0008 tonnes CH4 per tonne of coal production, and a post-mining fugitive emissions factor of 0.0001 tonnes CH4 per tonne of coal production, as sourced from NREL and the IPCC (NREL, 1999) (IPCC). Exhibit 10-7: India Coal Mining Map
Source: PennWell, Advanced Resources International.
GHG Emissions from Transport
Pace Global’s analysis assumed the transport of coal from a GSI-operated mine near Jharkhand to the Mauda Super Thermal Power Station in Mumbai on the western coast of India. The total transport distance was estimated to be 3,468 km (roundtrip) via diesel-fueled rail. This resulted in estimated rail emissions of 0.0838 tonnes CO2-e/MWh using the emission factors that were previously referenced.

Proprietary & Confidential Page 70
GHG Emissions from Coal Use in Power Generation
Based on data from the IEA’s 2014 World Energy Outlook, average emissions for the installed coal-fired power plant fleet in India were estimated to be 1.116 tonnes CO2/MWh. For comparison purposes, GHG emissions from a more efficient, new-build power plant are shown below in Exhibit 10-8. Power generation emissions from the assumed new-build plant were modeled by Pace Global using the Thermoflow™ software suite.
Exhibit 10-8: Estimate of GHG Emissions from New-Build Power Plant (India)
India (representative new plant)
Coal Needed to Generate 1 MWh Data Unit
heat rate (new plant) 8,818 Btu/kWh
coal calorific value 6,720 Btu/lb
Coal Needed to Generate 1 MWh 0.595 tonnes coal
Coal Extraction/Mining
mining emissions factor 0.0090 tonnes CO2/MWh
mining fugitive emission factor 0.0008 tonnes CH4/tonne coal production
post-mining fugitive methane emission factor 0.0001 tonnes CH4/tonne coal production
Total Emissions Coal Extraction/Mining 0.0237 tonnes CO2-e/MWh
Coal Transportation
rail emission factor 0.03 kgCO2/tonne-km
rail emissions 0.0619 tonnes CO2-e/MWh
Total Emissions Coal Transportation 0.0619 tonnes CO2-e/MWh
Power Generation (representative new plant)
coal combustion emission factor 0.784 tonnes CO2-e/MWh
Total Emissions Coal Combustion 0.784 tonnes CO2-e/MWh
Total Emissions 0.870 tonnes CO2-e/MWh
Source: Pace Global based on referenced sources.
Total GHG Emissions – India (Installed and New-Build Plants)
Exhibit 10-9: Total Emissions - India
Source: Pace Global, based on referenced sources.
India (installed plant) 1.279 tonnes CO2-e/MWh
India (new-build plant) 0.870 tonnes CO2-e/MWh

Proprietary & Confidential Page 71
JAPAN AND SOUTH KOREA
Coal Mining Emissions
Both Japan and South Korea are nearly 100 percent dependent on coal imports, with Australia being the primary source of coal supply. For both countries, Pace Global estimated mining emissions from an indicative surface mine (World Coal Institute, 2005) in New South Wales (NWS)
12 producing bituminous
coal. Using assumptions for surface mining and associated fugitive emissions from the IPCC and NERL, Pace Global estimated total GHG emissions from coal extraction/mining to be 0.0178 tonnes CO2-e/MWh in Japan and 0.0188 tonnes CO2-e/MWh in South Korea. As Japan was assumed to have a lower installed average coal plant heat rate of 9,000 Btu/kWh (versus 10,000 Btu/kWh for South Korea), the resulting GHG emissions were lower. Exhibit 10-10: Australian Coal Mining Map
Source: Australian Government, Department of Resources, Energy and Tourism.
GHG Emissions from Transport
Australian coal exports for both Japan and South Korea were assumed to be sourced from Peabody's Wilpinjong Mine in NWS for rail transport to the Port of Newcastle, also in NSW, for a total distance of 694 km roundtrip. (For reference, the Port of Newcastle is the largest bulk shipping port on the east coast of Australia and the world's leading coal export port). From Newcastle, the coal is transported via ocean-going carrier approximately 7,712 km (each way) to the Port of Chiba, Japan and 8,246 km (each way) to the Port of Incheon, South Korea. Additional in-country land transport is assumed to be 102 km roundtrip
12
New South Wales and Queensland together provide 97 percent of Australia’s saleable output of black coal (World Energy Council , 2013).
Proprietary & Confidential Page 72
from the power plant in Chiba and 53 km roundtrip from the Port of Incheon for end-use consumption in the Tokyo and Seoul Metropolitan Areas, respectively. These assumptions resulted in estimated emissions of 0.3774 tonnes CO2-e/MWh for Japan and 0.4242 tonnes CO2-e/MWh for South Korea.
GHG Emissions from Coal Use in Power Generation
Based on data from the IEA’s 2014 World Energy Outlook, emissions for a typical installed power plant in Japan were estimated to be 0.909 tonnes CO2/MWh. As data points specific to South Korea were not available, Pace Global estimated the total emissions from combustion at 0.949 tonnes CO2/MWh. This represents the global average for OECD Asia as sourced from the IEA.

Proprietary & Confidential Page 73
Exhibit 10-11: Estimate of GHG Emissions from New-Build Power Plant (Japan)
Japan (representative new plant)
Coal Needed to Generate 1 MWh Data Unit
heat rate (new plant) 8,391 Btu/kWh
coal calorific value 11,417 Btu/lb
Coal Needed to Generate 1 MWh 0.333 tonnes coal
Coal Extraction / Mining
mining emissions factor 0.0090 tonnes CO2/MWh
mining fugitive emission factor 0.0008 tonnes CH4/tonne coal production
post-mining fugitive methane emission factor 0.0001 tonnes CH4/tonne coal production
Total Emissions Coal Extraction/Mining 0.0172 tonnes CO2-e/MWh
Coal Transportation
rail emission factor 0.03 kgCO2/tonne-km
vessel emission factor 0.06 kgCO2/tonne-km
truck emission factor 1.072 kgCO2/tonne-km
rail emissions 0.0069 tonnes CO2-e/MWh
vessel emissions 0.3085 tonnes CO2-e/MWh
truck emissions 0.0364 tonnes CO2-e/MWh
Total Emissions Coal Transportation 0.3519 tonnes CO2-e/MWh
Power Generation (representative new plant)
coal combustion emission factor 0.748 tonnes CO2-e/MWh
Total Emissions Coal Combustion 0.748 tonnes CO2-e/MWh
Total Emissions 1.117 tonnes CO2-e/MWh
Source: Pace Global based on referenced sources.

Proprietary & Confidential Page 74
Exhibit 10-12: Estimate of GHG Emissions from New-Build Power Plant (South Korea)
South Korea (representative new plant)
Coal Needed to Generate 1 MWh Data Unit
heat rate (new plant) 8,391 Btu/kWh
coal calorific value 11,417 Btu/lb
Coal Needed to Generate 1 MWh
0.333 tonnes coal
Coal Extraction/Mining
mining emissions factor 0.0090 tonne CO2/MWh
mining fugitive emission rate 0.0008 tonnes CH4/tonne coal production
post-mining fugitive methane emission rate 0.0001 tonnes CH4/tonne coal production
Total Emissions Coal Extraction/Mining 0.0172 tonnes CO2-e/MWh
Coal Transportation
rail emission factor 0.03 kgCO2/tonne-km
vessel emission factor 0.06 kgCO2/tonne-km
truck emission factor 1.072 kgCO2/tonne-km
rail emissions 0.0069 tonnes CO2-e/MWh
vessel emissions 0.3299 tonnes CO2-e/MWh
truck emissions 0.0095 tonnes CO2-e/MWh
Total Emissions Coal Transportation 0.3464 tonnes CO2-e/MWh
Power Generation (representative new plant)
coal combustion emission factor 0.748 tonnes CO2-e/MWh
Total Emissions Coal Combustion 0.748 tonnes CO2-e/MWh
Total Emissions 1.112 tonnes CO2-e/MWh
Source: Pace Global based on reference sources.
Total GHG Emissions – Japan and South Korea (Installed and New-Build Plants)
Exhibit 10-13: Total Emissions - Japan and South Korea (Installed Plant)
Source: Pace Global based on reference sources.
Japan (installed plant) Japan (new-build plant)
1.304 1.117
tonnes CO2-e/MWh tonnes CO2-e/MWh
South Korea (installed plant) South Korea (new-build plant)
1.391 1.112
tonnes CO2-e/MWh tonnes CO2-e/MWh

Proprietary & Confidential Page 75
CHAPTER 11 – CONCLUSION
In conducting this life cycle assessment, Pace Global interacted with a number of industry stakeholders, examined publically available data sources, and undertook in-house modelling to capture the most up-to-date and accurate information on the specific processes analyzed. Below is a detailed summary of the methodology used and the results obtained for both the LNG and coal LCAs.
LNG LIFE CYCLE EMISSIONS ASSESSMENT
The LNG LCA examined total GHG emissions from the entire LNG supply chain through to the production of electricity at a natural gas-fired power generation plant. The source of the raw natural gas was assumed to be a typical natural gas well in the state of Texas that has a low percentage of liquids and requires horizontal drilling and hydraulic fracturing. Several liquefaction, LNG shipping, and regasification design options and technologies were considered to create a range of possible GHG emissions results that could arise from these segments in the LNG life cycle analysis. Both simple cycle and combined cycle power generation plants were analyzed for the power generation segment. Each segment in the LNG LCA was analyzed independently of one another to provide GHG emission rates on a unit of reference flow basis (i.e., the liquefaction segment was analyzed on a mass unit of GHG emissions per mass unit of liquefied gas). After the individual segments were analyzed, Pace Global integrated the analysis to standardize GHG emissions on a unit of MWh produced basis. This process requires understanding how much gas is lost or used at each stage of the LNG LCA. For each stage in the life cycle, the more gas that is required in subsequent stages will necessitate more gas to flow through each preceding stage, resulting in higher GHG emissions per MWh of electricity regardless of the GHG emission rate per unit of reference flow. For example, in this study there is no difference in the GHG emission rate per unit of reference flow during the transportation to the liquefaction plant stage. However, the high GHG case assumes a liquefaction process that requires more feed gas than the liquefaction process assumed in the low GHG case. Thus, more natural gas must flow through the pipeline to get to the liquefaction plant, resulting in more GHG emissions in the context of producing 1 MWh of electricity. Exhibit 1-4, presented in Chapter 1– Executive Summary, provides the results of natural gas loss and use over the entire life cycle analysis for the low and high GHG cases, as well as the mass of gas required to exit each stage before entering the gate of the subsequent stage in order for one MWh to be produced. As previously stated, multiple technologies were evaluated for several of the segments in the LNG LCA. Using these results, a low GHG case and a high GHG case were created to present the range of potential GHG emissions. Summary results of the LNG LCA are presented in Exhibit 11-1 below. While the power generation segment produced the majority of GHG emissions, it is clear that the various processing and transportation segments contribute a substantial amount of GHG emissions over the LNG life cycle. The LNG processing segments (separate from the feed gas processing segments), which include liquefaction and regasification, account for 12.4 percent and 16.0 percent of total GHG emissions in the low GHG case and high GHG case, respectively. The transportation segments, which include pipeline transportation to the liquefaction plant, LNG shipping and pipeline transport to the power plant, account for 10.2 percent and 13.4 percent of total GHG emissions in the low GHG case and high GHG case, respectively. The results of the LNG LCA are dependent on a wide array of assumptions as referenced throughout this report. This analysis is particularly sensitive to GHG emission factors and emission rates presented in EPA published reports. The assumed technologies used for the various processing stages, such as whether the liquefaction facility includes an NGL recovery unit and/or waste heat recovery, also have a substantial impact on total life cycle GHG emissions. The analysis concludes that the high GHG case

Proprietary & Confidential Page 76
results in 13.4 percent more GHG emissions than the low case. This range in life cycle emissions is evidence of the potential sensitivities inherent in any detailed LNG LCA analysis. Exhibit 11-1: Summary of GHG Emissions from the LNG LCA
Source: Pace Global.
COAL LIFE CYCLE EMISSIONS ASSESSMENT
As with the LNG LCA, the coal assessment examined total GHG emissions from the entire coal life cycle, from mining to cross-country land transport within the country of the coal’s origin, export via ocean-vessel ships (where relevant), and as final use in power generation. Fugitive emissions from mining and post-mining activities were also considered. The coal-fired power plant emissions for each region or country
73.9%
5.2%
0.2%
3.3%
7.2%
1.8%
5.0%
0.0%
3.0%
0.4%
66.7%
4.7%
0.4%
6.8%
10.1%
1.9%
5.5%
0.0%
3.3%
0.5%
0.0% 10.0% 20.0% 30.0% 40.0% 50.0% 60.0% 70.0% 80.0%
Power Generation
Transport (To Power Gen)
Regasification
Shipping
Liquefaction
Transport (To Liquefaction)
Processing - All Other
Processing - Dehydration
Extraction
Well Drilling
GHG Emissions By Phase (Percent Of Total)
High Case
Low Case
Low GHG Case High GHG Case
Phase of LCA
CO2-e
(tonnes/MWh) % Of Total
CO2-e
(tonnes/MWh)
% Of
Total
Well Drilling 2.05×10⁻³ 0.4% 2.48×10⁻³ 0.5%
Extraction 1.50×10⁻² 3.0% 1.82×10⁻² 3.3%
Processing - Dehydration 8.51×10⁻⁵ 0.0% 1.03×10⁻⁴ 0.0%
Processing - All Other 2.47×10⁻² 5.0% 2.99×10⁻² 5.5%
Transport (To Liquefaction) 8.78×10⁻³ 1.8% 1.06×10⁻² 1.9%
Liquefaction 3.55×10⁻² 7.2% 5.53×10⁻² 10.1%
Shipping 1.61×10⁻² 3.3% 3.72×10⁻² 6.8%
Regasification 7.49×10⁻⁴ 0.2% 2.38×10⁻³ 0.4%
Transport (To Power Gen) 2.57×10⁻² 5.2% 2.57×10⁻² 4.7%
Power Generation 0.365 73.9% 0.365 66.7%
Total: 0.494 100.0% 0.547 100.0%
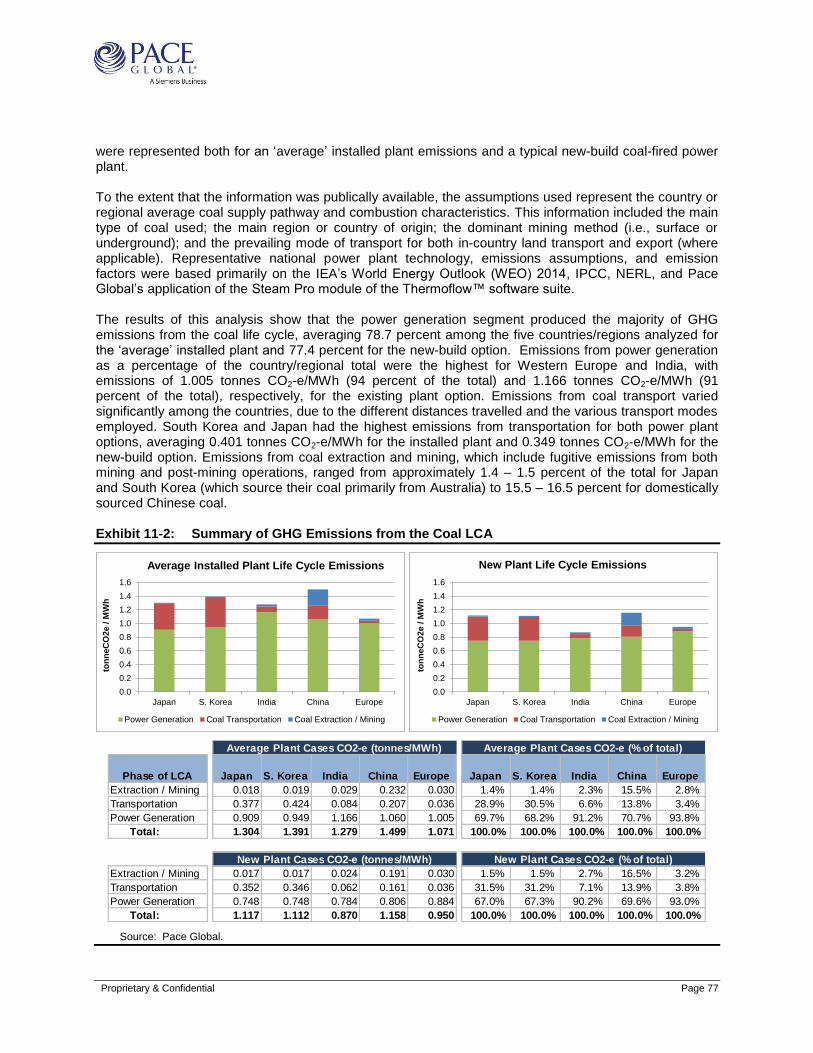
Proprietary & Confidential Page 77
were represented both for an ‘average’ installed plant emissions and a typical new-build coal-fired power plant. To the extent that the information was publically available, the assumptions used represent the country or regional average coal supply pathway and combustion characteristics. This information included the main type of coal used; the main region or country of origin; the dominant mining method (i.e., surface or underground); and the prevailing mode of transport for both in-country land transport and export (where applicable). Representative national power plant technology, emissions assumptions, and emission factors were based primarily on the IEA’s World Energy Outlook (WEO) 2014, IPCC, NERL, and Pace Global’s application of the Steam Pro module of the Thermoflow™ software suite. The results of this analysis show that the power generation segment produced the majority of GHG emissions from the coal life cycle, averaging 78.7 percent among the five countries/regions analyzed for the ‘average’ installed plant and 77.4 percent for the new-build option. Emissions from power generation as a percentage of the country/regional total were the highest for Western Europe and India, with emissions of 1.005 tonnes CO2-e/MWh (94 percent of the total) and 1.166 tonnes CO2-e/MWh (91 percent of the total), respectively, for the existing plant option. Emissions from coal transport varied significantly among the countries, due to the different distances travelled and the various transport modes employed. South Korea and Japan had the highest emissions from transportation for both power plant options, averaging 0.401 tonnes CO2-e/MWh for the installed plant and 0.349 tonnes CO2-e/MWh for the new-build option. Emissions from coal extraction and mining, which include fugitive emissions from both mining and post-mining operations, ranged from approximately 1.4 – 1.5 percent of the total for Japan and South Korea (which source their coal primarily from Australia) to 15.5 – 16.5 percent for domestically sourced Chinese coal. Exhibit 11-2: Summary of GHG Emissions from the Coal LCA
Source: Pace Global.
0.0
0.2
0.4
0.6
0.8
1.0
1.2
1.4
1.6
Japan S. Korea India China Europe
ton
ne
CO
2e /
MW
h
Average Installed Plant Life Cycle Emissions
Power Generation Coal Transportation Coal Extraction / Mining
0.0
0.2
0.4
0.6
0.8
1.0
1.2
1.4
1.6
Japan S. Korea India China Europe
ton
ne
CO
2e /
MW
h
New Plant Life Cycle Emissions
Power Generation Coal Transportation Coal Extraction / Mining
Average Plant Cases CO2-e (tonnes/MWh) Average Plant Cases CO2-e (% of total)
Phase of LCA Japan S. Korea India China Europe Japan S. Korea India China Europe
Extraction / Mining 0.018 0.019 0.029 0.232 0.030 1.4% 1.4% 2.3% 15.5% 2.8%
Transportation 0.377 0.424 0.084 0.207 0.036 28.9% 30.5% 6.6% 13.8% 3.4%
Power Generation 0.909 0.949 1.166 1.060 1.005 69.7% 68.2% 91.2% 70.7% 93.8%
Total: 1.304 1.391 1.279 1.499 1.071 100.0% 100.0% 100.0% 100.0% 100.0%
New Plant Cases CO2-e (tonnes/MWh) New Plant Cases CO2-e (% of total)
Extraction / Mining 0.017 0.017 0.024 0.191 0.030 1.5% 1.5% 2.7% 16.5% 3.2%
Transportation 0.352 0.346 0.062 0.161 0.036 31.5% 31.2% 7.1% 13.9% 3.8%
Power Generation 0.748 0.748 0.784 0.806 0.884 67.0% 67.3% 90.2% 69.6% 93.0%
Total: 1.117 1.112 0.870 1.158 0.950 100.0% 100.0% 100.0% 100.0% 100.0%

Proprietary & Confidential Page 78
The results of the LNG and coal life cycle emissions assessments are dependent on a wide array of assumptions, as referenced throughout this report. This analysis is particularly sensitive to GHG emission factors and emission rates presented by the EPA, IPCC, NERL, and GHG protocol, among others. Importantly, outcome uncertainty is inherent in an LCA study of this breadth of scope due to the wide variety of data and analytical inputs. Actual GHG emissions for both the LNG and coal analysis can vary substantially depending (inter alia) on the specific power plant, coal mine, LNG technology, transport mode, and destination market being analyzed.

Proprietary & Confidential B-1
REFERENCES
API. (2009). Compendium of Greenhouse Gas Emissions for the Oil and Natural Gas Industry. American
Petroleum Institute. Arnold. (1999). Surface Production Operations: Design Of Gas-Handling Systems And Facilities.
Houston, TX: Gulf Professional Publishing. Australian Government, Department of Sustainability, Environment, Water, Population, and Communities
for Mining. (2012). National Pollutant Inventory Emission Estimation Technique Manual for Mining, Version 3.1.
Dennis. (2005). Improved Estimates Of Ton Miles. Bureau of Transportation Statistics. Washington, D.C.: Journal of Transportation Statistics. Vol. 8, Issue 1.
Department of Environmental and Occupational Health, University of South Florida, Tampa. (n.d.). Estimates of Emissions from Coal Fired Thermal Power Plants in India .
DOE. (2014, December 18). Summary of LNG Export Applications. Retrieved from Energy.GOV Office Of Fossil Energy: http://energy.gov/sites/prod/files/2015/01/f19/Summary%20of%20LNG%20Export%20Applications.pdf
EIA. (2007a). Natural Gas Compressor Stations On The Interstate Pipeline Network: Developments Since 1996. Washington, D.C.: U.S. Department of Energy, Energy Information Administration.
EIA. (2007b). Fuel Emission Factors (From Appendix H Of The Instructions To Form Eia-1605). Washington, D.C.: U.S. Department of Energy, Energy Information Administration.
EIA. (2009a). Data Series: Nonhydrocarbon Gases Removed, Natural Gas Gross Withdrawals And Production. Washington, D.C.: U.S. Department of Energy, Energy Information Administration.
EIA. (2009b). Data Series: Dry Production, Natural Gas Gross Withdrawals And Production. Washington, D.C.: U.S. Department of Energy, Energy Information Administration.
EIA. (2009c). Data Series: Gross Withdrawals From Gas Wells, Natural Gas Gross Withdrawals And Production. Washington, D.C.: U.S. Department of Energy, Energy Information Administration.
EIA. (2009d). United States Total 2008: Distribution Of Wells By Production Rate Bracket. Washington, D.C.: U.S. Department of Energy, Energy Information Administration.
EIA. (2009e). Natural Gas Gross Withdrawals And Production. Washington, D.C.: U.S. Department of Energy, Energy Information Administration.
EIA. (2009f). Electric Power Monthly (March 2009). Washington, D.C.: U.S. Department of Energy, Energy Information Administration.
EIA. (2011a). Annual Energy Review. Appendix A: Thermal Conversion Factors. Washington, D.C.: U.S. Department of Energy, Energy Information Administration.
EIA. (2011b). Natural Gas Consumption By End Use (June 2011). Washington, D.C.: U.S. Department of Energy, Energy Information Administration.
EIA. (2013). Country Analysis. EPA. (1995). Compilation Of Air Pollutant Emission Factors, Volume I: Stationary Point And Area
Sources, Ap-42. Washington, D.C.: U.S. Environmental Protection Agency. EPA. (2006). Replacing Glycol Dehydrators With Desiccant Dehydrators. Washington, D.C.: U.S.
Environmental Protection Agency. EPA. (2007). Nonroad Diesel Equipment. Washington, D.C.: U.S. Environmental Protection Agency. EPA. (2010a). Inventory Of Greenhouse Gas Emissions And Sinks: 1990-2008. Washington, D.C.: U.S.
Environmental Protection Agency. EPA. (2010b). eGrid 9Th Edition Version 10 Year 2010 GHG Annual Output Emission Rates.
Washington, D.C.: U.S. Environmental Protection Agency. EPA. (2011). Greenhouse Gas Emissions Reporting From The Petroleum And Natural Gas Industry;
Background Technical Support Document. Washington, D.C.: U.S. Environmental Protection Agency.
Proprietary & Confidential B-2
Euracoal. (n.d.). FERC. (2011). Form 2 & Form 2A - Major and Non-major Natural Gas Pipeline Annual Report: Data
(Current and Historical). Washington, D.C.: Federal Energy Regulatory Commission. Galvanic Applied Sciences, Inc. (n.d.). Sulfur Management Handbook. Retrieved April 2015, from
Galvanic: http://www.galvanic.com/Sulfurmeasurementhandbook(rev7).pdf GE Oil and Gas. (2005). Reciprocating Compressors. Florence, Italy: General Electric Company. GHG Protocol (WRI). (2005). Calculating CO2 Emissions from Mobile Sources. Government of India, Ministry of Mines, Indian Bureau of Mines. (2012). Indian Minerals Yearbook. Halliburton. (2004). API Casing Chart. Halliburton. Hedman, B. (2008). Waste Energy Recovery Opportunities for Interstate Natural Gas Pipelines. Interstate
Natural Gas Association of America. Houston Advanced Research Center. (2006). Natural Gas Compressor Engine Survey For Gas
Production And Processing Facilities, H68 Final Report. Houston, TX: Houston Advanced Research Center.
Hughes, D. (2014). Drilling Deeper. Post Carbon Institute. IEA. (2013). 21st Century Coal: Advanced Technology and Global Energy Solutions. IEA. (2013). IEA Insights Series report for the Coal Industry Advisory Board, 21st Century Coal:
Advanced Technology and Global Energy Solutions. IEA. (2013). Tracking Clean Energy Progress. IPCC. (1995). Second Assessment Report. IPCC. (2006). Guidelines for National Greenhouse Gas Inventories. IPCC. (2014). Climate Change 2014: Mitigation of Climate Change. Contribution of Working Group III to
the Fifth Assessment Report of the Intergovernmental Panel on Climate Change. Cambridge, United Kingdom and New York, NY, USA: Cambridge University Press.
IPCC. (n.d.). CH4 Emissions: Coal Mining and Handling. IPCC. (n.d.). CH4 Emissions: Coal Mining and Handling. IPCC. (n.d.). Guidelines for National Greenhouse Gas Inventories. Journal of Industrial Engineering and Management. (2014). An LCA Study of an Electricity Coal Supply
Chain. Journal of Industrial Engineering and Management. Kramer. (2010). ghg lll. NNNN. Kramer. (2010). LNG Life Cycle Analysis. GHG. LEVON Group. (2013). Consistent Methodology For Estimating Greenhouse Gas Emissions From
Liquefied Natural Gas (LNG) Operations. American Petroleum Institute. Louisiana DEQ. (2007). 2007 Certified Totals Of Criteria Pollutants For Louisiana. Baton Rouge, LA:
Louisiana Department of Environmental Quality. Lunsford, K. (2006). Optimization of Amine Sweetening Units. Bryan Research and Engineering. Myhre, G. D.-M.-F. (2013). : Anthropogenic and Natural Radiative Forcing. In: Climate Change 2013: The
Physical Science Basis. Contribution of Working Group I to the Fifth Assessment Report of the Intergovernmental Panel on Climate Change. Cambridge, United Kingdom and New York, NY, USA: Cambridge University Press.
National Bureau of Statistics of China. (n.d.). Nations, U. (n.d.). CGE Greenhouse Gas Inventory Framework Convection on Climate Change. NaturalGas.org. (2013, September 20). The Transportation of Natural Gas. Retrieved March 2015, from
NaturalGas.org: http://naturalgas.org/naturalgas/transport/ NETL. (2014). Life Cycle Analysis Of Natural Gas Extraction And Power Generation. Pittsburgh, PA:
National Energy Technology Laboratory. NETL/DOE. (2013). Cost And Performance Baseline For Fossil Energy Plants – Volume 1: Bituminous
Coal And Natural Gas To Electricity Final Report Revision 2A. Pittsburgh, PA: National Energy Technology Laboratory.
NREL. (1999). Life Cycle Assessment of Coal-fired Power Production. Polasek. (2006). Selecting Amines For Sweetening Units. Bryan Research and Engineering. Pring, & Baker. (2009). Drilling Rig Emission Inventory For The State Of Texas, Final Report. Austin, TX:
Eastern Research Group.

Proprietary & Confidential B-3
Reum, D., & al., e. (2008). Four-Blade Bit Helps Reduce Drilling Time By As Much As Half. World Oil, 85-89.
Scientific American. (2011, November 4). Retrieved March 2, 2015, from Scientific American: http://www.scientificamerican.com/article/where-coal-is-king-in-china/
Shires, T., & Lev-On, M. (2012). Characterizing Pivotal Sources of Methane Emissions from Unconventional Natural Gas Production: Summary and Analysis of API and ANGA Survey Responses. American Petroleum Institue.
Statistik. (2007). Stewart, E. (1994). Reduce Amine Plant Solvent Losses. Hydrocarbon Processing. Gulf Publishing. The Climate Registry. (2008). General Reporting Protocol. The World Security Institute. (2007). China Security, Vol. 3 No. 2, "China Coal Mining Safety". TOTAL S.A. (2006). Sour Gas: A History of Expertise. Paris, France: TOTAL S.A. UNFCCC. (n.d.). Greenhouse Gas Inventory Hands-on Training Workshop. Vattenfall. (n.d.). Wabash Power Equipment Co. (2010). Brochure For 40000 PPH Nebraska, Watertube, Trailer Mounted,
350 Psi, Gas/Oil. Wabash Power Equipment Co. website, W. C. (n.d.). World Coal Association website. (n.d.). World Coal Institute. (2005). The Coal Resource: A Comprehensive Overview of Coal. World Energy Council . (2013). World Energy Resources: Coal.

Proprietary & Confidential B-4
APPENDIX A – SUMMARY LIFE CYCLE GHG EMISSIONS ASSUMING
20-YEAR TIME HORIZON GWP FACTORS
This report uses published Global Warming Potential (GWP) metrics (IPCC, 2014) in order to standardize GHG emissions on a carbon dioxide equivalent (CO2-e) basis. This report uses GWP factors published in the IPCC Fifth Assessment Report based on a 100-year time horizon. In this section, summary life cycle GHG emissions are presented assuming GWP factors based on a 20-year time horizon. Exhibit A-1: 20-Year Time Horizon GWP Factors Utilized In This Study
GHG Value Unit
CO2 1 kg CO2-e/kg CO2
CH4 85 kg CO2-e/kg CH4
N2O 264 kg CO2-e/kg N2O
Source: IPCC, Fifth Assessment Report, 2013.
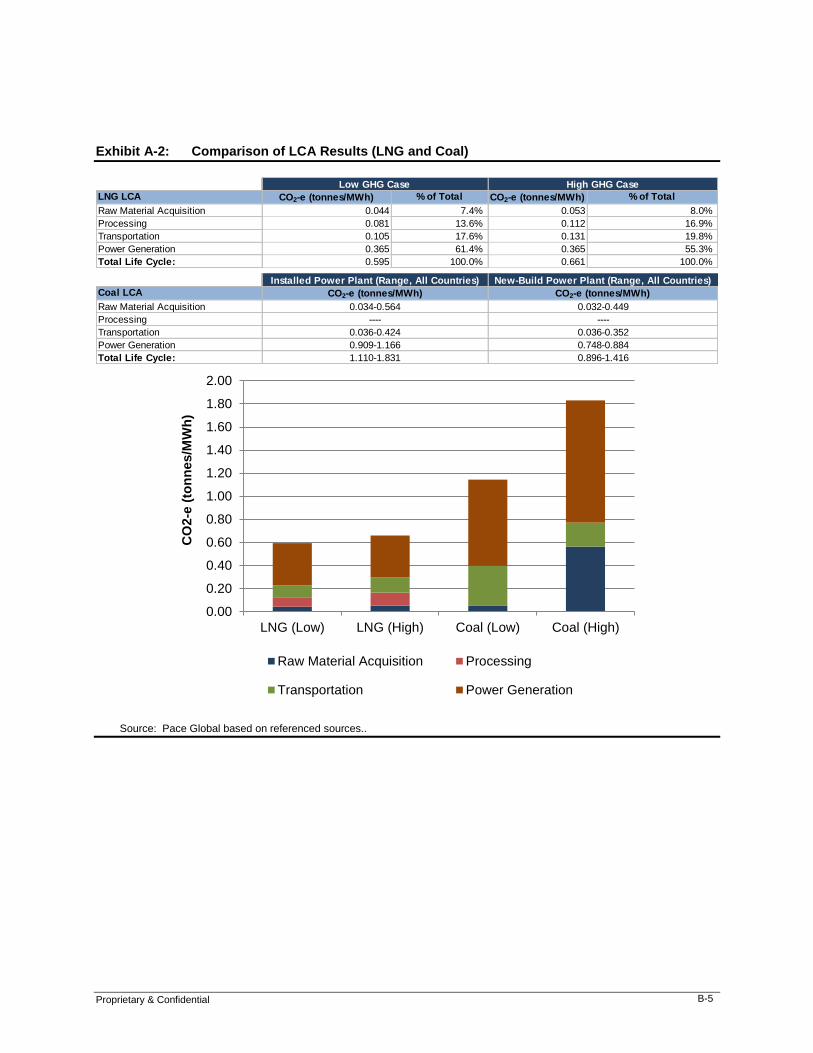
Proprietary & Confidential B-5
Exhibit A-2: Comparison of LCA Results (LNG and Coal)
Source: Pace Global based on referenced sources..
Low GHG Case High GHG Case
LNG LCA CO2-e (tonnes/MWh) % of Total CO2-e (tonnes/MWh) % of Total
Raw Material Acquisition 0.044 7.4% 0.053 8.0%
Processing 0.081 13.6% 0.112 16.9%
Transportation 0.105 17.6% 0.131 19.8%
Power Generation 0.365 61.4% 0.365 55.3%
Total Life Cycle: 0.595 100.0% 0.661 100.0%
New-Build Power Plant (Range, All Countries)
Coal LCA
Raw Material Acquisition
Processing
Transportation
Power Generation
Total Life Cycle: 1.110-1.831 0.896-1.416
---- ----
0.036-0.424 0.036-0.352
0.909-1.166 0.748-0.884
Installed Power Plant (Range, All Countries)
CO2-e (tonnes/MWh) CO2-e (tonnes/MWh)
0.034-0.564 0.032-0.449
0.00
0.20
0.40
0.60
0.80
1.00
1.20
1.40
1.60
1.80
2.00
LNG (Low) LNG (High) Coal (Low) Coal (High)
CO
2-e
(to
nn
es/M
Wh
)
Raw Material Acquisition Processing
Transportation Power Generation

Proprietary & Confidential B-6
Exhibit A-3: Summary of LNG LCA
Source: Pace Global based on referenced sources.
0.0E+00
1.0E-01
2.0E-01
3.0E-01
4.0E-01
5.0E-01
6.0E-01
7.0E-01
8.0E-01
9.0E-01
To
nn
es
CO
2 E
qu
iva
len
t P
er
MW
h
Low GHG Case High GHG Case
Low GHG Case High GHG Case
Phase of LCA
CO2-e
(tonnes/MWh) % Of Total
CO2-e
(tonnes/MWh)
% Of
Total
Well Drilling 2.05×10⁻³ 0.3% 2.49×10⁻³ 0.4%
Extraction 4.18×10⁻² 7.0% 5.07×10⁻² 7.7%
Processing - Dehydration 1.30×10⁻⁴ 0.0% 1.58×10⁻⁴ 0.0%
Processing - All Other 4.07×10⁻² 6.8% 4.94×10⁻² 7.5%
Transport (To Liquefaction) 2.26×10⁻² 3.8% 2.74×10⁻² 4.1%
Liquefaction 3.92×10⁻² 6.6% 5.98×10⁻² 9.0%
Shipping 1.61×10⁻² 2.7% 3.72×10⁻² 5.6%
Regasification 7.49×10⁻⁴ 0.1% 2.38×10⁻³ 0.4%
Transport (To Power Gen) 6.61×10⁻² 11.1% 6.61×10⁻² 10.0%
Power Generation 0.365 61.4% 0.365 55.3%
Total: 0.595 100.0% 0.661 100.0%

Proprietary & Confidential B-7
Exhibit A-4: Summary of GHG Emissions from the Coal LCA
Source: Pace Global based on referenced sources.
0.0
0.2
0.4
0.6
0.8
1.0
1.2
1.4
1.6
1.8
2.0
Japan S. Korea India China Europe
ton
neC
O2e /
MW
h
Average Plant Life Cycle Emissions
Power Generation Coal Transportation Coal Extraction / Mining
0.0
0.2
0.4
0.6
0.8
1.0
1.2
1.4
1.6
1.8
2.0
Japan S. Korea India China Europe
ton
neC
O2e /
MW
h
New Plant Life Cycle Emissions
Power Generation Coal Transportation Coal Extraction / Mining
Average Plant Cases CO2-e (tonnes/MWh) Average Plant Cases CO2-e (% of total)
Phase of LCA Japan
S.
Korea India China Europe Japan
S.
Korea India China Europe
Extraction / Mining 0.034 0.037 0.065 0.564 0.068 2.6% 2.6% 5.0% 30.8% 6.2%
Transportation 0.377 0.424 0.084 0.207 0.036 28.6% 30.1% 6.4% 11.3% 3.2%
Power Generation 0.909 0.949 1.166 1.060 1.005 68.8% 67.3% 88.7% 57.9% 90.6%
Total: 1.320 1.409 1.315 1.831 1.110 100.0% 100.0% 100.0% 100.0% 100.0%
New Plant Cases CO2-e (tonnes/MWh) New Plant Cases CO2-e (% of total)
Extraction / Mining 0.032 0.032 0.051 0.449 0.069 2.9% 2.9% 5.6% 31.7% 7.0%
Transportation 0.352 0.346 0.062 0.161 0.036 31.1% 30.7% 6.9% 11.4% 3.7%
Power Generation 0.748 0.748 0.784 0.806 0.884 66.1% 66.4% 87.5% 56.9% 89.4%
Total: 1.132 1.127 0.896 1.416 0.989 100.0% 100.0% 100.0% 100.0% 100.0%