Lloyds Bank plc Q3 2020 Interim Management Statement 29 ...
18
Lloyds Bank plc Q3 2020 Interim Management Statement 29 October 2020 REVIEW OF PERFORMANCE Income statement The Group's results have been significantly affected by the coronavirus pandemic and its impact upon the UK economy. During the nine months to 30 September 2020, the Group recorded a profit before tax of £620 million compared with a profit before tax in the nine months to 30 September 2019 of £2,562 million, a decrease of £1,942 million which was largely driven by a significantly increased impairment charge due to changes to the Group's economic outlook for the UK as a result of the coronavirus pandemic. Total income decreased by £1,695 million, or 13 per cent, to £11,234 million in the nine months to 30 September 2020 compared with £12,929 million in the nine months to 30 September 2019; there was an £827 million decrease in net interest income and a decrease of £868 million in other income. Net interest income was £8,326 million in the nine months to 30 September 2020, a decrease of £827 million, or 9 per cent, compared to £9,153 million in the nine months to 30 September 2019. The net interest margin reduced as a result of the lower rate environment, actions taken to support customers, including free overdrafts, and a change in asset mix, largely as a result of reduced levels of customer demand during the coronavirus pandemic. Average interest-earning assets were broadly stable with growth due to government-backed lending to support corporate customers through the coronavirus crisis and the full impact of the 2019 Tesco acquisition offset by lower balances in the closed mortgage book and credit cards, as well as the impact of the continued optimisation of the corporate and institutional book within Commercial Banking. Other income was £868 million, or 23 per cent, lower at £2,908 million in the nine months to 30 September 2020 compared to £3,776 million in the nine months to 30 September 2019. Net fee and commission income fell, reflecting reduced current account, card and other transaction-based income streams, as a result of lower levels of customer activity driven by the coronavirus pandemic. The reduction in fee income also reflects the impact of the sale of a wealth management business to a fellow Lloyds Banking Group subsidiary during 2019. Reduced other operating income reflected lower operating lease rental income, in line with the reduced Lex Autolease vehicle fleet, and a reduced level of recharges to other Lloyds Banking Group entities as costs have fallen. Operating expenses decreased by £2,721 million, or 29 per cent, to £6,667 million in the nine months to 30 September 2020 compared to £9,388 million in the nine months to 30 September 2019. There was a £2,421 million
Transcript of Lloyds Bank plc Q3 2020 Interim Management Statement 29 ...

Lloyds Bank plc
Q3 2020 Interim Management Statement
29 October 2020
REVIEW OF PERFORMANCE
Income statement
The Group's results have been significantly affected by the coronavirus pandemic and its impact upon the UK
economy. During the nine months to 30 September 2020, the Group recorded a profit before tax of £620 million
compared with a profit before tax in the nine months to 30 September 2019 of £2,562 million, a decrease of
£1,942 million which was largely driven by a significantly increased impairment charge due to changes to the
Group's economic outlook for the UK as a result of the coronavirus pandemic.
Total income decreased by £1,695 million, or 13 per cent, to £11,234 million in the nine months to 30 September
2020 compared with £12,929 million in the nine months to 30 September 2019; there was an £827 million decrease
in net interest income and a decrease of £868 million in other income.
Net interest income was £8,326 million in the nine months to 30 September 2020, a decrease of £827 million, or
9 per cent, compared to £9,153 million in the nine months to 30 September 2019. The net interest margin reduced
as a result of the lower rate environment, actions taken to support customers, including free overdrafts, and a
change in asset mix, largely as a result of reduced levels of customer demand during the coronavirus
pandemic. Average interest-earning assets were broadly stable with growth due to government-backed lending to
support corporate customers through the coronavirus crisis and the full impact of the 2019 Tesco acquisition offset
by lower balances in the closed mortgage book and credit cards, as well as the impact of the continued optimisation
of the corporate and institutional book within Commercial Banking.
Other income was £868 million, or 23 per cent, lower at £2,908 million in the nine months to 30 September 2020
compared to £3,776 million in the nine months to 30 September 2019. Net fee and commission income fell,
reflecting reduced current account, card and other transaction-based income streams, as a result of lower levels
of customer activity driven by the coronavirus pandemic. The reduction in fee income also reflects the impact of
the sale of a wealth management business to a fellow Lloyds Banking Group subsidiary during 2019. Reduced
other operating income reflected lower operating lease rental income, in line with the reduced Lex Autolease vehicle
fleet, and a reduced level of recharges to other Lloyds Banking Group entities as costs have fallen.
Operating expenses decreased by £2,721 million, or 29 per cent, to £6,667 million in the nine months to 30
September 2020 compared to £9,388 million in the nine months to 30 September 2019. There was a £2,421 million

decrease in regulatory provisions and a £300 million decrease in other operating expenses. The regulatory
provisions charge was £225 million compared to £2,646 million in the nine months to 30 September 2019. The
charge in 2019 included £2,449 million relating to payment protection insurance (PPI); no further provision was
made in the nine months to 30 September 2020. Good progress has been made with the review of PPI information
requests received and the conversion rate remains low and consistent with the provision assumption of around 10
per cent. The unutilised provision at 30 September 2020 was £324 million.
Other operating costs were lower, despite continued investment in the Group's digital proposition and the impact
of coronavirus-related costs, as a result of continued cost discipline, efficiencies gained through digitalisation and
other process and organisational improvements as well as lower variable remuneration accruals. Restructuring
costs, within other operating costs included increased property optimisation and severance costs, offset by
reductions following the completion of MBNA integration.
REVIEW OF PERFORMANCE (continued)
The impairment charge was significantly higher in the first nine months of the year at £3,947 million (nine months
to 30 September 2019: £979 million). This was primarily driven by the charge taken in the first half of the year for
potential future losses in light of the Group's revised economic outlook for the UK due to the coronavirus pandemic;
the charge taken for the last three months reflects the relative economic stability in the quarter and is broadly in
line with pre-crisis levels. Total expected credit loss allowances (ECL) continue to reflect the net impact of economic
scenarios and Government support programmes with the increase on prior year of some £3 billion building
additional balance sheet resilience.
Observed credit quality remains robust with arrears and defaults remaining low given the temporary support
measures, including payment holidays and furlough arrangements, which are available. The third quarter charge
includes a £205 million management overlay to offset model releases based on third quarter performance, given
temporary support programmes. The charge for the quarter also includes a £95 million release reflecting minor
changes to the updated economic outlook, largely relating to house price growth assumptions.
The ECL allowance at 30 September 2020 remains high by historical standards and, consistent with the Group's
updated macroeconomic projections, assumes that a large proportion of expected losses will crystallise over the
next 12 months as support measures subside and unemployment increases.
The Group's outlook and IFRS 9 base case economic scenario used to calculate ECL have been updated to reflect
a more resilient economic performance in 2020 than was anticipated at the half-year, in particular with respect to
positive house prices, albeit with no material change to the Group's medium and long-term views.
The Group's ECL allowance continues to reflect a probability-weighted view of future economic scenarios with a
30 per cent weighting applied to base case, upside and downside scenarios and a 10 per cent weighting to the
severe downside. All scenarios have deteriorated significantly in comparison to their equivalents at the 2019 year
end, although they have remained broadly consistent over the three months to 30 September 2020. The base case
upon which these scenarios are built now assumes that unemployment reaches a rate of 9.0 per cent in the first
quarter of 2021, representing the same peak assumed at the half year, albeit one quarter later. The updated base
case also recognises recent growth in house prices which drives an improved near-term forecast relative to that

taken at 30 June 2020. This improvement, alongside a more resilient view on commercial real estate prices, has
driven a £0.1 billion reduction to ECL in the third quarter of 2020.
REVIEW OF PERFORMANCE (continued)
At the half-year an adjustment was made to the severe downside scenario, which was reflected as an overlay, to
recognise the greater levels of uncertainty in the short-term economic outlook and therefore a greater severity of
potential adverse shocks than the modelled severe downside scenario generates. The adjusted severe downside
scenario assumes a peak unemployment rate of 12.5 per cent in the second quarter of 2021 and a GDP drop of
13.3 per cent in 2020. The impact of this adjustment has been estimated at portfolio level, but remains outside the
core IFRS 9 process and as such is reflected as a central overlay of £200 million, corresponding to an estimated
£2 billion higher ECL provision within the severe downside scenario.
Stage 2 loans and advances to customers have remained stable in the third quarter at 11.5 per cent of the book
reflecting the relative stability of the Group's asset quality performance and forward-looking economic assumptions.
Prudent adjustment of the criteria used to trigger movement from Stage 1 to Stage 2 within the credit card portfolio
has resulted in an additional £1.4 billion of up-to-date assets moving to a Stage 2 lifetime ECL basis.
In the absence of other credit risk indicators, the granting of payment holidays for coronavirus-related requests is
not currently in and of itself an indication of a significant increase in credit risk and therefore will not automatically
result in a customer balance moving from Stage 1 to Stage 2. Correspondingly, the removal of a customer from
payment holiday status does not result in any change in stage from that which otherwise would have been
recognised. The Group's coverage of Stage 2 assets increased slightly to 4.6 per cent reflecting the additional
cards assets in Stage 2 whilst coverage of Stage 3 assets has increased to 30.8 per cent at 30 September 2020.
Overall the Group's loan portfolio continues to be well-positioned, reflecting a through-the-cycle approach to credit
risk and high levels of security. The Retail portfolio is heavily weighted toward high quality mortgage lending where
low loan-to-value ratios provide security against potential risks. The prime consumer finance portfolio also benefits
from high quality growth in past periods and the Group's prudent risk appetite. The commercial portfolio reflects a
diverse client base with relatively limited exposure to the most vulnerable sectors so far affected by the coronavirus
outbreak. Within Commercial Banking, the Group's management of concentration risk includes single name and
country limits as well as controls over the overall exposure to certain higher risk and vulnerable sectors or asset
classes.
There was a tax credit of £307 million in the nine months to 30 September 2020 compared to a charge of
£1,008 million in the nine months to 30 September 2019 primarily as a result of a credit of c £440 million arising on
remeasurement of the Group's deferred tax balances following the UK Government's decision to maintain the
corporation tax rate at 19 per cent, which was substantively enacted on 17 March 2020.
Profit for the period, after tax, was £927 million compared to £1,554 million in the nine months to 30 September
2019.
REVIEW OF PERFORMANCE (continued)

Balance sheet and capital
Total assets were £25,520 million, or 4 per cent, higher at £606,888 million at 30 September 2020 compared to
£581,368 million at 31 December 2019. Cash and balances at central banks were £13,514 million higher at £52,394
million reflecting increased liquidity holdings. Financial assets at amortised cost increased by £6,420 million to
£492,921 million at 30 September 2020 compared to £486,501 million at 31 December 2019, mainly as a result of
an increase in reverse repurchase agreement balances, due to favourable credit spreads. Other loans and
advances to customers, net of impairment allowances, were broadly flat as increases in the open mortgage book
and in corporate and SME lending, reflecting take-up of Government support schemes, was offset by reductions in
the closed mortgage book along with reductions in credit card and motor finance balances, primarily as a result of
reduced customer activity in the second quarter, and increased impairment allowances.
Financial assets at fair value through other comprehensive income were £3,355 million higher at £27,972 million
compared to £24,617 million at 31 December 2019, reflecting increased holdings of government stock as a result
of favourable credit spreads available.
Total liabilities were £23,234 million, or 4 per cent, higher at £565,703 million compared to £542,469 million at 31
December 2019. Deposits from banks were £3,621 million higher at £27,214 million reflecting increased repurchase
agreement balances. Customer deposits were £36,595 million, or 9 per cent, higher at £433,434 million compared
to £396,839 million at 31 December 2019, as a result of growth in retail current and savings accounts and
commercial deposits. Retail current account growth was significant, in part due to lower levels of customer
spending as well as reliance on trusted brands; the growth in Commercial Banking includes the impact within the
SME portfolio from the placement of government-supported lending on deposit. In part offsetting these increases,
debt securities in issue were £15,590 million, or 20 per cent, lower at £60,841 million as the Group has taken
advantage of other, more attractive, funding sources.
The Group's credit ratings continue to reflect the resilience of the Group's business model and the strength of the
balance sheet. In October, Moody's downgraded Lloyds Bank plc from Aa3/Negative to A1/Stable due to the
removal of the uplift for Government support. This was triggered by the downgrade of the UK sovereign rating a
few days earlier given the agencies' pandemic and Brexit concerns, but did not impact the standalone rating of the
bank. Over the year both S&P and Fitch have affirmed the Group's ratings, albeit with negative outlooks to reflect
their concerns over the UK economy.
Total equity increased by £2,286 million, or 6 per cent, from £38,899 million at 31 December 2019 to £41,185 million
at 30 September 2020, mainly due to profit for the period, the issuance of £1,070 million of other equity instruments
and an increase in the net surplus relating to the Group's post-retirement defined benefit schemes as credit spreads
widened over the first nine months of 2020.
REVIEW OF PERFORMANCE (continued)
The Group's common equity tier 1 capital ratio increased to 15.0 per cent1 from 14.3 per cent at 31 December 2019
as the impact of the impairment charge on the Group's profits was largely mitigated through the increase in IFRS
9 transitional relief for capital. In addition, excess expected losses reduced to nil as they absorbed part of the

increase in IFRS 9 expected credit losses. The resultant increases in capital were offset in part by pensions
contributions made during the period and an increase in deferred tax assets and intangibles deducted from capital.
The tier 1 capital ratio increased to 19.3 per cent1 from 18.3 per cent at 31 December 2019, primarily reflecting the
increase in common equity tier 1 capital and new AT1 issuances, offset in part by the annual reduction in the
transitional limit applied to grandfathered AT1 capital. The total capital ratio increased to 22.8 per cent1 from 22.1
per cent at 31 December 2019, largely reflecting the increase in tier 1 capital.
Reflecting the full impact of IFRS 9 at 30 September 2020, without the application of transitional arrangements, the
Group's common equity tier 1 capital ratio would be 13.8 per cent1, the tier 1 capital ratio would be 18.1 per cent1 and
the total capital ratio would be 22.2 per cent1.
Risk-weighted assets increased by £14 million to £171,954 million at 30 September 2020, compared to
£171,940 million at 31 December 2019 largely reflecting the impact of credit migrations, retail model calibrations,
and the full implementation of the new securitisation framework. These increases have been offset by reductions
in underlying lending balances (excluding government-backed lending schemes that attract limited to no risk-
weighted assets), optimisation activity undertaken in Commercial Banking and the impact of the revised SME
supporting factor.
The Group's UK leverage ratio increased to 5.4 per cent1, (31 December 2019: 5.1 per cent), primarily driven by
the increase in tier 1 capital.
1 Incorporating profits for the period that remain subject to formal verification in accordance with the Capital Requirements Regulation.
CONDENSED CONSOLIDATED INCOME STATEMENT (UNAUDITED)
Nine months
ended 30 Sept
2020
Nine months
ended 30 Sept
2019 £million £million
Net interest income 8,326 9,153
Other income 2,908 3,776
Total income 11,234 12,929
Total operating expenses (6,667) (9,388)
Trading surplus 4,567 3,541
Impairment (3,947) (979)
Profit before tax 620 2,562
Tax credit (expense) 307 (1,008)
Profit for the period 927 1,554
Profit attributable to ordinary shareholders 593 1,312
Profit attributable to other equity holders 313 211
Profit attributable to equity holders 906 1,523
Profit attributable to non-controlling interests 21 31

Profit for the period 927 1,554
CONDENSED CONSOLIDATED BALANCE SHEET
At 30 Sept 2020
At 31 Dec 2019
£million £million (unaudited) (audited)
Assets
Cash and balances at central banks 52,394 38,880
Financial assets at fair value through profit or loss 2,112 2,284
Derivative financial instruments 9,320 8,494
Loans and advances to banks 6,392 4,852
Loans and advances to customers 480,386 474,470
Debt securities 5,247 5,325
Due from fellow Lloyds Banking Group undertakings 896 1,854
Financial assets at amortised cost 492,921 486,501
Financial assets at fair value through other comprehensive income 27,972 24,617
Other assets 22,169 20,592
Total assets 606,888 581,368
Liabilities
Deposits from banks 27,214 23,593
Customer deposits 433,434 396,839
Deposits from fellow Lloyds Banking Group undertakings 6,729 4,893
Financial liabilities at fair value through profit or loss 8,374 7,702
Derivative financial instruments 9,021 9,831
Debt securities in issue 60,841 76,431
Subordinated liabilities 10,765 12,586
Other liabilities 9,325 10,594
Total liabilities 565,703 542,469
Shareholders' equity 35,168 33,973
Other equity interests 5,935 4,865
Non-controlling interests 82 61
Total equity 41,185 38,899
Total equity and liabilities 606,888 581,368
ADDITIONAL FINANCIAL INFORMATION
1. Basis of presentation
This release covers the results of Lloyds Bank plc (the Bank) together with its subsidiaries (the Group) for the nine
months ended 30 September 2020.

Accounting policies
The accounting policies are consistent with those applied by the Group in its 2019 Annual Report and Accounts.
2. Capital
Capital and leverage ratios reported as at 30 September 2020 incorporate profits for the nine months that remain
subject to formal verification in accordance with the Capital Requirements Regulation. The Group's Q3 2020 Interim
Pillar 3 Report can be found at www.lloydsbankinggroup.com/investors/financial-performance/
3. Forward-looking information
The measurement of expected credit losses is required to reflect an unbiased probability-weighted range of
possible future outcomes. In order to do this, the Group has developed an economic model to project a wide range
of key impairment drivers using information derived mainly from external sources. These drivers include factors
such as the unemployment rate, the house price index, commercial property prices and corporate credit spreads.
The model-generated economic scenarios for the six years beyond 2020 are mapped to industry-wide historical
loss data by portfolio. Combined losses across portfolios are used to rank the scenarios by severity of loss.
Alongside a defined central economic scenario, reflecting the Group's base case assumptions used for medium-
term planning purposes, three further economic scenarios are generated to represent the range of future outcomes.
The upside, downside and severe downside scenarios are produced by averaging across a group of constituent
scenarios around the 15th, 75th and 95th percentiles of the estimated loss distribution around the central case,
with the central case expected to lie in the vicinity of the 45th percentile. These locations correspond to scenario
weightings that allow for the inclusion of a relatively unlikely severe downside scenario associated with relatively
large credit losses. At 31 December 2019 and 30 September 2020, the base case, upside and downside scenarios
each carry a 30 per cent weighting, while the severe downside scenario is weighted at 10 per cent. The weights
reflect the location of the economic scenarios on the estimated loss distribution.
Following review of the severe downside scenario generated by the modelled approach described above, a
judgement was made to increase the severity of GDP and unemployment dispersion from the base case. Whilst
the modelled approach gives an unbiased method of creating a loss distribution, it is built on historic experience
that does not yet fully capture the unprecedented complexities of the current economic environment and the risk of
inflated near-term shocks. The impact of this change has been reflected as a central overlay to reflect the
incremental ECL estimated outside the core ECL calculation process. The following economic assumptions include
both the modelled severe scenario - used in portfolio level ECL and staging assessment, and the adjusted severe
downside - used to generate the final ECL through a central overlay in recognition of more adverse economic
outcomes. ADDITIONAL FINANCIAL INFORMATION (continued)
The key UK economic assumptions made by the Group are shown below. Compounded growth rates have been
calculated on a geometric average basis, they were previously calculated on an arithmetic average basis:
Impact of economic assumptions
Base case Upside Downside
Modelled severe
Adjusted severe

% % % % %
At 30 September 2020
GDP 0.4 0.6 0.0 (0.4) (0.8)
Interest rate 0.15 0.89 0.13 0.04 0.04
Unemployment rate 5.8 5.4 6.7 7.7 8.3
House price growth 0.7 4.7 (4.2) (8.8) (8.8)
Commercial real estate price growth (0.7) 2.2 (3.4) (7.8) (7.8)
At 31 December 2019
GDP 1.4 1.7 1.2 0.5 n/a
Interest rate 1.25 2.04 0.49 0.11 n/a
Unemployment rate 4.3 3.9 5.8 7.2 n/a
House price growth 1.0 4.8 (3.2) (7.7) n/a
Commercial real estate price growth 0.0 1.8 (3.8) (7.1) n/a
Average economic assumptions do not reveal the extent of expected variation throughout the five-year period. The
following tables illustrate the mutability of each assumption over time. Metrics quoted for the first and second
quarters of 2020 reflect actual observed economics.
Base Case Scenario by Quarter1
2020 2020 2020 2020 2021 2021 2021 2021
Q1 Q2 Q3 Q4 Q1 Q2 Q3 Q4
Base Case % % % % % % % %
GDP (2.2) (20.4) 16.2 2.7 1.0 0.9 0.9 0.8
Interest rate 0.10 0.10 0.10 0.10 0.10 0.10 0.10 0.10
Unemployment rate 3.9 3.9 5.3 7.7 9.0 8.1 7.4 6.6
House price growth 2.8 2.6 5.4 2.0 1.0 0.3 (4.0) (4.0)
Commercial real estate price growth (5.0) (7.8) (8.9) (12.0) (10.2) (7.3) (5.7) (0.6)
1 GDP presented quarter on quarter, house price growth and commercial real estate growth presented year on year. .
ADDITIONAL FINANCIAL INFORMATION (continued)
Scenarios by year

Key annual assumptions made by the Group. GDP is presented as an annual change, house price growth and
commercial real estate price growth is presented as the growth in the respective indices within the period. Interest
rate and unemployment rate are averages in the period.
2020 2021 2022 2020-22
% % % %
Base Case
GDP (10.0) 6.0 3.0 (1.7)
Interest rate 0.10 0.10 0.10 0.10
Unemployment rate 5.2 7.8 5.9 6.3
House price growth 2.0 (4.0) 1.0 (1.1)
Commercial real estate price growth (12.0) (0.6) 4.1 (8.9)
Upside
GDP (9.9) 7.0 3.2 (0.5)
Interest rate 0.13 0.80 1.26 0.73
Unemployment rate 5.2 7.2 5.2 5.8
House price growth 3.2 0.2 6.7 10.4
Commercial real estate price growth (5.8) 10.4 5.2 9.3
Downside
GDP (10.5) 4.8 2.5 (3.8)
Interest rate 0.10 0.11 0.12 0.11
Unemployment rate 5.2 8.3 6.9 6.8
House price growth 1.2 (9.4) (6.1) (13.9)
Commercial real estate price growth (15.7) (8.7) 1.3 (22.0)
Severe downside - modelled
GDP (10.8) 3.0 1.9 (6.3)
Interest rate 0.08 0.02 0.02 0.04
Unemployment rate 5.3 9.1 8.4 7.6
House price growth 0.3 (13.4) (12.9) (24.3)
Commercial real estate price growth (20.8) (19.7) (4.1) (39.0)
Severe downside - adjusted
GDP (13.3) (0.7) 5.2 (9.4)
Interest rate 0.08 0.02 0.02 0.04
Unemployment rate 5.4 11.6 9.2 8.7
House price growth 0.3 (13.4) (12.9) (24.3)
Commercial real estate price growth (20.8) (19.7) (4.1) (39.0)

ADDITIONAL FINANCIAL INFORMATION (continued)
4. Loans and advances to customers
Total Stage 1 Stage 2 Stage 3 POCI1
Stage 2 as % of
total
Stage 3 as % of
total
£m £m £m £m £m % %
At 30 September 2020
Gross lending
Retail:
UK Mortgages 288,810 241,747 32,432 1,846 12,785 11.2 0.6
Credit cards 15,632 11,894 3,421 317 - 21.9 2.0
UK Motor Finance 15,350 12,276 2,838 236 - 18.5 1.5
Other2 28,192 25,691 2,051 450 - 7.3 1.6
347,984 291,608 40,742 2,849 12,785 11.7 0.8
Commercial Banking:
SME 32,397 26,421 5,098 878 - 15.7 2.7
Other 46,391 33,856 9,955 2,580 - 21.5 5.6
78,788 60,277 15,053 3,458 - 19.1 4.4
Central items 59,345 59,260 13 72 - 0.0 0.1
Total gross lending 486,117 411,145 55,808 6,379 12,785 11.5 1.3
Expected credit loss allowance on drawn balances (5,731) (1,206) (2,328) (1,869) (328)
Net balance sheet carrying value 480,386 409,939 53,480 4,510 12,457
1 Purchased or originated credit-impaired. 2 Retail Other includes Business Banking, Loans, Overdrafts, Europe and Retail run-off.
ADDITIONAL FINANCIAL INFORMATION (continued)
Total Stage 1 Stage 2 Stage 3 POCI
Stage 2 as % of
total
Stage 3 as % of
total
£m £m £m £m £m % %
At 31 December 20191
Gross lending
Retail:
UK Mortgages 289,198 257,043 16,935 1,506 13,714 5.9 0.5
Credit cards 18,198 16,132 1,681 385 - 9.2 2.1
UK Motor Finance 15,976 13,884 1,942 150 - 12.2 0.9

Other2 21,111 18,692 1,976 443 - 9.4 2.1
344,483 305,751 22,534 2,484 13,714 6.5 0.7
Commercial Banking:
SME 30,433 27,206 2,507 720 - 8.2 2.4
Other 48,865 43,032 3,418 2,415 - 7.0 4.9
79,298 70,238 5,925 3,135 - 7.5 4.0
Central items 53,852 53,778 46 28 - 0.1 0.1
Total gross lending 477,633 429,767 28,505 5,647 13,714 6.0 1.2
Expected credit loss allowance on drawn balances (3,163) (669) (993) (1,359) (142)
Net balance sheet carrying value 474,470 429,098 27,512 4,288 13,572
1 Restated to reflect migration of certain customer relationships from SME business within Commercial Banking to Business
Banking within Retail. 2 Retail Other includes Business Banking, Loans, Overdrafts, Europe and Retail run-off.
ADDITIONAL FINANCIAL INFORMATION (continued)
5. Expected credit loss allowances (drawn and undrawn) as a percentage of loans and advances to customers
Total Stage 1 Stage 2 Stage 3 POCI At 30 September 2020
£m %1,2
£m %1,2
£m %1,2
£m %1,2
£m %1,2
Retail:
Secured 1,143 0.4 109 0.0 507 1.6 199 10.8 328 2.6
Credit Cards 998 6.4 249 2.1 644 18.8 105 42.3 - - UK Motor Finance3 557 3.6 198 1.6 215 7.6 144 61.0 - -
Other4 921 3.3 328 1.3 431 21.0 162 48.2 - -
3,619 1.0 884 0.3 1,797 4.4 610 22.9 328 2.6
Commercial Banking:
SME 529 1.6 137 0.5 261 5.1 131 14.9 - -
Other 1,841 4.0 157 0.5 531 5.3 1,153 44.7 - -
2,370 3.0 294 0.5 792 5.3 1,284 37.1 - -
Central items 225 0.4 211 0.4 1 7.7 13 18.1 - -
Total 6,214 1.3 1,389 0.3 2,590 4.6 1,907 30.8 328 2.6
Drawn 5,731 1,206 2,328 1,869 328
Undrawn 483 183 262 38 -
Total 6,214 1,389 2,590 1,907 328
1 As a percentage of drawn balances. 2 Stage 3 ECL allowances as a percentage of drawn balances are calculated excluding loans in recoveries in Credit Cards of
£69 million and £114 million in Loans, Overdrafts and Business Banking within Retail other. 3 UK Motor Finance for Stages 1 and 2 include £188 million relating to provisions against residual values of vehicles subject to
finance leasing agreements. These provisions are included within the calculation of coverage ratios. 4 Retail Other includes Business Banking, Loans, Overdrafts, Europe and Retail run-off.
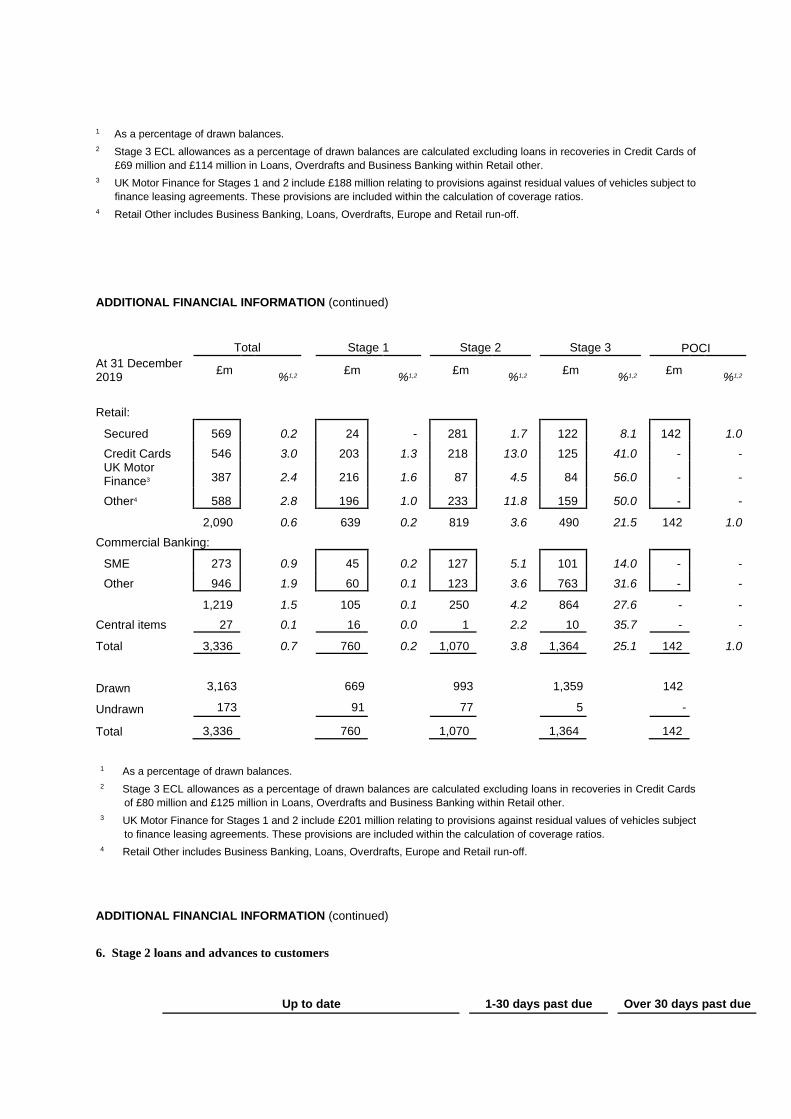
ADDITIONAL FINANCIAL INFORMATION (continued)
Total Stage 1 Stage 2 Stage 3 POCI At 31 December 2019
£m %1,2
£m %1,2
£m %1,2
£m %1,2
£m %1,2
Retail:
Secured 569 0.2 24 - 281 1.7 122 8.1 142 1.0
Credit Cards 546 3.0 203 1.3 218 13.0 125 41.0 - - UK Motor Finance3 387 2.4 216 1.6 87 4.5 84 56.0 - -
Other4 588 2.8 196 1.0 233 11.8 159 50.0 - -
2,090 0.6 639 0.2 819 3.6 490 21.5 142 1.0
Commercial Banking:
SME 273 0.9 45 0.2 127 5.1 101 14.0 - -
Other 946 1.9 60 0.1 123 3.6 763 31.6 - -
1,219 1.5 105 0.1 250 4.2 864 27.6 - -
Central items 27 0.1 16 0.0 1 2.2 10 35.7 - -
Total 3,336 0.7 760 0.2 1,070 3.8 1,364 25.1 142 1.0
Drawn 3,163 669 993 1,359 142
Undrawn 173 91 77 5 -
Total 3,336 760 1,070 1,364 142
1 As a percentage of drawn balances. 2 Stage 3 ECL allowances as a percentage of drawn balances are calculated excluding loans in recoveries in Credit Cards
of £80 million and £125 million in Loans, Overdrafts and Business Banking within Retail other. 3 UK Motor Finance for Stages 1 and 2 include £201 million relating to provisions against residual values of vehicles subject
to finance leasing agreements. These provisions are included within the calculation of coverage ratios. 4 Retail Other includes Business Banking, Loans, Overdrafts, Europe and Retail run-off.
ADDITIONAL FINANCIAL INFORMATION (continued)
6. Stage 2 loans and advances to customers
Up to date 1-30 days past due Over 30 days past due

PD movements Other
Gross lending ECL
Gross lending ECL
Gross lending ECL
Gross lending ECL
£m £m %1 £m £m %1 £m £m %1 £m £m %1
At 30 September 2020
Retail:
Secured 20,745 207 1.0 8,256 142 1.7 1,719 55 3.2 1,712 103 6.0
Credit cards 2,882 497 17.2 424 105 24.8 84 27 32.1 31 15 48.4
UK Motor Finance 888 79 8.9 1,777 69 3.9 136 46 33.8 37 21 56.8
Other2 935 221 23.6 784 105 13.4 215 70 32.6 117 35 29.9
25,450 1,004 3.9 11,241 421 3.7 2,154 198 9.2 1,897 174 9.2
Commercial Banking:
SME 4,818 241 5.0 148 7 4.7 60 8 13.3 72 5 6.9
Other 9,442 523 5.5 220 5 2.3 19 1 5.3 274 2 0.7
14,260 764 5.4 368 12 3.3 79 9 11.4 346 7 2.0
Central items - - - 13 1 7.7 - - - - - -
Total 39,710 1,768 4.5 11,622 434 3.7 2,233 207 9.3 2,243 181 8.1
1 ECL allowances as a percentage of drawn balances. 2 Retail Other includes Business Banking, Loans, Overdrafts, Europe and Retail run-off.
ADDITIONAL FINANCIAL INFORMATION (continued)
Up to date 1-30 days past due Over 30 days past due
PD movements Other
Gross lending ECL
Gross lending ECL
Gross lending ECL
Gross lending ECL
£m £m %1 £m £m %1 £m £m %1 £m £m %1
At 31 December 2019
Retail:
Secured 10,846 83 0.8 2,593 107 4.1 1,876 33 1.8 1,620 58 3.6
Credit cards 1,093 129 11.8 423 47 11.1 124 26 21.0 41 16 39.0
UK Motor Finance 543 27 5.0 1,232 30 2.4 135 21 15.6 32 9 28.1
Other2 893 102 11.4 711 54 7.6 238 50 21.0 134 27 20.1

13,375 341 2.5 4,959 238 4.8 2,373 130 5.5 1,827 110 6.0
Commercial Banking:3
SME 2,014 104 5.2 410 17 4.1 56 6 10.7 27 - -
Other 1,881 75 4.0 1,238 45 3.6 61 2 3.3 238 1 0.4
3,895 179 4.6 1,648 62 3.8 117 8 6.8 265 1 0.4
Central items - - - 42 1 2.4 1 - 0.0 3 - 0.0
Total 17,270 520 3.0 6,649 301 4.5 2,491 138 5.5 2,095 111 5.3
1 ECL allowances as a percentage of drawn balances as at 31 December 2019 restated to reflect migration of certain customer
relationships from the SME business within Commercial Banking to Business Banking within Retail. 2 Retail Other includes Business Banking, Loans, Overdrafts, Europe and Retail run-off.
3 Stage 2 up to date loans are assigned to PD movement if they also meet other triggers. This represents a change in
presentation for Commercial Banking where these loans were reported in Other at 31 December 2019.
ADDITIONAL FINANCIAL INFORMATION (continued)
7. Commercial Banking lending in key coronavirus-impacted sectors1
At 30 September 2020
Drawn Undrawn
Drawn as a % of
loans and advances
£bn £bn %
Retail non-food 2.2 1.5 0.5
Automotive dealerships2 1.7 2.2 0.1
Oil and gas 1.4 2.4 0.3
Construction 1.3 1.6 0.3
Hotels 1.9 0.3 0.4
Passenger transport 1.3 0.5 0.3
Leisure 0.7 0.7 0.2
Restaurants and bars 0.8 0.2 0.2
Total 11.3 9.4 2.3
1 Lending classified using ONS SIC codes at legal entity level. 2 Automotive dealerships includes Black Horse Motor Wholesale lending (within Retail Division).
The spread of coronavirus has resulted in widespread industry disruption, with some sectors such as travel,
transportation, retail and hospitality particularly impacted. As a proportion of the Group's overall lending, these
sectors remain relatively modest. The Group expects recovery to be slow in a number of vulnerable sectors and
anticipates long-term structural changes in these and other sectors. As a result, sector and credit risk appetite
continues to be proactively managed to ensure the Group is protected and clients are supported in the right way.
8. Support measures

Retail payment holiday characteristics1
Mortgages Cards Loans Motor Total
000s £bn 000s £bn 000s £bn 000s £bn 000s £bn
Total payment holidays granted 477 62.7 320 1.6 264 2.1 132 2.2 1,193 68.6
First payment holiday still in force 14 1.9 24 0.1 23 0.2 12 0.2 73 2.4
Matured payment holidays - repaying 384 49.5 238 1.2 201 1.6 103 1.7 927 54.0
Matured payment holidays - extended 61 9.1 38 0.2 34 0.3 9 0.2 142 9.8
Matured payment holidays - missed payment 18 2.2 19 0.1 7 0.0 8 0.1 51 2.4
As a percentage of total matured
Matured payment holidays - repaying 83 % 82 % 81 % 80 % 83 % 82 % 86 % 84 % 83 % 82 %
Matured payment holidays - extended 13 % 15 % 13 % 14 % 14 % 15 % 8 % 10 % 13 % 15 %
Matured payment holidays - missed payment 4 % 4 % 6 % 6 % 3 % 2 % 6 % 7 % 5 % 4 %
1 Mortgages, credit cards and personal loans at 24 October 2020; motor finance at 23 October 2020. Analysis of mortgage
payment holidays excludes St James Place, Intelligent Finance and Tesco; motor finance payment holidays excludes Lex
Autolease. Total payment holidays granted are equal to the sum of first payment holiday still in force and matured payment
holidays.
REVIEW OF PERFORMANCE (continued)
Government-backed loan schemes1
000s £bn
Coronavirus Business Interruption Loan Scheme 9 2,0
Bounce Back Loan Scheme 278 8.4
1 Data as at 23 October 2020.
Around 1.2 million retail payment holidays, on £69 billion of lending, have been granted to help alleviate temporary
financial pressure on customers during the crisis, of which there are c.73,000 (£2.4 billion) where the first payment
holiday is still in force and 1.1 million (£66.2 billion) that have matured, including c.142,000 (£9.8 billion) that have
then been extended. Payment holidays of up to three months have been granted across a range of retail products
including mortgages, personal loans, credit cards and motor finance, with extensions available of up to three
months should customers request them.
The vast majority of first payment holidays (96 per cent) have now matured, of which 82 per cent by value have
restarted payments, 15 per cent have been extended and 4 per cent have missed payment. Of the mortgage
payment holidays that have been extended 30 per cent have now matured with around 90 per cent having resumed
payment.
Mortgages account for the largest proportion of payment holidays, with a total of around 477,000 having been
granted, equating to customer balances of £62.7 billion. As at 24 October 2020, 97 per cent, or 463,000, have
matured with 83 per cent, or 384,000, of those having resumed repayments, 13 per cent extended and 4 per cent
having missed payment. The average LTV of customers extending their mortgage payment holidays and still in
extension remains relatively low at 51.6 per cent, compared to 43.5 per cent for the total mortgage book.

The Group also granted 320,000 payment holidays on £1.6 billion of credit card balances, 264,000 payment
holidays on £2.1 billion of unsecured personal loans and 132,000 payment holidays on £2.2 billion of motor finance
products. These products are also experiencing c.80 per cent of customers resuming payments at the end of their
payment holidays. Only £0.2 billion of credit card balances have been subject to a payment holiday extension and
are still in extension, with £0.1 billion having missed payment.
Across all products, customers who are still in extension remain of a typically lower credit quality than the wider
book and tend to have higher average balances than customers who have not requested payment holidays.
The Group continues to recognise interest income for the duration of payment holidays and in the absence of other
credit risk indicators, the granting of a coronavirus-related payment holiday does not automatically result in a
transfer between stages for the purposes of IFRS 9, albeit 35 per cent are classified as Stage 2 based on
established criteria.
Within SME, the Group has granted c.33,000 capital repayment holidays, equivalent to c.£5.9 billion with low levels
of maturities to date.
FORWARD LOOKING STATEMENTS
This document contains certain forward looking statements within the meaning of Section 21E of the US Securities Exchange
Act of 1934, as amended, and section 27A of the US Securities Act of 1933, as amended, with respect to the business, strategy,
plans and/or results of Lloyds Bank plc together with its subsidiaries (the Lloyds Bank Group) and its current goals and
expectations relating to its future financial condition and performance. Statements that are not historical facts, including
statements about the Lloyds Bank Group's or its directors' and/or management's beliefs and expectations, are forward looking
statements. Words such as 'believes', 'anticipates', 'estimates', 'expects', 'intends', 'aims', 'potential', 'will', 'would', 'could',
'considered', 'likely', 'estimate' and variations of these words and similar future or conditional expressions are intended to identify
forward looking statements but are not the exclusive means of identifying such statements. Examples of such forward looking
statements include, but are not limited to: projections or expectations of the Lloyds Bank Group's future financial position including
profit attributable to shareholders, provisions, economic profit, dividends, capital structure, portfolios, net interest margin, capital
ratios, liquidity, risk-weighted assets (RWAs), expenditures or any other financial items or ratios; litigation, regulatory and
governmental investigations; the Lloyds Bank Group's future financial performance; the level and extent of future impairments
and write-downs; statements of plans, objectives or goals of the Lloyds Bank Group or its management including in respect of
statements about the future business and economic environments in the UK and elsewhere including, but not limited to, future
trends in interest rates, foreign exchange rates, credit and equity market levels and demographic developments; statements
about competition, regulation, disposals and consolidation or technological developments in the financial services industry; and
statements of assumptions underlying such statements. By their nature, forward looking statements involve risk and uncertainty
because they relate to events and depend upon circumstances that will or may occur in the future. Factors that could cause actual
business, strategy, plans and/or results (including but not limited to the payment of dividends) to differ materially from forward
looking statements made by the Lloyds Bank Group or on its behalf include, but are not limited to: general economic and business
conditions in the UK and internationally; market related trends and developments; fluctuations in interest rates, inflation, exchange
rates, stock markets and currencies; any impact of the transition from IBORs to alternative reference rates; the ability to access
sufficient sources of capital, liquidity and funding when required; changes to the Lloyds Bank Group's or Lloyds Banking Group
plc's credit ratings; the ability to derive cost savings and other benefits including, but without limitation as a result of any
acquisitions, disposals and other strategic transactions; the ability to achieve strategic objectives; changing customer behaviour
including consumer spending, saving and borrowing habits; changes to borrower or counterparty credit quality; concentration of
financial exposure; management and monitoring of conduct risk; instability in the global financial markets, including Eurozone
instability, instability as a result of uncertainty surrounding the exit by the UK from the European Union (EU) and as a result of
such exit and the potential for other countries to exit the EU or the Eurozone and the impact of any sovereign credit rating
downgrade or other sovereign financial issues; political instability including as a result of any UK general election; technological
changes and risks to the security of IT and operational infrastructure, systems, data and information resulting from increased
threat of cyber and other attacks; natural, pandemic (including but not limited to the coronavirus disease (COVID-19) outbreak
and associated potential and/or actual UK or international lockdowns) and other disasters, adverse weather and similar
contingencies outside the Lloyds Bank Group's or Lloyds Banking Group plc's control; inadequate or failed internal or external
processes or systems; acts of war, other acts of hostility, terrorist acts and responses to those acts, geopolitical, pandemic or

other such events; risks relating to climate change; changes in laws, regulations, practices and accounting standards or taxation,
including as a result of the exit by the UK from the EU, or a further possible referendum on Scottish independence; changes to
regulatory capital or liquidity requirements and similar contingencies outside the Lloyds Bank Group's or Lloyds Banking Group
plc's control; the policies, decisions and actions of governmental or regulatory authorities or courts in the UK, the EU, the US or
elsewhere including the implementation and interpretation of key legislation and regulation together with any resulting impact on
the future structure of the Lloyds Bank Group; the ability to attract and retain senior management and other employees and meet
its diversity objectives; actions or omissions by the Lloyds Bank Group's directors, management or employees including industrial
action; changes to the Lloyds Bank Group's post-retirement defined benefit scheme obligations; the extent of any future
impairment charges or write-downs caused by, but not limited to, depressed asset valuations, market disruptions and illiquid
markets; the value and effectiveness of any credit protection purchased by the Lloyds Bank Group; the inability to hedge certain
risks economically; the adequacy of loss reserves; the actions of competitors, including non-bank financial services, lending
companies and digital innovators and disruptive technologies; and exposure to regulatory or competition scrutiny, legal, regulatory
or competition proceedings, investigations or complaints. Please refer to the latest Annual Report on Form 20-F filed by Lloyds
Bank plc with the US Securities and Exchange Commission for a discussion of certain factors and risks together with examples
of forward looking statements. Lloyds Banking Group may also make or disclose written and/or oral forward looking statements
in reports filed with or furnished to the US Securities and Exchange Commission, Lloyds Banking Group annual reviews, half-
year announcements, proxy statements, offering circulars, prospectuses, press releases and other written materials and in oral
statements made by the directors, officers or employees of Lloyds Banking Group to third parties, including financial analysts.
Except as required by any applicable law or regulation, the forward looking statements contained in this document are made as
of today's date, and the Lloyds Bank Group expressly disclaims any obligation or undertaking to release publicly any updates or
revisions to any forward looking statements contained in this document to reflect any change in the Lloyds Bank Group's
expectations with regard thereto or any change in events, conditions or circumstances on which any such statement is based.
The information, statements and opinions contained in this document do not constitute a public offer under any applicable law or
an offer to sell any securities or financial instruments or any advice or recommendation with respect to such securities or financial
instruments.
CONTACTS
For further information please contact:
INVESTORS AND ANALYSTS
Douglas Radcliffe
Group Investor Relations Director
020 7356 1571
Edward Sands
Director of Investor Relations
020 7356 1585
Nora Thoden
Director of Investor Relations - ESG
020 7356 2334
CORPORATE AFFAIRS
Grant Ringshaw

Director of Media Relations
020 7356 2362
Matt Smith
Head of Corporate Media
020 7356 3522
Copies of this interim management statement may be obtained from:
Investor Relations, Lloyds Banking Group plc, 25 Gresham Street, London EC2V 7HN
The statement can also be found on the Group's website - www.lloydsbankinggroup.com
Registered office: Lloyds Bank plc, 25 Gresham Street, London EC2V 7HN
Registered in England no. 2065