
Lloyd Electric & Engineering Ltd Presentation - LEEL.pdf · 2 Lloyd Electric & Engineering Ltd ......
30
March 2012 Lloyd Electric & Engineering Ltd Investor Presentation
Transcript of Lloyd Electric & Engineering Ltd Presentation - LEEL.pdf · 2 Lloyd Electric & Engineering Ltd ......

March 2012
Lloyd Electric & Engineering Ltd
Investor Presentation

Table of Contents
2
Page #
1 Group Overview 3
2 Lloyd Electric & Engineering Ltd – Company Overview 6
3 Perfect Radiators & Oil Coolers Ltd – Company Overview 24
4 Financial Overview 26
Group Overview

Group Restructuring
4*Consumer Products Division
Promoter Group
HVAC
Consumer appliances
Lloyd Electric &
Engineering Ltd
(LEEL)
Radiators
Oil coolers
Perfect Radiators & Oil
Coolers Ld
(PROC)
Environment Control
Systems (ECS)
Fabricated Structures
Power T&D
Fedders Lloyd
Corporation Ltd
(FLCL)
Perfect Radiators to be
merged with LEEL. 54
equity shares of LEEL to be
issued against 100 equity
shares of PROC
38.05%37.97% 100%
Lloyd logo & CPD* distribution
network to be transferred to LEEL

Corporate History
5
Focus on core strengths and consolidating for long term competitive advantage
Commenced
production of
room ACs
Defense
products for MIL
grade AC range
produced
Entry into high
end telecom
segment
Roof mounted
AC packaged
unit developed
for Indian Rail
Entry into steel
structures &
consumer
products
Consumer
products division
transferred to
LEEL
1987
1974 1990 1992 2007 2011
Bhiwadi
plant
established
for coils
Largest coil
manufacturer
in India
Developed
AC units for
rail coaches
Commenced
exports to
Gulf, opened
Dubai office
Entry into
room ACs
Acquired
Luvata
Czech
1995 1997 2002 2004 2008
1957
Lloyd Electric &
Engineering Ltd2011
(FLCL)
(LEEL)
Founded &
established
radiator unit
in Gurgaon
Bought by
Lloyd Group
Aluminum brazed
heat exchanger
(ABHE)plant at
Tauru
New plant at
Haridwar for ABHE,
shell & tube heat
exchanger
1984 2003 2007 2010
2009
2008
Entry into
power T&D
segment
Lloyd Coils, Czech Republic
Czech Republic

Lloyd Electric & Engineering Ltd (LEEL)Company Overview
6

Brief Introduction
Promoted by promoters of Fedders Lloyd Corporation Ltd, leading
HVAC group in India
Listed on BSE in 1996
Production capacity of over 1.2 mn coils & over 0.6 mn ACs annually
ISO 9001 certified for HVAC products
IRIS(1) certified for railway HVAC products
International presence with wholly owned subsidiaries in Europe
Key Products
Heat exchangers
Condensing & evaporating coils
Sheet metal parts & components
Industrial heat exchangers
Air conditioning – contract manufacturing for other OEMs
Window & split ACs
Air conditioning – railway , metro, buses
Consumer products (Lloyd branded)
ACs, LCD/LED televisions
7
Overview
Key Financials (standalone) (Rs mn)
FY07 FY08 FY09 FY10 FY11
Revenue 4,966 6,699 5,879 6,795 7,836
EBITDA 661 818 501 731 823
PAT 430 527 204 343 361
Net worth 2,994 3,510 3,714 4,022 4,321
Net debt 61 826 1,411 1,735 2,703
Shareholding Pattern
Promoter Group38%
Bodies corporate
16%
Institutional Investors
15%
Other 31%
(1) International Railway Industry Standard

Key Products Key Markets
8
Product Profile – Lloyd Electric (LEEL)
From Coils to Consumer - Present across value chain
Heat Exchangers
Air Conditioners (window, split, rail)
Consumer Products
Air conditioning, Industrial, Auto, Refrigeration, Data centre
OEMs, Railways, Metro Rail
Retail Customers

Key Competitive Advantages
9
Dehradun, Kala Amb, Pantnagar & Haridwar plants enjoy tax holiday for 10 to 15 years
Short term contracts protecting the company from commodity price fluctuationsFinancial Benefits
Over 50 years of experience in HVAC business
Adherence to highest standards of quality followed by global players due to long term contracting relationships
Technologically at par with the best in the business
Manufacturing experience
for leading players
Presence across value chain (from coils to brand) – better control on cost, low volatility of margins
Hedge against cost/demand volatility in individual value chain elementsVertical integration
Pioneer in PFC coils in India – high efficiency, low weight & low cost
Capability to develop heat exchanging applications for nuclear power plants with acquisition of Janka EngineeringTechnological edge
Qualified Category I supplier for Indian Railways – 80% of the tenders awarded to Category I players
IRIS qualified – will be able to bid for railway & metro projects internationally, first HVAC player in India with IRIS
Strong consumer brand built by effective marketing campaign and history of selling consumer products
Strong entry barriers

Fully Integrated Across HVAC Value Chain
10
Coils & Heat Exchangers AC manufacturing Branded AC/consumer products
sales & marketing
Consumed in AC
manufacturing
Branded as
Lloyd products
Air-conditioning &
refrigeration product
manufacturers
Other OEMs Retail customers
Sale SaleSale
Better control on cost Reduced volatility in margins Hedge against demand volatility

Product Mix (FY07)
Heat exchangers
37%
Room/Rail ACs49%
Parts14%
Product Mix(FY11)
11
LEEL - Share of ACs Has Grown to 50% in FY11 vis-à-vis 26% in FY07
Heat exchangers
73%
Room/Rail ACs26%
Parts1%
Rs 4,966 mn Rs 7,836 mn
Rising focus on end products by leveraging product capabilities

Window AC Sales Have Been Growing Steadily…
1.0 1.0 1.1 1.2
1.4
2006-07 2007-08 2008-09 2009-10 2010-11
…But Surpassed by Split AC Sales Growth
12
Room AC Market Continues to Grow Rapidly
Low penetration and rising affordability have been the key to rapid growth in the segment
Sustainable Growth Drivers Underpenetrated Indian Market vis-à-vis Other Asian Markets
70% 67%
52%45%
24%20%
7%3%
Taiwan Hong Kong
Korea Malaysia Thailand China Indonesia India
CAGR: 11%(volume in mn units)
(household penetration in %)
Source: Crisil Research
0.7
1.0 1.2
1.4
1.7
2006-07 2007-08 2008-09 2009-10 2010-11
CAGR: 27%(volume in mn units)
Highly underpenetrated Indian household market
Increasing affordability and financing options
Increasing urbanization in tier II cities, improving power availability
Robust growth in commercial segment
Shift from being luxury product to being a necessary product
Reduction of duty from 50% in 2002-03 to 10% currently

Room AC Market in 2009-10
2.6 2.7
1.7
0.1 1.0
Domestic consumption
Exports Total Imports Domestic production
LEEL Produced 18% of the ACs Produced in India in 2009-10
Lloyd18%
Other OEMs/In-house mfg
82%
13
Domestic Production Will Be Key to Servicing the Growing Indian Market
LEEL’s domestic production base acts as a key strength when other players relook at their manufacturing strategies
With Limited Domestic Production, Prices Have Stiffened in 2011 Business Models for AC Players in India
Captive
manufacturing
Imports
Outsourced
manufacturing
(volume in mn units) (share in %)
28 27 26 26
28
15 15 15 16 17
2006-07 2007-08 2008-09 2009-10 2010-11
Split ACs Window ACs
(average prices in Rs „000 per unit)
Source: Crisil Research, Directorate General of Foreign Trade

AC Imports Have Been Rising, Mostly from China
0.5
0.9 0.8
1.0
0.06 0.09 0.14 0.09
2006-07 2007-08 2008-09 2009-10
Imports Exports
India Increasingly Becoming More Competitive for Manufacturing
China64%
Malaysia21%
Thailand10%
Others5%
14
Imports May Not be Sustainable
LEEL has consistently grown in the midst of rising imports, positioned strongly as imports peak out
INR Has Depreciated Over 22% Relative to RMB in 2011
0.5 0.8
2.0
4.5
2000 2005 2010 2014E
Labor Cost in Chinese Manufacturing Has been Rising Consistently
Manufacturing labor cost has been rising in China
Strengthening Yuan and weakening Rupee have made India relatively
more competitive than China for AC manufacturing
With FTAs, India is more competitive in exporting to South & South
East Asian nations
Players totally dependant on Chinese imports likely to commence
sourcing from Indian manufacturers
With increasing scale in India, economics expected to improve
further
(volume in mn units)
(fully loaded factory worker wages in USD/hr)
(2009-10 imports share in %)
Source: Directorate General of Foreign Trade
Source: BCG
90
95
100
105
110
115
120
1/3/2011 4/3/2011 7/3/2011 10/3/2011 1/3/2012
RMB/USD INR/USD
(indexed on 1/1/2011)
Source: Bloomberg

Key Growth Drivers
Capacity augmentation by India Railways
Targeted addition of 2,800 km , capex of Rs 200 Bn p.a.
Line enhancement of 6,500km, capex of Rs 170 Bn p.a.
New rail coach factory commissioned in Raebareili
Metro rail projects
Under construction metro projects in 8 cities
8 metro projects in pipeline
International markets – with IRIS(1) certification, eligible to bid
internationally
Key Products
15
Railway Air-conditioning Segment
With increasing coach production in India, RMPUs is a rapidly growing market
Rising Number of AC Coach Production in India (RCF)
(1) International Railway Industry Standards
(2) Rail Coach Factory
Roof Mounted Packaged Unit (RMPU) for AC rail coaches
Key Growth Drivers
Roof Mounted Packaged Unit (RMPU) for LHB coaches
Roof Mounted Packaged Unit (RMPU) for metro rail
248
322 340
486 482 518
2003-04 2004-05 2005-06 2006-07 2007-08 2008-09
(production volumes at Railway Coach Factory)
RCF(2), Kapoorthala Has Been Ramping Up AC Coach Production

Key Application Areas Key Products
16
Heat Exchangers – Market Overview
Market Leadership
Room ACs and refrigeration are fastest growing segments for coils
Retail market is the primary driver for these segments
LEEL is the leading layer with largest market share in non-industrial
heat exchangers
Other key players include
Advantec
Spirotec
Room Air Conditioners
Automobile Air Conditioners
Rail Air Conditioners
Precision Air Conditioners
Commercial Refrigeration
Condenser coils
Evaporator coils
Fin & tube heat exchangers
Sheet metals parts & components
Industrial heat exchanger
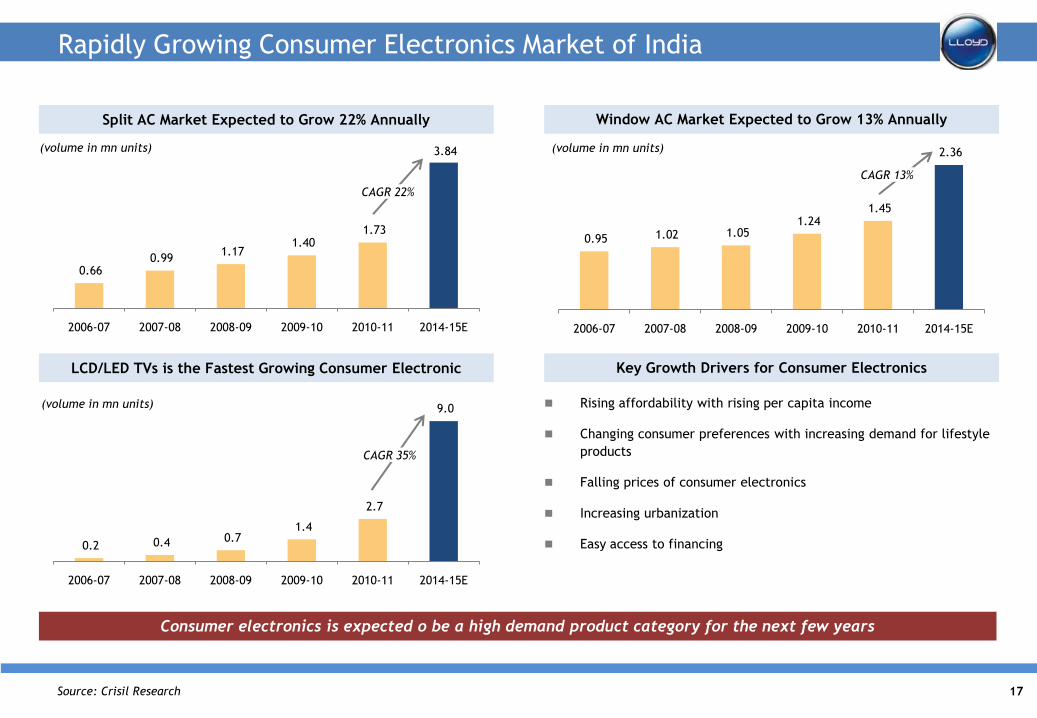
Split AC Market Expected to Grow 22% Annually
0.66 0.99
1.17 1.40
1.73
3.84
2006-07 2007-08 2008-09 2009-10 2010-11 2014-15E
Window AC Market Expected to Grow 13% Annually
0.95 1.02 1.05 1.24
1.45
2.36
2006-07 2007-08 2008-09 2009-10 2010-11 2014-15E
17
Rapidly Growing Consumer Electronics Market of India
Consumer electronics is expected o be a high demand product category for the next few years
LCD/LED TVs is the Fastest Growing Consumer Electronic
0.2 0.4 0.7 1.4
2.7
9.0
2006-07 2007-08 2008-09 2009-10 2010-11 2014-15E
Key Growth Drivers for Consumer Electronics
Rising affordability with rising per capita income
Changing consumer preferences with increasing demand for lifestyle
products
Falling prices of consumer electronics
Increasing urbanization
Easy access to financing
(volume in mn units)
CAGR 22%
(volume in mn units)
CAGR 13%
(volume in mn units)
CAGR 35%
Source: Crisil Research

Introduction
Effective from July 1, 2011, consumer products division of Fedders
Lloyd transferred to Lloyd Electric
Key products of CPD - window & split ACs and LCD/LED TVs
Other products - tower & cassette ACs, clothes dryer, chest
freezer & garment steamer
Aggressive marketing campaign with celebrity brand ambassador
Product Portfolio - High Growth Products
18
Consumer Products Division – leveraging product experience
Poised for a long term play in consumer products with sustainable advantages
Key Competitive Advantages Product Portfolio - Niche Consumer Products
Vertically integrated – cost control
Rich product development experience, technologically at par with the
best
Significant capacity in India – better proximity to markets
Leveraging brand across products
Facilitated entry into LCD/LED TVs
Strong brands with history of over 50 years
Window ACs Split ACs LCD/LED TVs
Clothes dryer Chest freezer Garment steamer
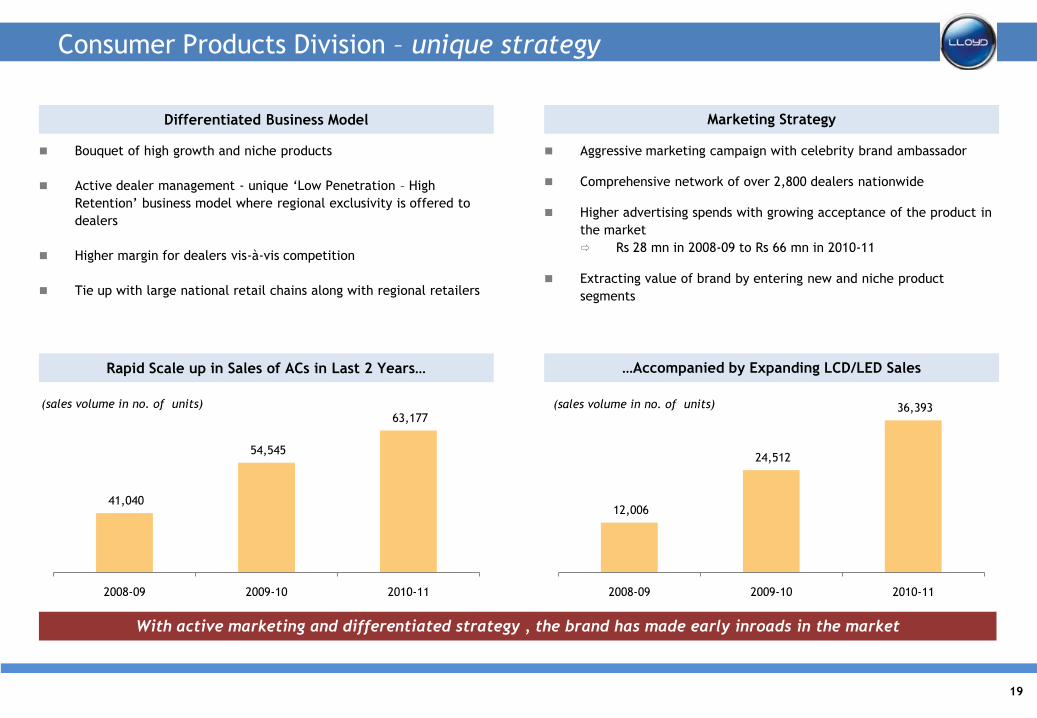
Differentiated Business Model
Bouquet of high growth and niche products
Active dealer management - unique ‘Low Penetration – High
Retention’ business model where regional exclusivity is offered to
dealers
Higher margin for dealers vis-à-vis competition
Tie up with large national retail chains along with regional retailers
Marketing Strategy
Aggressive marketing campaign with celebrity brand ambassador
Comprehensive network of over 2,800 dealers nationwide
Higher advertising spends with growing acceptance of the product in
the market
Rs 28 mn in 2008-09 to Rs 66 mn in 2010-11
Extracting value of brand by entering new and niche product
segments
19
Consumer Products Division – unique strategy
With active marketing and differentiated strategy , the brand has made early inroads in the market
Rapid Scale up in Sales of ACs in Last 2 Years…
41,040
54,545
63,177
2008-09 2009-10 2010-11
…Accompanied by Expanding LCD/LED Sales
(sales volume in no. of units)
12,006
24,512
36,393
2008-09 2009-10 2010-11
(sales volume in no. of units)

Overview
Acquired from Luvata Group in May 2008, now 100% subsidiary of
LEEL
Manufacturing plant located in Prague, Czech Republic
Sales offices in Lyon (France), Derby (UK), Essen (Germany)
Market coverage across entire European region
Key markets– France, Germany, Spain, Germany, UK, Slovakia
Successfully transferred technology to Indian operations to cater to
global client at multiple locations
Key financials (Rs mn)(1)
Product Portfolio
20
International Presence – Lloyd Coils Europe s.r.o.
Gives access to international markets & technology
Condenser coils for HVAC&R
remote condensers, condensing units, close control AC, chillers,
showcases, display cases, bottle coolers, milk tanks,
transportation AC and refrigeration
Evaporator coils for HVAC&R
close control AC, rooftops, air-handling units, fan-coils,
ducted systems, air curtains and transportation AC, bottle
coolers
Reversible coils
heat pumps, dehumidifiers
Water & glycol coils
unit heaters, fan coils, convectors, air handling units,
ducted systems, air curtains and cold beams and glycol
heat recuperation circuits
Special or industrial coils
Oil coolers for hydraulic systems; water and liquid coolers
for industry and power plants
Aluminum coils
lighter and cheaper substitute to copper coils
(1) 1 Euro = INR 70
1,679
1,259
3.1 39.2 30.4 39.2
2010-11 H1 2011-12
Revenue PBT PAT

Overview
Acquired from LENNOX, USA in 2009
100 years of experience in air conditioning solutions
100% subsidiary of LEEL
Manufacturing plant located in Prague, Czech Republic
Sales offices in Lyon (France), Derby (UK), Essen (Germany)
Key financials (Rs mn)(1)
Product Portfolio
Air handling units KLM, KLMV, KLME, KLMQ
Air conditioningcondensing unit, chillers, rooftops, fan coils,
dry coolers, compact units
Fanssingle inlet, double inlet, low pressure,
middle pressure, specialized
Industrial cooling
duct & steam heat exchangers, industrial
heaters & coolers, cooling batteries for
locomotives
21
International Presence – Janka Engineering s.r.o.
Helps LEEL extend its core air conditioning skills to European markets
Highlights
Single supplier of cooling units to nuclear power project in Slovakia
Supplier to nuclear power project in Czech Republic
Developing new range of Tram AC units for Prague tramways
Development of under-ceiling unit under way
738
478
(17) (15)(15) (15)
2010-11 H1 2011-12
Revenue PBT PAT
(1) 1 Euro = INR 70

Production Facilities - LEEL
Location Product LinesCapacity
(No. of Units)Status
Bhiwadi, Rajasthan
Heat exchangers 1,025,000
Operational for last 23 years
Fan coils, cooling units 10,000
A/Cs (railway) 2,000
Sheet metal 300,000
Kala Amb, Himachal Pradesh
Heat exchangers 200,000
Operational
A/Cs (window, split) 200,000
Dehradun, Uttarakhand A/Cs (window, split) 200,000 Operational
Pant Nagar, Uttarakhand A/Cs (split) 201,000 Operational
Ranipet, Tamil Nadu A/Cs (window, split) 100,000 Operational
Haridwar, Uttarakhand A/Cs (railway) 6,000 To be commissioned in September 2012
22

Adherence to Highest Standards of Quality
23
ISO 9001-2008 – Quality
Management System
Company’s quality policyUL Certification from
Underwriters Laboratories,
USA
International Railway
Industry Standards (IRIS)
certification

Perfect Radiators & Oil Coolers Ltd(PROC)Company Overview
24

Introduction
One of the largest maker of mechanically bonded radiators in
India
Manufacturing capacity of 100,000 units/annum
State of the art production facilities at Haridwar & Tauru
Manpower of 400 including engineers, supervisors & workmen
ISO 9001, ISO 14001 & OHSAS 18001, IRIS certified
Key Products
25
Overview
Key Financials
(Rs mn) FY08 FY09 FY10 FY11
Revenue 950 1,129 1,311 1,456
EBITDA 30 50 85 101
PAT 16 15 108(1) 53
Net worth 92 109 246 299
Net debt 318 278 232 55
Key Application Areas
Mechanical Bonded
Radiators Oil coolers Charge Air Coolers
Radiators – auto, farm
eqpt, earthmoving eqpt
Cooling systems
componentsShell & tube
heat exchangers
Automobile cooling systems
Earth moving equipment
Compressors & air conditioning
Captive power plants
Defence systems
Locomotives
(1) Profit on sale of investments of Rs 65mn

Financial Overview

Air Conditioner Sales Volume
190,129
262,805 271,616
308,863
351,782
2006-07 2007-08 2008-09 2009-10 20010-11
Heat Exchangers Sales Volume
728,023
939,571
793,564
1,141,646
900,165
2006-07 2007-08 2008-09 2009-10 2010-11
Condensing & Evaporating Coils (No.)
27
Key Financials – Income Statement (standalone)
Steadily Growing Topline (impact of recession in FY09)
4,966
6,699 5,879
6,795
7,836
661 818 501 731 823 430 527 204 343 361
2006-07 2007-08 2008-09 2009-10 20010-11
Revenue EBITDA PAT
Raw Material Prices & Interest Rates Have Impacted Margins
13.3%12.2%
8.5%
10.8% 10.5%
8.7%7.9%
3.5%
5.0% 4.6%
2006-07 2007-08 2008-09 2009-10 2010-11
EBITDA margin PAT margin
(No. of units)
(Rs mn)
Heat exchanger volumes vary with varying size of the product every year
Margins have stabilized after re-adjustment of LME prices
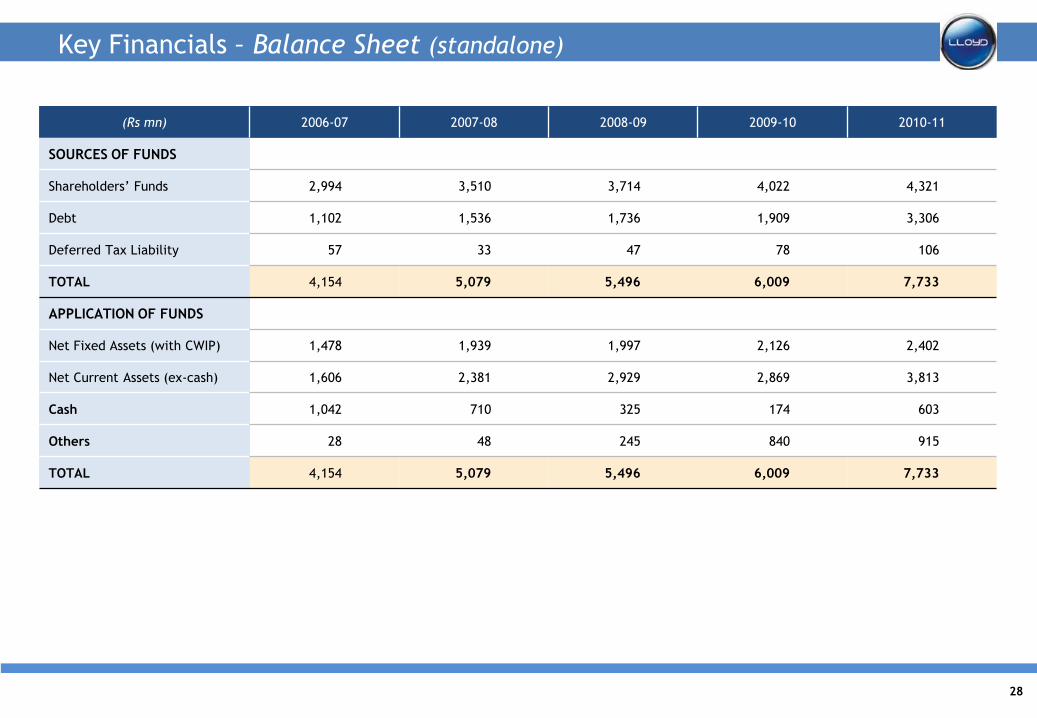
Key Financials – Balance Sheet (standalone)
(Rs mn) 2006-07 2007-08 2008-09 2009-10 2010-11
SOURCES OF FUNDS
Shareholders’ Funds 2,994 3,510 3,714 4,022 4,321
Debt 1,102 1,536 1,736 1,909 3,306
Deferred Tax Liability 57 33 47 78 106
TOTAL 4,154 5,079 5,496 6,009 7,733
APPLICATION OF FUNDS
Net Fixed Assets (with CWIP) 1,478 1,939 1,997 2,126 2,402
Net Current Assets (ex-cash) 1,606 2,381 2,929 2,869 3,813
Cash 1,042 710 325 174 603
Others 28 48 245 840 915
TOTAL 4,154 5,079 5,496 6,009 7,733
28

Disclaimer
This presentation has been prepared by Lloyd Electric & Engineering Ltd (the “Company”) and is being furnished to you, the recipient, solely for your
information and may not be reproduced, delivered or transmitted (in whole or in part), directly or indirectly, by any means to any other person in any
manner. No independent verification has been made of any information provided in the document.
Certain statements in this presentation may not be based on historical financial information or facts and are or may be “forward-looking statements”. These
statements are based on current expectations and assumptions and are based on currently available information. Actual results are subject to a number of
risks and uncertainties, which could cause the Company‟s actual performance to differ materially from those anticipated, including future changes or
developments in the Company‟s business, its competitive environment and political, economic, legal and social conditions. Any reference to past
performance should not be taken as an indication of future performance. Due to the risks, uncertainties and assumptions inherent in forward-looking
statements, prospective investors in the Company‟s securities should not place undue reliance on these forward-looking statements. The information
contained in this presentation is only current as of its date. The Company may alter, modify or otherwise change in any manner the content of this
presentation, and the Company does not intend or assume any obligation to update any of these statements.
This presentation is for general information purposes only, without regard to any specific objectives, financial situations or informational needs of any
particular person. This presentation does not constitute an offer or invitation to purchase or subscribe for any securities of the Company by any person in any
jurisdiction. No part of this presentation should form the basis of or be relied upon in connection with any investment decision or any contract or
commitment to purchase or subscribe for any securities.
By attending this presentation, you acknowledge that you will be solely responsible for your own assessment of the market and the market position of the
Company and that you will conduct your own analysis and be solely responsible for forming your own view of potential future performance of the business of
the Company
29

Thank You
30
![Lloyd Electric and Engineering Limited announces acquisition of Noske-Kaeser's Rail & Vehicle global business [Company Update]](https://static.fdocuments.us/doc/165x107/577c83db1a28abe054b68b45/lloyd-electric-and-engineering-limited-announces-acquisition-of-noske-kaesers.jpg)