
Living with the Lakes · The St. Clair and Detroit rivers, and Lake St. Clair between them, form an...
40
Living with the Lakes Living with the Lakes Understanding and Adapting to Great Lakes Water Level Changes Understanding and Adapting to Great Lakes Water Level Changes
Transcript of Living with the Lakes · The St. Clair and Detroit rivers, and Lake St. Clair between them, form an...

Living withthe LakesLiving withthe Lakes
Understanding and Adapting toGreat Lakes Water Level ChangesUnderstanding and Adapting to
Great Lakes Water Level Changes

2
This publication is a joint project of the U.S. Army Corps of Engineers,Detroit District, and the Great Lakes Commission.
EditorsRoger Gauthier, U.S. Army Corps of Engineers, Detroit DistrictMichael J. Donahue, Julie Wagemakers and Tom Crane, Great Lakes Commission
WritersChristine Manninen, Great Lakes CommissionRoger Gauthier, U.S. Army Corps of Engineers, Detroit District
DesignersLara Slee, Great Lakes CommissionMark Paasche, U.S. Army Corps of Engineers, Detroit District
Maps and graphicsDennis Rundlett and Timothy Calappi, U.S. Army Corps of Engineers, DetroitDistrict
The authors wish to acknowledge the assistance of the followingreviewers:LTC Robert Davis, David Dulong, Neal Gehring, Ronald Erickson, David Schweiger,Scott Thieme, Carl Woodruff, James Selegean, and Joseph Mantey, U.S. Army Corps ofEngineers, Detroit DistrictJohn Kangas, U.S. Army Corps of Engineers, Great Lakes Regional OfficeFrank Bevacqua, International Joint CommissionDouglas Cuthbert, Ralph Moulton, Len Falkiner and David Fay, Environment CanadaDouglas Wilcox, U.S. Geological SurveyFrank Quinn, NOAA Great Lakes Environmental Research LaboratoryDan Injerd, Illinois Department of Natural ResourcesDick Bartz, Ohio Department of Natural ResourcesBrian Miller, Illinois-Indiana Sea GrantJack Mattice, New York Sea GrantSteve Curcio, Pennsylvania Sea GrantPhilip Keillor, Wisconsin Sea GrantDonald Olendorf, Lake Michigan Shore AssociationJoseph Milauckas, Douglas Lakeshore AssociationSusan Gauthier
Copyright ©1999 by U.S. Army Corps of Engineers and GreatLakes Commission. Second Printing, February 2000.
ISBN 0-9676123-0-6
MEASUREMENTS CONVERTER TABLE
U.S. to Metric
L e n g t hfeet x .305 = metersmiles x 1.6 = kilometers
V o l u m ecubic feet x 0.03 = cubic metersgallons x 3.8 = liters
A r e asquare miles x 2.6 = square kilometers
Masspounds x 0.45 = kilograms
Metric to U.S.
L e n g t hmeters x 3.28 = feetkilometers x 0.6 = miles
V o l u m ecubic meters x 35.3 = cubic feetliters x 0.26 = gallons
A r e asquare kilometers x 0.4 = square miles
Masskilograms x 2.2 = pounds
Printed on recycled paper.
The Great Lakes Commission is an eight-state compact agency established in1955 to promote the orderly, integrated and comprehensive development, use
and conservation of the water resources of the Great Lakes basin.
The Detroit District, established in 1841, is responsible for waterresource development in all of Michigan and the Great Lakes watersheds in
Minnesota, Wisconsin and Indiana.
Photo creditsCover: Michigan Travel Bureau; Page 3 (l. to r.): Michigan Travel Bureau,Michigan Travel Bureau, Illinois-Indiana Sea Grant (photo by DavidRiecks); Page 4: Illinois-Indiana Sea Grant (photo by David Riecks); Page 5:U.S. Army Corps of Engineers (USACE) (image by Lisa Jipping); Page 8:Michigan Travel Bureau; Page 9: National Park Service, Indiana DunesNational Lakeshore (photo by Richard Frear); Page 10 (t. to b.): MichiganTravel Bureau (photo by Randall McCune), National Park Service (photoby Richard Frear); Page 11 (t. to b.): Michigan Travel Bureau, MinnesotaSea Grant, USACE (photo by Jerry Bielicki); Page 12: Michigan TravelBureau (photo by Randall McCune); Page 13: Michigan Travel Bureau(photo by Carl Ter Haar); Page 19: New York Power Authority; Page 21:Michigan Travel Bureau; Page 22 (all): USACE; Page 25: USACE; Page 26:USACE, Minnesota Extension Service (photo by Dave Hansen), MichiganTravel Bureau (photo by Carl Ter Haar); Page 27 (l. to r.): USACE, USACE(photo by Roger Gauthier); Page 29: Michigan Travel Bureau; Page 30:Michigan State University; Page 31 (l. to r.): USACE, USACE, MichiganState University; Page 32 (l. to r.): Chicago Dept. of Tourism (photo by Wm.Recktenwald), USACE, USACE; Page 33: USACE; Page 34 (all): USACE; Page35 (t. to b.): Natural Resources Conservation Service (photo by RomyMyszka), USACE, Minnesota Extension Service (photo by Dave Hansen),USACE; and, Page 36: USACE .
The authors also wish to give special acknowledgment to the followingresource: “Visualizing the Great Lakes” web site (http://www.epa.gov/glnpo/image), cooperatively produced by Minnesota Sea Grant and theU.S. EPA, Great Lakes National Program Office.
Additional copies available from:
Great Lakes CommissionArgus II Building400 Fourth StreetAnn Arbor, Michigan 48103-4816Phone 734-665-9135Web: www.glc.org
Also available for downloading from the Great Lakes InformationNetwork (GLIN), Hydrology section:http://www.great-lakes.net/envt/water/hydro.html
Order your copy of Living with the Lakes!

3
ContentsIntroduction • 5
The Great Lakes-St. Lawrence River system, how the lakes wereformed, people and the Great Lakes, consumptive andnonconsumptive uses of water
Natural Factors • 13The hydrologic cycle, water level fluctuations, weather
Human Influence on the System • 19Lake Superior and St. Marys River; St. Clair River, Lake St. Clair andDetroit River; Niagara River; Lake Ontario and the St. LawrenceSeaway and Power Project; diversions
Controlling Water Levels • 25Regulating outflows, measuring water levels, water level forecasting
Effects of Lake Level Fluctuations • 29Erosion processes, habitat diversity, commercial shipping andrecreational boating
Living Along the Shoreline • 33Structural and nonstructural options for shoreline protection
Also...Points of Contact • 37
Additional Resources • 39
As stewards of the natural resources, it is our responsibility to understand the causes and
implications of Great Lakes water level changes. Only through this understanding can we make
informed decisions and educate future generations about living with the lakes.
Port Huron to Mackinac Race, Lake Huron; Lake Michigan beach at Petoskey, Michigan; and Calumet Sag Channel, Calumet Park, Illinois, on Lake Michigan

4
Indiana Dunes State Park, Lake Michigan

5
Introduction
The Great Lakes-St. Lawrence River system is a dynamic
environment, still evolving over time. Ever since the last glaciers
retreated more than 10,000 years ago, Great Lakes water levels and
outflows have varied dramatically. The Great Lakes affect human
activities and all aspects of the natural environment, from weather
and climate, to wildlife and habitat. Unlike oceans, where tides are
constant and predictable, water levels on the Great Lakes can vary
significantly in frequency and magnitude making them difficult to
accurately predict.
Satellite image of the Great Lakes and their drainage basins

6
Covering more than 94,000 square miles and draining more than twice as much
land, the Great Lakes hold an estimated 6 quadrillion gallons of water.
The Great Lakes-St. Lawrence River drainage basin includes part or all of the eight
U.S. states of Minnesota, Wisconsin, Illinois, Indiana, Michigan, Ohio, Pennsylvania
and New York and the Canadian provinces of Ontario and Quebec. More than one-
tenth of the population of the United States and one-quarter of the population of
Canada inhabit this watershed.
The ecosystem is blessed with huge forests and wilderness areas, rich agricultural
land, hundreds of tributaries and thousands of smaller lakes, extensive mineral
deposits, and abundant wildlife, including a world-class fishery. The binational region
is North America’s industrial heartland, and also supports a multi-billion-dollar
outdoor recreation and tourism industry, a strong maritime transportation system
and a diverse agricultural base.
The Great Lakes -
Superior, Michigan,
Huron, Erie and
Ontario - and their
connecting channels
and the St. Lawrence
River form the largest
fresh surface water
system on Earth.
The Great Lakes -St. Lawrence Riversystem

7
How the lakeswere formed About a billion years ago, a fracture in the earth running from what is now Oklahoma
to Lake Superior generated volcanic activity that almost split North America. Over
a period of 20 million years, lava intermittently flowed from the fracture. This
geomorphic age created mountains covering the regions now known as northern
Wisconsin and Minnesota, and the Laurentian mountains were formed in eastern Canada.
Over time these mountains eroded, while occasional volcanic activity continued. Molten
magma below the highlands of what is now Lake Superior spewed out to its sides, causing
the highlands to sink and form a mammoth rock basin that would one day hold Lake
Superior. Eventually the fracture stabilized and, over time, the rock tilted down from
north to south.
The region went from fire to ice with the arrival of the glaciers, which advanced and
retreated several times over the last 5 million years. During the periods of glaciation,
giant sheets of ice flowed across the land, leveling mountains and carving out massive
valleys. Where they encountered more resistant bedrock in the north, only the overly-
ing layers were removed. To the south, the softer sandstones and shales were more
affected. As the glaciers melted and began receding, their leading edges left behind high
ridges, some of which can be seen today in the cliffs of Door County, Wisconsin, and
the Bruce Peninsula in Ontario. Huge lakes formed between these ridges from the re-
treating ice fronts, and continually changed over time as the ice sheet moved north-
ward.
Early drainage from these lakes flowed southward through the present Illinois
River Valley toward the Mississippi River, through the Trent River Valley between
present lakes Huron and Erie and through the Lake Nippissing-Ottawa River Valley
from Georgian Bay on Lake Huron downstream to the present Montreal, Quebec, area.
The glaciers began
to retreat almost
14,000 years ago.
Most of the icefields
left the Great Lakes
region about 7,000 -
9,000 years ago.
Prehistoric glacial movements and lake shapes

8
Without the immense weight of the glaciers—thousands of feet thick in places— the
land began to rebound. Even today, virtually all of the land in the Great Lakes basin
continues to rise. Southern parts of the basin are rising slightly, less than 3 inches per
century. The northeastern corner of the Lake Superior basin, however, is rebounding in
excess of 21 inches per century. (See description of crustal rebound on page 17.)
Since the retreat of the glaciers, water levels continued to undergo dramatic fluctuations,
some in the magnitude of hundreds of feet. These extremes were caused by changing
climates, crustal rebound and natural opening and closing of outlet channels. Within
the last 1,000 years, evidence suggests that lake levels exceeded the range of levels
recorded since 1865 by an additional five feet on lakes Michigan and Huron. As a
consequence of these recent fluctuations, shoreline position and environments have
dramatically changed. Dunes, baymouth barriers, embayments and river mouths have
all been modified by the forces of water. Many dune formations—some hundreds of feet
thick—were established during glacial periods. The tops of these dunes have been con-
tinuously sculpted by winds to form the majestic structures now visible.
Today, rebounding of the earth’s crust, erosion, and changes in climate continue to
alter the shapes and sizes of the Great Lakes. As one of the youngest natural features on
the North American continent, the lakes remain a dynamic, evolving system.
Pt. Aux Barques, Michigan, on Lake Huron
Even today, virtually
all of the land in the
Great Lakes basin
continues to rise.
Four of the five Great
Lakes are at different
elevations, leading like a
series of steps toward the
Atlantic Ocean. The five
individual lakes are
connected to each other
through channelways,
forming one system.
Water continually flows
from the headwaters of the
Lake Superior basin through the remainder of the system.
The St. Marys River is a 60-mile waterway flowing from Lake Superior down to Lake Huron, descending more than 20
feet in elevation. Lakes Michigan and Huron are connected by the deep Straits of Mackinac and are considered to be one
lake hydraulically with lake levels rising and falling together. The St. Clair and Detroit rivers, and Lake St. Clair between
them, form an 89-mile-long channel connecting Lake Huron with Lake Erie. The fall between Lake Huron and Lake Erie is
only about 8 feet. The 35-mile Niagara River links lakes Erie and Ontario, with the majority of the 325-foot difference in
elevation occurring at Niagara Falls. The man-made Welland Canal also links the two lakes, providing a detour around
Niagara Falls. From Lake Ontario, water flows into the St. Lawrence River, which converges with the Ottawa River near
Montreal to flow to the Atlantic Ocean.
The Great Lakes andconnecting channels
The Great Lakes andconnecting channels
Elevations referenced IGLD, 1985.

9
People arrived in the Great Lakes basin about 10,000 years ago. By the 1500s, an
estimated 60,000 to 120,000 aboriginal people lived in the area. The fertile soils,
plentiful water and game supported the native people, who took to the lakes and
tributaries in their birch bark canoes. In the north, they mined copper, using rocks
to hammer pure chunks from the bedrock; this copper made its way by trade as far as
present-day New York. The descendants of these first inhabitants were to become
many current Native American Indian tribes, including the Oneida, Mohawk,
Wyandot, Chippewa, Iroquois, Algonquin, Menominee, Ojibwa, Ottawa, Potawatomi
and Winnebago.
By the early 1600s, explorers, missionaries and fur traders arrived, with Lake Huron
the first of the Great Lakes to be seen by Europeans. Samuel de Champlain called the lake
La Mer Douce, “the sweetwater sea.”
French fur traders followed the water routes used by the Indians, traveling
the lakes in their canoes with loads of beaver and other pelts bound for east
coast settlements and Europe. Some of these canoes carried crews of six to 12
voyageurs and loads of more than 5,000 pounds. The French established bases,
and later military forts, to protect the fur trade. The British followed suit, opening
the way for settlement. The fur trade lasted until the early 1800s, followed by a
logging campaign that stripped vast areas of virgin forests from most of the
watersheds.
People andthe Great Lakes
Plentiful water and
game have drawn
people to the Great
Lakes region for
nearly 10,000 years.
Lake Michigan in Indiana

10
Industry It’s no coincidence that most of the region’s large industrialized urban areas
are located on the shores of the Great Lakes, not only because of transportation
advantages but because of the seemingly inexhaustible supply of freshwater for
domestic and industrial use. In fact, half of Canadian manufacturing and one-fifth of
U.S. manufacturing is based on the region’s freshwater coast. The binational
Great Lakes region accounts for approximately 60 percent of steel production in
North America. The pulp and paper industry also demands large quantities of water in its
manufacturing operations. About 10 percent of the water used in industrial processes is
consumed, with the remainder returned to the watershed following treatment.
Agriculture Agriculture in the Great Lakes region is diverse and productive, with grain,
corn, soybeans, dairy, and livestock as the region’s mainstays. Unique climate
niches have created a wealth of specialty crops. For example, the western shore
of Michigan’s lower peninsula provides excellent conditions for orchards and
vineyards. Today, about one-third of the land in the basin is used for agriculture,
supporting nearly 25 percent of the total Canadian agricultural production and 7
percent of the U.S. production. Irrigation represents a modest but growing
consumptive use of Great Lakes water.
Thermoelectric power Fossil fuel and nuclear power plants around the lakes use water for cooling
equipment and to produce steam to drive turbines. Less than 2 percent of
these withdrawals are consumed, lost primarily through evaporation. The
remainder is returned to the lakes.
Drinking water Municipalities throughout the Great Lakes basin draw tens of billions of gallons of
water per day from the Great Lakes to satisfy their public water supply needs. Public
water supply systems provide water to homes, schools and offices, as well as to
industrial facilities and businesses. The average household uses 100 gallons of
water per person per day. In addition, millions of people in both rural and urban
areas of the Great Lakes basin rely on groundwater for their sole supply of water.
Groundwater is important to the Great Lakes ecosystem, serving as a reservoir
that replenishes the lakes in the form of base flow in tributaries.
The term consumptive use refers to any quantity of water that is withdrawn from
the Great Lakes system and not returned. Current consumptive uses of the lakes
include drinking water for humans and livestock, irrigation and industrial uses.
Due to the large volume of water in the Great Lakes, consumptive use has only a
minor effect on water levels.Uses of Great Lakes
resources have all had
profound impacts on
the regional landscape
and ecosystems. Many
of these uses affect the
quality of the water
resources available,
while some can affect
the quantity of water
throughout the system.
Consumptive uses
Power plant and dunes on Lake Michiganshoreline in Indiana
A farm in Michigan in the Lake Erie drainage basin

11
Shipping The Great Lakes and St. Lawrence River are
part of a vast system linking North America’s
heartland with ports and markets throughout the
world. The world’s longest deep-draft inland
waterway, the system extends from Duluth,
Minnesota, on Lake Superior, to the Gulf of St.
Lawrence on the Atlantic, a distance of more than
2,340 miles. This shortcut to the continent’s
interior was made possible with the construction of a ship canal and lock system
opened in 1855 at Sault Ste. Marie, Michigan, the development of the Welland Canal
since 1829, and the completion of the St. Lawrence Seaway in 1959.
Recreational boating, sport fishing and commercial fishing The Great Lakes offer outstanding tourism and recreation opportunities, ranging
from wilderness areas such as Isle Royale, a U.S. island national park, to waterfront
parks in major cities. A well-defined four-seasons climate supports many types of
outdoor recreation, from ice fishing in the winter to boating, swimming and fishing
in the summer. The eight Great Lakes states have about 3.7 million registered
recreational boats, or about a third of the nation’s total. Michigan and Minnesota
lead the U.S. in the number of boat registrations, and six Great Lakes states rank
in the nation’s top ten in total number. Approximately a million recreational
boats ply the U.S. waters of the Great Lakes each year. The commercial and
sport fishing industry is collectively valued at more than $4 billion annually.
Nonconsumptive use refers to any water withdrawal or instream use in which
the entire quantity is returned to the system. Nonconsumptive uses of the lakes
include transportation, hydroelectric power generation and water-based
recreation.
Hydroelectric power Hydroelectric power generation is by far the largest instream use for Great
Lakes water. Hydroelectric power production at plants located on the St. Marys,
Niagara and St. Lawrence rivers is dependent upon the “head” or difference
between upstream and downstream water levels. During most periods,
differences in these levels are relatively constant and power production is not
significantly affected. During periods of significant increases in outflows from a lake,
power production can increase substantially. The converse is true under very low
outflow conditions. Utilities also use coal, oil, natural gas and nuclear power to produce
electricity in the Great Lakes region.
Ocean-going vessel in Duluth, Minnesota - Superior, Wisconsin, Harbor on Lake Superior
Charter fishing on Lake Michigan
Nonconsumptive uses
Commercial fishing in Duluth, Minnesota, onLake Superior

12
Crooked Lake, Emmet County, Michigan: One of thousands of inland lakes in the Great Lakes basin

13
Natural Factors
The difference between the amount of water coming into a lake
and the amount going out is the determining factor in whether
the water level will rise, fall or remain stable. When several
months of above-average precipitation occur with cooler, cloudy
conditions that cause less evaporation, the levels gradually rise.
Likewise, prolonged periods of lower-than-average precipitation and
warmer temperatures typically result in lowering of water levels.
Grand Haven, Michigan, lighthouse on Lake Michigan during storm
14
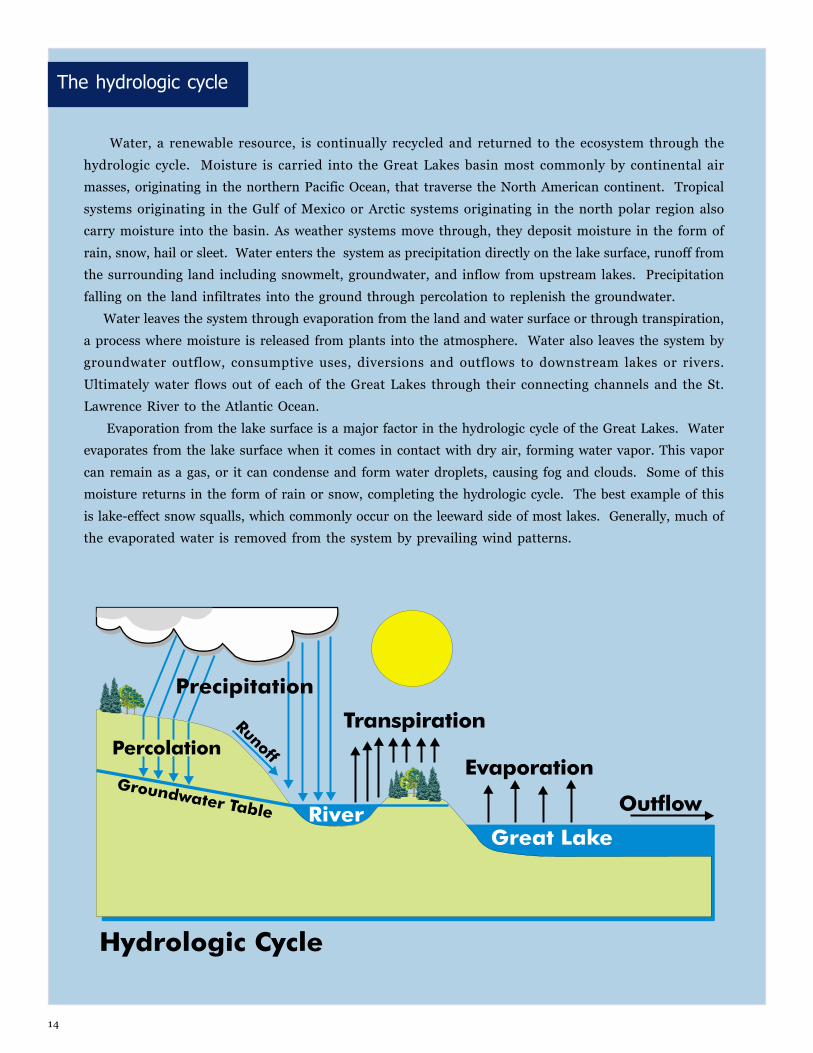
Water, a renewable resource, is continually recycled and returned to the ecosystem through the
hydrologic cycle. Moisture is carried into the Great Lakes basin most commonly by continental air
masses, originating in the northern Pacific Ocean, that traverse the North American continent. Tropical
systems originating in the Gulf of Mexico or Arctic systems originating in the north polar region also
carry moisture into the basin. As weather systems move through, they deposit moisture in the form of
rain, snow, hail or sleet. Water enters the system as precipitation directly on the lake surface, runoff from
the surrounding land including snowmelt, groundwater, and inflow from upstream lakes. Precipitation
falling on the land infiltrates into the ground through percolation to replenish the groundwater.
Water leaves the system through evaporation from the land and water surface or through transpiration,
a process where moisture is released from plants into the atmosphere. Water also leaves the system by
groundwater outflow, consumptive uses, diversions and outflows to downstream lakes or rivers.
Ultimately water flows out of each of the Great Lakes through their connecting channels and the St.
Lawrence River to the Atlantic Ocean.
Evaporation from the lake surface is a major factor in the hydrologic cycle of the Great Lakes. Water
evaporates from the lake surface when it comes in contact with dry air, forming water vapor. This vapor
can remain as a gas, or it can condense and form water droplets, causing fog and clouds. Some of this
moisture returns in the form of rain or snow, completing the hydrologic cycle. The best example of this
is lake-effect snow squalls, which commonly occur on the leeward side of most lakes. Generally, much of
the evaporated water is removed from the system by prevailing wind patterns.
The hydrologic cycle

15
Short-term fluctuations Some water level fluctuations are not a function of changes in the amount of
water in the lakes. These fluctuations, generally short in duration, are due to winds
or changes in barometric
pressure. Short-term fluc-
tuations, lasting from a
couple hours to several days,
can be very dramatic. Fluc-
tuations due to storms or ice
jams are two examples.
Plant growth and ice development in the connecting channels The natural growth of aquatic plants can affect the flow of water in the tributaries
and connecting channels of the lakes. Plant growth decreases the flow of water by
narrowing or partially obstructing the channel through which the water flows. Plant
growth in part depends on the weather, and can vary from month to month and year to
year. In the summer, aquatic plant growth in the Niagara River reduces its flow, on
average, by about 2 percent.
An ice jam in an outlet river can drastically
slow the flow of water out of one lake and into
another. Water levels rise upstream of the jam
and fall downstream. The effects are most
noticeable on the water levels of the affected
river, and of smaller lakes such as St. Clair
and Erie.
On the St. Clair River, normal ice build-up
can reduce the flow in the river by about 5
percent during the winter. A serious ice jam
can reduce flows by as much as 65 percent
for short periods of time. Ice jams can
develop in a matter of hours, but it may take
several days for the jam to be relieved and
water levels and flows to return to normal.
Water levelfluctuations
Wind set-up, storm surge and seiche Sustained high winds from one direction can push the water level up at one end of the
lake and make the level drop by a corresponding amount at the opposite end. This is
called wind set-up or storm surge. Changes in barometric pressure can add to this
effect. When the wind abruptly subsides or barometric pressure changes rapidly, the water
level often will oscillate until it stabilizes again. This phenomenon is known as
seiche (pronounced “sayshe”). The pendulum-like movements within seiches can
continue for days after the forces that created them vanish. Lake Erie is most susceptible
to storm surges and seiches due to its east-west orientation in an area of prevailing westerly
winds and its generally shallow western end.
There are three
kinds of water level
fluctuations:
short-term,
seasonal and
long-term.

16
Seasonal fluctuations The lakes are generally at their lowest levels in the
winter months. In the fall and early winter, when the
air above the lakes is cold and dry and the lakes are
relatively warm, evaporation from the lakes is great-
est. With more water leaving the lakes than entering,
the water levels decline to their seasonal lows.
As the snow melts in the spring, runoff to the lakes
increases. Evaporation from the lakes is least in the
spring and early summer when the air above the lakes
is warm and moist and the lakes are cold. At times,
condensation on the lake surface replaces
evaporation. With more water entering the lakes than
leaving, the water levels rise. The levels peak in the
summer. In the early fall, evaporation and outflows begin to exceed the amount of
water entering the lakes.
The range of seasonal water level fluctuations on the Great Lakes averages about 12
to 18 inches from winter lows to summer highs. The timing of the annual peaks and lows
varies geographically due to differences in climate across the basin. Seasonal rises be-
gin earlier on the more southern lakes where it is warmer with peaks usually occurring
in June or July. Lake Superior, the northernmost lake, is generally the last lake to peak,
usually in August or September.
All water levels on the Great Lakes are measured relative to sea level and ex-
pressed relative to the International Great Lakes Datum (IGLD), last updated in
1985. (For further information on the reference datum, see page 27.)
“Wait a day and the weather will change” is an apt description of
weather in the Great Lakes region, especially in the spring and fall.
That’s because the region is affected by both warm, humid air from
the Gulf of Mexico and cold, dry air from the Arctic. In general, the north experiences cooler
weather, while the south has warmer temperatures. The entire basin experiences four distinct seasons.
The Great Lakes also have a significant influence on the climate. Acting as a giant heat sink, the lakes moderate
the temperatures of the surrounding land, cooling the summers and warming the winters. This results in a milder
climate in portions of the basin compared to other locations of similar latitude. The lakes also act as a giant
humidifier, increasing the moisture content of the air throughout the year. In the winter, this moisture condenses
as snow when it reaches the land, creating heavy snowfall in some areas, known as “snow belts” on the downwind
shores of the lakes. The shores of Lake Superior are particularly prone to this “lake-effect” snow. Some areas
around the lake have recorded more than 350 inches of snow in a single year. During the winter, the temperature of the
lakes continues to drop. Ice frequently covers Lake Erie but seldom fully covers the other lakes.
Weather in theGreat Lakes basin
The range of seasonal
water level fluctuations
on the Great Lakes
averages about
12 to 18 inches
from winter lows
to summer highs.
17
Long-term fluctuations Long-term fluctuations occur over periods of consecutive years and have varied
dramatically since water levels have been recorded for the Great Lakes. Continuous wet and
cold years will cause water levels to rise. Conversely, consecutive warm and dry years will
cause water levels to decline. Water levels have been measured on the Great Lakes since the
1840s. Older records may not be as accurate as current observations, since measurements
were only taken at a single gage per lake until 1918 and observations were not taken as
frequently as they are today.
The Great Lakes system experienced extremely low levels in the late 1920s, mid-1930s
and again in the mid-1960s. Extremely high water levels were experienced in the 1870s,
early 1950s, early 1970s, mid-1980s and mid-1990s. Long-term fluctuations are shown
on the hydrograph presented on the graph on the following page. A hydrograph is a plot of
water levels versus time.
Global warming and a phenomenon known as the ‘greenhouse effect’ could cause significant
changes in long-term lake levels. Although debatable, most predictions indicate that global
warming would cause prolonged declines in average lake levels into the future. These declines
could create large-scale economic concern for virtually every user group in the Great
Lakes basin. Dramatic declines also could compromise the ecological health of the Great
Lakes, particularly in the highly productive nearshore areas.
Besides natural climatic variability and potential man-made climate change, other factors
can affect long-term fluctuations, including changes in consumptive use, channel dredging
or encroachment and crustal movement.
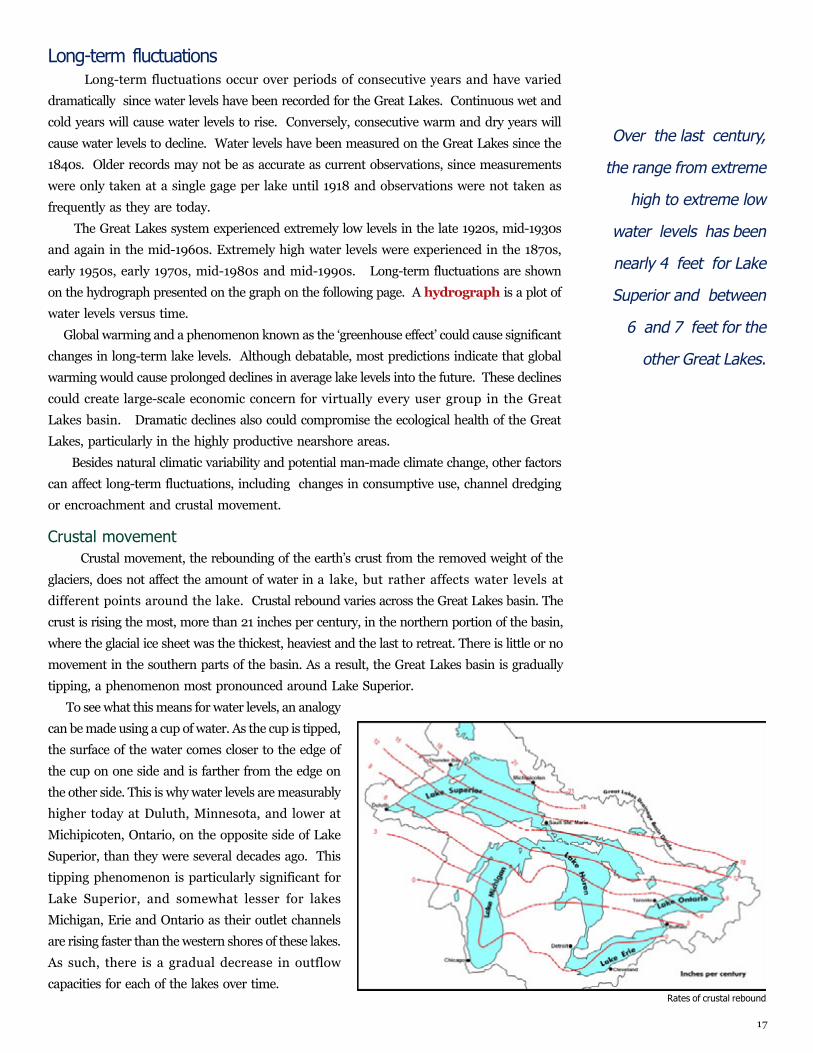
Crustal movement Crustal movement, the rebounding of the earth’s crust from the removed weight of the
glaciers, does not affect the amount of water in a lake, but rather affects water levels at
different points around the lake. Crustal rebound varies across the Great Lakes basin. The
crust is rising the most, more than 21 inches per century, in the northern portion of the basin,
where the glacial ice sheet was the thickest, heaviest and the last to retreat. There is little or no
movement in the southern parts of the basin. As a result, the Great Lakes basin is gradually
tipping, a phenomenon most pronounced around Lake Superior.
To see what this means for water levels, an analogy
can be made using a cup of water. As the cup is tipped,
the surface of the water comes closer to the edge of
the cup on one side and is farther from the edge on
the other side. This is why water levels are measurably
higher today at Duluth, Minnesota, and lower at
Michipicoten, Ontario, on the opposite side of Lake
Superior, than they were several decades ago. This
tipping phenomenon is particularly significant for
Lake Superior, and somewhat lesser for lakes
Michigan, Erie and Ontario as their outlet channels
are rising faster than the western shores of these lakes.
As such, there is a gradual decrease in outflow
capacities for each of the lakes over time.
Over the last century,
the range from extreme
high to extreme low
water levels has been
nearly 4 feet for Lake
Superior and between
6 and 7 feet for the
other Great Lakes.
Rates of crustal rebound

18
Great Lakes systemhistorical levels
A hydrograph is a plot of lake levels versus time. These hydrographs show monthlyaverage water levels for each of the Great Lakes and Lake St. Clair. Levels have beenmeasured on most lakes since 1865, with the present network of water level gagesoperating since 1918. Lake levels change seasonally each year and can vary dramaticallyover longer periods. Short-term fluctuations are of a greater magnitude than the monthlyaverages.
Monthly Mean Water Levels (feet IGLD 1985)
599
600
601
602
603
604
1865
1870
1875
1880
1885
1890
1895
1900
1905
1910
1915
1920
1925
1930
1935
1940
1945
1950
1955
1960
1965
1970
1975
1980
1985
1990
1995
2000
568
569
570
571
572
573
574
575
576
577
578
579
580
581
582
583
241
242
243
244
245
246
247
248
249
1865
1870
1875
1880
1885
1890
1895
1900
1905
1910
1915
1920
1925
1930
1935
1940
1945
1950
1955
1960
1965
1970
1975
1980
1985
1990
1995
2 000
SINGLE GAGE CURRENT GAGING NETWORK
Lake Superior
Lakes Michigan-Huron
Lake St. Clair
Lake Erie
Lake Ontario

19
The Great Lakes are like a series of interconnected bathtubs. Their
outlets are like the drains in the tubs. Outflows increase as water
levels rise in an upstream lake, but are limited by the size of their
outlet channels. As water moves through the Great Lakes-St.
Lawrence River system, it passes through progressively larger
outlets draining all the lakes above it in the system. The outlet from
Lake Superior, at the top of the system, moves about 76,000 cubic
feet of water per second on average. By comparison, the outlet from
Lake Ontario, the last lake in the chain, moves about 243,000
cubic feet per second on average.
Human Influenceon the System
Major hydropower plants in Ontario and New York on the Niagara River

20
The outflow from Lake Superior is controlled near the twin cities of Sault Ste. Marie,
Ontario and Michigan. The outflow began to be changed as early as 1822, when
water was diverted from above the St. Marys Rapids for operation of a sawmill. A
ship canal was constructed in 1855. Subsequently, various expansions to these facilities
took place.
The current flow control facilities consist of three hydropower plants, five navigation
locks and a 16-gated control structure, called the Compensating Works, at the head of the St.
Marys Rapids. Since the Compensating Works were completed in 1921, Lake Superior
outflows have been regulated by humans. This regulation is carried out by the
International Lake Superior Board of Control in accordance with conditions
specified by the International Joint Commission (IJC). The IJC, a binational
agency of the United States and Canada, is responsible for ensuring that the outflow
regulation meets the terms of the Boundary Waters Treaty of 1909 between the two nations.
Lake Superior’s outflows are adjusted monthly, taking into consideration the water
levels of lakes Superior and Michigan-Huron. The objective is to help maintain the lake
levels both on Lake Superior and lakes Michigan and Huron in relative balance compared
to their long-term seasonal averages. For example, if the Lake Superior level is above
its average and the level of lakes Michigan-Huron is below its average, outflows will
increase. Converse conditions would lead to decreases in outflows.
The regulated outflow is achieved by adjusting the flows through the three
hydropower plants and the 16-gate Compensating Works, after requirements are met for
lockages, the St. Marys Rapids fishery and industries at Sault Ste. Marie, Michigan and
Ontario. At a minimum, one gate is kept half-open at the Compensating Works to maintain
water in the St. Marys Rapids critical for fish spawning. More gates are opened when flows
in the river exceed the capacities of the hydropower plants.
Lake Superior
outflows have
averaged 76,000
cubic feet per
second (cfs) per
month and have
been as high as
132,000 cfs and as
low as 41,000 cfs
per month.
Lake Superiorand St. Marys River
St. Marys River control structures
A rock ledge at the
head of the St. Marys
Rapids provided
a natural control
for Lake Superior
outflows. The
rock ledge acted like
a weir permitting
flows to increase
and decrease as
Lake Superior’s levels
rose or fell.
St. Marys River control structures

21
St. Clair River,Lake St. Clair
and Detroit River The St. Clair, Lake St. Clair and Detroit River system is naturally regulated; flows in
the St. Clair and Detroit rivers are limited by the size of their channelways and the
levels of Lake Huron upstream and Lake Erie downstream.
The St. Clair River is an interconnecting channel
between lakes Huron and St. Clair, running approximately
39 miles from its head between Port Huron, Michigan,
and Sarnia, Ontario to its very extensive delta in Lake St.
Clair. The St. Clair River has a 5-foot fall over this distance.
Flows have averaged 182,000 cfs since records have been
kept. During extreme conditions, flows have been
recorded as high as 232,000 cfs and as low as 106,000
cfs per month.
Although not a Great Lake, Lake St. Clair is an extremely
important body of water to millions of users. It receives
inflow from the St. Clair River and, to a minor degree,
from tributary rivers such as the Clinton River in Michigan
and the Thames River in Ontario. The lake’s average depth
is less than 20 feet. Due to its being shallow and nearly
round in shape, Lake St. Clair is highly susceptible to rapid
changes in wind and wave patterns, storm surges and lake
level changes.
The Detroit River receives inflow from Lake St. Clair
and discharges into the west end of Lake Erie, running
approximately 32 miles. Over this distance, the water
surface drops nearly 3 feet. The flow in the Detroit River has averaged 186,000 cfs
since records have been maintained. During extreme conditions, flows have been as
high as 238,000 cfs per month or as low as 112,000 cfs per month.
Dredging in the St. Clair-Detroit system began in the 1930s and continued through
the 1950s to deepen navigation channels. Dredging is the enlarging or deepening of
navigation channels to allow ships to enter and leave ports more efficiently, quickly
and safely. Without dredging, most rivers and harbors would be inaccessible for com-
mercial navigation. Dredging has increased the flow capacity of these rivers and,
as a result, has permanently lowered the levels of lakes Michigan and Huron by nearly
15 inches. The effect on Lake Erie’s water level was temporary.
Flows in both the St. Clair and Detroit rivers can be
dramatically reduced for short periods during ice jams.
Flows in the Detroit River can virtually stop or even
reverse for a few hours during an extreme storm surge at
the west end of Lake Erie.
Traffic on the Detroit River at Detroit, Michigan
Flows in the
St. Clair River,
Lake St. Clair
and Detroit River
are naturally
regulated.
St. Clair - Detroit river system
22
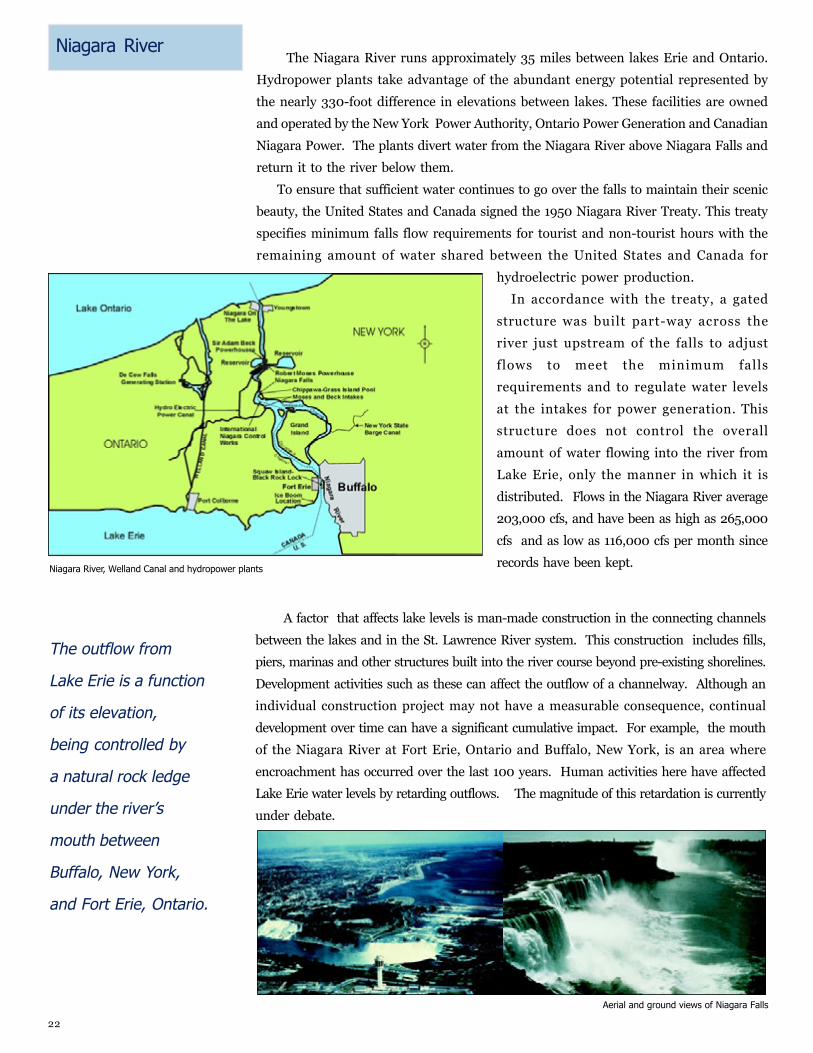
The Niagara River runs approximately 35 miles between lakes Erie and Ontario.
Hydropower plants take advantage of the abundant energy potential represented by
the nearly 330-foot difference in elevations between lakes. These facilities are owned
and operated by the New York Power Authority, Ontario Power Generation and Canadian
Niagara Power. The plants divert water from the Niagara River above Niagara Falls and
return it to the river below them.
To ensure that sufficient water continues to go over the falls to maintain their scenic
beauty, the United States and Canada signed the 1950 Niagara River Treaty. This treaty
specifies minimum falls flow requirements for tourist and non-tourist hours with the
remaining amount of water shared between the United States and Canada for
hydroelectric power production.
In accordance with the treaty, a gated
structure was built part-way across the
river just upstream of the falls to adjust
flows to meet the minimum falls
requirements and to regulate water levels
at the intakes for power generation. This
structure does not control the overall
amount of water flowing into the river from
Lake Erie, only the manner in which it is
distributed. Flows in the Niagara River average
203,000 cfs, and have been as high as 265,000
cfs and as low as 116,000 cfs per month since
records have been kept.
Niagara River
Aerial and ground views of Niagara Falls
The outflow from
Lake Erie is a function
of its elevation,
being controlled by
a natural rock ledge
under the river’s
mouth between
Buffalo, New York,
and Fort Erie, Ontario.
Niagara River, Welland Canal and hydropower plants
A factor that affects lake levels is man-made construction in the connecting channels
between the lakes and in the St. Lawrence River system. This construction includes fills,
piers, marinas and other structures built into the river course beyond pre-existing shorelines.
Development activities such as these can affect the outflow of a channelway. Although an
individual construction project may not have a measurable consequence, continual
development over time can have a significant cumulative impact. For example, the mouth
of the Niagara River at Fort Erie, Ontario and Buffalo, New York, is an area where
encroachment has occurred over the last 100 years. Human activities here have affected
Lake Erie water levels by retarding outflows. The magnitude of this retardation is currently
under debate.

23
The St. Lawrence River is a majestic and expansive river course which drains Lake
Ontario. It flows into the Gulf of St. Lawrence of the Atlantic Ocean approximately 540
miles to the northeast, dropping more than 240 feet along its length. The river’s course
is made up of several important segments. For the first 105 miles, the river is
formally called the St. Lawrence Seaway and Power Project. This section is an
international body of water shared by the United States and Canada. It includes the
beautiful Thousand Islands and Lake St. Lawrence. Downstream of Massena, New
York, and Cornwall, Ontario, the river is solely in Canada, flowing for 435 more miles
until it reaches the Gulf of St. Lawrence. Near Montreal, Quebec, it receives a vast
inflow from the Ottawa River watershed.
The outflow from Lake Ontario is managed under the auspices of the IJC and its
International St. Lawrence River Board of Control. The IJC’s criteria for regulating
outflows explicitly recognizes the needs of three major interest groups: riparian
(shore property owners), hydropower and commercial navigation. The regulation
plans used since 1960 are designed to meet these criteria. Outflows are regulated on
a weekly basis.
There are four key objectives of the Lake Ontario regulation plan: 1) maintain the
Lake Ontario level within a four-foot range during the navigation season; 2) maintain
adequate depths in the International Section of the river for safe navigation;
3) maintain adequate flows for hydropower generation; and 4) protect the lower St.
Lawrence River below the control works from flooding. Sometimes when water
supplies are extemely high or low, not all of these objectives can be met. For
example, Lake Ontario outflows may be limited due to flooding problems downstream
around Montreal, Quebec, or if higher flows become a hazard to commercial
navigation, particularly upstream of the Massena, New York - Cornwall, Ontario, area.
Lake Ontario andSt. Lawrence Seaway
and Power Project
The outflow from
Lake Ontario has been
regulated since the
completion of the
St. Lawrence Seaway
and Power Project
in 1960.
St. Lawrence Seaway and Power Project

24
There are five diversions on the Great Lakes: the Long Lac and Ogoki diversions into
Lake Superior, the Lake Michigan diversion at Chicago, and the Welland Canal and New
York State Barge Canal between Lake Erie and Lake Ontario. The Welland and New York
State Barge Canal do not divert water into or out of the Great Lakes, but rather provide
navigation channelways between two of the lakes. Man-made diversions play a minor
role in the balancing of Great Lakes water levels when compared to natural forces. The
cumulative impacts of all five diversions have raised water levels 0n Lake Superior by
less than 1 inch, had no measurable effect on lakes Michigan-Huron, lowered Lake Erie
by almost 4 inches and raised Lake Ontario by less than 1 inch.
Diversions
Long Lac - Ogoki diversions The Long Lac and Ogoki diversions take water from the Hudson Bay watershed and
augment the natural flows driving hydropower plants in the northern portion of the
Lake Superior basin. These projects, in operation since the early 1940s, have increased
the water supply to Lake Superior. Combined, these diversions move an average of
about 5,300 cfs.
Lake Michigan Diversion at Chicago Since 1848, water has been diverted from Lake
Michigan at Chicago, Illinois, for various purposes,
including water supply, sewage disposal and
commercial navigation. Water from Lake Michigan
enters the Chicago Sanitary and Ship Canal, which
links the lake through the Illinois Waterway and
Des Plaines River to the Mississippi River.
Diversion of Lake Michigan waters has varied
substantially over the years, and has been the
subject of some controversy; several Great Lakes
states have gone to court to limit the diversion. Since
1967, the U.S. Supreme Court has limited the
diversion to 3,200 cfs averaged over five years.
Welland Canal The Welland Canal is a deep-draft navigational
waterway that joins Lake Erie and Lake Ontario.
Originally built in 1829 and since modified several
times, the canal allows ships to travel between the two lakes, bypassing the falls and rapids of
the Niagara River. The canal also provides water for hydropower generation. Today, this
diversion averages about 8,500 cfs.
New York State Barge Canal The New York State Barge Canal is the smallest of the Great Lakes diversions, aver-
aging only about 1,000 cfs. This canal draws its water from the Niagara River at
Tonawanda, New York. It has no effect on the water level of or outflow from Lake Erie,
but does slightly reduce the flow in the Niagara River below Tonawanda and above the
falls. The diverted water is returned to Lake Ontario through four water courses within
New York.
There are five
locations on the
Great Lakes where
water is diverted
into, out of or
between lake basins.

25
Major factors affecting the water supply to the Great
Lakes—precipitation, evaporation and runoff—cannot be
controlled or accurately predicted for more than a few weeks
into the future. The influences of man-made controls on lake levels
are therefore limited. Regulation of outflows from lakes Superior
and Ontario have had significant impacts on levels throughout
the system since they were introduced. The effects of these
artificial controls, however, have been dwarfed by the results of
natural climatic variations.
The control of lakes Superior and Ontario outflows are
governed by the International Joint Commission’s boards of
control. Each of the binational control boards has an equal
number of members from both countries.
Controlling Water Levels
St. Marys Rapids (including the Compensating Works in center foreground), railway bridge and International Bridge; Sault St. Marie, Ontario, in background

26
The Boundary Waters Treaty of 1909 between the United States and Canada provides the principles
and mechanisms to help resolve disputes and to prevent future ones, primarily those concerning
water quantity and water quality along the boundary between the two countries. The IJC has created
boards of control that oversee the operations of the regulatory structures and direct outflows that
meet conditions set forth by the IJC to protect the interests of both countries.
The IJC has carried out several studies on water levels issues in response to references, or requests, from
the U.S. and Canadian governments. In 1964, when water levels were very low, the governments asked the
IJC whether it would be feasible to maintain the waters of all the Great Lakes, including Michigan and
Huron, at a more constant level. This study was completed in 1973, when lake levels had risen to record
highs. The IJC advised the governments in its report that the high costs of engineering further regulation
of lakes Michigan and Huron could not be justified by the benefits. The same conclusion was reached during
another study on regulating outflows from Lake Erie in 1983.
In 1985, the IJC released a report on consumptive uses and the effects of existing diversions into and
out of the Great Lakes system. Until this study, consumptive use had not been considered significant for the
Great Lakes because the volume of water in the system is so large. The study concluded that climate and
weather changes affect levels of the lakes far more than existing man-made diversions. However, the
report also concluded that if consumptive uses of water continue to increase at historical rates, outflows
through the St. Lawrence River could be reduced over time.
Following the period of high lake levels in the mid-1980s, the IJC conducted a Levels Reference Study on
the feasibility of modifying lake levels through various means. In the results of this study, released in 1993,
the IJC concluded that the costs of major engineering works to further regulate the levels and flows of
the Great Lakes and St. Lawrence River would exceed the benefits provided and would have significant
negative environmental impacts. The IJC recommended that comprehensive and coordinated land-use and
shoreline management programs needed to be implemented throughout the basin to reduce vulnerability
to flood and erosion damages. These recommendations called for state, provincial and local government
leadership to help alleviate or minimize property damages under high levels scenarios. Three of the
key recommendations were to improve forecast abilities and emergency preparedness plans, to strengthen
information databases including extensive monitoring of shoreline erosion, bluff recession and land use,
and to initiate comprehensive shoreline management programs.
Left to right: Mackinac Bridge, across the Straits of Mackinac between lakes Michigan and Huron; Lake Superior shoreline in Minnesota; ManisteeBreakwall Lighthouse, Manistee, Michigan, on Lake Michigan
How much control is possible?

27
Outflows from the Great Lakes are relatively small (less than 1 percent per year) in
comparison with the total volume of water. The rate of flow, or discharge, in a river is
determined by measuring the channel depth and width, and the velocity of the flow.
These measurements are made at various sections of the river, such as constrictions
in the river course. Measurements can be made by boat,
from a bridge, or from a cableway strung across the river as
in the picture below.
With sufficient measurements of flow over a range of water
levels including extreme low and high levels, mathematical
relationships can be developed between levels and
discharges for various points along the connecting channels
and the St. Lawrence River. These stage-discharge equations
are essential to the coordination of outflow data, particularly
related to hydropower usage of Great Lakes waters.
Measuringoutflows
Measuring outflows at the NiagaraCableway across the Niagara Gorge
Effective management of Great Lakes water levels depends largely on the periodic
collection and analysis of data from the lakes and public dissemination of this
information. The National Ocean Service of the National Oceanic and Atmospheric
Administration (NOAA) presently operates 31 water level gages on the Great Lakes
and 18 gages on their connecting channels. Historic records for some of these gages
go back to 1860. In Canada, the Canadian Hydrographic Service maintains 29 water
level gages on the Great Lakes and 27 gages on the St. Lawrence River. Several other
agencies operate recording gages at various locations around the Great Lakes system. These
agencies include the U.S. Army Corps of Engineers, the New York Power Authority and
Ontario Power Generation.
Great Lakes water levels are officially measured
from the International Great Lakes Datum 1985 (IGLD
1985). This datum is referenced to sea level, as
measured at Rimouski, Quebec, near the mouth of the
St. Lawrence River. Because the crust of the earth in
the Great Lakes region is continuously rising with
respect to sea level, and the rate of movement is not
uniform throughout the region, the International
Great Lakes Datum must be periodically updated
on a 25- to 30-year schedule.
Another datum to which Great Lakes water levels
are often referred to is called Chart Datum. All sound-
ings on navigation charts are referenced to this
datum. (For further information on chart datum, see page 32.)
Measuringwater levels
Water levels are
measured and
recorded at many
locations around
the Great Lakes
and on their
connecting
channels.
Typical water level gaging station with satellitedata relay instrumentation
28
Forecasts of water levels for each of the Great Lakes are routinely published by the
U.S. and Canadian governments and distributed free to the public. The former U.S.
Lake Survey District of the U.S. Army Corps of Engineers began publishing water
level forecasts in 1952. Since 1975, the Detroit District of the Corps has continued to
produce the forecasts monthly. This product is available on the Internet and by mail
in paper form. A weekly forecast update is also produced and is available on the
Internet. The Canadian forecasts began in 1973 and currently are generated by
Environment Canada and published by the Department of Fisheries and Oceans. These
also are published on the Internet and mailed to Canadian recipients. The U.S. and Canadian
forecasts are coordinated between agencies to ensure that there is agreement. (See the Points of
Contact and Additional Resources listings on pages 38 and 39.)
Since it’s difficult to predict the weather, it is not surprising that present weather
forecasts for one month or beyond are of limited value in forecasting water levels. In
practice, water level forecasts depend heavily on looking at recent seasonal
fluctuation patterns of water supply. Future water supplies can also be significantly
influenced by the condition of the lake and its drainage basin at the time the forecast
is made. Key issues associated with this include the wetness of the soils, amount of
water stored in the snowpack, depth of the frost in the ground, height of the
groundwater table, and/or the temperature of the lake surface.
With recent scientific advances, particularly in satellite and
airborne monitoring systems, ground-based radars and
computer modeling techniques, forecasters are gaining
valuable knowledge on basin and lake conditions that was not
previously available. Sophisticated computer models, in
particular, are being created and tested, which can account for
daily changes in nearly 25 separate hydrologic variables that
can affect water supply to a lake and, therefore, water levels in
the future.
There is a limit, however, to how much current basin
conditions can influence water supplies to the lakes in the future.
For this reason, published water level forecasts normally
extend only six months into the future. All forecasts are
generated and published showing a probable range of lake
levels due to the inherent uncertainty of future weather
conditions.
Water levelforecasting
Monthly water level
forecasts are available
free from the U.S. Army
Corps of Engineers and
Canadian authorities
Monthly Bulletin of Lake Levels for the Great Lakes

29
Effects of LakeLevel Fluctuations
Stretching more than 9,500 miles, the shores of the Great Lakes are
constantly reshaped by the effects of wind, waves and moving water.
Shoreline characteristics vary significantly, from flat, low-lying areas
susceptible to flooding, to high bluff areas that are often prone to
erosion. Erosion is a natural process that occurs during periods of
low, average or high water levels. Erosion and flooding can be
magnified during periods of high water or storms.
In some areas of high-density development, minor deviations from
long-term average levels can produce pronounced economic losses. In
less developed areas, these impacts can be modest or negligible.
Natural areas, such as wetlands, have evolved as a result of wide
variations in water levels. Reducing these variations can have
significant environmental consequences.
Empire Bluffs at Sleeping Bear Dunes National Lakeshore on Lake Michigan

30
On the coast, natural forces causing erosion are embodied in waves, currents and
wind. Most waves arrive at an angle to the shore. As successive wave fronts advance
and retreat they set up a longshore current. As waves break, run up the shore, and
return, they carry sedimentary material onshore and offshore. This sedimentary material
is called littoral drift.
The energy in the moving water determines the size and amount of the material that
will move and how far. The energy in a wave depends on the speed of the wind, its
duration and the unobstructed water distance, or fetch, it blows over. Gentle waves
move fine sand, whereas storm-generated waves move rocks and boulders. Materials
picked up from shoreline areas are deposited wherever the water is slowed down and
may be picked up again when the velocity of the water increases.
If erosion is not balanced by accretion, the depositing of sediment, the shore will be
washed away. Erosion and accretion are two faces of the same process. These processes
can occur at extremely slow rates or may occur dramatically in a short time.
Natural shores are nourished by material that has been
eroded from other areas, becoming part of the littoral drift
system. Attempts to reduce erosion by building shore
protection structures, or armoring the shoreline in one area,
will result in reduced littoral drift available, starving an adjacent
area downdrift.
Fluctuating water levels can expose new surfaces to erosion.
As seasons change, wind strength and direction also change,
altering the path of waves and currents. Where ice forms, it
redirects wave energies offshore protecting beaches, but can
increase erosion of the lakebed. Ice may also exert tremendous
forces that can weaken shore structures.
Gently sloping shores, whether beaches or wetlands, are natural defenses against
erosion. The slopes of the land along the edge of the water form a first line of defense
called a berm, which dissipates the energy of breaking waves. During high water
periods, a berm can prevent water from moving inland. Dunes and their vegetation
offer protection against storm-driven high water and also provide a reservoir of sand for
replenishing the littoral drift and rebuilding beaches.
Although erosion is caused by natural shoreline processes, its rate and severity can
be intensified by human activity. Dredging marinas and bulldozing dunes remove
natural protection against wind and waves. Pedestrian and vehicle traffic destroy veg-
etation, degrade dunes, and weaken bluffs and banks. Docks, jetties and other struc-
tures interrupt the natural shoreline movement of water and redirect erosive forces,
possibly in undesirable directions. Inappropriate building practices in high bluff
areas can seriously reduce bluff stability. In particular, drainage patterns from new
building construction can cause infiltration of runoff directly into a bluff and can weaken
its normal cohesive forces. Wise management of shoreline construction and land uses
can significantly reduce economic losses due to erosion.
Erosion processes
Although erosion is
a natural process,
its rate and severity
can be intensified
by human activity.
Lake Michigan shoreline in Michigan

31
The region’s glacial history and the tremendous influence of the lakes themselves
create unique conditions that support a wealth of biological diversity, including
more than 130 rare species and ecosystems. The Great Lakes are the only lakes of
their size in a temperate climate. With the lakes’ moderating effect on the climate,
the ecosystem is able to provide habitat for a wide variety of species that otherwise
might not survive. The Great Lakes - St. Lawrence River ecosystem features sand
dunes, coastal marshes, rocky shorelines, lakeplain prairies, savannas, forests,
fens, wetlands and other landscapes.
The place where land and water meet is by far the most diverse and productive part
of the Great Lakes - St. Lawrence River ecosystem. This interface includes small wetlands
nestled in scattered bays to extensive wetlands such as those along Saginaw Bay on Lake
Huron, river-mouth wetlands such as the Kakagon Sloughs of northern Wisconsin and
the enormous delta marshes of the St. Clair River. Nearly all species of Great Lakes
fish rely on nearshore waters for everything from permanent residence, to
migratory pathways, to feeding, nursery grounds and spawning areas.
Most common types of wetlands along the shoreline are marshes, where the
vegetation can tolerate the large short- and long-term fluctuations in lake levels. In
fact, these wetlands are shaped by dynamic lake processes, including waves,
currents and changes in water levels. They occur in areas where the erosive
forces of ice and wave action are low, allowing the growth of wetland plants.
Many wetlands have species successions that are dependent upon water level cycles.
Seasonal and long-term water level fluctuations also limit the invasion of woody
plants at higher elevations and extensive beds of submersed aquatic plants at lower
elevations. Individual wetland species and vegetative communities prefer, and have
adapted to, certain water depth ranges, allowing wetlands to be more extensive and more
productive than they would be if water levels were stable.
In addition to providing habitat, coastal wetlands play other vital roles. These
include protecting nearshore terrestrial ecosystems from erosion by dissipating
wave energy, and improving water quality in adjacent aquatic systems through
sediment control and absorption of nutrients.
Habitat diversity
With the lakes’
moderating effect
on the climate, the
ecosystem is able to
provide habitat for
a wide variety of
species that otherwise
might not survive.
A wealth of biological diversity (left to right): moose in Lake Superior watershed, wetlands along Saginaw Bay on Lake Huron and herons along Lake Ontario shoreline

32
Commercial shippingand recreational boating
Water levels have a profound impact upon the economic
viability of commercial shipping and recreational boating
on the Great Lakes. In the U.S., for example, the federal
government maintains 71 deep-draft harbors and 745 miles
of dredged channelways to support commercial navigation.
Along the nearly 5,800 miles of U.S. Great Lakes and St.
Lawrence River shorelines, the government also maintains
65 shallow-draft recreational harbors. The depths to which
the harbors and approach channels are dredged have been
subject to U.S. congressional authorizations, many of which date back to the 19th century.
The authorized depth for dredging varies with the type of traffic involved, ranging from a low of 9 feet deep in most
recreational boating harbors to 30 foot deep in channels used for ocean-going freighters. Since some harbors serve
both commercial and recreational purposes, it is common to see a deeper entrance channel near the harbor mouth for
commercial vessels, with progressively shallower depths for recreational interests as one moves upstream.
Boaters should be familiar with and make regular practice of using navigation charts for the waters they expect to
navigate. These navigation charts are published in the U.S. by the National Oceanic and Atmospheric Administration
(NOAA) and by the Department of Fisheries and Oceans in Canada. All depths or soundings on the navigation charts
are referenced to chart datum, also known as Low Water Datum. Chart datum is different for each lake and is expressed
relative to IGLD 1985. Current and forecasted water levels are reported relative to chart datum. With an up-to-date chart
and current water level information, navigators can find the depth of water available for transit. For example, if the water
level is currently 3 feet above chart datum and the soundings on the chart are 8 feet below chart datum, then there is an
actual depth of 11 feet at that location.
Boaters should always be aware that the Great Lakes, their
connecting channels, and the St. Lawrence River are subject to
fluctuating water levels on a short-term basis through storm
events, through seasonal changes, and over longer periods due
to climatic shifts. Boaters should always use caution and reduce
vessel speeds when navigating unfamiliar waters.
Marina on Lake St. ClairChicago lakefront on Lake Michigan
Lift Bridge in Duluth - Superior Harbor on Lake Superior

33
Living Alongthe Shoreline
Whether you’re a boating enthusiast, business owner, residential
property owner, prospective buyer of shoreline property or a
member of a coastal community, it’s in your best interest to understand
the benefits and risks associated with living close to the lakes. A
willingness to anticipate and adapt to ever-changing lake levels and
their impacts could save you vast amounts of time, money and worry.
Levels are only one of the complex physical processes exerted upon
our Great Lakes shorelines. While individual property owners are
powerless to stop these processes, they do have a variety of options
for combating erosion and flooding, including structural and
nonstructural measures. Careful planning, prudent siting of new
construction and awareness of risks are all advised.
Cottage in Thousand Islands area of the St. Lawrence River

34
Structural options
• A revetment is a heavy facing, or armor, that protects the slope and adjacent upland
from the erosive effects of wave scour. Revetments, which are best suited for gentle to
moderate slopes, are comprised of three layers: armor, filter layers and toe protection.
Typical armor materials, which include stone and gabions (wire baskets filled with stone)
are designed to disperse wave energy that would otherwise impact the shoreline. The
filter layer, comprised of graded stone, provides a stable foundation for the armor and
permits groundwater drainage. Toe protection, which prevents settlement of the
revetment and stabilizes the revetment’s lakeward edge, is an extension of the armor
material. Private revetments can temporarily protect some types of bluffs, but will
likely cause erosion in downdrift areas by starving these shorelines of natural sand
supply. Any beach present prior to construction will typically be lost.
• Bulkheads (or seawalls) are retaining walls that prevent soil from eroding into a
water body due to wave action. Construction can vary from thin structures that penetrate
the ground like sheet piling to massive structures that rest on the surface such as poured
concrete structures or stone-filled timber cribs. Bulkheads protect only the land immediately
behind them by retaining soil at the toe of a bluff; they do not ensure the overall stability of the
bluff and do not offer protection to adjacent areas. Bulkheads may worsen erosion downdrift
in the same manner as revetments. In the long term, erosion of the lakebed will
worsen immediately in front of the bulkhead.
• Breakwaters are offshore structures typically placed parallel to the area of
shoreline to be protected. Constructed of stone, steel, wood or concrete,
breakwaters block and disperse wave energy, which can minimize shore damage.
Breakwaters help build a beach in their protected shadow, but can worsen erosion
downdrift by blocking transport of sediments along the shore.
• Groins are structures that are placed perpendicular to shore and extend out into the
water. Used either singly or in a series as part of a groin field, they trap and accumulate
sand on the updrift side of the groin. Provided enough sand moves naturally along the
shoreline, groins can be effective in building up beaches. Groins are typically constructed of
the same materials used for revetments and breakwaters. Groins will aggravate erosion
problems downdrift by blocking sediment transport along the shore.
A variety of structural options are available to shore property owners to protect
and stabilize bluffs and beaches vulnerable to the impacts of lake level fluctuations
and storm events. The best structural option depends upon the site characteristics.
Professional design consultation is advisable. None of these options, however, are
permanent solutions against the continued and relentless forces of nature. Many
structures cause erosion downdrift, which can only be mitigated by replacing lost
material. In most areas, without mitigation, the relatively thin layer of existing
sand is stripped away, exposing underlying clay. The clay is rapidly and irreversibly
eroded in a process called lakebed downcutting. This process lets larger waves
attack closer to shore, increasing the failure rate of coastal structures and bluffs.
Revetment at Luna Pier, Michigan, on LakeErie
A bulkhead and companion breakwater inSanilac County, Michigan, on Lake Huron
Groin and revetment system near St.Joseph, Michigan, on Lake Michigan

35
NonstructuraloptionsNonstructural options for bluff stabilization and shoreline protection offer the shore
property owner a variety of measures that have a strong land-use management emphasis.
• Revegetation is a planting program to establish desired species for bluff and
beach stabilization, which is among the least expensive of all protection measures.
A variety of groundcover, including species of grasses, sedges and bulrushes, are
effective at trapping sand particles and stabilizing beach and bluff areas. Upland
species of grasses, shrubs and trees are effective in higher beach elevations. While
useful for slope stabilization and erosion control, revegetation alone is not effective
under conditions of heavy wave action in high bluff environments. Conversely,
in areas of shallow relief, extensive coastal wetlands can effectively eliminate
wave forces on adjacent beaches.
• Bluff drainage is a measure that addresses seepage problems common to clay
or composite bluffs. Seepage contributes to bluff instability when upper layers
are saturated, slough off, and are ultimately carried away by wave action. Open
joint tile drains, laid in a trench set back from the top of the bluff and back-filled
with crushed stone, can help resolve shallow (less than 6 feet deep) groundwater
drainage problems. Vertical wells with sump pumps can be used for deeper
drainage problems.
• Slope re-grading is a measure by which unstable bluffs can be re-graded to a
more gradual or stable slope. Coupled with revegetation, this measure can be
effective in reducing the rate of erosion and bluff recession, assuming the lakebed
has not been irreversibly downcut.
• Beach nourishment is the placing of quantities of sand, gravel, or stone
on the shoreline by overland hauling or nearshore pumping from barges. The
deposits serve as a buffer zone that slows erosion. Wave action carries the
material offshore, where it can form sand bars that may cause waves to break
farther from the beach. To extend its life span, beach nourishment often
requires using larger and heavier deposits than would naturally occur, causing
a change in beach characteristics. The useful life of a nourished beach depends
upon the size and quantity of materials placed on the beach as well as the
frequency and severity of storms that erode the deposits.
• Relocation is the removal of structures vulnerable to damage from storm-
induced flooding and erosion. This option recognizes that erosion and associated
bluff recession is a natural process that, even with installation of structural
protection, is difficult to stop entirely. Provided that the shoreline property is of
sufficient size and depth to accommodate relocation of the structure(s), this option
is often more cost-effective and reliable in the long-term than most structural options.
Beach grasses along Lake Michigan
Marsh grasses along Lake Superior shores
Sandy beach along southern Lake Superior
Beach nourishment along Lake Michigan

36
Lake level fluctuations, storm events and related natural processes
continuously reshape the coastal zone through flooding and erosion. These
processes are an integral part of the ecosystem; it is neither economically
feasible nor environmentally desirable to severely limit these processes.
Shoreline property owners should be cognizant of long-term lake level
history so they will not be surprised by what happens in the future. While
various private protective structures can be effective in temporarily protecting
shorelines and associated buildings, none will be permanent. Ownership of
shore property and structures has many benefits, but does require a thorough
understanding and acceptance of the risks involved.
“Let the buyer beware” is sound advice to any prospective shore property
owner. Every aspect of the property’s history should be investigated thoroughly,
particularly past flooding or erosion patterns and structural and nonstructural
shoreline protection measures that either need to be maintained or possibly
installed on the property. Selecting and implementing one or more management
measures will be one of the most significant decisions shoreline communities
and their citizens can make. Careful planning, including assistance from public agencies
and reputable professionals, is advised.
Additional nonstructural options entail the development and implementation
of land-use and shoreline management measures that can prevent new damage
from occurring. Many such techniques lend themselves to public policy actions,
such as local ordinances, but also can be implemented by the individual property
owner on a voluntary basis. These include:
• erosion setbacks with minimum requirements for both movable and permanentstructures;
• flood setbacks and elevation requirements for new structures;
• requirements/guidelines for shoreline alteration to ensure that updrift anddowndrift impacts are considered and mitigated for;
• real estate disclosure requirements to ensure that a prospective buyer is fullyinformed as to whether the property is within a mapped or known flood or erosionhazard area; and
• adoption of hazard insurance programs that provide for mapping of hazardzones, establishing setbacks for new construction, and denying subsidizedinsurance for new construction or major renovations within the flood orerosion hazard area.
An additional nonstructural option available to both public and
nongovernmental agencies and organizations is the implementation of
conservation practices including the purchase of developed and undeveloped
property in hazard areas for recreational use, habitat enhancement or other
purposes.Selecting thebest options
Communitymeasures
Stakeholders in the
Great Lakes need to
be aware of long-term
water level history;
knowledge of the past
can help to minimize
future losses.
High bluff along Lake Michigan shoreline

37
States and Provinces
IllinoisIllinois Dept. of Natural ResourcesDivision of Water Resources310 South Michigan Avenue, Room 1606Chicago, IL 60604Phone: 3 1 2 - 7 9 3 - 3 1 2 3Fax: 3 1 2 - 7 9 3 - 5 9 6 8http://dnr.state.il.us/waterresources/
Illinois State EmergencyManagement Agency110 East AdamsSpringfield, IL 62701-1109Phone: 2 1 7 / 7 8 2 - 2 7 6 0Fax: 2 1 7 / 7 8 2 - 2 5 8 9http://www.state.il.us/iema/
IndianaIndiana Dept. of Natural ResourcesDivision of Water402 West Washington, Room W264Indianapolis, IN 46241Phone: 3 1 7 - 2 3 2 - 4 1 6 0Fax: 3 1 7 - 2 3 3 - 4 5 7 9http://www.state.in.us/dnr/water/
Indiana State EmergencyManagement AgencyRecovery Division402 West Washington, Room W046Indianapolis, IN 46204Phone: 3 1 7 - 2 3 3 - 4 6 2 6Fax: 3 1 7 - 2 3 2 - 4 9 8 7http://www.state.in.us/sema/
Illinois-Indiana Sea Grant CollegeProgramPurdue University1200 Forest Products BuildingWest Lafayette, IN 47907-1200Phone: 7 6 5 - 4 9 4 - 3 5 7 3http://ag.ansc.purdue.edu/il-in-sg/
MichiganMichigan Department ofEnvironmental QualityLand and Water Management DivisionP.O. Box 30458Lansing, MI 48909-7958Phone: 5 1 7 - 3 7 3 - 1 1 7 0Fax: 5 1 7 - 3 7 3 - 9 9 6 5http://www.deq.state.mi.us
Michigan State PoliceEmergency Management Division4000 Collins RoadP.O. Box 30636Lansing, MI 48909-8136Phone: 5 1 7 - 3 3 6 - 6 1 9 8Fax: 5 1 7 - 3 3 3 - 4 9 8 7http://www.msp.state.mi.us
Michigan Sea Grant College Program2200 Bonisteel BoulevardAnn Arbor, MI 48109-2099Phone: 7 3 4 - 7 6 3 - 1 4 3 7http://www.engin.umich.edu/seagrant/
MinnesotaMinnesota Department of NaturalResourcesDivision of WaterDNR Building, 3rd Floor500 Lafayette RoadSt. Paul, MN 55155Phone: 6 5 1 - 2 9 6 - 4 8 0 0Fax: 6 5 1 - 2 9 6 - 0 4 4 5http://www.dnr.state.mn.us/waters/
Minnesota Board of Water & SoilResourcesOne West Water Street, Suite 200St. Paul, MN 55107Phone: 6 1 2 - 2 9 6 - 3 7 6 7Fax: 6 1 2 - 2 9 7 - 5 6 1 5http://www.bwsr.state.mn.us/
University of Minnesota Sea GrantProgram2305 East 5th StreetDuluth, MN 55812-1445Phone: 2 1 8 - 7 2 6 - 8 7 1 5Fax: 2 1 8 - 7 2 6 - 6 5 5 6http://www.d.umn.edu/seagr/
New YorkNew York State Department ofEnvironmental ConservationBureau of Flood Protection50 Wolf Road, Room 388Albany, NY 12233Phone 5 1 8 - 4 5 7 - 3 1 5 7F a x 5 1 8 - 4 8 5 - 7 7 8 6http://www.dec.state.ny.us
New York State EmergencyManagement Office1220 Washington AvenueBuilding 22 - Suite 101Albany, NY 12226-2251Phone: 5 1 8 - 4 8 5 - 1 7 9 7F a x : 5 1 8 - 4 5 7 - 7 5 2 8http://www.nysemo.state.ny.us
New York Sea Grant Institute115 Nassau HallSUNY at Stony BrookStony Brook, NY 11794-5001Phone: 5 1 6 - 6 3 2 - 6 9 0 5F a x : 5 1 6 - 6 3 2 - 6 9 1 7http://www.seagrant.sunysb.edu/
OhioOhio Dept. of Natural Resources
Ohio Coastal Management ProgramDiv. of Real Estate & Land ManagementFountain Square, Bldg C, 4th FloorColumbus, OH 43224Phone: 888-644-6267 or 614-265-6384Fax: 614-267-4764http://www.dnr.state.oh.us/odnr/relm/
Division of WaterFountain Square, Building EColumbus, OH 43224Phone: 614-265-6717Fax: 614-447-9503http://www.dnr.state.oh.us/odnr/water/
Division of Geological SurveyP.O. Box 650Sandusky, OH 44870Phone: 419-626-4296Fax: 419-626-8767http://www.dnr.state.oh.us/odnr/geo_survey/
Division of EngineeringFountain Square, Bldg F, 3rd FloorColumbus, OH 43224Phone: 614-265-6948Fax: 614-262-2197http://www.dnr.state.oh.us/odnr/engineering/
Ohio Sea Grant College Program1314 Kinnear RoadColumbus, OH 43212-1194Phone: 6 1 4 - 2 9 2 - 8 9 4 9Fax: 6 1 4 - 2 9 2 - 4 3 6 4http://www.sg.ohio-state.edu/
Ohio Emergency Management Agency2855 West Dublin-Granville RoadColumbus, OH 43235-2206Phone: 6 1 4 - 8 8 9 - 7 1 5 0Fax: 6 1 4 - 8 8 9 - 7 1 8 3http://www.state.oh.us/odps/division/ema/
PennsylvaniaPennsylvania Department ofEnvironmental Protection
Bureau of Watershed ConservationWatershed Support DivisionCoastal Zone Management, 10th FloorRachel Carson State Office BuildingP.O. Box 8555Harrisburg, PA 17105-8555Phone: 717-787-5259Fax: 717-787-9549http://www.dep.state.pa.us
Coastal Zone Management ProgramNorthwest Regional Office230 Chestnut StreetMeadville, PA 16335-3481Phone: 814-332-6942Fax: 814-332-6121http://www.dep.state.pa.us
Pennsylvania EmergencyManagement AgencyP.O. Box 3321Harrisburg, PA 17105-3321Phone: 7 1 7 - 6 5 1 - 2 0 0 9Fax: 7 1 7 - 6 5 1 - 2 0 4 0http://www.pema.state.pa.us
Pennsylvania Sea Grant ProjectPenn State - Erie5091 Station RoadErie, PA 16563-0101Phone: 8 1 4 - 8 9 8 - 6 4 2 0Fax: 8 1 4 - 8 9 8 - 6 4 6 2http://www.pserie.psu.edu/seagrant/
Points of Contact
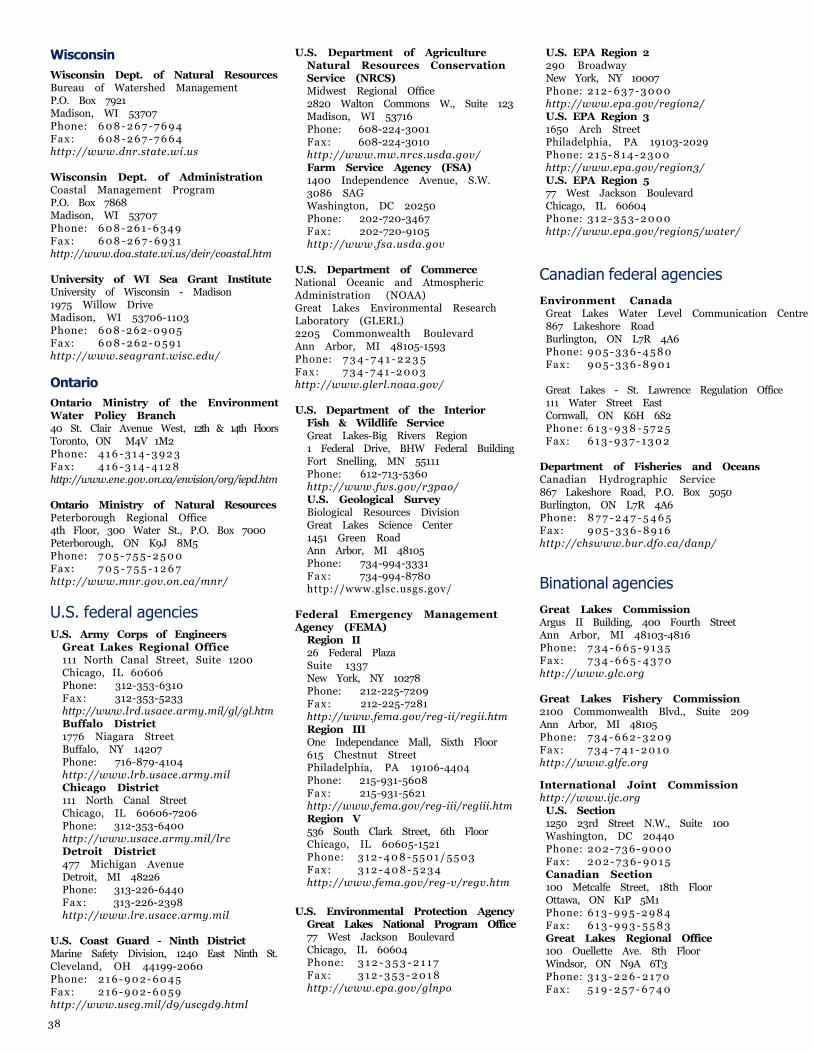
38
WisconsinWisconsin Dept. of Natural ResourcesBureau of Watershed ManagementP.O. Box 7921Madison, WI 53707Phone: 6 0 8 - 2 6 7 - 7 6 9 4Fax: 6 0 8 - 2 6 7 - 7 6 6 4http://www.dnr.state.wi.us
Wisconsin Dept. of AdministrationCoastal Management ProgramP.O. Box 7868Madison, WI 53707Phone: 6 0 8 - 2 6 1 - 6 3 4 9Fax: 6 0 8 - 2 6 7 - 6 9 3 1http://www.doa.state.wi.us/deir/coastal.htm
University of WI Sea Grant InstituteUniversity of Wisconsin - Madison1975 Willow DriveMadison, WI 53706-1103Phone: 6 0 8 - 2 6 2 - 0 9 0 5Fax: 6 0 8 - 2 6 2 - 0 5 9 1http://www.seagrant.wisc.edu/
OntarioOntario Ministry of the EnvironmentWater Policy Branch40 St. Clair Avenue West, 12th & 14th FloorsToronto, ON M4V 1M2Phone: 4 1 6 - 3 1 4 - 3 9 2 3Fax: 4 1 6 - 3 1 4 - 4 1 2 8http://www.ene.gov.on.ca/envision/org/iepd.htm
Ontario Ministry of Natural ResourcesPeterborough Regional Office4th Floor, 300 Water St., P.O. Box 7000Peterborough, ON K9J 8M5Phone: 7 0 5 - 7 5 5 - 2 5 0 0Fax: 7 0 5 - 7 5 5 - 1 2 6 7http://www.mnr.gov.on.ca/mnr/
U.S. federal agenciesU.S. Army Corps of Engineers
Great Lakes Regional Office111 North Canal Street, Suite 1200Chicago, IL 60606Phone: 312-353-6310Fax: 312-353-5233http://www.lrd.usace.army.mil/gl/gl.htmBuffalo District1776 Niagara StreetBuffalo, NY 14207Phone: 716-879-4104http://www.lrb.usace.army.milChicago District111 North Canal StreetChicago, IL 60606-7206Phone: 312-353-6400http://www.usace.army.mil/lrcDetroit District477 Michigan AvenueDetroit, MI 48226Phone: 313-226-6440Fax: 313-226-2398http://www.lre.usace.army.mil
U.S. Coast Guard - Ninth DistrictMarine Safety Division, 1240 East Ninth St.Cleveland, OH 44199-2060Phone: 2 1 6 - 9 0 2 - 6 0 4 5Fax: 2 1 6 - 9 0 2 - 6 0 5 9http://www.uscg.mil/d9/uscgd9.html
U.S. Department of AgricultureNatural Resources ConservationService (NRCS)Midwest Regional Office2820 Walton Commons W., Suite 123Madison, WI 53716Phone: 608-224-3001Fax: 608-224-3010http://www.mw.nrcs.usda.gov/Farm Service Agency (FSA)1400 Independence Avenue, S.W.3086 SAGWashington, DC 20250Phone: 202-720-3467Fax: 202-720-9105http://www.fsa.usda.gov
U.S. Department of CommerceNational Oceanic and AtmosphericAdministration (NOAA)Great Lakes Environmental ResearchLaboratory (GLERL)2205 Commonwealth BoulevardAnn Arbor, MI 48105-1593Phone: 7 3 4 - 7 4 1 - 2 2 3 5Fax: 7 3 4 - 7 4 1 - 2 0 0 3http://www.glerl.noaa.gov/
U.S. Department of the InteriorFish & Wildlife ServiceGreat Lakes-Big Rivers Region1 Federal Drive, BHW Federal BuildingFort Snelling, MN 55111Phone: 612-713-5360http://www.fws.gov/r3pao/U.S. Geological SurveyBiological Resources DivisionGreat Lakes Science Center1451 Green RoadAnn Arbor, MI 48105Phone: 734-994-3331Fax: 734-994-8780http://www.glsc.usgs.gov/
Federal Emergency ManagementAgency (FEMA)
Region II26 Federal PlazaSuite 1337New York, NY 10278Phone: 212-225-7209Fax: 212-225-7281http://www.fema.gov/reg-ii/regii.htmRegion IIIOne Independance Mall, Sixth Floor615 Chestnut StreetPhiladelphia, PA 19106-4404Phone: 215-931-5608Fax: 215-931-5621http://www.fema.gov/reg-iii/regiii.htmRegion V536 South Clark Street, 6th FloorChicago, IL 60605-1521Phone: 3 1 2 - 4 0 8 - 5 5 0 1 / 5 5 0 3Fax: 3 1 2 - 4 0 8 - 5 2 3 4http://www.fema.gov/reg-v/regv.htm
Canadian federal agenciesEnvironment Canada
Great Lakes Water Level Communication Centre867 Lakeshore RoadBurlington, ON L7R 4A6Phone: 9 0 5 - 3 3 6 - 4 5 8 0Fax: 9 0 5 - 3 3 6 - 8 9 0 1
Great Lakes - St. Lawrence Regulation Office111 Water Street EastCornwall, ON K6H 6S2Phone: 6 1 3 - 9 3 8 - 5 7 2 5Fax: 6 1 3 - 9 3 7 - 1 3 0 2
Department of Fisheries and OceansCanadian Hydrographic Service867 Lakeshore Road, P.O. Box 5050Burlington, ON L7R 4A6Phone: 8 7 7 - 2 4 7 - 5 4 6 5Fax: 9 0 5 - 3 3 6 - 8 9 1 6http://chswww.bur.dfo.ca/danp/
Binational agenciesGreat Lakes CommissionArgus II Building, 400 Fourth StreetAnn Arbor, MI 48103-4816Phone: 7 3 4 - 6 6 5 - 9 1 3 5Fax: 7 3 4 - 6 6 5 - 4 3 7 0http://www.glc.org
Great Lakes Fishery Commission2100 Commonwealth Blvd., Suite 209Ann Arbor, MI 48105Phone: 7 3 4 - 6 6 2 - 3 2 0 9Fax: 7 3 4 - 7 4 1 - 2 0 1 0http://www.glfc.org
International Joint Commissionhttp://www.ijc.org
U.S. Section1250 23rd Street N.W., Suite 100Washington, DC 20440Phone: 2 0 2 - 7 3 6 - 9 0 0 0Fax: 2 0 2 - 7 3 6 - 9 0 1 5Canadian Section100 Metcalfe Street, 18th FloorOttawa, ON K1P 5M1Phone: 6 1 3 - 9 9 5 - 2 9 8 4Fax: 6 1 3 - 9 9 3 - 5 5 8 3Great Lakes Regional Office100 Ouellette Ave. 8th FloorWindsor, ON N9A 6T3Phone: 3 1 3 - 2 2 6 - 2 1 7 0Fax: 5 1 9 - 2 5 7 - 6 7 4 0
U.S. Environmental Protection AgencyGreat Lakes National Program Office77 West Jackson BoulevardChicago, IL 60604Phone: 3 1 2 - 3 5 3 - 2 1 1 7Fax: 3 1 2 - 3 5 3 - 2 0 1 8http://www.epa.gov/glnpo
U.S. EPA Region 2290 BroadwayNew York, NY 10007Phone: 2 1 2 - 6 3 7 - 3 0 0 0http://www.epa.gov/region2/U.S. EPA Region 31650 Arch StreetPhiladelphia, PA 19103-2029Phone: 2 1 5 - 8 1 4 - 2 3 0 0http://www.epa.gov/region3/U.S. EPA Region 577 West Jackson BoulevardChicago, IL 60604Phone: 3 1 2 - 3 5 3 - 2 0 0 0http://www.epa.gov/region5/water/

39
Online and video resources
Great Lakes - St. Lawrence River Hydrology, Great Lakes Information Network (GLIN):http://www.great-lakes.net/envt/water/hydro.htmlIncludes links to current, forecasted and historical data on water levels, water flows, and weather and climate. Also featuresoverviews of hydrology concepts written by experts in the Great Lakes region; and comprehensive lists of agencies and organiza-tions, datums, laws, newsletters and related FAQs. Created under the guidance of the binational Coordinating Committee onGreat Lakes Basic Hydraulic and Hydrologic Data and the U.S. Army Corps of Engineers, Detroit District.
Great Lakes Hydraulics & Hydrology Home Page, U.S. Army Corps of Engineers/Detroit District:http://huron.lre.usace.army.mil/hmpghh.htmlIncludes current and forecasted water levels, key water level updates and newsletters, and multi-media resources.
Coordinating Committee on Great Lakes Basic Hydraulic and Hydrologic Data:http://huron.lre.usace.army.mil/coord/cchome.htmlIncludes information and data coordinated between the U.S. and Canada used for the management of Great Lakes resources.
Evaluating Your Coastal Property (Video, VHS format), University of Wisconsin Sea Grant Institute; advises on shorelineproperty construction and building placement.
Living on the Edge (Video, VHS format), U.S. Army Corps of Engineers, Detroit District; explores the many influences on levelsand flows of the Great Lakes system; preview at http://huron.lre.usace.army.mil/levels/vidpromo.html
The ADVISOR, Great Lakes Commission: http://www.glc.org/docs/advisor/advisor.htmlBimonthly newsletter of the GLC, providing regular updates on policy positions and programs, regional events and binationalGreat Lakes issues.
Focus, International Joint Commission: http://www.ijc.org/focusQuarterly newsletter of the IJC contains regular updates on Commission and Board activities and emerging Great Lakes waterquality and quantity issues.
LEVEL News, Environment Canada, Great Lakes Water Level Communication Centre:http://www.cciw.ca/glimr/data/level-news/intro.htmlIncludes monthly updates on weather conditions, levels and flows, public meetings and Great Lakes facts.
For further reading
An Introduction to Michigan’s Water Resources, Institute for Water Resources, Michigan State University
Beaches are Shore Protection, Ohio Sea Grant College Program
Bluff Slumping & Stability: A Consumer’s Guide, Michigan Sea Grant College Program
Coastal Erosion and the Residential Property Market, Ohio Sea Grant College Program
Coastal Processes Manual, 2nd Edition, University of Wisconsin Sea Grant Institute
Erosion Abatement Tips, Assessment and Assistance, Ohio Sea Grant College Program
Great Lakes-St. Lawrence River Regulation: What it Means and How it Works, Environment Canada andU.S. Army Corps of Engineers, North Central Division
Great Lakes Water Levels, Environment Canada
Guide to Lake Erie Bluff Stabilization, Ohio Sea Grant College Program
How to Use Fill Material in Stabilizing Shoreline Bluffs or Banks, University of Wisconsin Sea Grant Institute
Identify Your Shoreline Erosion Problems (Fact Sheet), Ohio Sea Grant College Program
Low Cost Shore Protection...a Property Owner’s Guide, U.S. Army Corps of Engineers
Methods of Alleviating the Adverse Consequences of Fluctuating Water Levels in the Great Lakes-St. LawrenceRiver Basin, A Report to the Governments of Canada and the United States, 1993, International Joint Commission
Questions to Ask Before You Buy Great Lakes Shoreline Property (Fact Sheet), Ohio Sea Grant College Program
Shoreline Erosion: Questions and Answers, Revised 1986, Michigan Sea Grant College Program
Vegetation and its Role in Reducing Great Lakes Shoreline Erosion, Michigan Sea Grant College Program
Additional Resources

©1999ISBN 0-9676123-0-6
US Army Corpsof Engineers