Living on the Edge: Unit 5: Convergent Plate …...Living on the Edge: Unit3: Convergent Plate...
20
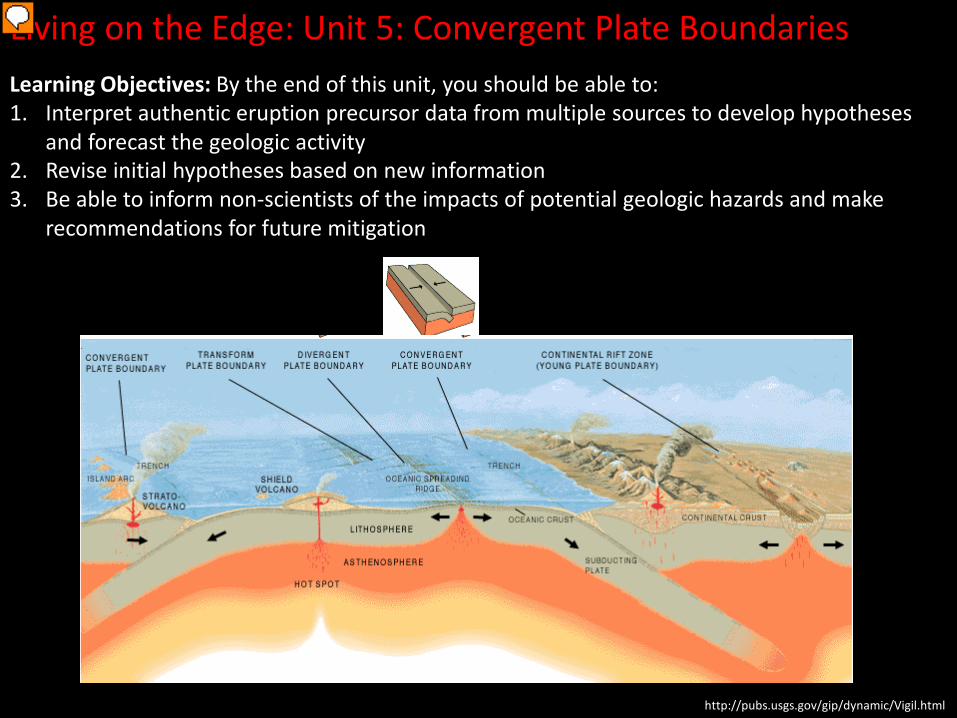
Living on the Edge: Unit 5: Convergent Plate Boundaries Learning Objectives: By the end of this unit, you should be able to: 1. Interpret authentic eruption precursor data from multiple sources to develop hypotheses and forecast the geologic activity 2. Revise initial hypotheses based on new information 3. Be able to inform non-scientists of the impacts of potential geologic hazards and make recommendations for future mitigation http://pubs.usgs.gov/gip/dynamic/Vigil.html
Transcript of Living on the Edge: Unit 5: Convergent Plate …...Living on the Edge: Unit3: Convergent Plate...
Living on the Edge: Unit 5: Convergent Plate Boundaries Learning Objectives: By the end of this unit, you should be able to: 1. Interpret authentic eruption precursor data from multiple sources to develop hypotheses
and forecast the geologic activity 2. Revise initial hypotheses based on new information 3. Be able to inform non-scientists of the impacts of potential geologic hazards and make
recommendations for future mitigation
http://pubs.usgs.gov/gip/dynamic/Vigil.html
Presenter
Presentation Notes
Image credit: USGS, from http://pubs.usgs.gov/gip/dynamic/Vigil.html, accessed September 2014

Living on the Edge: Unit3: Convergent Plate Boundaries
Review Pre-work: 5. Based on your knowledge of volcano monitoring and the interviews with USGS volcanologists from the Mount St. Helens 1980 eruption, describe 2-3 specific ways in which society benefits from monitoring volcanoes. What are the possible roles of local citizens during a volcanic crisis?

Living on the Edge: Unit3: Convergent Plate Boundaries (Google Earth)
Color codes for convergent plate boundaries: Ocean-ocean convergent boundary Continental convergent boundary Subduction zone (ocean or continental)
Presenter
Presentation Notes
Credit: GoogleEarth, Map Data from NOAA, US Navy, NGA, GEBCO; Image Landsat, US Dept of State Geographer, Accessed Sept 2014

http://geomaps.wr.usgs.gov/pacnw/graphic/a1.gif
Living on the Edge: Unit3: Convergent Plate Boundaries
Presenter
Presentation Notes
Image Credit: USGS from http://geomaps.wr.usgs.gov/pacnw/graphic/a1.gif, accessed September 2014. Graphic shows subduction of the Juan de Fuca Plate beneath North America. Arrows at the divergent plate boundary show direction of plate movement (with no implications of asthenospheric flow or driving mechanisms).
Living on the Edge: Unit3: Convergent Plate Boundaries
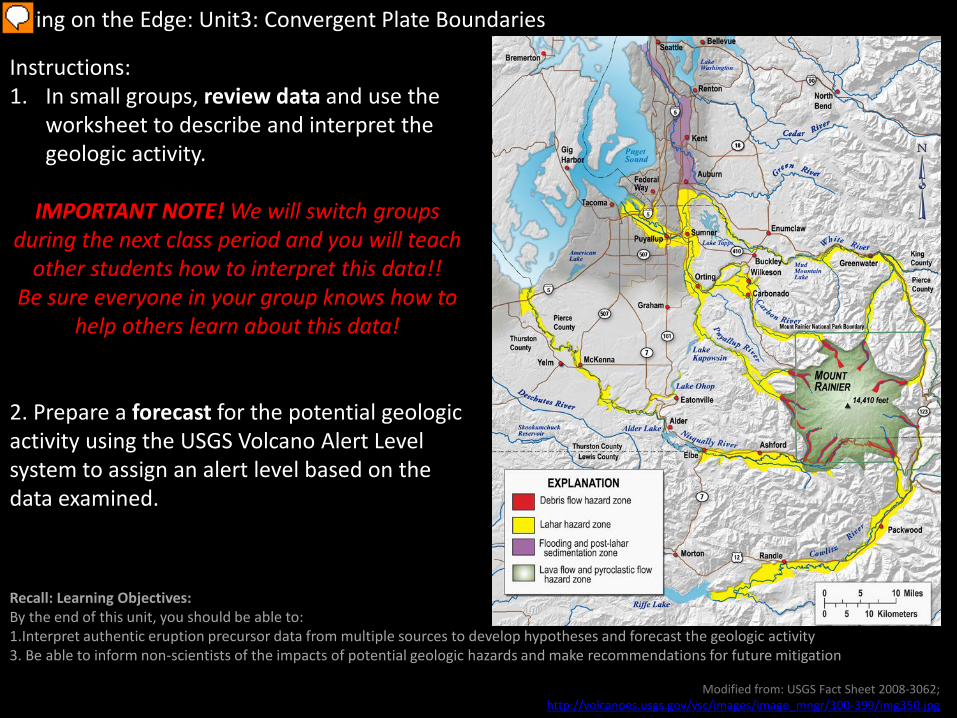
Instructions: 1. In small groups, review data and use the
worksheet to describe and interpret the geologic activity.
IMPORTANT NOTE! We will switch groups
during the next class period and you will teach other students how to interpret this data!!
Be sure everyone in your group knows how to help others learn about this data!
2. Prepare a forecast for the potential geologic activity using the USGS Volcano Alert Level system to assign an alert level based on the data examined.
Recall: Learning Objectives: By the end of this unit, you should be able to: 1.Interpret authentic eruption precursor data from multiple sources to develop hypotheses and forecast the geologic activity 3. Be able to inform non-scientists of the impacts of potential geologic hazards and make recommendations for future mitigation
Modified from: USGS Fact Sheet 2008-3062; http://volcanoes.usgs.gov/vsc/images/image_mngr/300-399/img350.jpg
Presenter
Presentation Notes
Image Credit: USGS, modified from USGS Fact Sheet 2008-3062; available at http://volcanoes.usgs.gov/vsc/images/image_mngr/300-399/img350.jpg, accessed September 2014

Note to instructors: The following slides include each data set for all three groups and we recommend each data set is posted on the internal class site (or otherwise made available to students to access as they complete their pre-work for the next class period (Unit 3 day 2 AKA Unit 6). Please share information about the next class period (included in the last slide, #21) at the end of today’s class period.
SEISMIC DATA SET 1: THROUGH JUNE 8
EARTHQUAKES
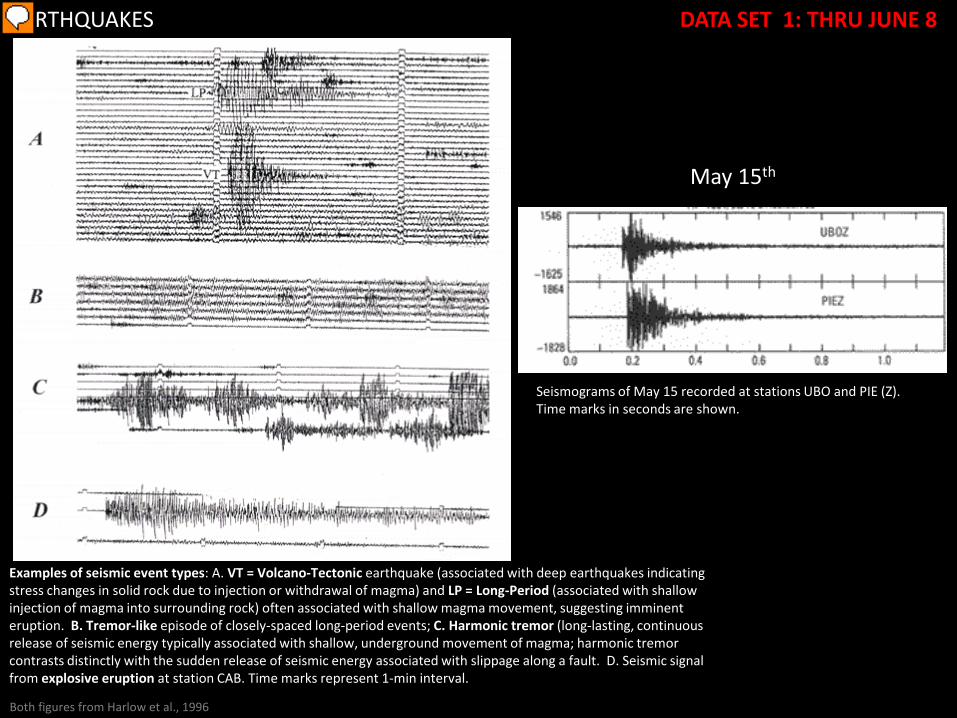
May 15th
Both figures from Harlow et al., 1996
Examples of seismic event types: A. VT = Volcano-Tectonic earthquake (associated with deep earthquakes indicating stress changes in solid rock due to injection or withdrawal of magma) and LP = Long-Period (associated with shallow injection of magma into surrounding rock) often associated with shallow magma movement, suggesting imminent eruption. B. Tremor-like episode of closely-spaced long-period events; C. Harmonic tremor (long-lasting, continuous release of seismic energy typically associated with shallow, underground movement of magma; harmonic tremor contrasts distinctly with the sudden release of seismic energy associated with slippage along a fault. D. Seismic signal from explosive eruption at station CAB. Time marks represent 1-min interval.
Seismograms of May 15 recorded at stations UBO and PIE (Z). Time marks in seconds are shown.
DATA SET 1: THRU JUNE 8
Presenter
Presentation Notes
Image credits: Left figure: from USGS, Harlow et al., 1996; available at http://pubs.usgs.gov/pinatubo/harlow/index.html http://pubs.usgs.gov/pinatubo/harlow/index.html, accessed September 2014 Right figure: from USGS, Ramos et al., 1996; available at http://pubs.usgs.gov/pinatubo/ramos/

EARTHQUAKES
Seismogram from May 21st. Time marks are 60 sec apart.
DATA SET 1: THRU JUNE 8
Figure from Harlow et al., 1996
Presenter
Presentation Notes
Image credit: USGS, from Harlow et al., 1996; available at http://pubs.usgs.gov/pinatubo/harlow/index.html, accessed September 2014
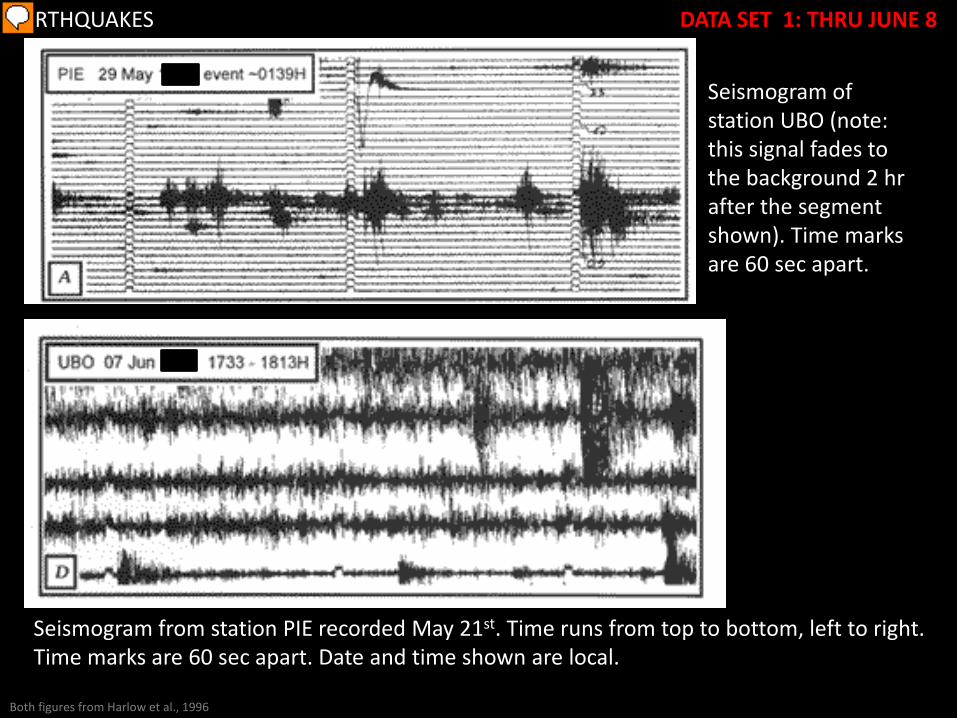
Seismogram from station PIE recorded May 21st. Time runs from top to bottom, left to right. Time marks are 60 sec apart. Date and time shown are local.
EARTHQUAKES
Seismogram of station UBO (note: this signal fades to the background 2 hr after the segment shown). Time marks are 60 sec apart.
DATA SET 1: THRU JUNE 8
Both figures from Harlow et al., 1996
Presenter
Presentation Notes
Image credits: Both figures from USGS, from Harlow et al., 1996; available at http://pubs.usgs.gov/pinatubo/harlow/index.html, accessed September 2014

EARTHQUAKES
MAP VIEW
MAP VIEW
CROSS SECTION (side view) of earthquake
locations under the volcano
(note location of line A-A’ on map above)
May 6- 31 June 1-7
CROSS SECTION (side view) of earthquake
locations under the volcano
(note location of line A-A’ on map above)
DATA SET 1: THRU JUNE 8
Figures from: Harlow et al., 1996
Presenter
Presentation Notes
Image credits: Both figures from USGS, from Harlow et al., 1996; available at http://pubs.usgs.gov/pinatubo/harlow/index.html, accessed September 2014

EARTHQUAKES:
RSAM values (averages of 4 hour intervals) from May 10-June 8 at the PIE station.
Number of seismic events per 4-hour intervals between June 1 and June 8 from (A) the entire volcano network, (B) the cluster of seismic activity 5 km northwest of the summit, and from (C) beneath the summit.
RSAM data: recall that RSAM (Real-time seismic amplitude measurement) represents an average of absolute seismic amplitudes for seismic stations. RSAM does not discriminate between types of earthquakes, but all seismic signals are averaged and recorded
DATA SET 1: THRU JUNE 8
Both figures from Harlow et al., 1996
Presenter
Presentation Notes
Image credits: Both figures from USGS, from Harlow et al., 1996; available at http://pubs.usgs.gov/pinatubo/harlow/index.html, accessed September 2014

GAS & ASH DATA SET 1: THROUGH JUNE 8
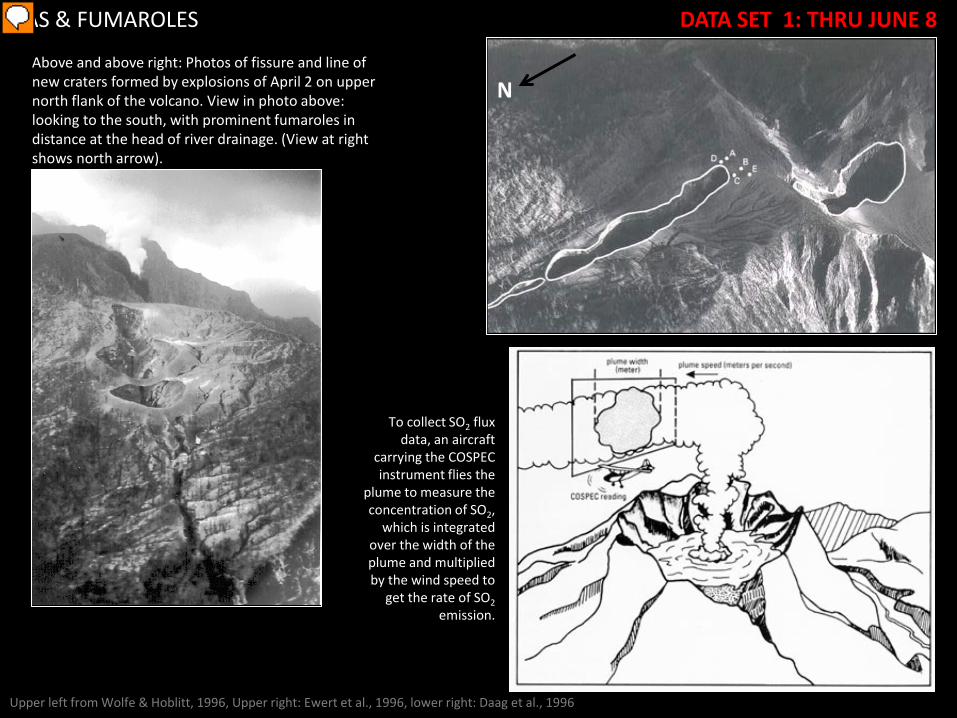
N Above and above right: Photos of fissure and line of new craters formed by explosions of April 2 on upper north flank of the volcano. View in photo above: looking to the south, with prominent fumaroles in distance at the head of river drainage. (View at right shows north arrow).
GAS & FUMAROLES
To collect SO2 flux data, an aircraft
carrying the COSPEC instrument flies the
plume to measure the concentration of SO2,
which is integrated over the width of the plume and multiplied by the wind speed to
get the rate of SO2 emission.
DATA SET 1: THRU JUNE 8
Upper left from Wolfe & Hoblitt, 1996, Upper right: Ewert et al., 1996, lower right: Daag et al., 1996
Presenter
Presentation Notes
Image credits: All figures from USGS, Upper left image from Wolfe & Hoblitt, 1996; available at http://pubs.usgs.gov/pinatubo/wolfe/fig5.jpg , accessed September 2014 Upper right: Ewert et al., 1996, available at http://pubs.usgs.gov/pinatubo/ewert/fig5.jpg, accessed September 2014 Lower right: Daag et al., 1996 available at http://pubs.usgs.gov/pinatubo/daag1/fig1.jpg, accessed September 2014

GAS & FUMAROLES
Plot of SO2 volumes from May 10 to June 8, estimated from COSPEC measurements
On April 2, people in the vicinity smelled hydrogen sulfide (H2S). On April 4, 1991, a volcanology team flew over the volcano and found a chain of vigorously steaming vents across the north face of the volcano (see images attached). The team judged that the activity was of hydrothermal origin. Vents at the northeastern side were short lived; by the time COSPEC surveys were started, only five vents nearer to the summit were actively steaming.
JUNE
SO2 emission from May 13 to June 10
DATA SET 1: THRU JUNE 8
Figures: Left: Daag et al., 1996; Right: Wolfe & Hoblitt, 1996
Presenter
Presentation Notes
Image credits: All figures from USGS, Left: Daag et al., 1996 http://pubs.usgs.gov/pinatubo/daag1, accessed September 2014 Right: Wolfe & Hoblitt, 1996 at: http://pubs.usgs.gov/pinatubo/wolfe, accessed September 2014
TILT DATA SET 1: THROUGH JUNE 8

TILT
The PPO Tilt station was installed 4 km north of summit, on May 2. Two additional tiltmeters were installed during the last week of May. Starting almost immediately after installation, the UBO tiltmeter record was reasonably stable. Instrumental and logistical problems, along with the increasing volcanic activity, prevented getting useful data from the second tiltmeter. Data telemetered from tiltmeters can provide information from high-hazard areas that are too dangerous to revisit.
PPO tiltmeter, north side of volcano. Tiltmeters are sensitive to even slight changes in temperature, so burial 1 to 2 m deep is necessary in order to isolate the instrument from diurnal temperature changes .
DATA SET 1: THRU JUNE 8
From Ewert et al., 1996
Presenter
Presentation Notes
Image credits: From USGS, from Ewert et al., 1996 Left: Modified from http://pubs.usgs.gov/pinatubo/ewert/fig4.gif, accessed September 2014 Right: From http://pubs.usgs.gov/pinatubo/ewert/fig3.gif, accessed September 2014
TILT
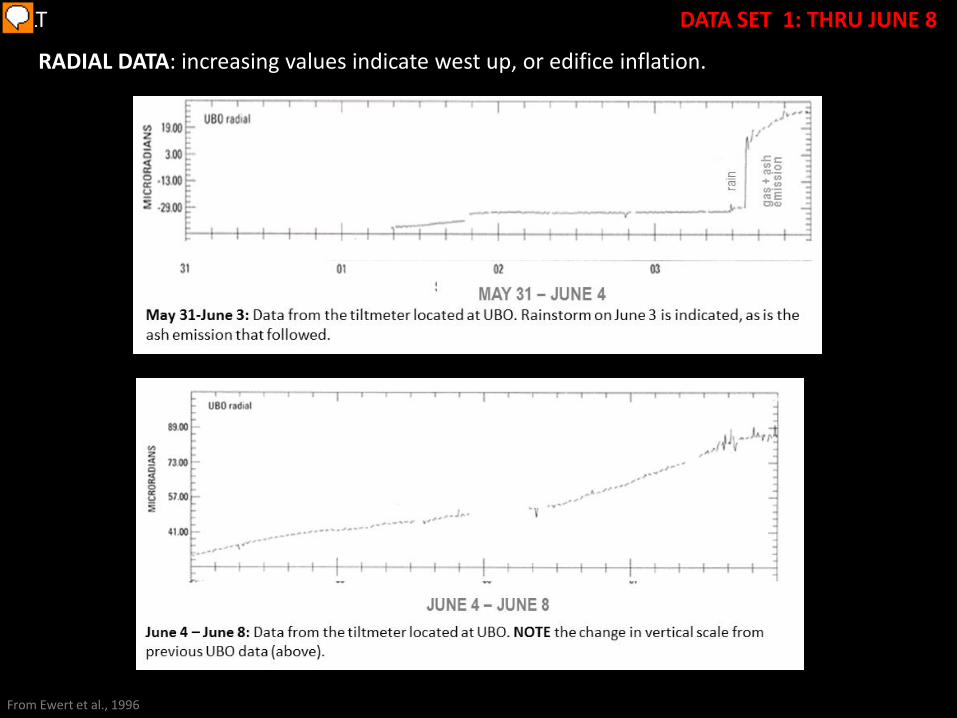
RADIAL DATA: increasing values indicate west up, or edifice inflation.
DATA SET 1: THRU JUNE 8
From Ewert et al., 1996
Presenter
Presentation Notes
Image credits: Both images from USGS, from Ewert et al., 1996: http://pubs.usgs.gov/pinatubo/ewert/index.html, modified September 2014
References Daag AS, Tubianosa BS, Newhall CG, Tungol NM, Javier D, Dolan MT, DelosReyes PJ, Arboleda RA,
Martinez, MML, Regalado MTM; 1996, Monitoring Sulfur Dioxide Emission at Mount Pinatubo, In Fire and Mud: Eruptions and Lahars of Mount Pinatubo, Philippines; CG Newhall, RS Punongbayan (Editors); Philipine Institute of Volcanology and Seismology, Quezon City and University of Washington Press, Seattle and London
Ewert JW, Lockhart AB, Marcial S, Ambubuyog G, 1996, Ground Deformation Prior to the 1991 Eruptions of Mount Pinatubo; In Fire and Mud: Eruptions and Lahars of Mount Pinatubo, Philippines; CG Newhall, RS Punongbayan (Editors); Philipine Institute of Volcanology and Seismology, Quezon City and University of Washington Press, Seattle and London
Harlow, DH, Power JA, Laguerta EP, Ambubuyog G, White RA, Hoblitt RP, 1996, Precursory Seismicity and Forecasting of the June 15, 1991, Eruption of Mount Pinatubo; In Fire and Mud: Eruptions and Lahars of Mount Pinatubo, Philippines; CG Newhall, RS Punongbayan (Editors); Philipine Institute of Volcanology and Seismology, Quezon City and University of Washington Press, Seattle and London
Ramos, E, Laguerta, EP, Hamburger, MW, 1996, Seismicity and Magmatic Resurgence at Mount Pinatubo in 1992; In Fire and Mud: Eruptions and Lahars of Mount Pinatubo, Philippines; CG Newhall, RS Punongbayan (Editors); Philipine Institute of Volcanology and Seismology, Quezon City and University of Washington Press, Seattle and London
Wolfe EW and Hoblitt RP, 1996, Overview of the Eruptions, In Fire and Mud: Eruptions and Lahars of Mount Pinatubo, Philippines; CG Newhall, RS Punongbayan (Editors); Philipine Institute of Volcanology and Seismology, Quezon City and University of Washington Press, Seattle and London

Living on the Edge: Unit6: Convergent Plate Boundaries
FOR NEXT CLASS: • Complete “Unit 6 Pre-work” posted on class website
(Blackboard”) and bring it to the next class period • Be sure to find assigned site location (and write that
down/bring site name to class)
• Be ready to help your classmates learn about the data you examined today!