LIVING IN THE ENVIRONMENT 17 TH MILLER/SPOOLMAN Chapter 11 Sustaining Aquatic Biodiversity.
Upload
winfred-meltonCategory
view
213download
1
LIVING IN THE ENVIRONMENT 17THMILLER/SPOOLMAN
Chapter 6The Human Population and Its Impact

Human Population Growth Continues but It Is Unevenly Distributed (1)
• Reasons for human population increase• Movement into new habitats and climate zones• Early and modern agriculture methods• Control of infectious diseases through• Sanitation systems• Antibiotics• Vaccines• Health care
• Most population growth over last 100 years due to drop in death rates

Human Population Growth Continues but It Is Unevenly Distributed (2)
• Population growth in developing countries is increasing 9 times faster than developed countries
• 2050• 95% of growth in developing countries• 7.8-10.8 billion people
• Should the optimum sustainable population be based on cultural carrying capacity?

Population Time Line: 10,000 BC - 2042
Figure 3, Supplement 9

Five Most Populous Countries, 2010 and 2050
Fig. 6-4, p. 127

Science Focus: Projecting Population Change
• Why range of 7.8-10.8 billion for 2050?
• Demographers must:1. Determine reliability of current estimates2. Make assumptions about fertility trends3. Deal with different databases and sets of
assumptions

Fig. 6-B, p. 129
Natural Capital Degradation
Altering Nature to Meet Our Needs
Reducing biodiversity
Increasing use of net primary productivity
Increasing genetic resistance in pest species and disease-causing bacteria
Eliminating many natural predators
Introducing harmful species into natural communities
Using some renewable resources faster than they can be replenished
Disrupting natural chemical cycling and energy flow
Relying mostly on polluting and climate-changing fossil fuels

The Human Population Can Grow, Decline, or Remain Fairly Stable
• Population change• Births: fertility• Deaths: mortality• Migration
• Population change = (births + immigration) – (deaths + emigration)
• Crude birth rate: # live births/1000/year
• Crude death rate: # deaths/1000/year

Women Having Fewer Babies but Not Few Enough to Stabilize the World’s Population• Fertility rate• number of children born to a woman during her
lifetime• Replacement-level fertility rate• Average number of children a couple must have to
replace themselves• 2.1 in developed countries• Up to 2.5 in developing countries
• Total fertility rate (TFR)• Average number of children born to women in a
population

Fig. 6-7, p. 132
20th Century Lifestyle Changes in the U.S.

Several Factors Affect Birth Rates and Fertility Rates (1)
• Children as part of the labor force
• Cost of raising and educating children
• Availability of private and public pension
• Urbanization
• Educational and employment opportunities for women

Several Factors Affect Birth Rates and Fertility Rates (2)
• Average age of a woman at birth of first child
• Availability of legal abortions
• Availability of reliable birth control methods
• Religious beliefs, traditions, and cultural norms

Several Factors Affect Death Rates (1)• Life expectancy
• Infant mortality rate• Number of live births that die in first year
• Why are people living longer?• Increased food supply and distribution• Better nutrition• Medical advances• Improved sanitation
Several Factors Affect Death Rates (2)• U.S. is 54th in world for infant mortality rate
• U.S. infant mortality rate high due to• Inadequate health care for poor women during
pregnancy and their infants• Drug addiction among pregnant women• High birth rate among teenagers

Migration Affects an Area’s Population Size
• Economic improvement
• Religious freedom
• Political freedom
• Wars
• Environmental refugees

A Population’s Age Structure Helps Us Make Projections
• Age structure categories• Prereproductive ages (0-14)• Reproductive ages (15-44)• Postreproductive ages (45 and older)
• Seniors are the fastest-growing age group

Fig. 6-12, p. 136
Generalized Population Age-Structure Diagrams

Populations Made Up of Mostly Older People Can Decline Rapidly
• Slow decline• Manageable
• Rapid decline• Severe economic problems• How pay for services for elderly• Proportionally fewer young people working• Labor shortages
• Severe social problems
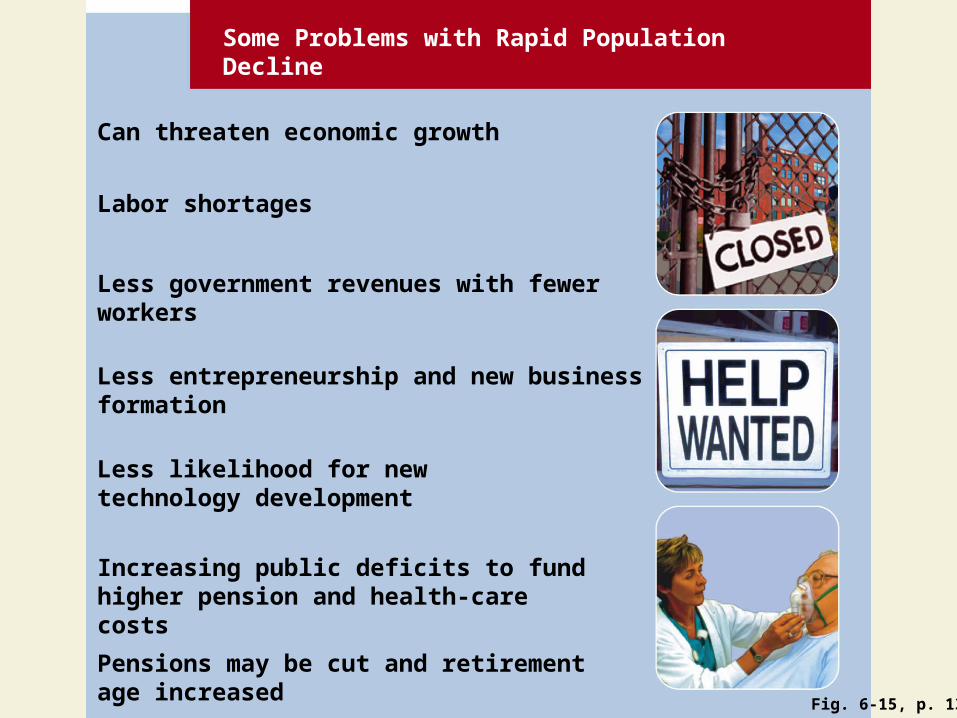
Fig. 6-15, p. 138
Some Problems with Rapid Population Decline
Can threaten economic growth
Labor shortages
Less government revenues with fewer workers
Less entrepreneurship and new business formation
Less likelihood for new technology development
Increasing public deficits to fund higher pension and health-care costs
Pensions may be cut and retirement age increased

Populations Can Decline from a Rising Death Rate: The AIDS Tragedy
• 27 million killed: 1981-2009
• Many young adults die: loss of most productive workers
• Sharp drop in life expectancy
• International community• Reduce the spread of HIV through education and
health care• Financial assistance and volunteers

Fig. 6-16, p. 139
Botswana Age Structure, With and Without AIDS

Fig. 6-16, p. 139
100+ 95–99 90–94 85–89 80–84 75–79 70–74 65–69 60–64 55–59 50–54 45–49 40–44 35–39 30–34 25–29 20–24 15–19 10–14
5–9 0–4
Males Females
Ag
e
80 100 120
With AIDS Without AIDS
Population (thousands)
120 100 80 60 40 20 0 20 40 60

As Countries Develop, Their Populations Tend to Grow More Slowly
• Demographic transition • First death rates decline• Then birth rates decline
• Four stages1. Preindustrial2.Transitional3. Industrial4.Postindustrial

Fig. 6-17, p. 140
Stage 1 Preindustrial
Stage 2 Transitional
Stage 3 Industrial
Stage 4 Postindustrial
Population grows very slowly because of a high birth rate (to compensate for high infant mortality) and a high death rate
Population grows rapidly because birth rates are high and death rates drop because of improved food production and health
Population growth slows as both birth and death rates drop because of improved
Population growth levels off and then declines as birth rates equal and then fall below death rates
80
70
60Total population
50 Birth rate
40
30
20 Death rate
Bir
th r
ate
an
d d
eath
rat
e (n
um
ber
per
1,0
00 p
er
yea
r)
10
0Low Increasing Very high Decreasing Low Zero Negative
Growth rate over time
food production, health, and education

Empowering Women Can Slow Population Growth
• Factors that decrease total fertility rates:• Education• Paying jobs• Ability to control fertility
• Women• Do most of the domestic work and child care• Provide unpaid health care• 2/3 of all work for 10% of world’s income• Discriminated against legally and culturally

Promote Family Planning• Family planning in less-developed countries• Responsible for a 55% drop in TFRs• Financial benefits: money spent on family planning
saves far more in health, education costs
• Two problems1.42% pregnancies unplanned, 26% end with abortion2.Many couples do not have access to family planning