LIVING IN KAMPALA SLUM - Faith doing Justice 2011.pdf · also never seen people sharing a single...
48
John Paul II Justice and Peace Centre LIVING IN KAMPALA SLUM A Socio-economic Analysis in ten informal settlements of Kampala. Kampala—Uganda, 2011, No. 3 Avuni Alfred
Transcript of LIVING IN KAMPALA SLUM - Faith doing Justice 2011.pdf · also never seen people sharing a single...
John Paul II Justice and Peace Centre
LIVING IN
KAMPALA SLUM
A Socio-economic Analysisin ten informal settlements of Kampala.
Kampala—Uganda, 2011, No. 3
Avuni Alfred
2
THE KAMPALA BASIC NEEDS BASKET© John Paul II Justice & Peace CentreISBN 9970 -821 -26 -4
Year of Publication 2011
Published by:John Paul II Justice and Peace CentreP.O. Box 31853Kampala, UgandaTel.: 0414-267372
Email:[email protected]
Any part of this publication, may be reproduced and copied, provided this is not for profi t, full acknowledgement is made
and copy is sent to the publisher.
Printed by
Crystal Graphic LtdPlot 51/53 Nasser Road/Opp. Mtk Building
Tel:+256 712 947478, +256 701 113462
John Paul II Justice and Peace Centre is a Consortium for Justice and Peace, founded by: Missionaries of Africa, Mill Hill, Comboni Fathers, Holy Cross, Jesuits and Comboni Sisters.We are at the service of the Catholic Church and all the people of God.
3
Contents
Page
1. Introduction……………………………………………………… 7
1.1 The Challenge of Urbanization……………………………………….. 81.2 The Growth of Kampala City………………………………………..… 91.3 Fight against Slum Poverty…………………………………………..... 101.4 The Ugandan Context………………………………………………….... 11
2. Methodology……………………………………………………… 12
2.1 Study Goal and Objectives……………………………….….............. 122.2 The scope of the study…………………………………………………... 122.3 Sampling……………………………………………………………………… 132.4 Research Tools…………………………………………………………….. 132.5 Quality Control……………………………………………………........... 142.6 Data Collection……………………………………………………........... 142.7 Data Analysis……………………………………………………………….. 14
3. Economic Situation...………………………………………… 16
3.1 Poverty Lines……………………………………………………………….. 163.2 Poverty Incidence in Kampala Slums……………………………… 183.2.1 State of Food Security in the Slums……………………………… 183.2.2 Absolute Poverty Incidence………………………………………… 193.3 Allocation of HH Incomes…………………………………………….. 193.4 Poverty Gaps……………………………………………………………….. 203.4.1 Food Gaps………………………………………………………............. 213.4.2 Absolute Poverty Gaps…………………………………………........ 22
4. Population and Housing……………………………………. 23
4.1 Population Size and Distribution…………………………………... 234.2 Composition of the Population………………………………………. 254.3 Capability of the Slum Population………………………………….. 264.5 Housing Situation…………………………………………………......... 27

4 Basic Needs Basket
5. Social Services……………………………………………….. 29
5.1 Water Supply……………………………………………………………. 295.2 Toilet Facilities……………………………………………………….… 305.3 Health Facilities……………………………………………………….. 315.4 School Facilities……………………………………………………….. 325.5 Solid Waste Management………………………………………….. 335.6 Security……………………………………………………………………. 35
6. Programs and Policy Implications.………………….. 36
6.1 Overview of Kampala slums…………………….…………………. 366.2 Immediate Solutions………………………………………..……….. 376.3 Sustainable Solutions………………………………………………... 40
Bibliography ……………………………………………………. 43Appendices ………………………………………………………. 44
Table 1: Household Mean Monthly Expenditures ……………. 16Table 2: Poverty Gaps and Defi cits ………………………………… 21Table 3: Population Size and Distribution ………………………. 24
Graph 1: Food Poverty Incidence …………………………………… 18Graph 2: Budget Shares for Food and Non Food Items…….. 20
Figure 1: Population Age Bracket …………………………………… 25
5Kampala informal Settlements
Acronyms
AP Absolute Poverty
APL Absolute Poverty Line
CBN Cost of Basic Needs
CPI Consumer Price Index
FB Food Basket
FP Food Poverty
FPL Food Poverty Line
HH Household
HHH Household Head
HHIG Households Interview Guide
HHRF Household Registration Form
HHs Households
KBNB Kampala Basic Needs Basket
KCC Kampala City Council
KIH Kampala International Hospital
LCI Local Council One
LCs Local Councils
MDGs Millennium Development Goals
NSUSAP National Slum Upgrading Strategy and Action Plan
PI Poverty Incidence
SWM Solid Waste Management
UBOS Uganda Bureau of Statistics
UPE Universal Primary Education
USE Universal Secondary Education
Ushs Uganda Shillings
UNCHS United Nations Commission for Human Settlements

6 Basic Needs Basket
7Kampala informal Settlements
1Introduction
UNCHS1.
Re-echoing and confi rming the experience of Mrs Anna Tibaijuka, I have as well never seen anyone in my village sleeping under the veranda. I have also never seen people sharing a single room and sleeping in shifts due to lack of space. On the contrary, these are common sights which greet any-one who moves in Kampala streets and slums at night. Many governments and development partners’ programs have been and are being implement-ed to improve the living conditions of Kampala slum dwellers. However, there is no comprehensive and consistent information on the change in their living conditions. In 2008, JPIIJPC embarked on annual survey on the cost of living in Kampala slums. The survey aims at establishing the socio-economic changes that occur in the lives of the slum dwellers. Spe-cifi cally, to ascertain whether the living conditions of the slum dwellers are improving or worsening. The 2008 survey sampled 120 households in six Kampala settlements. In 2009, a total of 200 households were sampled in ten informal settlements which widened the scope and provided more insight into the living conditions of the slum dwellers. The number was maintained in this study for the reason that, 200 HHs is representative enough for one to draw a reliable conclusion. The 2009 survey among other things looked into alternative sources of income of slum dwellers, the impact of slum development association, major causes of rural urban migration, and what motivates slum dwellers to continue living in such pathetic conditions. The 2010 survey went further to ascertain the popu-lation of the ten informal settlements, the number and housing condition, land tenancy, and provision of social services as well as the service provid-ers. This has given a deeper understanding of their living conditions.
1 Habitat Backgrounder: A voice for the voiceless. Website:www.unchs.org
“We are in the business of promoting a culture of solidarity and inclusiveness in all human settlements. Cities will not become liveable places without learning from the solidarity which is practised in villages where everyone is provided for, however modestly. In my village, I never saw anyone sleeping under a tree”. Mrs. Anna Tibaijuka, the Executive Director of

8 Basic Needs Basket
1.1 The Challenge of Urbanization
There is an increasing recognition that rapidly urbanizing countries need to scale up efforts to address the challenges of urban slums, moving from project-based interventions to policy and programmatic approaches. It is estimated that one billion people live in slums around the world today and that this population will double in the next 20-30 years if the trends continue2. Facing this enormous challenge will require not only scaling up fi nancial resources and guaranteeing long-term political commitments, but also better understanding the experiences of national and sub-nation-al governments in establishing and instituting policies and programs for slum upgrading and prevention. In 2008, Uganda came up with National Slum Upgrading Strategy and Action Plan to uplift the lives of at least one million slum dwellers by 2020. The Strategy and Action Plan has been developed to provide a framework, direction and plan to all stakeholders: government, urban authorities, NGOs and CBOs. This is a good gesture from the government thus far. The challenge remains on the implementa-tion of this strategy.
The strategy recognizes that slums are a development challenge, which must be addressed. The emergency of slums in Kampala City has been gradual and sustained over a long period of time. Studies that have been conducted on the growth of slums in Kampala attribute the growth to: rap-id urban population growth, which has overwhelmed city authorities; land tenure systems which are complicated and multiple, together with poverty and low incomes amongst the urban population. Land tenure has had a signifi cant infl uence on physical planning and infrastructure development because of private landowners with mailo land rights, creating planning problems of haphazard developments that lack basic infrastructure such as access roads, water and sanitation. The application of tenures with a rural (mailo, customary) and private character, has over the years limited the leverage power of Kampala City Council and the central government to plan, control and enforce orderly urban development.
2 UN-Habitat global report 2010

9Kampala informal Settlements
1.2 The Growth of Kampala City
The population of Kampala City is growing at an annual average rate of 4.1%3. However, this growth is not infl uenced by natural rate of increase, but rather rural urban migration. The 2009 survey revealed that most of the people migrate to the city for a number of reason such as: employment opportunities, spouses, better standard of living and services, and security (from domestic violence, confl icts and war). Others have migrated due to the loss of their “bread winners”, peer infl uence, and loss of land in rural areas. As a result of high cost of living in the city, most of these migrants end up living in slums. Over 60% of Kampala’s population is estimated to be living in slums where they can get cheap accommodation and food.
As aforementioned, the rate at which the city has developed is higher than the capacity of Kampala City Council to adequately plan and implement the plans. Consequently a lot of unplanned developments have come up with many of them in areas prohibited for settlement such as wetlands and road reserves. The capacity to plan and provide the settlement basic ser-vices and infrastructure to cater for new and expanding urban populations has given Kampala its present outlook4. The city is very congested in terms of infrastructure and structures. Rapid growth has had a big infl uence on housing conditions, where 54% of the populations live in tenements (Muz-igo), while 12% live in stores and garages. 65% rent their accommodation, while 71% occupy rooms rather than freestanding houses5.
The stocks and fl ows of food and cash of the HHs in these slums are low, unreliable, seasonal and inadequate. Majority are locked into dependence on one patron for whom most work is done or continue a livelihood with a range of activities that refl ect tenacious ingenuity in the face of narrow margins for survival. Returns to the family labour are low if indeed they get something to do. They tend to have few buffers against contingencies; small needs are met by drawing on slender reserves of cash, by reduced consumption, by batter or by loans from friends, neighbours, and groups. This situation has made most Kampala slum HHs vulnerable and the members prone to sickness. Further, lack of adequate education has also sustained poverty in Kampala slums. The survey in 2009 revealed that only 3% of HHs interviewed had education up to Tertiary level.
3 Uganda Population and Housing census 20024 The national Report on the Istanbul Declaration, 2001, pg 175 The Uganda National House Survey 1999

10 Basic Needs Basket
1.3 Fight against Slum Poverty
Poverty alleviation is a key policy debate in recent development literature. Many researchers of development economics, such as Emwanu (1995), have argued that the fi ght against poverty is a necessary condition for growth. The elaboration of policies for poverty alleviation in slums re-quires a thorough knowledge of slum poverty as well as an understanding of the effi ciency of implemented programmes. That is why JPIIJPC has committed resources to investigate into slum poverty. It should be noted that the poor do not need sympathy and pity, but love and compassion.
Some people argue that poverty exists because people are lazy or lack power and that there is no great need to reduce social inequality. How-ever, Chambers (1983) argues that there is no evidence to support the view that their poverty is due to improvident, laziness and fatalistic6. What does emerge is that some do sometimes behave in ways that can be thus interpreted. They may not save, they may not always be visibly working and may appear to accept fate passively. But there is evidence that the failure to save and invest refl ects pressing needs for immediate consump-tion goods such as rent, schools fees, food, medical care and the livelihood imply forfeiting these basic needs. In fact most of Kampala slum dwellers live by the day.
The link between poverty, public service delivery, and economic and social rights cannot be over emphasized. Poor people are the ones most likely to be affected by absence of even the most basic public service. However, it would be fallacious, to view poverty as a purely economic phenomenon caused by lack of income or the means of production. Increasingly, pov-erty is being tied into lack of access to equal opportunities, inequitable distribution of resources and the marginalization and disempowerment of certain groups. The inability of people to access institutions and mecha-nisms that promote equity and avail opportunities for development capac-ity in order to overcome structural and other barriers to the enjoyment of rights is wider than traditional economic construction of poverty.
6 Chambers, R. Rural Development, Putting the Last First, Longman, 1983.

11Kampala informal Settlements
1.4 The Ugandan Context
Uganda is one of Africa’s most rapidly urbanizing countries, with a popu-lation base estimated at about 30 million, a high population growth rate of 3.2% and a high rate of urban growth estimated at 5.1 percent per annum7. This rapid urbanization not only attributed to a history of confl icts, wide-spread poverty and a modernizing shrinking agricultural economy but also one of limited and unreliable energy supply and an acute scarcity of resources for local authorities. Development cannot occur on a signifi cant scale until people have access to basic needs. Basic needs are primary es-sentials common to or required by everyone in order to lead a healthy and happy life. The most commonly sited basic needs are food, shelter, water and clothing. In Uganda many people still lack safe drinking water and a sanitary living environment.
Although, the Millennium Development Goals (MDGs) are based on global targets, they have signifi cant implications for Kampala’s urban poor com-munities. MDG numbers four and fi ve set the goals of reducing child mor-tality and improving maternal health respectively. MDG number six sets the ambitious target of not only halting the incidence of malaria and other major diseases, but also to reverse the incidence of these diseases. MDGs, ten and eleven focus on improving the lives of slum dwellers around the world. Because of their direct correlation, goals number ten and eleven are essential to achieving goals number four, fi ve, and six. Thus, it is apparent through globally stipulated goals, that the living conditions of Kampala’s slum dwellers require signifi cant attention and substantial improvement.
7 Uganda Bureau of Statistics, 2010 Statistical Abstract.
12 Basic Needs Basket
2Methodology
2.1 Study Goal and Objectives
It is a challenge to undertake a study in slums given the diverse communi-ties, various socio-economic dynamics and perceptions of the inhabitants. The goal of the third Kampala Basic Needs Basket (KBNB) was to deep-ly investigate into the depressing physical conditions of Kampala slums dwellers and consequently propose program and policy implications. The generated information is to help JPIIJPC effectively advocate for the plight of these urban poor. There are several stakeholders working on improving the living condition of Kampala slum dwellers and these need information for their effective intervention. On the other hand, many potential actors may be ignorant of the pathetic living conditions of these slum dwellers, thus this report can provide a reliable basis and draw them into action.
The Specifi c Objectives
To establish ‘New Poverty Lines’ and fi nd out the change in the cost of • living for a household of 6 members within the slums of Kampala.To fi nd out the changes in the incidence and intensity of poverty with-• in the slums of Kampala.To determine the population, housing situations and land tenancy in • 10 Kampala slums.To establish the provision of social services and how they cost the • slum dwellers.To design programs and policy implications to address the pathetic • living conditions of Kampala slum dwellers.
For the purpose of this study, the living condition of slum dwellers com-prises basic needs, namely; food, housing, education, health, water, sani-tation, and security.
2.2 The scope of the study
Like in 2009 the number of ten slums was maintained in 2010 survey. The study covered the following slums; Makerere Kivulu I Zone, Kamwokya Kifumbira Zone, Banda B3, Kiwunya Tree Shadow Zone, Wabigalo Cente-nary Zone, Namuwongo Kasanvu Zone, Katanga Kimwanyi Zone, Kalerwe Besina Zone, and Bwaise Lufula Zone. In this study two new slums were

13Kampala informal Settlements
introduced, namely: Kiwunya Tree Shadow Zone and Nsambya Kam-wanyi, while Kiswa Zone II and Nsambya Gogonya East II Zone which constituted the 2009 survey were dropped. The two slums were dropped basically because they are waning. Rich people have purchased and con-structed permanent structures, making them lack the basic characteristics of slums that the study consider. Therefore, the two do not depict one of the key slum situations where poverty is spread evenly among the dwell-ers.
2.3 Sampling
From each of the ten sampled slums, 20 HHs were selected with the assis-tance of the Local Council Leaders (LCs). The respondents from the previ-ous surveys were selected in the case of slums which were not changed and which enabled me to establish the changes in their cost of living. However, the respondents from Kiwunya Tree Shadow Zone and Nsambya Kam-wanyi were new, as these slums have been selected for the fi rst time. This study focused solely on the slum population in neglected parts of Kampala city where housing and living conditions are appallingly lacking. It tar-gets the population that lack basic municipal services - water, sanitation, waste collection, drainage system, street lighting, paved footpaths, roads for emergency access, good schools, and safe areas for children to play.
2.4 Research Tools
Three tools were used for primary data collection, namely; Households Interview Guide (HHIG), Households Registration Form (HHRF), and Social Services and Facilities Form (SSFF). The HHIG was designed to es-tablish three welfare indicators; (1) the particulars of the HHH (age, gen-der, level of education, occupation and monthly income), (2) HH size and composition, and (3) HH monthly expenditure and disposable income. The HHRF was used to capture information on the number of buildings, ownership, type and condition, value of the houses, name of the HHH, rent per month, and total number of persons per HH. It also captures in-formation per HH on the total number of; adults, adults in formal employ-ment, children, children going school, and children not going to school. Finally, SSFF was designed to gather information on; clean and safe water supply, toilet facilities, health facilities, and schools (nursery, primary and secondary). It also investigated the types, number and the service provid-ers. Additional questions were attached to this tool seeking information on garbage management, pressing problems in the slums, the interven-
14 Basic Needs Basket
tions undertaken, effect of the interventions, solutions to slum problems, and presence of police a station to serve the slums. The SSFF tool was administered to LCI Chairpersons of the respective slums.
2.5 Quality Control
Prior to actual primary data collection, a pre-test was done to ensure that the tools would gather the right data. After the pre-test, all the tools were refi ned. Five research assistants were trained to help in the data collection. Out of the fi ve, three (Hillary Berinya, Kwizera Charles,and Namatovu Cissy) had participated in the previous surveys. They were also subjected to training because HHRF was introduced for the fi rst time in the survey as well as the SSFF tool. The other two research assistants were Abukenya Alex and Segawa Ronny. Mr. Mutebe Joshua assisted in the supervision during data collection process, and Mr. Samuel Kintu, our Administrative Assistant designed the cover page of the booklet.
2.6 Data Collection The data was collected in the month of July 2010. Four main techniques were used during the data collection; in-depth interview, observation, photography, and record review. A total of 200 HHHs were interviewed on the cost of living using HHIG, ten LCI from the sampled slums were interviewed on the status of social services in their respective areas of ju-risdiction using SSFF, and all the HHs in the ten slums were interviewed using HHRF. Additional primary data was collected through observation and photography. Secondary data was collected by reading some of the HH survey reports published by the Uganda Bureau of Statistics (UBOS) and other relevant publications including the National Slum Upgrading Strategy and Action Plan (2008). The 2008 and 2009 KBNB survey great-ly shaped the current report.
2.7 Data Analysis
Like in the previous surveys manual system of data analysis was used in grouping data and (Microsoft Excel) computer package was used to derive general and average statistical estimates. The Cost of Basic Needs (CBN)8 was used in measuring prevalence and intensity of poverty in the slums.
8 Cost of Basic Needs refers to the cost of basic necessities, namely food and non-food items.
15Kampala informal Settlements
It was used to determine the number of people who could not afford food and non food items after establishing two monetary poverty lines, namely: Food Poverty Line (FPL) and Absolute Poverty Line (APL). FPL was cal-culated from the HH mean average monthly expenditures on the Food Basket (FB), while APL was calculated from the HH mean average month-ly expenditures on Basic Needs Baskets (FB plus Non-food items).
The FB which was used to determine the FPL included the following food items: meat, fi sh, eggs, onions, tomatoes, vegetables, cooking oil, fruits, salt, bread, sugar, tea/coffee, maize fl our, cassava and millet fl oor, rice, beans, groundnuts, potatoes, matooke, fresh cassava, drinks and hotel meals. On the other hand, the non food items that constituted the calcula-tion of the APL in addition to the FB were cost for: medical care, cloth-ing, foot wear, education, house rent, water, fuel, (paraffi n, charcoal, fi re-wood), transport/fare, communication (airtime, or public pay phone), security, toiletries (bathing soap, toothpaste and brushes, body lotion), laundry soap, barber/salon, house upkeep (brooms, dusters), and house-hold equipment.
To measure the Poverty Incidence (PI)9 in the ten slums, Food Poverty In-cidence (FPI) and Absolute Poverty Incidence was used. FPI refers to HHs whose monthly expenditure on food is less than the established FPL, while API refers to HHs whose monthly expenditures on Basic Needs Baskets (BNB) fall below established APL. Finally, Poverty Gap (PG)10 was used to determine the extent of poverty in these slums. It was used to measure how poor Kampala slum people are and to determine the amount of addi-tional monetary resources that would be require on monthly basis to uplift them to the established poverty line.
9 Poverty Incidence is the percentage number of HHs whose monthly expenditures fall below the established poverty line in a given area.10 Poverty Gaps measures captures the defi cits of the poor HHs in a given area.

16 Basic Needs Basket
3Economic Situation
3.1 Poverty Lines
As it was in the two previous studies, the 2010 study also looked into the average monthly household (HH) expenditures of the ten sampled house-holds. The mean monthly expenditure on food for the household of six people was established at Ushs 150,558 and the mean monthly expen-diture on the basic needs basket (Food and Non-Food) was estimated at Ushs 382,220. This analysis shows that for the 20 HHs sampled in each slum the Food Poverty Line (FPL) is Ushs 150,558 and the Absolute Pov-erty Line (APL) is Ushs 382,220.
Table 1: Household Mean Monthly Expenditures
Average Expenditures (Ushs)
Location Food Non-Food Total
Makerere Kivulu 151,630 213,245 364,875
Kamwokya Kifumbira Zone 115,140 224,885 340,025
Banda B3 125,415 211,800 337,215
Kiwunya Tree Shadow Zone 267,263 333,247 600,510
Wabigalo Centenary Zone 143,370 254,690 398,060
Namuwongo Kasanvu Zone 114,600 132090 246,690
Katanga 119,915 207,160 327,075
Kalerwe – Besina 154,850 270,475 425,325
Nsambya - Kamwanyi 168,600 300,700 469,300
Bwaise - Lufula Zone 137,305 168,325 305,630
Overall Average 150,558 231,662 382,220
In contrast to the 2009 survey whereby there was an increase in both FPL and APL, the 2010 survey registered reduction in both aspects. The 2009 survey established an increase from Ushs160,700 in 2008 to Ushs 183,022. Meanwhile, the 2010 survey shows a signifi cant decrease by Ushs 32,464 from 2009. Therefore, while the cost of food for a HH of six increased in 2009 by 18.9%, 2010 registered a decrease by 17.7%. Similarly, the APL increased from Ushs 361,700 in 2008 to Ushs 399,291 in 2009. However, the 2010 survey shows decrease in APL by Ushs 17,077. In percentage,
17Kampala informal Settlements
while the cost for basic needs baskets increased in 2009 by 13.9%, the 2010 survey shows decrease by 4.3%.
The decrease in the cost of living can be attributed to the trend of infl ation which started right from the months of Nov/Dec 09 and January 2010. According to quarterly economic report on the state of the Ugandan economy -February, 2010, the Annual Headline Infl ation rate for the month of January 2010 was 8.8% down from 11.0% in December 2009. The single digit rate was mainly on account of decrease in prices of food crops11. For instance, food crops infl ation slowed down to 27.5 % in the month of January 2010 from 34.8 % in December 2009. This is mainly attributed to increased supplies to the major markets. The Annual Core infl ation rate, excluding food crop items, fuel, electricity and metered water, also dropped to 5.4 % in January 2010 from 7.4 % in December 2009. During the month, food prices dropped by 1.7 % due to signifi cant reductions in the prices of staple foods as non food crop infl ation decreased by 0.2 %. It was predicted further that by June Infl ation rate in Uganda was to fall to about 7%.
Indeed by the year ending July 2010, Uganda’s annual infl ation rate declined to 3.2% in July as food, gasoline and kerosene prices dropped (UBOS)12. Infl ation slowed from a revised 4.2% in June 2010. Prices fell 0.4% in the month. Contrary to the previous year where there was high demand for food both locally and in the neighbouring countries, food prices in the East African countries declined to 2.2% as the cost of products including bananas, beans, rice, sugar and corn fl our declined in the month. Infl ation in Uganda has declined most of this year due to good food harvests. Usually prices tend to rise during planting and before harvest basically because the country is using up its food stocks. The decrease in prices of some food items is mainly attributed to increased supplies to the markets. The “food prices index decreased by 5.5% for the year ending August 2010 compared with a decrease of 0.4% registered for the year ended July 2010”13 . Consumer Price Index (CPI) is a measure of the average change in prices over time of goods and services purchased by households.
11 Food Crops include Fresh food crop items and related products such as milk and fl our
12 UBOS July 2010
13 UBOS September 2010

18 Basic Needs Basket
3.2 Poverty Incidence in Kampala Slums
To establish the pervasiveness of poverty in Kampala slums, the estimated FPL and ABL, has been used. From the two poverty lines, like in the previous surveys, it was easy to know which slums are more vulnerable in terms of food security and which slums are abjectly poor compared to the rest.
3.2.1 State of Food Security in the Slums
Using the estimated FPL of Ushs 150,558, Kifumbira reported the highest incident of Food Poverty (FP) as indicated by graph 1. In this slum 85% of the Households live below the estimated FPL. This was followed by Kivulu with PFI of 80%. Kasanvu and Katanga reported FPIs of 75% each, while Kiwunya reported the lowest FPI of only 25% of the HHs living below the estimated FPL. From the fi ndings there has been a drop in the HH percentage living below FPL in two slums, namely; Bwaise 20% (85-65%) and Kalerwe 25% (75-50%)14, while Wabigalo remained constant. However, despite the drop in the FPL most slums registered increase in the percentage of HHs living below FPL, namely: Kamwokya by 15% (70-85%), Banda by 20% (50-70%), Kivulu by 15% (65-80%), Katanga by 10% (65-75%) and Namuwongo by 5% (70-75%)15.
Graph 1: Food Poverty Incidence
0
10
2 0
3 0
4 0
50
6 0
70
8 0
9 0
F - povert y
Abs- povert y
14 2009 survey in ten informal settlement
15 Ibid
Kiv
ulu
Kam
wok
ya
Banda
B3
Kiw
uunya
Wab
igal
o
Nam
uwon
go
Kta
nga
Kal
erw
e
Nsa
mbya
Bwai
se
19Kampala informal Settlements
The overall survey shows that 63% of the HHs interviewed in 2010 is living below the estimated FPL. In comparison to the 2009, there has been increase of 1.5% in the number of slum HHs living below Ushs 150,558 per month. What does this fi nding reveal? The answer to this question does not need an economist. It simply means, most HHs do not have the capacity to purchase enough food as there are non-food items which they must pay for if they are to continue living in the city. In fact, it was established that, HHs spend much more on non-food items than food items as shall be explained later. It should also be noted that, the fall in food stuff prices does not necessarily correlate with the prices of non-food items.
3.2.2 Absolute Poverty Incidence
Basing on the APL of Ushs 382,220, Namwongo reported the highest incidence of Absolute Poverty (AP) as indicated in graph 1 above. In Namwongo, 85% of the HHs interviewed is living below the APL. This followed by Kivulu and Banda with poverty incidence of 75% each, while Bwaise and Kamwokya have poverty incidence of 70% each. Again Kiwunya reported the lowest Absolute Poverty Incidence of only 10%. Banda reported the highest increase in AP incidence by 20% (55-75%) followed by Wabigalo by 10% from (40-50%), and Kivulu by 5% (70-75%). On the other hand, Kamwokya reported the highest drop in AP incidence by 10% (80-70%), followed by Katanga, Namuwongo and Kalerwe by 5% each. The overall AP analysis shows that, 61.5% of the HHs interviewed is living below the estimated APL. In contrast with 2009 survey, there is a decline in the number of HHs living below AP by 2%. What does this fi nding signify? Since there was no decrease in prices of non-food items, the fall in food prices enabled more families to pay for the non-food items. Consequently, this resulted into the decrease in the number of HHs living in AP.
3.3 Allocation of HH Incomes
From the above scenario you notice that, despite the fall in food prices, the number of HHs in Kampala slums living below FPL increased by 1.5% in 2010. This clearly refl ects the manner and priority of slum HHs in allocating their disposable income. All the HHs interviewed reported to be spending more on non-food items than food items (see graph 2). It has been established that on average a HH spend 60.6% of its monthly budget on non-food items and 39.4% on food. Although all the three years fi ndings reveal that Kampala slum dwellers spend more on non-food items, the

20 Basic Needs Basket
2010 fi nding manifests the worst scenario. Compared to 2009 survey, the budget allocation on food items reduced by 6.4% in 2010, while the budget allocation for non-food items increased by 6.4%.
Graph 2: Budget Shares for Food and Non Food Items
Given that the 39.4% of the HHs income is only Ushs 150,558 to be spent on food for a month, in one HH of six people and the food sold in the market has no price discrimination to favour the low income group, the food insecurity is so severe. Most of these people hardly eat enough food and a balanced diet is still a dream to many HHs. Some families reported having one meal a day.
3.4 Poverty Gaps
This is the sum of the poverty line and the shortfall in the private consumption per adult equivalent of individuals below the absolute poverty line divided by the absolute poverty line16.
16 KBNB 2009
0
10
2 0
3 0
4 0
50
6 0
70
Food
Non- Food
Kifu
mbir
a
Banda
B3
Kiw
uunya
Cen
tenar
y
Kas
anvu
Kat
anga
Kal
erw
e
Km
wan
yi
Lufula
Kiv
ulu

21Kampala informal Settlements
3.4.1 Food Poverty Gaps
Looking into the intensity of poverty in the 10 slums, Wabigalo (Centenary Zone) again reported the highest FPG at 41.4%, an increase of 0.9% from 2009 survey. This was followed by Banda B3, Katanga, Kalerwe, Bwaise, and Namuwongo with FPGs at 39.1%, 36.4%, 34.6%, 34.3% and 32.4% respectively. Makerere Kivulu and Nsambya Kamwanyi reported the lowest FPGs with 18.4% and 21.5% respectively. Generally in contrast to 2009 survey most of the slums registered increase in FPGs with exception of Makerere Kivulu which reported decrease of 8% and Namuwongo and Kamwokya 6.7% each. As it was already established this does not mean that these three slums have become food secure. The FPG is essentially to show how grave food insecure a specifi c slum is. Therefore, to overcome FPG in these slums if any intervention is to be made, the HHs in Wabigalo Centenary Zone will require more money than any other Slums. This should not be concluded to mean that there are more HHs in Wabigalo who are below FPL, but rather the high incapability among them. In fact from the analysis, Kamwokya reported 85% of the HHs interviewed PFL and Katanga and Kivulu reported 75% each from that of Wabigalo which was only 45%.
Table 2: Poverty Gaps and Defi cits
Slums FPG(%)
Av. FD (Ushs)
APG (%) Av. AD (Ushs)
Makerere Kivulu 18.4 27,711 28.5 116,127
Kamwokya Kifumbira Zone 31.1 46,823 30.9 118,045
Banda B3 39.1 58,896 30.1 114,960
Kiwunya Tree Shadow Zone 29.6 44,558 35.2 134,470
Namuwongo Kasanvu Zone 32.4 48,769 27.4 104,870
Wabigalo Centenary Zone 41.4 62,357 43.9 167,714
Katanga 36.4 54,871 43.2 165,058
Kalerwe 34.6 52,128 26.2 100,106
Nsambya Kamwanyi 21.5 32,340 22.5 86,053
Bwaise Lufula Zone 34.3 51,681 43.5 166,106
General Average 31.88 48,013 33.13 127,351
The fi nding indicates that the overall FPG was estimated at 31.88%. This implies that additional Ushs [(31.88/100) x 150,558] = Ushs 47,998 would

22 Basic Needs Basket
be required on monthly basis for an average HH to reach the estimated FPL. This fi nding indicates fall in the additional amount required of 8,629 in contrast to last years fi nding. Again I would like to emphasise that one should take this to mean people are now more secure in the slums, moreover the number of HHs which live below the FPL increased as they are conditioned by non-food items. On the other hand, the overall FPI was estimated at 63%. Consequently, in order to uplift all the [63/100x200] = 126 poor HHs from their FP, a monthly subsidy of Ushs [47,998 x 126] = Ushs 6,047,748. This amount shows a decrease of Ushs 917,373 from 2009 survey. One may ask the question why there has been decrease and yet the number of HHs which experience FP increased. The answer is that, 2010 as already mentioned experienced fall in food stuff prices.
3.4.2 Absolute Poverty Gap
Although FPG does not necessarily correlate with APG for a given location, Wabigalo reported the highest APG of 43.9% as was the case of 2009 survey and with increase of 4.8% (see table 2). This was followed by Bwaise and Katanga with APGs of 43.5% and 43.2% respectively. Nsambya Kamwanyi and Kalerwe reported the lowest APG of 22.5% and 26.2% respectively. As a result, for any intervention aimed at reduction of AP in these slums, Wabigalo would still require more funds as subsidy than any of the other slums while Nsambya Kamwanyi would require the least amount. APG in Wabigalo was estimated at 43.9%. therefore [(43.9/100) x 398,060] = Ushs 174,748 additional money would be required on monthly basis for an average HH in Wabigalo to overcome its AP, while an average HH in Nsambya Kamwanyi basing on its estimated APG at 22.5% would require only [(22.5/100) x 469,300]= Ushs 105,593.
The general APG was estimated at 33.13% an increase of 1.5% from the 2009 survey. In this way additional Ushs of [(33.13/100) x 382,220] = 126,629 would be required on monthly basis for an average HHs in the sampled slums to overcome it AP. Then how much additional money would be needed to uplift all the HHs below AP in these slums? Considering overall poverty incidence was estimated at 61.5% and APL at Ushs 382,220, in order to uplift all the [(61.5/100) x 200] = 123 poor HHs from their AP would require a monthly subsidy of Ushs [126,629 x 123] = 15,575,367. Compared to 2009 survey, a total of Ushs 464,225 reduction was established. This can be explained on the context that, as food prices reduced in 2010, more HHs were able to meet the cost of other non-food
items which they could in the previous year.

23Kampala informal Settlements
4Population and Housing
The Ministry of Lands, Housing and Urban Development has come up with National Slum Upgrading Strategy and Action Plan (NSUSAP) in a bid to implement the MDG No.7, which addresses the most pressing challenge of the century, dealing with people living in the most depressing physical conditions in the world’s urban areas. By 2009 Ugandan urban population was estimated at 5 million out of which 60% is said to be living in slums. Therefore, through the NSUSAP the government is targeting to uplift the lives of at least one million people by the year 2020 through the implementation of the developed NSUSAP. This of course necessitates an analysis of the population of the Slum dwellers, which this survey did in respect to ten slums within Kampala.
4.1 Population Size and Distribution
To formulate present and future development programs for the slum inhabitants, the knowledge of the size, quality and composition of their population is imperative. Having envisaged the importance of population statistical data, I took the initiative to ascertain the population of the poor living in the ten sampled slums. It should be noted that the population fi gures estimated exclude all the rich HHs in those slums. The reasons being, they don’t need help and secondly they were not responsive. It also excludes the students occupying hostels as well as lodgers, especially from Katanga and Kiwunya Tree Shadow Zone where these facilities exist.

24 Basic Needs Basket
Table 3: Population Size and Distribution
Slums Population Percentage
Kamwokya Kifumbira Zone 2,102 9.4
Makerere Kivulu 1,850 8.3
Banda B3 1,559 7
Kasanvu 1,231 5.5
Centenary 1,030 4.6
Kiwunya Tree Shadow Zone 2,047 9.1
Nsambya Kamwanyi 2,671 12
Katanga Kimwanyi Zone 5,377 24
Kalerwe Besina Zone 2,178 9.7
Bwaise Lufula 2,346 10.5
Total 22,391 100.0
The total population for the ten slums was estimated at 22, 391 people out of which 24% (5,377 people) are living in Katanga making it the most populated compared to the rest, followed by Nsambya Kamawyi 2,671 (12%), Bwaise Lufula 2,346 (10.5%), Kalerwe Besina Zone 2,178 (9.7%), Kifumbira Zone 2,102 (9.4%), Tree Shadow Zone 2,030 (9.1%), etc. Although Katanga has reported the highest population, it should not be taken to mean that it covers a larger area than the rest. In fact this slum is on only 2 acre piece of land as most of the land has been taken by developers for the construction of hostels to host Makerere University students, shops, car washing bay and some well to do HHs. Its proximity to the Mulago hospital, Kalewre and Bukoto markets, and location in the heart of the city are the key factors to it being densely populated. The inhabitants can access all sorts of services they would like without incurring any cost on transport. This makes it highly congested as the demand for accommodation is so high. On the other hand Centenary Zone in Wabigalo has a population of 1,030 (4.6%) people making it the least populated slum. If one moves through this slum he or she can recognize the difference compared to Katanga and the rest. This slum is diminishing gradually and it has larger geographical coverage than the rest.
25Kampala informal Settlements
4.2 Composition of the Population
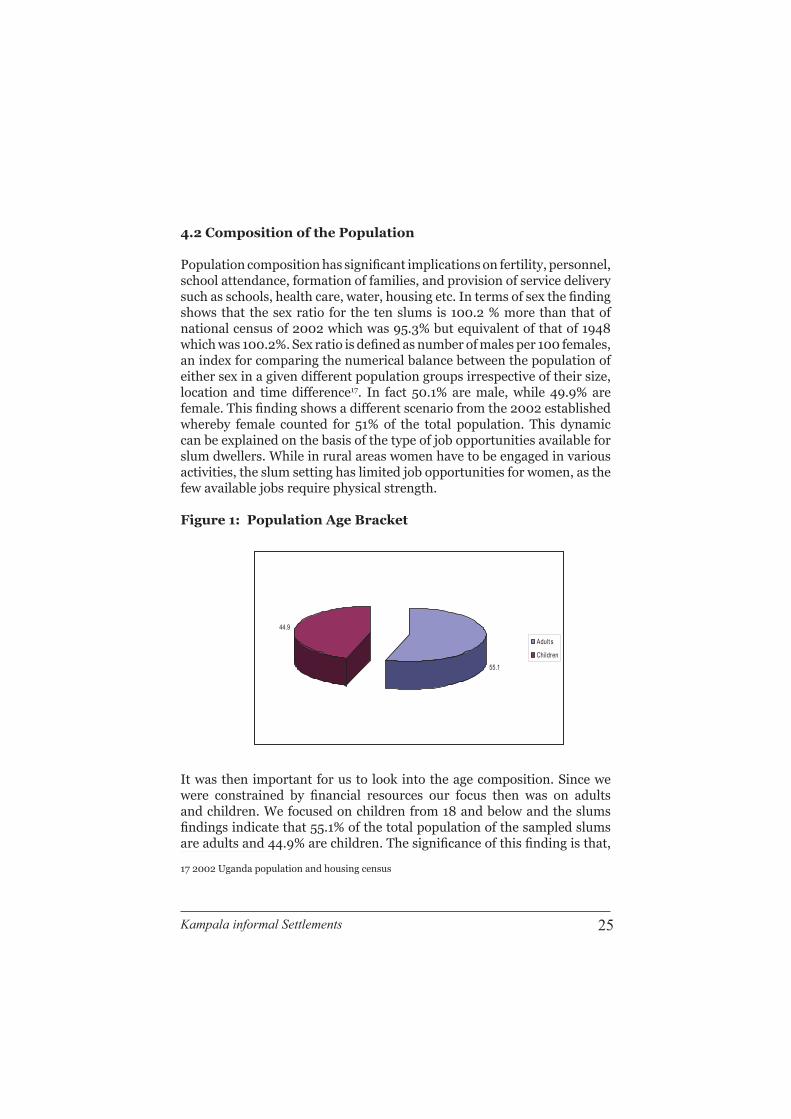
Population composition has signifi cant implications on fertility, personnel, school attendance, formation of families, and provision of service delivery such as schools, health care, water, housing etc. In terms of sex the fi nding shows that the sex ratio for the ten slums is 100.2 % more than that of national census of 2002 which was 95.3% but equivalent of that of 1948 which was 100.2%. Sex ratio is defi ned as number of males per 100 females, an index for comparing the numerical balance between the population of either sex in a given different population groups irrespective of their size, location and time difference17. In fact 50.1% are male, while 49.9% are female. This fi nding shows a different scenario from the 2002 established whereby female counted for 51% of the total population. This dynamic can be explained on the basis of the type of job opportunities available for slum dwellers. While in rural areas women have to be engaged in various activities, the slum setting has limited job opportunities for women, as the few available jobs require physical strength.
Figure 1: Population Age Bracket
55.1
44.9
Adult s
Children
It was then important for us to look into the age composition. Since we were constrained by fi nancial resources our focus then was on adults and children. We focused on children from 18 and below and the slums fi ndings indicate that 55.1% of the total population of the sampled slums are adults and 44.9% are children. The signifi cance of this fi nding is that,
17 2002 Uganda population and housing census

26 Basic Needs Basket
parents in the slum fi nd it so diffi cult to live with their children due to economic hardship. Out of the 10,052 children in these slums, 67.1% are not in school while 32.9% are in school and out of the 39.9% who are in school, 51.4% are girls.
4.3 The Capability of the slum Population
Economists prefer “optimal population”18 in a given area. However, the type of the population that inhabit these slums are far from the labour force which is required in urban centres, and for economic growth. The viable jobs in this city mostly requires skilled labour which this slum labour force is incapable of providing hence keep them out of employment opportunities. The fi ndings reveal that only 24% of the slum dwellers have regular jobs, out of which 66.5% are male, while only 33.5% are female. The regular jobs they are engaged in do not give them enough income. These jobs include; Security Guards, operating retail shops and kiosks, supermarket attendants, pump attendants, Bodaboda riders, fruit and food vending, car washing, prostitution, etc. One woman told us that she works at night. But when she was put to task to explain the kind of work she does, she openly mentioned prostitution. The rest of the population are either totally dependant especially the children and the house wives. It was estimated that 70.2% of the adult female in the slums are not working. Most of them are house wives who depend on their husbands. This has made them vulnerable to their husbands who can decide to do anything with them because they have no means of their own.
The slum dwellers have diffi culty in getting jobs due to their low level of education as established by the 2009 survey. Although one may argue that, university graduates are lacking jobs in the country as well. However, the probability of these slum dwellers getting good and well paid jobs even though job opportunities were created is Zero. It is established that 51% of the HHs heads had education only up to primary level, 30% O’level, 9% none, 6% A’level, and only 4% managed to reach tertiary. Therefore, with such levels of education, they are condemned into poverty in the contemporary highly competitive job market.
18 Optimal population is the size of population which provides a labour force that is suffi cient to
exploit the available resources in order to yield maximum output per worker.

27Kampala informal Settlements
4.5 Housing Situation
The issues of housing defi cit in Kampala slums can not be over emphasized. The survey reveals that there are 3,712 dwelling units in the ten sampled slums out of which, 32.4% are permanent, 40.8% semi permanent, and 26.8% are temporary. Over 60% of the inhabitants occupy the semi permanent and the temporary structures, because this is the type of accommodation they can afford. The cost of rental per unit (size 3ft x 4 ft) varied from Ushs 25,000-50,000 per month. One unique house rental situation was discovered in Kiwunya Tree Shadow Zone whereby some people rent a room per night at a cost of Ushs 500-1,000. This means, whenever one has the money; he can access a room for that night. In a nutshell, they sleep in a room as opposed to living a room.
The total rental cost excluding Wabigalo Centenary Zone and Kiwunya Tree shadow was estimated at Ushs 165,666,000 millions per month and the value of the buildings and the land they stand on was estimated at Ushs 12,080,405,000 billions. The fi gure for the value of the land and the buildings need to be taken with caution as most of the owners feared to be explicit. On housing ownership, 23% own the houses and the land on which the houses stand, while 77% are tenants. These slums are also located mostly in wet lands. As a result they fl ood seriously during rainy seasons. This problem is common in Banda B3, Kasanvu, Katanga, Kiwunya, kifumbira and the lower part of Kamwanyi.
Two gentlemen repairing the Some structures in Katanga roof of their house in Banda.
Congestion characterizes these slums in both the spacing between the buildings and the room spacing. Most of the structures are built in unplanned way with virtually limited spacing between them. For instance, the structures are facing each other or back to back with each other. The

28 Basic Needs Basket
spacing in these slums give no room for drainage system hence in most cases there is water logging between the buildings which become worse during rainy seasons and provide breeding grounds for mosquitoes. For these people the word compound exists only in the dictionary, and the only place where children can play is along the main roads entering into the slums which make them vulnerable to motorists and drunkards.
Further, most of the houses are predominately single-roomed, due to high demand for accommodation. And these are the houses which most of the HHs can afford. Father, mother and children occupy a room, which simultaneously serve as the dinning, storeroom, bedroom, Kitchen, among other functions. Due to inadequate space in the room, some families are forced to have their children sleep under their bed, while in more descent homes, a simple curtain separates the “master bedroom” from the children’s, which also doubles as a dinning room. Moreover, congestion in these slums wouldn’t have become such a menace if the buildings were descent and if there were infrastructures within.
29Kampala informal Settlements
5Social Services
Whereas, the previous surveys looked into the slums situations in terms of social services, it was not comprehensive enough to establish the gravity and we never covered the service providers. This survey comprehensively established the provision of water, school facilities, toilet, health facilities, drainage systems, and security as well as the service providers.
5.1 Water Supply
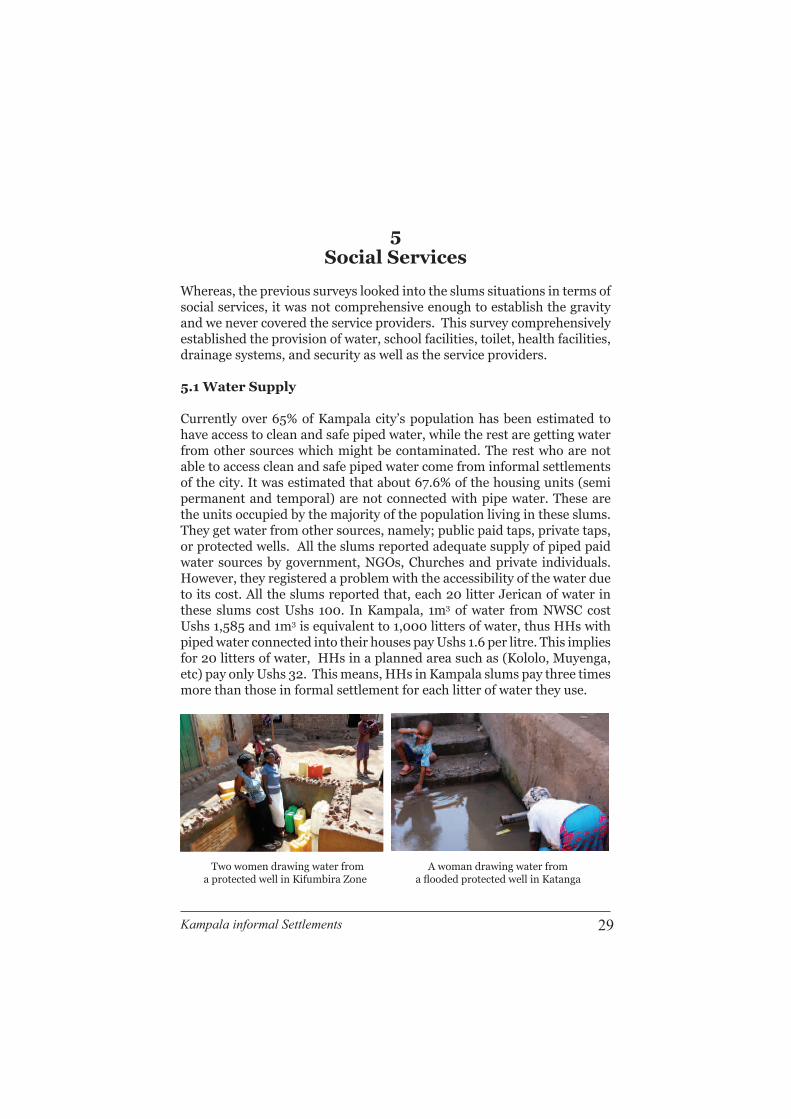
Currently over 65% of Kampala city’s population has been estimated to have access to clean and safe piped water, while the rest are getting water from other sources which might be contaminated. The rest who are not able to access clean and safe piped water come from informal settlements of the city. It was estimated that about 67.6% of the housing units (semi permanent and temporal) are not connected with pipe water. These are the units occupied by the majority of the population living in these slums. They get water from other sources, namely; public paid taps, private taps, or protected wells. All the slums reported adequate supply of piped paid water sources by government, NGOs, Churches and private individuals. However, they registered a problem with the accessibility of the water due to its cost. All the slums reported that, each 20 litter Jerican of water in these slums cost Ushs 100. In Kampala, 1m3 of water from NWSC cost Ushs 1,585 and 1m3 is equivalent to 1,000 litters of water, thus HHs with piped water connected into their houses pay Ushs 1.6 per litre. This implies for 20 litters of water, HHs in a planned area such as (Kololo, Muyenga, etc) pay only Ushs 32. This means, HHs in Kampala slums pay three times more than those in formal settlement for each litter of water they use.
Two women drawing water from A woman drawing water from a protected well in Kifumbira Zone a fl ooded protected well in Katanga

30 Basic Needs Basket
Alternatively, due to the high cost of water in these slums and coupled with low HH income, most of the slum HHs resort to drawing water from wells instead of the piped water which might be within their compound or some few meters away because they cannot afford. Some of the wells are protected and yet get contaminated with underground wastes due to pit latrines and poor sanitation in the entire slum. This situation has exposed them to water borne diseases such as dysentery, typhoid, cholera and these cases are common.
5.2 Toilet Facilities
Although latrine coverage in Kampala district stands at 85%, this does not refl ect the situation of Kampala slums. Due to the high demand for accommodation in the slums, the Land Lords have constructed houses without considering space for the construction of toilets. In fact Katanga Kimwanyi zone and Banda reported no private toilet facilities except the public paid toilets. However, Centenary Zone reported that all the HHs have access to toilet facilities, even though mostly shared. Nsambya Kamwanyi has got the greatest number (92) pit latrines. Most of the homestead toilet facilities (pit latrines or raised toilets) in the slums are dilapidated, fi lthy, shared and inadequate. Public Health Act of 1964 emphasized that every homestead should have a toilet or latrine of its own. Unfortunately, the situation in these slums is worse than rural areas. There are only 322 pit latrines in these slums. This means 99.7% of the HHs do not have toilet facilities of their own. The 2009 survey revealed the ratio of toilet facilities to HHs at 1:2519. Of course, most of the inhabitants in the slums are tenants, can not build toilets of their own, but its incumbent upon the land lords to provide them with toilet facilities. Toilet facility is a right as it directly links to the right to health.
19 The 2009 KBNB

31Kampala informal Settlements
A bathing shelter in Banda A toilet in Banda
Therefore, to address the shortage of toilet facilities in these slums, there are initiatives taken by the Churches, NGOs, and the Communities to provide public paid toilets to the residents. The residents pay Ushs 100 or 200 depending on the purpose of each visit. For short call (commonly known as No.1) one pays Ushs 100, while a visit for long call (commonly known as No.2) costs Ushs 200. Consequently, due to the fact that some of the residents cannot afford to pay for the toilet visits, the sight of human waste in the corners of the congested structures, in garbage collection spots, drainage systems, incomplete structures, are common. The practice of “fl ying toilets”20 is also common. This is common in Kamwokya Kifumbira near Nsomba drainage, Makerere Kivulu, Banda and Kiwunya Tree Shadow zone. The toilet problem is so grave in some of the slums. It has been the cause for cholera out breaks in the slums. Again the use of pit latrines in these slums has got a negative effect on the underground water they use from the wells as cases of water borne diseases are common in their midst. Banda B3 LC I chairman requested our organization to at least construct a public paid toilet for his people, because the two public paid toilets do not adequately serve his people.
5.3 Health Facilities
Generally, all the slums have health facilities within and nearby. At least in all the slums there are either clinics or drug shops where people get medication. Again there are several health facilities both private and public within Kampala city which are in affordable distance from the slums. The farthest slum from the city centre is 3Km, namely Banda B 3. Katanga Slum
20 Flying toilets refer to a practice of passing out human waste into temporary storage (polythene papers) and at an opportune time the polythene and its contents thrown away in the air.

32 Basic Needs Basket
is just a stone throw away from Mulogo hospital which is a national referral hospital. Kasanvu and Centenary zone are near Kampala International Hospital (KIH) and Kibuli hospital. Kamwanyi is near Nsambya and Kibuli hospitals. Kalerwe, Kifumbira and Kivulu are all near Mulago Hospital. The availability and proximity of good health facilities for the slums dwellers is not the question. The question is the ability to access the services in the available health facilities. Most of the slum dwellers fl ock Mulago Hospital to get free medical care. “My son, you see we have KIH next door here, the best in Uganda I am told, but can I go even near the gate, it’s only for the rich. We have to go all the way through the town to Mulago”, a woman in Kasavu slum lamented. “A part from that we have Kibuli, Nsambya Hospital and others which are even nearer but where do we get the type of money they charge”, she added.
The costs for treatment even from the clinics within the slums is double that of their rural counterparts. For instance, ten tablets of parnadol cost Ushs 100 in the rural areas, while in the slums the same amount buys only 5 tablets. They complained of frequent sicknesses which take a lot of their earnings. Though they thanked the government for free medical services in Mulago Hospital, they expressed disappointment with the lack of drugs in Mulago hospital. “Whenever we go to Mulago we are referred to buy the drugs from clinics”, a Katanga resident complained. Therefore, in circumstances where they are not able to get money to get treatment, they resort to traditional clinics. No wonder there are many traditional clinics in the slums.
5.4 School Facilities
The Millennium Development Goals, number 2 aims at achieving universal primary education. Having envisaged that education is a key to development and in a bid to implement the MGD goal number 7 Uganda government adopted the policy of Universal Primary and Secondary Education (UPE and USE). Therefore to establish the contribution of this policy and others in enhancing education as a strategy to develop slum dwellers the accessibility and proximity of education was sought. All the slums, except Kalerwe Benisa Zone reported having a nursery school with Katanga having 4 the highest, followed by Kasanvu, kifumbira, Centenary Zone and Kamwanyi having two each, and the rest had 1 each. On primary schools, only Kasanvu and Kivulu did not have any. Only Katanga has government primary schools, while for secondary schools Tree Shadow Zone and Makerere Kivulu have one each. The slums don’t have government primary and nursery schools nearby.

33Kampala informal Settlements
Girl Child fetching water instead Children in Katanga whose parents of being in School. lack school fees playing at home.
HHHs complained of education taking most of their income in terms of: school fees, transport for the children, food, uniform, and stationary as they go to private schools. According to the 2008 survey education takes up to 22 % of the HH expenditures. They also lamented of taking their children to private schools which don’t perform well because they cannot afford primary schools which are doing well due to the high school fees. We have green hill Academy here, but how can I take my child there when the school fees per term is Ushs 600,000 more than my 3 months income, Mr. Opulot. They also lamented the poor performance of their children as they cannot compete with children of the rich who go to good nursery, primary and secondary schools and eventually join university on Government sponsorship. Considering the S.I cut off points 2011, for boys was 5- 8 and girls 5-9 for the top 30 schools. This means if these children do not attain the grade required they will remain in the slums as their parents, wallowing in vicious circle of poverty.
5.5 Solid Waste Management
Uncontrolled dumping, stock pilling and ineffi ciency characterize solid waste management in Kampala City. Administratively, at the time this study was conducted, the management of the city was entirely on Kampala City Council (KCC) rather than the Central Government. In this respect the city council authorities are mandated to plan for development, collect taxes and raise other revenues for the maintenance of the city, including Solid Waste Management (SWM). However, this mandate as per Kampala city is wanting. According to the Auditor General Report of March 2010 on solid waste management in Kampala, out of 1,200-1,500 tonnes of garbage estimated to be generated in Kampala per day only 400-500 tones

34 Basic Needs Basket
are collected per day21. This implies that 60% of the garbage gathered daily is not collected and disposed off. The ten slums visited are littered with all sorts of solid waste, namely; plastic material, waste from food stuff and metallic materials. The residents asserted that there are sometimes when the KCC trucks as well as private contracted trucks come in to their rescue but at a cost starting from Ushs 300, depending on the size of the garbage. But most of them are not able to meet the cost for garbage collection.
Pile of Garbage in Banda A Drainage System in Kiwunya
The dumping areas in the slums include; open places within residential areas, drainage systems, open places along the roadsides, and wetland within the slums. The slum dwellers are ignorant of the best way to manage the waste, as there is little initiative to take collective action. The presence of this uncontrolled garbage all over the slums puts the lives of all inhabitants at a risk of environmental and health related problems such as diseases and air pollution in form of offensive smell. Katanga and Kivulu reported cases of cholera, while Kamwanyi, Kasanvu and Banda reported cases of trachoma. All the slums are characterized by: air pollution, chocking smell, fl ooding due to blockages in the drainage systems, breakage of sewage system, and environmental degradation especially where plastic bags and bottles are disposed. The residents of Kasanvu Zone complained of Nakivubo channel which passes through the area and fl oods most of the times affecting the homes nearby and causing malaria and diarrhoea. The Auditor General’s report attributed the ineffectiveness of SWM to inadequate number of garbage collector vehicles, poor law enforcement by the city authority and lack of awareness by the public22.
21 Auditor General Report, 201022 Ibid

35Kampala informal Settlements
5.6 Security
Although almost all the slums reported the existence of a police station nearby except for Centenary Zone and Tree shadow zone, the levels of crimes are also high in these slums. This emanates from the fact that all categories of people (bad and good) inhabit these slums. The slums reported having people coming from districts all over the country, with the aim of trying to get greener pastures. However, on arrival in the city, the life becomes so diffi cult due to lack of job opportunities and yet they have to pay for every thing they need. Consequently, they end up in slums where they have cheaper accommodation and feeding. Due to frustration, some end up in drug abuse and committing all sorts of crime in order to survive. The LCs reported handling a number of crimes ranging from; theft, assault, sexually related crimes, robbery, child related offences, homicides, narcotics and others. The leading type of crime in the ten slums is theft, followed by drug abuse.

36 Basic Needs Basket
6Programs and Policy Implications
The welfare of the 22,391 people in the ten studied Kampala slums and those in other slums that are without adequate shelter and basic services depends on the combined efforts of all partners, government, local authorities, parliamentarians, non- governmental organizations and the private sector. If stakeholders come together, living conditions of the inhabitants of Kampala slums can be improved. However, improving the living conditions of those already in the slums is not a solution to slum emergence, existence and situation, but rather addressing the cause of the phenomenon. Kampala slums are said to have developed to a grater extent as a result of rural urban migration. Therefore, it is imperative that the harsh living conditions of our villages become attractive and habitable to curb the problem of rural urban migration.
6.1 Overview of Kampala Slums
Due to poor economic status, the living condition of the Kampala slum dwellers is characterized by the following:
Poverty: some of the slum dwellers go without or skip some meals be cause they cannot afford.
Tiny housing units: most HHs can afford only one room which is used as bedroom, kitchen, store, sitting room, and dining.
Water born diseases: due to high cost of tap water, they resort to underground protected well which are even highly contaminated.
Shortage of toilets: most of the land lords prefer to build houses with out toilet due lack of space and high demand for accommodation. Some don’t build because it’s costly to build toilets in water logged areas. Hence the tenants resort to using fl ying toilets.
Diseases: due to many water-logged areas and clogged drainage sys- tems which provide mosquitoes’ breeding grounds, they are frequently
sick of malaria. Shortage of medical supplies: they experience shortage of medical sup
plies in government health centres due to high population and regular disease outbreaks in their midst.
Mobility of the residents: its hard to target them by the service provid- ers as they are highly mobile.
Children vulnerability: due to congestion and lack of space the children are prone to abuse, accidents, and expose to all sorts of bad

37Kampala informal Settlements
mannerism. Unemployment: majority of them are unskilled, and thus not able to
secure well paying jobs. Low level of education: majority of the children are not able obtain
higher levels of education as the parents cannot raise money to send them to good schools nor meet scholastic materials in UPE and USE schools.
Poor solid waste management: due to lack of specifi c areas for dump ing garbage and poor disposal methods, people dump garbage in trenches and open spaces.
Flooding: as a result of dumping garbage in drainage systems, building in wetland and congestion, the slums are always fl ooded during rainy seasons.
Poor hygiene: congestion and lack of toilets force some residents to empty their waste into trenches when it rains making them vulnerable to poor hygiene related diseases such as cholera and dysentery.
Poor road: the roads within the slums are not tarmacked and are al ways diffi cult to use when it rains.
No saving: it’s diffi cult for them to save as their income is low and they must meet the cost of basic needs such rent and food if they are to con tinue living in urban setting.
Air pollution: due to poor SWM the slums have got offensive smell Insecurity: due frustration and drug abuse crime such as assault, theft,
rape, child abuse, and murder are common.
6.2 Immediate Solutions
These include addressing problems related to: population, poverty, housing, water, education, sanitation, health, garbage, and security. In addressing the existing appalling situation of Kampala slum dwellers, government and development partners need to be practical and concrete. As already established, there are issues which require immediate response and are feasible given the political will to do so.
Establishment of data base on the slum population. There is no statistic on the population which inhabits and those who migrate to Kampala slums which affects government planning and implementation of programs aimed at improving their living conditions. Their weight is only felt by the growing number of slums. Therefore, there is need for the government through the LCs systems to have a data base on the number of people living in slums, those who have newly migrated and those who exited from

38 Basic Needs Basket
them. To that effect, LCs on a regular basis should be tasked to provide the government and development partners with information on the number of people living in slums under their jurisdiction. No adequate intervention can be made without ascertaining their population to that effect.
Identifi cation of particulars of those who live in slums. In the midst of global terrorism, it is imperative that the particulars of those who dwell in these informal settlements are established to avoid unscrupulous people from carry out mischief. The economic setback from terrorist act is great and slums have ever provided leeway for the perpetrators. Of course, the security and vulnerability of the slum children can not be overstated. Identity of wrong doers will provide peace and security in the informal settlement. Human beings need security and it is only when there is security that one can invest and develop.
Supporting credit group services. Since micro-fi nance institutions do not favour urban poor, Kampala slum dwellers have come out with saving and credit services such as rotating credit services and saving groups based on social ties and social capital. The purpose of these credit services and saving groups is to lend money as a revolving fund mechanism, mainly to boost small scale businesses, build houses, pay school fees, and meet other basic needs. Therefore, there is need for government and development partners to support such initiatives through building and boosting their capacity to manage and lend respectively.
Enforcement of the law on Solid Waste Management. It was established that SWM both in slums and within the city is a big problem, which manifest poor enforcement of the law on SWM by the city authority and lack of awareness by the public about the law. There is need for enforcing Solid Waste Management Ordinance 2000. Under the ordinance, it is illegal and punishable to dump garbage in places where it may become a public nuisance23. Similarly, there is need to educate and encourage the slum dwellers to take collective responsibility. These remedies are cost effective compared to the cost of garbage collection and treatment of diseases that result from poor SWM.
Gazetting garbage collection points. There is need for gazetting disposal points where skips are placed and emptied regularly. Since there are some private companies that render services of garbage collection, a
23 Solid waste Management Ordinance, 2000
39Kampala informal Settlements
specifi c schedule on when to collect the garbage should be formulated and followed. However, given the fact that slum dwellers can not afford to pay for the cost of garbage collection, government and development partners should fi nance the collection of the garbage from the gazetted areas.
Increasing community awareness and accountability about sanitation. The slum dwellers are ignorant of the best way to manage waste, as there is little initiative to take collective action. It is important therefore to have programs that create awareness among the slums dwellers collective responsibility with regard to solid waster management. This can be either done through the media (radio and TV) which the community members have access to, and open campaign on the subject. Further, LCI in each zone should also be tasked with the responsibility to promote collective action on solid waste management.
Provision of affordable clean water to slum dwellers. It’s unfortunate, that despite their pathetic living condition, the slum dwellers pay three times for a litre of water as compared to those who live in formal settlements. There is need for the government and other development partners to supply the slum dwellers with affordable clean water to save them from constraining their already meagre resources. This will reduce the cases of water borne diseases rampant in the slums as a result of consuming contaminated under ground water from the protected springs.
Provision of public adequate toilet facilities. The way the slum houses are constructed does not provide space for toilet facilities for each HH. Most of the existing toilets are shared and indeed some of the HHs lack toilets. The remedy to this is the provision of public toilets along side setting laws that forbids construction of houses without toilet provision. So long as people continue to eat, they will need to visit toilets. Therefore, it is imperative that each house constructed must have a toilet for the inhabitants. This will curb the out break of cholera common during rainy seasons in the slums. There is also need to enforce the Public Health Act of 1964 that requires every homestead to have a toilet or latrine of its own.
Construction of low cost houses. The government should come out with low cost houses which will enable the slum dwellers live in decent houses. It is estimated that Kampala is having a house defi cit of about 100,000 units24. Unless government comes up with strategy to deliberately address
24 Daily Monitor Tuesday, July 5, 2011 pg 20
40 Basic Needs Basket
this defi cit, living in a decent house for most slum dwellers remains a camera. Construction of low cost houses will greatly improve on the living conditions of the slum dwellers.
Harmonizing the land tenure system in Kampala. The complexity of the land tenure system in Kampala does not permit the KCC to carry out developmental programs easily. There is need for harmonizing the land tenure system in Kampala, to eliminate the stall structure form and to have KCC capacity to develop some of the land in these slums. Similarly, there is need for the government to purchase mailo land to provide residents with land rights. There are some slum dwellers capable of developing the land they live on, but lack the land right. They fear to invest on such land, as they can be evicted at any moment.
Provision of affordable education facilities. As one of the causes of poverty in the slums is low levels of education. Government policy and programs should be designed to specifi cally favour the education of slum children. Most of the slums lack primary and secondary schools near by despite government effort to promote UPE and USE. The children who live in the slums can not afford to go to these schools due to the cost implications related to transport and scholastic material. There should be a deliberated effort by government and development partners program and policy targeting slum children.
Provision of health facilities. Accessing good health services is most desirable in slums where congestion, poor sanitation and poor hygiene culminate into diseases. Most of the Kampala slum dwellers can not afford services from the private health service providers; government should set up health centres in the slums to meet this need.
6.3 Sustainable Solutions
It should be noted that improving the living conditions of the slum dwellers is not a permanent solution to the slum situation. On the contrary, it can easily compound slum situation as many more people will be attracted to come and dwell in urban setting. The solution to Kampala slum situation is in averting rural urban migration which is the major cause for the growth of these slums. The study on food security by the Centre June 2010 revealed that most youth in North and North Eastern Uganda are moving away from the rural setting to urban centres in such of better living, abandoning agriculture (farming) for the old and women. Therefore, there is high need for averting this trend of event.
41Kampala informal Settlements
Provision of adequate social amenities in rural areas. The 2009 survey revealed that the growth of Kampala slum population is caused by rural urban migration. Poverty, lack of employment, confl icts, lack of social services, etc. in the rural areas force most youth to seek better life in urban centres. As they reach the city, with limited job opportunities, they are forced to engage in petty jobs such as; car washing, food vending, sale of second hand clothes, boda boda riding, fruit vending on the streets, water vending, guarding, prostitution, causal labour, etc. These jobs earn them low income, thus they are conditioned to live in slums where they can afford rent and food. Therefore, there is need for the government and development partners to ensure incentives are provided for the rural population to remain in their villages. These incentive include, job opportunities, good schools, electricity, good health facilities, agricultural incentives, recreational facilities, market, support for credit services, etc.
Introduction of and encouraging micro savings: As most slum dwellers do not save due to low income coupled with high rate charges by commercial banks, micro savings will go along way in solving problems of housing, education, health, etc. Micro savings plans encourages saving for education or other future investment. Those who invest in these plans are better prepared to cope with any unforeseen expenses, which would usually harm lower income families or individuals. Micro saving consisting of a small deposit account offered to lower income families or individuals as an incentive to keep funds for future use. The minimum balance requirements are often waived or very low, allowing users to save small amounts of money and not be charged for the service. Therefore, slum dwellers must be encouraged to save for their basic needs (housing, education, health and food). Government can not provide good; housing, education, health care and food for every body. The solution lies in the hand of the people.
Introduction of fee on returned used plastic mineral water bottles and polythene bags commonly known as “Kavera”. The slums and the city as well as drainage systems are chocked with used mineral water bottles and polythene bags because there is no monetary value to that effect. Collection centres should be created where these used up products are taken and recycled, and people are paid for returning them. The fee for the returned used plastic mineral water bottles and Kavera should be refl ected in the cost of the mineral water and Kavara bought by the consumers. Of course the computed cost should be authentic, not to exploit the consumers. In doing this, the sight of plastic bottles and Kavera in the drainage systems and place will become the things of the past.

42 Basic Needs Basket
Developing urban land before allowing poor people settle in. In solidarity with the poor, the government should develop land in urban areas before allowing poor people to settle in. Like in some areas in South Africa, under the Reconstruction and Development Programme (RDP) 1994-2000, apart from building low cost houses, the government developed land before allowing the poor people to set up small houses that meet the set standard. This then require the government to harmonize the land tenure system in Kampala which frustrated all efforts by KCC to improve the standards of living in the slums. KCC cannot determine what should be done on the land in these slums as they are privately owned. Secondly, the land Act prohibits KCC from evicting people who have lived in the slums for 12 years.
Setting up a minimum standard for those intending to live in the city or urban centres. Slums can not emerge or exist when there are laws and policies to prevent its development. The poor should be allowed to work in the capital but live out of the city. What needs to be done is that they are provided with reliable transport back to their homes. This may look too radical, but serves as a necessary condition for safeguarding against people coming to urban centres with no possibility of fi nding a source of living and thus living in life threatening conditions. There should be laws governing the standard for living in the city. Of course, by all standards the houses near the city centre are more costly than houses which are far. Those who live far from the city have spacious and environmentally good homes.

43Kampala informal Settlements
Bibliography
Chambers, R. Rural Development, Putting the Last First, Longman, 1983
Uganda Bureau of Statistics, 2010 Statistical Abstract
Daily Monitor, Tuesday, July 5, 2011 pg 20
Habitat Backgrounder: A voice for the voiceless. Website:www.unchs.org
UN-Habitat global report 2010
John Paul II Justice and Peace Centre 2009. The Plight of the Urban poor and yet Increased Rural-Urban Migration. A Socio-economic Analysis in ten informal settlement of Kampala.
Ministry of lands, housing and urban development 2008. National Slum Upgrading Strategy and Action Plan
Quarterly economic report on the state of the Ugandan economy - February, 2010
The Auditor Generals value for money audit report of March 2010 on solid waste management in Kampala
The national Report on the Istanbul Declaration, 2001, pg 17
The Uganda National House Survey 1999
Uganda population and housing census 2002
Uganda Population and Housing census 2002
UN-HABITAT and Kampala City Council 2006. Cities without Slums Sub-regional Programme for Eastern and Southern Africa. Situation analysis report and action plan for Kampala city council

44 Basic Needs Basket
Appendix
App 1: Public Water Sources
Slums Tap Water
Sources
Service Provider
Protected well
Service Provider
Katanga Kamwanyi
18 15 Gov’t & 3 Private
3 Community
Namwongo Kasanvu
2 Gov’t & Private 2 KCC & Church of Uganda
Kamwokya Kifumbira
20 Private 3 1 Community & 2 NGO
Banda B 3 7 Private & NGOs
1 Community & NGO
Namwongo Centenary Zone
20 Private
Kiwunya Tree Shadow Zone
20 Gov’t, NGO & CIDI
1 Church & Community
Makerere Kivulu 46 Private & CIDI
Nsambya Kamwanyi
12 CIDI & Private 2
Kalerwe Besina Zone
10 Private & Save the children
Bwaise Lufula zone
30 Private & CIDI

45Kampala informal Settlements
App 2: Toilet Facilities
Slums VIP Public Paid
Toilets
Service Provider
Pit Latrines
Service Provider
Katanga Kimwanyi 5 4 CoU and 1 Private
Namwongo Kasanvu 3 FG, KH & NACODO
10 Private
Kamwokya Kifumbira 5 KCC & NGOs 45 Private
Banda B 3 2 Community
Namwongo Centenary Zone
50 Private
Kiwunya Tree Shadow Zone
6 AEE and CIDI 10 Private
Makerere Kivulu 6 40 Private
Nsambya Kamwanyi 92 Private
Kalerwe Besina Zone 4 SC and Amref 30 Private
Bwaise Lufula zone 2 Sc and Amref 45 Private
CoU Church of Uganda, FG French Government, KH Kibuli Hospital, African Evangelist Enterprises, CODI Community integrated Development Initiative, SC Save the Children,

46 Basic Needs Basket
App 3: Health Facilities
Slums Hospitals Clinics Traditional Clinics
Drug shops
Katanga Kimwanyi
1Mulago (Gov’t)
10 private 6 1 Private
Namwongo Kasanvu
1 KIH (Private)
2 Private 2 1 Private
Kamwokya Kifumbira
15 Private 3 Private
Banda B 3 4 Private 15 1 Private
Namwongo Centenary Zone
2 Private 1
Kiwunya Tree Shadow Zone
1 KADIC 5 4 Private
Makerere Kivulu
2 Private 10 1 Private
Nsambya Kamwanyi
1 4 Private
Kalerwe Besina Zone
4 Private
Bwaise Lufula zone
5 Private 1 5 Private

47Kampala informal Settlements
App 4: Education Facility
Slums Nursery Primary Secondary Vocational
Katanga Kimwanyi
4 Private 1 Gov’t 1 Private
Namwongo Kasanvu
2 Private
Kamwokya Kifumbira
2 private 2 Private
Banda B 3 1 Private 1 Private
Namwongo Centenary Zone
2 Private 2 Private
Kiwunya Tree Shadow Zone
1 catholic 1 catholic 1 catholic
Makerere Kivulu
1 Private 1 Private
Nsambya Kamwanyi
2 Private 2 Private
Kalerwe Besina Zone
2 World Vision
Bwaise Lufula zone
1 Private 2 Private

48 Basic Needs Basket
App 5: Types of Houses
Slums Permanent Semi Permanent
Temporary Total
Tree shadow Zone 9
152 119 16 287
Makerere Kivulu 1 20 77 45 142
Bwaise Kifumbira Zone
193 84 47 324
Wabigalo Centenary Zone
19 70 27 116
Nsamby Kamwanyi
112 147 24 283
Banda Zone B3 98 179 165 442
Namwongo Kasanvu Zone
139 87 138 364
Katanga Kimwanyi
280 634 371 1285
Kalerwe Sabina Zone
75 71 120 266
Bwaise Lufula Zone
115 45 43 203
Total 1203 1513 996 3712
![GW 1# ;] - Kampala](https://static.fdocuments.us/doc/165x107/620e40353090141c8a298df6/gw-1-kampala.jpg)