Livestock Farm Monitor Project - Home | Agriculture Victoria
63
2018-19 Victoria | Annual Report
Transcript of Livestock Farm Monitor Project - Home | Agriculture Victoria

2018-19Victoria | Annual Report

1 Livestock Farm Monitor Project | Victoria 2017-18
Acknowledgements
Authorised and published by the Victorian Government, Department of Jobs, Precincts and Regions 2019.
© The State of Victoria Department of Jobs, Precincts and Regions 2019.
This publication is copyright. No part may be reproduced by any process except in accordance with the provisions of the Copyright Act 1968.
For more information contact the DJPR Customer Service Centre 136 186
ISSN 2205-8214 (print)
ISSN 2205-8214 (online)
Disclaimer
This publication may be of assistance to you, but the State of Victoria and its employees do not guarantee that the publication is without flaw of any kind or is wholly appropriate for your particular purposes and therefore disclaims all liability for any error, loss or other consequence which may arise from you relying on any information in this publication.
Accessibility
If you would like to receive this publication in an accessible format, such as large print or audio, please telephone 136 186.
Deaf, hearing impaired or speech impaired? Call us via the National Relay Service on 133 677 or visit www. relayservice.com.au
This document is also available in PDF format on the internet at: agriculture.vic.gov.au/livestockfarmmonitor
Participant farmers are gratefully acknowledged for their cooperation, patience and goodwill to willingly supply their farm data, for either the first time or over many years. This report has been funded by Agriculture Victoria.
The diligent work of Agriculture Victoria staff who gathered the final performance data deserve thanks, especially Claire Waterman, Olive Montecillo, Tristan Wardley, Natalie Nelson and Meat and Wool Services Staff, who continued to be actively involved in the report through to its publication.
The project was also made possible this year through the contributions of Lee Beattie, Graham Lean, Norm Tozer and Paul Blackshaw who collected farm data, in addition to data collected by Agriculture Victoria staff, and provided feedback and validation to ensure its accuracy.
Cover photos were provided by Tom Broadhurst at Long Walk Films.
Further information regarding the Livestock Farm Monitor Project may be obtained from:
Sam Henty Agriculture Victoria PO Box 3100, Bendigo DC, Victoria 3400 [email protected]
To find out the latest information on the project, visit the project website at: agriculture.vic.gov.au/livestockfarmmonitor

Livestock Farm Monitor Project | Victoria 2018 -19 2
Contents
List of Figures
List of Tables
About the Report
State summary Commodity Price Overview
South West
Northern Victoria
Gippsland
Appendices South West Victoria appendix tables
Northern Victoria appendix tables
Gippsland appendix tables
Glossary
List of abbreviations
Standard values
3
3
4
510
13
16
19
2223
37
49
59
60
60

3 Livestock Farm Monitor Project | Victoria 2018 -19
Figure 1 Profit Map
Figure 2 Livestock Farm Monitor Project Farm Locations And 2018-19 Annual Rainfall Deciles
Figure 3 2018-19 Modelled Total Cumulative Pasture Growth (Per Cent Of Average)
Figure 4 Regional Enterprise Mix
Figure 5 Regional Quarterly Sales Of Prime Lambs
Figure 6 Regional Quarterly Sales Of Fine Wool
Figure 7 Regional Quarterly Sales Of 1-2-Year-Old Steers
Figure 8 State Distribution Of Farm Size
Figure 9 Average Earnings Before Interest And Tax ($/Ha)
Figure 10 State Distribution Of Farms By Return On Assets And Return On Equity
Figure 11 State Average Return On Assets And Return On Equity
Figure 12 Southern 19- And 21- Micron Wool Prices
Figure 13 Quarterly Prices For Southern 19-Micron Wool
Figure 14 Southern 28- And 32-Micron Wool Prices
Figure 15 Quarterly Prices For Victorian Heavy Trade Lamb
Figure 16 Victorian Trade Steer Prices
Figure 17 Quarterly Prices For Victorian Saleyard Trade Steers
Figure 18 Intra-Annual Price Variability
Figure 19 Quarterly Prices For Victorian Wheat Grain (Delivered On-Farm)
Figure 20 Quarterly Prices For Victorian Cereal Hay (Delivered On-Farm)
Figure 21 South West Earnings Before Interest And Tax ($/Ha)
Figure 22 South West Net Farm Income
Figure 23 South West Return On Assets (%)
Figure 24 South West Return On Equity (%)
Figure 25 Distribution Of South West Farms By Change In Debt
Figure 26 South West Earnings Before Interest And Tax History ($/Ha)
Figure 27 South West Return On Assets And Return On Equity History (%)
Figure 28 Northern Earnings Before Interest And Tax ($/Ha)
Figure 29 Northern Net Farm Income
Figure 30 Northern Return On Assets
Figure 31 Northern Return On Equity
Figure 32 Distribution Of Northern Farms By Change In Debt
Figure 33 Northern Earnings Before Interest And Tax History
Figure 34 Northern Return On Assets And Return On Equity History
Figure 35 Gippsland Earnings Before Interest And Tax ($/Ha)
Figure 36 Gippsland Net Farm Income
Figure 37 Gippsland Return On Assets
Figure 38 Gippsland Return On Equity
Figure 39 Distribution Of Gippsland Farms By Change In Debt
Figure 40 Gippsland Earnings Before Interest And Tax History
Figure 41 Gippsland Return On Assets And Return On Equity History
Table 1 State Physical Data Summary
Table 2 Number Of Specialist And Mixed Farms
Table 3 State Farm Financial Summary
Table 4 State Average Financial Summary 2009-2019
Table 5 South West Whole Farm Physical Summary
Table 6 South West Whole Farm Enterprise Mix
Table 7 South West Whole Farm Financial Summary
Table 8 South West Enterprise Summary
Table 9 Northern Whole Farm Physical Summary
Table 10 Northern Whole Farm Enterprise Mix
Table 11 Northern Whole Farm Financial Summary
Table 12 Northern Enterprise Summary
Table 13 Gippsland Whole Farm Physical Summary
Table 14 Gippsland Whole Farm Enterprise Mix
Table 15 Gippsland Whole Farm Financial Summary
Table 16 Gippsland Enterprise Summary
List of Figures List of Tables
Livestock Farm Monitor Project | Victoria 2018 -19 4
About the report
The Victorian Livestock Farm Monitor Project (LFMP) estimates the economic performance of surveyed sheep and cattle farms by collecting detailed physical and financial farm information.
Principles used to generate the economic performance measures in this report are based on farm management economics and are consistent with previous LFMP reports (Figure 1). The four key farm business performance indicators used in this report are: Earnings Before Interest and Tax (EBIT), Net Farm Income (NFI), Return on Equity
(RoE) and Return on Assets (RoA). These indicators provide information about the profitability and efficiency of the farming business. Figure 1 illustrates how the performance indicators are calculated and the Glossary contains definitions of key terms.
This year, 72 farms participated. Care is needed when comparing results between years and regions. Results published in this report should not be taken to represent the average of the population because farms were not selected for statistical significance.
FIGURE 1. PROFIT MAP
Crop incomeWool income
Lamb income
Cattle income
Hay income
Other farm income
Wool sales, sheep and lamb salesWool and livestock inventory change
Total livestock income Other farm income
Lamb sales, wool and sheep salesWool and livestock inventory change
Cattle sales Cattle inventory change
Crop salesGrain inventory change
Feed inventory change
All other farm income
Gross farm income
Gross margin
Net farm incomeAssets leased
Assets owned
Assets managed
Return on equityReturn on assets
Equity Liabilities
Interest and lease costs
Depreciation
Cash overheads
Animal health
Supplementary feed
All other variable costs
Earnings before interest and tax (EBIT)
Imputed operators'allowance for labour
and management
Overheads
Variable Costs
1 Profit map adapted from Queensland Dairy Accounting Scheme - 2010, with permission from Ray Murphy, Department of Agriculture, Forestry and Fisheries, Queensland.

5 Livestock Farm Monitor Project | Victoria 2018 -19
The annual Livestock Farm Monitor (LFM) survey of 72 Victorian sheep and beef enterprises has been completed for 2018-19. Results show it was a challenging year for sheep and beef farms, particularly those located in Gippsland and Northern Victoria. Below average rainfall across most of the state reduced pasture availability, increased the reliance on supplementary feed, and contributed to higher feed costs. On average, farm profits decreased in 2018-19 compared to the previous year with mixed performance across the regions. Many surveyed farms in Gippsland and Northern Victoria de-stocked to reduce feed costs and ease cashflow deficits while farms in the South West maintained stock numbers and production.
State summary
The physical and financial data from 72 sheep and cattle farms across three regions in Victoria were analysed for economic performance in the 2018-19 year. Participant farms were located in the South West, Northern and Gippsland areas (Figure 2).
In 2018-19, annual rainfall was below average for most of Victoria. Spring 2018 rainfall was generally below average and a dry 12 months leading into summer meant that
feed on offer was reduced across much of the state. Although the 2019 autumn break provided some reprieve to soil moisture conditions, significant areas of the state remained dry. Figure 3 shows annual pasture growth in 2018-19 was average to extremely low compared to historical records. This reduced the ability of many participant farm businesses, specifically in Northern and Gippsland areas, to graze and conserve feed.
Statewide Overview
FIGURE 2. LIVESTOCK FARM MONITOR PROJECT FARM LOCATIONS AND 2018-19 ANNUAL RAINFALL DECILES
FIGURE 3. 2018-19 MODELLED TOTAL CUMULATIVE PASTURE GROWTH (PER CENT OF AVERAGE)
Gippsland Livestock Farm Monitor Project Site
North Livestock Monitor Project Site
South West Livestock Farm Monitor Project Site
Towns / Cities
Rainfall Decile Ranges
Highest on recordVery much above recordAbove averageAverageBelow averageVery much below averageLowest on record
HORSHAM
TRARALGONBAIRNSDALE
WANGARATTA
WODONGA
SHEPPARTON
BENDIGO
PORTLANDWARNAMBOOL
MILDURA
SWAN HILL
GEELONG
HAMILTON MELBOURNE
Pasture Growth Percentile
Extremely highWell below averageAbove averageAverageBelow averageWell below averageExtremely low
Lakes
SOURCE: BOM SOURCE: QDAF

Livestock Farm Monitor Project | Victoria 2018 -19 6
Physical measures
FIGURE 4. REGIONAL ENTERPRISE MIX
Farms that participated in the project represented a variety of different sizes and enterprise mixes. Figure 4 shows the regional enterprise mix of participant farms, including farms with hay/cropping operations. The dominant enterprise in the South West was prime lamb, representing 48 per cent of the regional sample. Beef enterprises were the most common in Gippsland (62 per cent) and Northern Victoria (47 per cent).
Of the 72 farms in the project, 30 farms (42 per cent) were mixed sheep and cattle enterprises; 23 farms (32 per cent) were specialist sheep farms and 19 farms (26 per cent) ran only sheep (Table 2).
South West Northern Gippsland
Pro
po
rtio
n o
f fa
rms
0%
30%
20%
10%
40%
50%
60%
100%
80%
90%
70%
Wool Prime Lamb Beef Hay/Cropping
On average, participant farms across Victoria managed 876 ha (Table 1). Participants in the South West region had larger holdings, averaging 1,064 ha. Gippsland (703 ha) and Northern Victoria (820 ha) were closer to the statewide average. Stocking rate was 15 Dry Sheep Equivalent (DSE) per hectare (DSE/ha), on average across the state, with participants in Northern Victoria recording the lowest average stocking rate of 10 DSE/ha. Gippsland and the South West had similar stocking rates of 18 and 17 DSE/ha, respectively.
The area of land allocated to pasture hay and silage production varied significantly across surveyed farms. On average, 19 ha of pasture hay and 14 ha of silage was cut (Table 1). Participants in Gippsland and Northern Victoria utilised less area for pasture hay and silage and had a higher proportion of farms that did not conserve feed (Appendix Tables 13 for each region).
TABLE 1. STATE PHYSICAL DATA SUMMARY
TABLE 2. NUMBER OF SPECIALIST AND MIXED FARMS
Specialist farmsMixed sheep
and cattle
Sheep Beef cattle
South West 11 1 14
Northern 8 10 8
Gippsland 4 8 8
State 23 19 30
Statewide South West Northern Gippsland
Number of farms in sample (total) 72 26 26 20
Average 2018-19 rainfall (mm) 576 571 525 648
Average Stocking rate (DSE/ha) 15 17 10 18
Average Effective area (ha) 876 1,064 820 703
Area cut for pasture hay (ha)* 19 32 15 10
Area cut for silage (ha)* 14 27 6 10
Labour efficiency (ha/person) 437 422 500 373
Labour efficiency (DSE/person) 6,411 7,406 5,554 6,231
*Average includes zeros

7 Livestock Farm Monitor Project | Victoria 2018 -19
FIGURE 6. REGIONAL QUARTERLY SALES OF FINE WOOL
FIGURE 7. REGIONAL QUARTERLY SALES OF 1-2-YEAR-OLD STEERS
Pro
po
rtio
n o
f to
tal
fin
e w
oo
l sa
les
80%
60%
50%
40%
70%
30%
20%
10%
0%
Northern GippslandSouth West
Jul–Sep Oct–Dec Jan–Mar Apr–Jun
Pro
po
rtio
n o
f to
tal 1
–2
yea
r o
ld s
teer
sa
les
60%
50%
40%
30%
20%
10%
0%
Northern GippslandSouth West
Jul–Sep Oct–Dec Jan–Mar Apr–Jun
FIGURE 8. STATE DISTRIBUTION OF FARM SIZE
1000-1500 1500-2000 >2000<500 500-1000
Pro
po
rtio
n o
f fa
rms
0%
10%
5%
15%
20%
25%
45%
35%
40%
Farm size (ha)
30%
The monthly selling pattern of prime lamb, wool and beef enterprises is summarised in Figure 5. For each region, monthly lamb (unweaned and weaned), one to two-year-old steers (spring calving) and fine wool (kg greasy) sales are expressed as a percentage of total annual sales for each commodity in each region. There were distinct differences in the pattern of sales across all commodities in each region. This variation was influenced by a variety of factors including, timing of reproduction, time of shearing, availability of pasture, price of supplementary feed, market prices and attitude toward risk.
Northern Victorian and Gippsland participants sold more lambs within a short three-month period, compared to South West farmers who staggered lamb sales across a nine-month period (Figure 5). Northern Victorian participants sold a high proportion of lambs (49 per cent) in the October-December quarter before the drier months of summer. Gippsland participants held on to lambs longer and sales peaked in the January-March quarter. South West farmers sold 40 per cent of lambs in the October-December quarter, 35 per cent in the January-March quarter and 20 per cent in the April-June quarter.
All regions sold a large proportion of fine wool within a three-month period (Figure 6). Northern and Gippsland participants sold most of their wool in the January-March quarter. Whereas farms in the South West held on to wool longer and sold a majority in the April-June quarter.
A large proportion of steer (one and two-year old) sales in each region were in the October-December quarter (Figure 7). Gippsland participants sold most stock before the dry summer months, with 35 per cent of all steers sold before October and 70 per cent before January. Northern farmers spread the majority sales across two periods, with 50 per cent of steers sold in October-December and 30 per cent were sold in April-June. South West farmers sold 55 per cent of their steers in the October-December quarter and 25 per cent in the January-March quarter.
The distribution of farm size is shown in Figure 8. Most participant farms were between 500 ha to 1,000 ha. Average farm size within the three regions ranged from 703 ha in Gippsland, 820 ha in Northern Victoria to 1,064 ha in the South West. Average land values for participants were similar in the Northern and South West regions ($6,500/ha), however the Gippsland average was 38 per cent higher ($10,400/ha) than the value of the other regions (Appendix 11). The average land values are in Appendix Table 11 for each region.
FIGURE 5. REGIONAL QUARTERLY SALES OF PRIME LAMBS
Pro
po
rtio
n o
f to
tal l
am
b s
ale
s 50%
40%
30%
20%
10%
0%
Northern GippslandSouth West
Jul–Sep Oct–Dec Jan–Mar Apr–Jun

Livestock Farm Monitor Project | Victoria 2018 -19 8
FIGURE 9. AVERAGE EARNINGS BEFORE INTEREST AND TAX ($/HA)
FIGURE 10. STATE DISTRIBUTION OF FARMS BY RETURN ON ASSETS AND RETURN ON EQUITY
In 2018-19 average gross farm income across all surveyed farms decreased by nine per cent from 2017-18. The high gross farm income in the South West partially offset the declines seen in the Northern and Gippsland regions. The combination of successive years of below average rainfall, notably in the Northern and Gippsland regions and high purchased feed prices led to lower farm Earnings Before Interest and Tax (EBIT). In 2018-19, statewide EBIT dropped by 59 per cent from last year’s $251/ha, to $104/ha as shown in Table 3 and Figure 9.
This year there were significant increases in total costs when compared to 2017-18. Statewide variable costs averaged $448/ha in 2018-19, increasing by $151/ha (50 per cent) from the previous year (Table 3). Overhead costs were $355/ha, an increase of $15/ha (seven per cent).
The businesses included in the state top 20 per cent ranked by Return on Assets (RoA) were predominantly South West participants (11 of 15 farms). These farms achieved an average EBIT 3.5 times higher than the average participant. When their gross farm income and cost structure was compared to the statewide average,
the top 20 per cent achieved a higher gross farm income (30 per cent) and maintained lower variable (minus six per cent) and overhead costs (-20 per cent). These farms were efficient in using their assets to generate income with 6.9 per cent RoA compared to the statewide average of 1.1 per cent.
The average RoA decreased to 1.1 per cent from 3.5 per cent (Table 3) in 2017-18. At an individual farm level, a range of returns were observed (Figure 10). The range of RoA was from -12.5 per cent to 9.3 per cent. This year, 35 per cent of the farms (predominantly in the Northern region and Gippsland) recorded a RoA less than zero per cent. In contrast, 21 per cent of farms (mainly in the South West) achieved a RoA greater than five per cent.
The average RoE also decreased to 0.1 per cent from 3.8 per cent in 2017-18. Comparing the RoA and RoE across the state, 56 per cent of farms (40) had a lower RoE than RoA, denoting the return on additional assets was less than the cost of financing it.
Financial Measures
TABLE 3. STATE FARM FINANCIAL SUMMARY
Statewide South West Northern Gippsland
Gross Farm Income $907 $1,151 $680 $884
Variable Costs $448 $479 $335 $554
Overhead Costs $355 $351 $305 $426
Earnings Before Interest & Tax - EBIT $104 $321 $40 -$97
Net Farm Income $39 $254 -$21 -$165
Return on Assets 1.1% 4.0% 0.5% -1.9%
Return on Equity 0.1% 4.0% -0.7% -4.0%
EB
IT ($
/ha
)
350
300
100
200
50
250
150
0
-50
-100
State South West Northern Gippsland
Nu
mb
er o
f fa
rms
35
30
25
20
15
10
5
0
Return on equityReturn on assets
0% to -5% 0% to 5% 5% to 10% > 10%< -10% -5% to -10%

9 Livestock Farm Monitor Project | Victoria 2018 -19
This section discusses the economic results of the project since 2009-10 in real terms, meaning the dollars were adjusted using the consumer price index.
This year average gross farm income ($907/ha) was 22 per cent higher than the 10-year average ($742/ha) (Table 4). The average total variable and overhead costs were $803/ha, the highest level since 2009-10 and 41 per cent higher than the long-term average of $568/ha. In the last five years, gross farm income has increased by 34 per cent while total costs increased by 55 per cent, this represents a decline in terms of trade for surveyed farms within the LFMP.
Relative to 2012-13, where total average costs made up a high proportion of total income (98 per cent) and RoA dropped to 0.7 per cent (Table 4). The 2018-19 results reflected comparable operating conditions. Both years were characterised by low rainfall that impacted pasture availability. The results in both years were then compounded by a relative increase in the cost of supplementary feed.
The highest average statewide measures of efficiency were recorded in 2016-17 when RoA was 5.2 per cent
and RoE was 5.9 per cent (Figure 11). The lowest were in 2012-13 with 0.7 per cent RoA and -1.3 per cent RoE. There were only two periods (2016-17 and 2017-18) in the last 10 years when RoE was higher than RoA, indicating that in those years the return on the additional assets under management generated higher returns than the cost of financing it.
Historical financial measures
FIGURE 11: STATE AVERAGE RETURN ON ASSETS AND RETURN ON EQUITY (%)
200
9-1
0
2010
-11
2011
-12
2012
-13
2013
-14
2014
-15
2015
-16
2016
-17
2017
-18
2018
-19
Re
turn
(%)
0%
7%
6%
5%
4%
3%
1%
2%
-1%
-2%
RoA RoE
TABLE 4. STATE AVERAGE FINANCIAL SUMMARY 2009-2019
Gross Farm Income Variable CostsOverhead Costs
& Owner/operator allowance
Earnings before Interest & Tax - EBIT
Return on Assets Return on Equity
($/HA real) ($/HA real) ($/HA real) ($/HA real) % %
2009-10 $583 $220 $219 $144 2.1% 1.5%
2010-11 $761 $299 $219 $242 3.2% 2.5%
2011-12 $698 $240 $290 $168 2.8% 2.2%
2012-13 $541 $254 $276 $10 0.7% -1.3%
2013-14 $616 $236 $258 $122 1.8% 0.6%
2014-15 $675 $276 $258 $142 2.1% 1.5%
2015-16 $722 $291 $264 $166 2.4% 1.7%
2016-17 $1,009 $295 $333 $381 5.2% 5.9%
2017-18 $907 $302 $350 $255 3.5% 3.8%
2018-19 $907 $448 $355 $104 1.1% 0.1%
10-year average $742 $286 $282 $173 2.5% 1.9%
Livestock Farm Monitor Project | Victoria 2018 -19 10
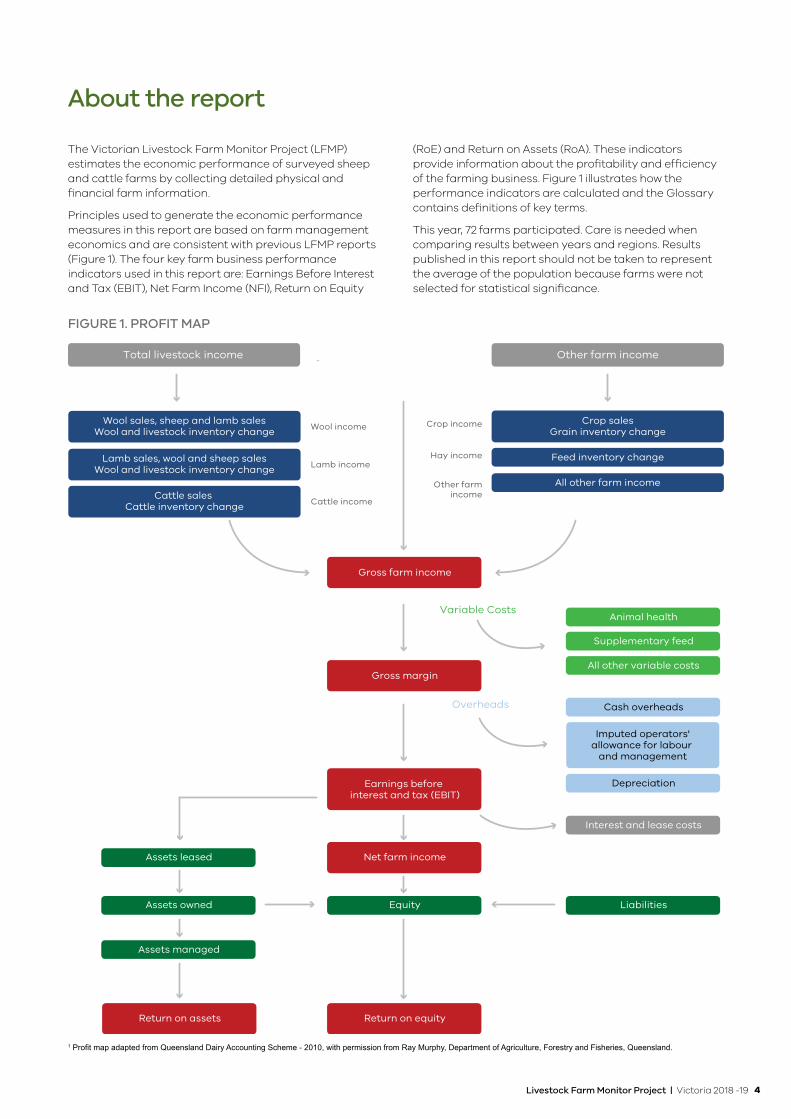
Wool Prices
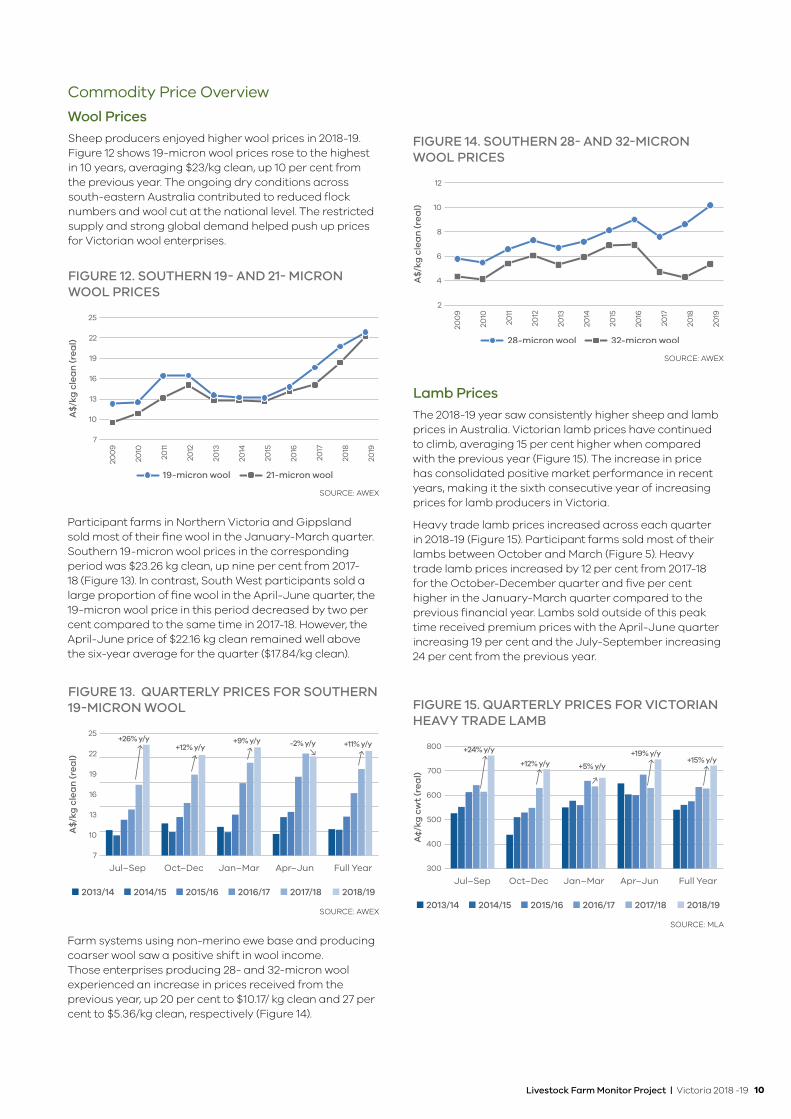
Lamb Prices
FIGURE 12. SOUTHERN 19- AND 21- MICRON WOOL PRICES
Sheep producers enjoyed higher wool prices in 2018-19. Figure 12 shows 19-micron wool prices rose to the highest in 10 years, averaging $23/kg clean, up 10 per cent from the previous year. The ongoing dry conditions across south-eastern Australia contributed to reduced flock numbers and wool cut at the national level. The restricted supply and strong global demand helped push up prices for Victorian wool enterprises.
The 2018-19 year saw consistently higher sheep and lamb prices in Australia. Victorian lamb prices have continued to climb, averaging 15 per cent higher when compared with the previous year (Figure 15). The increase in price has consolidated positive market performance in recent years, making it the sixth consecutive year of increasing prices for lamb producers in Victoria.
Heavy trade lamb prices increased across each quarter in 2018-19 (Figure 15). Participant farms sold most of their lambs between October and March (Figure 5). Heavy trade lamb prices increased by 12 per cent from 2017-18 for the October-December quarter and five per cent higher in the January-March quarter compared to the previous financial year. Lambs sold outside of this peak time received premium prices with the April-June quarter increasing 19 per cent and the July-September increasing 24 per cent from the previous year.
Commodity Price Overview
SOURCE: AWEX
SOURCE: AWEX
FIGURE 13. QUARTERLY PRICES FOR SOUTHERN 19-MICRON WOOL
200
9
2010
2011
2012
2013
2014
2015
2017
2016
2018
2019
A$
/kg
cle
an
(re
al)
25
22
19
16
13
10
7
19-micron wool 21-micron wool
A$
/kg
cle
an
(re
al)
25
22
19
16
13
10
7
2013/14 2014/15 2015/16 2016/17 2017/18 2018/19
Jul–Sep Full YearOct–Dec Jan–Mar Apr–Jun
+26% y/y+12% y/y +11% y/y-2% y/y+9% y/y
Participant farms in Northern Victoria and Gippsland sold most of their fine wool in the January-March quarter. Southern 19-micron wool prices in the corresponding period was $23.26 kg clean, up nine per cent from 2017-18 (Figure 13). In contrast, South West participants sold a large proportion of fine wool in the April-June quarter, the 19-micron wool price in this period decreased by two per cent compared to the same time in 2017-18. However, the April-June price of $22.16 kg clean remained well above the six-year average for the quarter ($17.84/kg clean).
Farm systems using non-merino ewe base and producing coarser wool saw a positive shift in wool income. Those enterprises producing 28- and 32-micron wool experienced an increase in prices received from the previous year, up 20 per cent to $10.17/ kg clean and 27 per cent to $5.36/kg clean, respectively (Figure 14).
SOURCE: MLA
FIGURE 15. QUARTERLY PRICES FOR VICTORIAN HEAVY TRADE LAMB
A¢/
kg c
wt
(re
al)
800
700
600
500
400
300
2013/14 2014/15 2015/16 2016/17 2017/18 2018/19
Jul–Sep Full YearOct–Dec Jan–Mar Apr–Jun
+24% y/y
+12% y/y +15% y/y+19% y/y
+5% y/y
SOURCE: AWEX
FIGURE 14. SOUTHERN 28- AND 32-MICRON WOOL PRICES
200
9
2010
2011
2012
2013
2014
2015
2017
2016
2018
2019
A$
/kg
cle
an
(re
al)
12
10
8
6
4
2
28-micron wool 32-micron wool

11 Livestock Farm Monitor Project | Victoria 2018 -19
SOURCE: MLA
SOURCE: MLA
Victorian saleyard cattle prices stabilised in 2018-19. Over-the-hooks (OTH) and saleyards prices remained similar to their respective levels seen the previous year but were higher than ten-year average price. Average saleyard market price decreased three per cent and OTH increased by two per cent (Figure 16). Saleyard premium was the lowest in 10 years. Based on Victorian beef market data, trade steer saleyard prices were 520 c/kg cwt (carcass weight), 10 c/kg cwt lower than the average processor price at 530 c/kg cwt (Figure 16).
Quarterly changes to Victorian cattle prices are shown in Figure 17. In 2018-19 Victorian cattle prices increased in the autumn period compared with 2017-18. However, there was a decline in all other quarterly market results for 2018-19 compared to the same quarterly period in the previous year. The largest price decreases were in the July-September and October-December quarters. Poor spring operating conditions in beef production regions across eastern Australia led to a surge of beef sales resulting in a decline in market prices. The price decreases in the first half of the financial year had the biggest impact on Victorian beef producers who sold cattle between July and December.
Intra-season price variability of lamb and beef prices, measured as variation around the average, gives some insight into market volatility and the importance of time of sale for livestock businesses. Figure 18 shows a significant increase in market volatility for lamb prices in both OTH and saleyard markets in 2018-19. For cattle producers, saleyard price volatility remained comparable with 2017-18, while OTH price volatility reduced to the lowest level in four years.
When intra-season price volatility is high, using a one-year timeframe to compare farm performance can be misleading. High or low economic returns for one year may be due to ‘luck’ of the market and price trends in that particular year suiting the timing of product availability for a farm. Taking a longer-term perspective is preferable, where a range of market characteristics, price trends and seasonal conditions can be accounted for.
Beef Prices Commodity price variability
FIGURE 16. VICTORIAN TRADE STEER PRICES
FIGURE 17. QUARTERLY PRICES FOR VICTORIAN SALEYARD TRADE STEERS
A¢/
kg c
wt
(re
al)
800
700
600
500
400
200
300
2013/14 2014/15 2015/16 2016/17 2017/18 2018/19
Jul–Sep Full YearOct–Dec Jan–Mar Apr–Jun
-6% y/y-5% y/y -3% y/y
+3% y/y
-3% y/y
200
9
2010
2011
2012
2013
2014
2015
2017
2016
2018
2019
Ac/
kg c
wt
(re
al)
700
600
500
400
200
300
Trade Steer Cattle Price OTH
Trade Steer Cattle Price Saleyard
FIGURE 18. INTRA-ANNUAL PRICE VARIABILITY
SOURCE: AGRICULTURE VICTORIA
2015-16 2016-17 2017-18 2018-19
Pri
ce V
ola
tilit
y (C
oe
ffici
en
t V
ari
ati
on
) %
0%
15%
12%
9%
6%
3%
Lamb Saleyard Lamb OTH
Beef Saleyard Beef OTH
Time of Sale: increasing importance on individual LFMP results
Time of Sale: decreasing importance on individual
LFMP results

Livestock Farm Monitor Project | Victoria 2018 -19 12
FIGURE 19. QUARTERLY PRICES FOR VICTORIAN WHEAT GRAIN (DELIVERED ON-FARM)
FIGURE 20. QUARTERLY PRICES FOR VICTORIAN CEREAL HAY (DELIVERED ON-FARM)
$/t
(re
al)
500
400
300
200
100
0
2017/18 2018/19
Jul–Sep Full YearOct–Dec Jan–Mar Apr–Jun
+43% y/y+57% y/y
+44% y/y +18% y/y +39% y/y
$/t
(re
al)
500
400
300
200
100
0
2017/18 2018/19
Jul–Sep Full YearOct–Dec Jan–Mar Apr–Jun
+109% y/y
+160% y/y+143% y/y
+146% y/y+139% y/y
wheat prices 57 per cent higher and cereal hay 160 per cent higher than the same period in 2017-18. Failed crops and reduced pasture growth from below average spring rainfall across large areas of eastern Australia led to high demand for supplementary feed by livestock farmers and low supply of feed from cropping farmers.
The 2018-19 supplementary feed market was characterised by large increases in the unit price of grain and fodder.
There was a significant increase in wheat grain price and cereal hay price across Victoria in 2018-19 compared with the previous year (Figure 19, Figure 20). The spring quarter (October-December) showed the largest increase, with
Supplementary feed prices
SOURCE: DAIRY AUSTRALIA SOURCE: DAIRY AUSTRALIA

13 Livestock Farm Monitor Project | Victoria 2018 -19
South West
South West
Favourable market prices for lamb and wool increased average gross farm income on surveyed farms to the highest levels recorded by the project in the South West. To take advantage of the good market prices, participants chose to maintain livestock body condition and stock numbers. Livestock diets were supplemented with home-grown and purchased feed to offset reduced pasture availability. Increases in the quantity of supplementary feed and prices paid for purchased feed increased average variable costs to the highest level recorded by the project in the South West. The regional average Return on Assets was 4.0 per cent, with all but one farm recording a positive result.
Average Top 20% #
Sheep (head) 6,591 10,793
Cattle (head) 234 200
Labour efficiency (ha/person) 707 569
Labour efficiency (DSE/person) 11,074 12,137
Effective area (ha) 1,064 1,498
In 2018-19, the 26 farms surveyed in the South West operated an average 1,064 effective hectares (Table 5). Prime lamb production remained the dominant enterprise in the sample (Table 6).
The South West experienced below average spring and summer rainfall and on average participants received 83 per cent of long-term annual rainfall.
Participants responded to dry conditions in September and high grain and fodder prices by increasing fertiliser application (Appendix Tables A2, A9) and utilising residual soil moisture from winter rainfall to focus on early spring hay and silage production. The average number of hectares allocated to pasture hay and silage production increased compared to the previous year by 16 per cent and 49 per cent, respectively.
As the dry conditions persisted over the summer months, low pasture availability was supplemented by increased feeding requirements and costs. Average variable costs increased by 40 per cent compared with 2017-18, with supplementary feed the main component of these costs. Higher fodder and grain prices were compounded by a greater reliance on supplementary feed resulting in large spending increases within this cost category (Table 7).
Despite the reduced pasture availability, South West farmers elected to maintain body condition, production levels and stocking rates of livestock by supplementary feeding. The reward of decade high lamb and fine wool prices gave sheep farmers in the South West the incentive to continue supplementary feeding at elevated grain and fodder prices. Participants received an average gross farm income of $1,151/ha (10 per cent increase), the highest recorded in the South West over 49 years of the project.
TABLE 5. SOUTH WEST WHOLE FARM PHYSICAL SUMMARY
TABLE 6. SOUTH WEST WHOLE FARM ENTERPRISE MIX
Average Top 20% #
Wool 28% 14%
Lamb 48% 79%
Beef 20% 6%
Hay/Cropping 4% 1%
TABLE 7. SOUTH WEST WHOLE FARM FINANCIAL SUMMARY
Average Top 20% #
Gross income ($/ha) $1,151 $1,482
Variable costs ($/ha) $479 $547
Overhead costs and owner/operator allowance ($/ha)
$351 $308
EBIT($/ha) $321 $627
Net farm income ($/ha) $254 $566
Return on assets (%) 4.0% 8.5%
Return on equity (%) 4.0% 9.5%
Equity (%) 83% 81%
# Top 20% ranked by RoA
# Top 20% ranked by RoA
# Top 20% ranked by RoA

Livestock Farm Monitor Project | Victoria 2018 -19 14
South West
The average gross farm income of top performing farms was $330/ha higher (30 percent) than the average farm with only minor increases in overhead (eight per cent increase) and variable costs (14 per cent increase). The more profitable farms in 2018-19 were prime lamb producers (Table 8).
Prime lamb, wool sheep and beef cattle gross margins were lower in 2018-19 compared to 2017-18 (Table 8), however all enterprise gross margins remained higher than their respective long-term average.
Average wool sheep gross margin decreased to $31/DSE (35 per cent decrease), the lowest level since 2015-16. Encouraged by high wool prices participants increased average wool cut (kg/ha) by 10 per cent compared to the previous year. Participants sold most wool in the April-June quarter (Figure 6) when the bullish wool prices had flattened (Figure 13) and as a result average wool price received ($/kg clean) decreased by seven per cent from 2017-18 levels. Wool sheep supplementary feed costs increased by 150 per cent from 2017-18 and represented the major component of the enterprise variable cost.
FIGURE 21. SOUTH WEST EARNINGS BEFORE INTEREST AND TAX ($/HA)
FIGURE 22. SOUTH WEST NET FARM INCOME ($/HA)
TABLE 8. SOUTH WEST ENTERPRISE SUMMARY
Wool Average
Stocking rate (DSE/ha) 14.1
Average micron 17.3
Average yield (%) 66%
Lamb marking (%) 67%
Wool price received ($/kg clean) $20.25
Clean wool cut (kg/ha) 35
Clean wool cut (kg/dse) 2.5
Gross margin ($/dse) $31
Gross margin ($/ha/100mm) $79
Lamb Average
Stocking rate (DSE/ha) 18.0
Lamb marking (%) 116%
Average lamb weight (kg cwt) 20
Average lamb price ($/kg cwt) $7.48
Lamb produced (kg cwt /ha) 131
Gross margin ($/dse) $35
Gross margin ($/ha/100mm) $107
Beef Average
Stocking rate (DSE/ha) 17.6
Calving (%) 94%
Average weight sold (kg lwt) 470
Average beef price ($/kg lwt) $2.54
Beef produced (kg lwt /ha) 433
Gross margin ($/dse) $26
Gross margin ($/ha/100mm) $87
14 39 43 55 66 87 88 114
512
522
627
628
659
69
371
575
175
475
875
976
180
780
910
06
1016
1017
1018
EB
IT ($
/ha
)
-$200
$1000
$800
$600
$400
$200
$0
EBIT Average EBIT
14 39 43 55 66 87 88 114
512
522
627
628
659
69
371
575
175
475
875
976
180
780
910
06
1016
1017
1018
Ne
t F
arm
Inco
me
($/h
a)
-$200
$1000
$800
$600
$400
$200
$0
Net Farm Income Average NFI
Beef enterprises received the largest decrease with an average gross margin of $26/DSE (63 per cent decrease). Average beef production (kg lwt/ha) increased in 2018-19, however a 17 per cent decrease in sale price coincided with a 57 per cent increase in beef variable costs compared to the previous year. The rise in variable costs was due to large increases (74 per cent increase) in supplementary feed expenditure.
In contrast to wool and beef, prime lamb production (kg cwt/ha) decreased by 15 per cent in 2018-19. However average lamb price received was 17 per cent higher than 2017-18, helping to limit the impact of increases in supplementary feed expenditure (52 per cent increase). Average prime lamb gross margin was $35/DSE, a six per cent decrease from 2017-18.
Figure 21 to Figure 24 show the range of EBIT, NFI, RoA and RoE for participant farms in the South West. The average RoA was four per cent with a range of -3.1 per cent to 9.3 per cent (Figure 23), compared to last year’s range of -2.4 per cent to 13.1 per cent.

15 Livestock Farm Monitor Project | Victoria 2018 -19
South West
FIGURE 26. SOUTH WEST EARNINGS BEFORE INTEREST AND TAX HISTORY ($/HA)
FIGURE 24. SOUTH WEST RETURN ON EQUITY (%)
FIGURE 25. DISTRIBUTION OF SOUTH WEST FARMS BY CHANGE IN DEBT
FIGURE 23. SOUTH WEST RETURN ON ASSETS (%)
FIGURE 27. SOUTH WEST RETURN ON ASSETS AND RETURN ON EQUITY HISTORY (%)
14 39 43 55 66 87 88 114
512
522
627
628
659
69
371
575
175
475
875
976
180
780
910
06
1016
1017
1018
Re
turn
on
ass
ets
-4%
-2%
10%
8%
6%
4%
2%
0%
Return on assets Average RoA
14 39 43 55 66 87 88 114
512
522
627
628
659
69
371
575
175
475
875
976
180
780
910
06
1016
1017
1018
Re
turn
on
eq
uit
y
-4%
-2%
12%
10%
8%
6%
4%
2%
0%
Return on equity Average RoE
Pro
po
rtio
n o
f fa
rms
50%
30%
20%
40%
10%
0%
Increased debt
Reduced debt
No change in debt
No debt at July 1st or June 30th
200
4-0
5
200
5-0
6
200
6-0
7
200
7-0
8
200
8-0
9
200
9-1
0
2010
-11
2011
-12
2012
-13
2013
-14
2014
-15
2015
-16
2016
-17
2017
-18
2018
-19
EB
IT ($
/ha
, re
al)
$0
$500
$350
$300
$250
$200
$150
$100
$50
200
4-0
5
200
5-0
6
200
6-0
7
200
7-0
8
200
8-0
9
200
9-1
0
2010
-11
2011
-12
2012
-13
2013
-14
2014
-15
2015
-16
2016
-17
2017
-18
2018
-19
Re
turn
(%)
-4%
8%
6%
4%
2%
0%
-2%
Return on assets Return on equity
For South West participants, the average EBIT was $321/ha compared to $389/ha in 2017-18 (17 per cent decrease), with a narrower range of -$163/ha to $827/ha compared to last year’s range of -$159/ha to $1,003/ha. This year was the fourth highest EBIT recorded in 15-years. After accounting for interest and lease costs, four farms returned a negative RoE (Figure 24) an increase from 2017-18 (two farms). The RoE range in 2018-19 was -3.1 per cent to 10.8 per cent.
Positive farm profits in 2018-19 allowed a high proportion (42 per cent) of South West participants to reduce the amount of debt owing (Figure 25). Debt levels increased on 30 per cent of farms. Some farmers used borrowed finance to invest in land and on-farm improvements. Average repairs and maintenance to land and improvements increased by 90 per cent compared to 2017-18 (Appendix Table A10) further highlighting that participants were buoyed by positive farm profits and chose to upgrade farm infrastructure. Debt is a part of business structures for a large proportion (92 per cent) of South West participants. The strategy employed by South West participants to maintain income during a year of high costs was, in part, influenced by finance obligations. The use of debt finance increases the compulsory costs of farm businesses as principal and interest repayments must be paid in good years and poor. This makes South West participants with debt more vulnerable to year-to-year shortfalls in income.
Despite the average RoA declining for the second consecutive year, the average RoA in 2018-19 was close to the long-term average for the region (4.1 per cent). Average EBIT/ha and RoE also dropped for the second year in a row but remained above the long-term average for both measures (Figure 26 and Figure 27).

Livestock Farm Monitor Project | Victoria 2018 -19 16
Northern Victoria
Northern Victoria
Increased variable costs and decreased gross farm income led to reduced farm profits in 2018-19 for Northern Victoria participants. In response to low pasture availability, participant farms utilised feed reserves and sourced supplementary feed at elevated prices. Stock numbers were reduced early in the season to limit the impact of high input costs; however, gross farm income was impacted as less animals were joined, weaned and shorn. On average, RoA was 0.5 per cent with a range of -12.5 per cent to 7.7 per cent.
Average Top 20%#
Sheep (head) 2,722 7,537
Cattle (head) 404 734
Labour efficiency (ha/person) 500 706
Labour efficiency (DSE/person) 5,554 9,133
Effective area (ha) 820 1,678
Average Top 20%#
Gross income ($/ha) $680 $909
Variable costs ($/ha) $335 $297
Overhead costs and owner/operator allowance ($/ha)
$305 $192
EBIT($/ha) $40 $419
Net farm income ($/ha) -$21 $355
Return on assets (%) 0.5% 5.9%
Return on equity (%) -0.7% 8.1%
Equity (%) 77% 65%
Average Top 20%#
Wool 33% 37%
Lamb 17% 20%
Beef 47% 36%
Hay/Cropping 3% 6%
The 26 participant farmers located in the Northern Victoria region this year managed an average of 820 ha (Table 9) where beef was the dominant enterprise (Table 10). There were minor changes from last year to labour efficiency and enterprise mix across participant farms in the region.
Rainfall in Northern Victoria was variable across the region where the northeast participant farms had a better condition than the rest of the region where rainfall was patchy. On average rainfall for participant farms in 2018-19 was 79 per cent of the long-term average, with the timing of rainfall being an important determinant of success. Summer rain in December 2018 eased the soil moisture constraints for some, however, it was too late in the season to be useful for significant pasture growth. Participant farms depleted on-farm feed reserves, reduced stock numbers and purchased supplementary feed to manage the below average rainfall across the region.
On average, gross farm income was six per cent lower at $680/ha, when compared with the 2017-18 year (Table 11). The range of gross farm income was $155/ha to $1,451/ha, with 30 per cent of participant farms generating less than $500/ha. Variable costs increased substantially (51 per cent), mainly due to the high price of supplementary feed. Overhead costs decreased slightly, however, these costs as a proportion of gross farm income made up 26 per cent, indicating that for every $1 of gross farm income received, $0.26 was spent on overhead costs.
The average RoA was 0.5 per cent with a range of -12.5 per cent to 7.7 per cent. The proportion of participant farms that recorded positive RoA decreased from 79 per cent in 2017-18 to 58 per cent this year.
Northern Victorian wool producers recorded gross margins 47 per cent lower than in 2017-18. Despite participants producing a similar quantity of finer quality wool (Table 12) and increasing stocking rates by eight per cent, these gains were not enough to offset a lower wool price received and increases in supplementary feed costs.
TABLE 9. NORTHERN WHOLE FARM PHYSICAL SUMMARY
TABLE 10. NORTHERN WHOLE FARM ENTERPRISE MIX
# Top 20% ranked by RoA
# Top 20% ranked by RoA
TABLE 11. NORTHERN WHOLE FARM FINANCIAL SUMMARY
# Top 20% ranked by RoA

17 Livestock Farm Monitor Project | Victoria 2018 -19
South WestNorthern Victoria
FIGURE 28. NORTHERN EARNINGS BEFORE INTEREST AND TAX ($/HA)
FIGURE 29. NORTHERN NET FARM INCOME ($/HA)
TABLE 12. NORTHERN ENTERPRISE SUMMARY
The average gross margin in 2018-19 for prime lamb enterprises declined 10 per cent from 2017-18 results (Table 12). Lower stocking rates and lower lamb produced per hectare as measured by kilograms of carcass weight per hectare (kg cwt/ha) were the main indicators impacting farm performance.
The decline in economic performance was greatest for Northern beef participant farms compared to the wool and prime lamb enterprises in the region. Slightly higher stocking rate (11.9 DSE/ha) and lower overhead costs per kilogram of liveweight ($0.68/kg lwt) were not enough to cover the combined effects of lower prices received, lower beef produced (kg lwt/ha) and increased variable costs (78 per cent higher).
The top 20 per cent of farms achieved a higher gross income, spent less on variable costs and were able to spread their overhead costs and owner/operator labour costs over a bigger area than the average of all Northern Victorian participants (Table 11).
Net Farm Income (NFI) for producers in Northern Victoria decreased substantially to -$21/ha in 2018-19 from $125/ha in 2017-18 (Figure 29). The range was -$944/ha to $556/ha in 2018-19. in 2018-19.
On average, Northern participants had 77 per cent equity with the top 20 per cent ranked by RoA having less, at 65 per cent (Appendix Table B11).
Profit and efficiency measures declined for the second consecutive year for Northern participants. Average EBIT fell to $40/ha from $183/ha in 2017-18. This year, the difference between the lowest and highest EBIT was $1,461/ha, compared to $1,014/ha last year (Figure 28)1 . This is the fourth lowest EBIT recorded in the 15 years of the project.
EB
IT ($
/ha
)
-$400
-$100
-$200
-$300
$600
$500
$400
$300
$200
$100
$0
EBIT Average EBIT
584
585
586
588
589
599
614
630 678
683
688
706
707
708
709 711
744
745
756
757
800
802
803
1012
1013
1015
Ne
t F
arm
Inco
me
($/h
a)
-$400
$600
$500
$100
-$100
-$200
-$300
$400
$300
$200
$0
Net Farm Income Average NFI
584
585
586
588
589
599
614
630 678
683
688
706
707
708
709 711
744
745
756
757
800
802
803
1012
1013
1015
Wool Average
Stocking rate (DSE/ha) 9.5
Average micron 17.7
Average yield (%) 69%
Lamb marking (%) 79%
Wool price received ($/kg clean) $19.48
Clean wool cut (kg/ha) 21.6
Clean wool cut (kg/dse) 2.3
Gross margin ($/dse) $33
Gross margin ($/ha/100mm) $62
Lamb Average
Stocking rate (DSE/ha) 9.9
Lamb marking (%) 114%
Average lamb weight (kg cwt) 23.3
Average lamb price ($/kg cwt) $6.70
Lamb produced (kg cwt /ha) 88
Gross margin ($/dse) $48
Gross margin ($/ha/100mm) $95
Beef Average
Stocking rate (DSE/ha) 11.9
Calving (%) 88%
Average weight sold (kg lwt) 421
Average beef price ($/kg lwt) $2.62
Beef produced (kg lwt /ha) 223
Gross margin ($/dse) $17
Gross margin ($/ha/100mm) $33
1 The axes in Figure 28 to Figure 31, have been modified to allow for better presentation of all Northern farms in the project. A few farms had either much higher or lower EBIT, NFI, RoA or RoE than the rest of the dataset, which the axes did not allow to be represented to the full extent. Appendix Table B1 presents these measures for all participant farms.

Livestock Farm Monitor Project | Victoria 2018 -19 18
Northern Victoria
Average liabilities per hectare decreased by nine per cent from last year (Appendix Table B11). A high proportion of participant farms (46 per cent) reduced their debts in 2018-19 (Figure 32). However, there was no correlation between profit and debt reduction. An equal proportion of farms that reduced their debt had either negative or positive profit. These results indicate that some participant farms minimise their financial risk by reducing liabilities even under challenging economic conditions.
Average EBIT declined to $40/ha this year, the fourth lowest result in the history of the project (Figure 33). The impact of two years receiving below average rainfall, a subsequent decline in pasture production and increased variable costs contributed to negative EBIT and NFI for a large proportion of farms in the region this year. These results contributed to the third lowest RoA and fourth lowest RoE in the 15-year history of the project (Figure 34).
FIGURE 33. NORTHERN EARNINGS BEFORE INTEREST AND TAX HISTORY ($/HA)
FIGURE 31. NORTHERN RETURN ON EQUITY (%)
FIGURE 30. NORTHERN RETURN ON ASSETS (%)
FIGURE 34. NORTHERN RETURN ON ASSETS AND RETURN ON EQUITY HISTORY (%)
584
585
586
588
589
599
614
630 678
683
688
706
707
708
709 711
744
745
756
757
800
802
803
1012
1013
1015
Re
turn
on
ass
ets
-8%
2%
8%
4%
6%
0%
-2%
-4%
-6%
Return on assets Average RoA
584
585
586
588
589
599
614
630 678
683
688
706
707
708
709 711
744
745
756
757
800
802
803
1012
1013
1015
Re
turn
on
eq
uit
y
-15%
-9%
-12%
-6%
15%
9%
12%
6%
3%
0%
-3%
Return on equity Average RoE
200
4-0
5
200
5-0
6
200
6-0
7
200
7-0
8
200
8-0
9
200
9-1
0
2010
-11
2011
-12
2012
-13
2013
-14
2014
-15
2015
-16
2016
-17
2017
-18
2018
-19
EB
IT ($
/ha
, re
al)
$0
$300
$250
$200
$150
$100
$50
200
4-0
5
200
5-0
6
200
6-0
7
200
7-0
8
200
8-0
9
200
9-1
0
2010
-11
2011
-12
2012
-13
2013
-14
2014
-15
2015
-16
2016
-17
2017
-18
2018
-19
Re
turn
(%)
-2%
5%
4%
3%
2%
1%
0%
-1%
Return on assets Return on equity
FIGURE 32. DISTRIBUTION OF NORTHERN FARMS BY CHANGE IN DEBT
Pro
po
rtio
n o
f fa
rms
50%
30%
20%
40%
10%
0%
Increased debt
Reduced debt
No change in debt
No debt at July 1st or June 30th

19 Livestock Farm Monitor Project | Victoria 2018 -19
Gippsland
Gippsland average farm profit in 2018-19 was the lowest recorded for the region in the history of the project. For farms located in central and eastern parts of the region, dry conditions leading into spring 2018 reduced pasture growth and placed an increased dependence on purchased feed. Many participants elected to de-stock to reduce supplementary feed requirements and costs. Negative livestock trading accounts and increased variable cost impacted business wealth and financial performance. The regional average RoA was -1.9 per cent, with 13 of the 20 farms returning a negative result.
Twenty farms were surveyed in the Gippsland region this year. On average effective land area was 703 ha and there were 597 head of cattle and 2,313 head of sheep run (Table 13). Beef was the dominant enterprise making up 62 per cent of total farm activity, while wool and prime lamb enterprises contributed 27 per cent and nine per cent, respectively (Table 14).
On average, Gippsland participants recorded 80 per cent of the long-term average annual rainfall. Variability in seasonal conditions across the region, however, made direct comparisons between farms difficult. The top 20 per cent of farms (ranked by RoA) received on average 93 per cent of long-term average rainfall, while other farms received 76 per cent. All farms that recorded a positive EBIT received at or above 87 per cent of their long-term average rainfall.
Farm performance was mixed across Gippsland. All top performing farms were in south and west Gippsland where rainfall was more consistent. These farms were able to take advantage of homegrown feed opportunities and had, on average, a higher proportion of land area cut for hay and silage (Appendix Table C13) and applied more fertiliser per hectare (Appendix Table C2).
Increases in variable costs and negative livestock trading accounts influenced enterprise gross margins (Table 15). Farms that received below average rainfall in spring and summer had reduced pasture production that contributed to an increased dependence on supplementary feed. Average variable costs increased by 63 per cent compared to 2017-18, to $554/ha, this was mainly due to increased fodder and grain prices (Figure 20 and Figure 21). When seasonal conditions began to deteriorate, many farms elected to de-stock to reduce supplementary feed requirements and costs. A high proportion of stock were sold early in the year coinciding with softening beef prices (Figure 17). Reduced income and high costs put pressure on EBIT and further contributed to net losses.
TABLE 13. GIPPSLAND WHOLE FARM PHYSICAL SUMMARY
TABLE 14. GIPPSLAND WHOLE FARM ENTERPRISE MIX
# Top 20% ranked by RoA
Average Top 20%#
Sheep (head) 2,313 775
Cattle (head) 597 1,276
Labour efficiency (ha/person) 476 459
Labour efficiency (DSE/person) 8,553 11,182
Effective area (ha) 703 659
Average Top 20%#
Wool 27% 0%
Lamb 9% 10%
Beef 62% 90%
Hay/Cropping 2% 1%
# Top 20% ranked by RoA
Gippsland

Livestock Farm Monitor Project | Victoria 2018 -19 20
Gippsland
Average gross farm income for top performing farms was $1,358/ha, 67 per cent higher than the average farm. This higher gross farm income compensated for the higher overhead costs (31 per cent higher) while there was little difference in variable costs.
Wool enterprises produced an average of 24 kg clean/ha, down six kg/ha from the previous year (Table 16). While wool price remained historically high at $19/kg, average gross margin for wool producers in Gippsland decreased by 81 per cent in the 2018-19 to $10/DSE.
Prime lamb production indictors remained consistent in 2018-19 when compared to the previous financial year. However, average gross margin declined by 23 per cent, from the previous financial year to $29/DSE.
Similar to prime lamb enterprises, beef production indicators remained consistent and gross margins declined as compared with the previous financial year (Table 16). Beef gross margins reduced by 57 per cent to $12/DSE.
Average EBIT in 2018-19 was -$97/ha, which was $187/ha below the long-term average for the region and ranged from -$588/ha to $483/ha (Figure 35 and Figure 40). Results for NFI, RoA and RoE were also impacted by the challenging season with returns of -$165/ha, -1.9 per cent and -4.0 per cent respectively (Figure 36, Figure 37, Figure 38 and Figure 41).
TABLE 15. GIPPSLAND WHOLE FARM FINANCIAL SUMMARY
FIGURE 35. GIPPSLAND EARNINGS BEFORE INTEREST AND TAX ($/HA)
FIGURE 36. GIPPSLAND NET FARM INCOME ($/HA)
# Top 20% ranked by RoA
TABLE 16. GIPPSLAND ENTERPRISE SUMMARY
Average Top 20%#
Gross income ($/ha) $884 $1,358
Variable costs ($/ha) $554 $549
Overhead costs and owner/operator allowance ($/ha)
$426 $493
EBIT($/ha) -$97 $317
Net farm income ($/ha) -$165 $178
Return on assets (%) -1.9% 1.9%
Return on equity (%) -4.0% 1.3%
Equity (%) 80% 73%
553
555
556
574
636 638
64
3
653
66
3
66
4
66
7
69
8
755
804
1014
1017
1018
1019
1021
1022
EB
IT ($
/ha
)
-$600
$600
$400
$200
$0
-$200
-$400
EBIT Average EBIT
Ne
t F
arm
Inco
me
($/h
a)
-$800
$600
$400
-$400
-$600
$200
-$200
$0
Net Farm Income Average NFI
553
555
556
574
636 638
64
3
653
66
3
66
4
66
7
69
8
755
804
1014
1017
1018
1019
1021
1022
Wool Average
Stocking rate (DSE/ha) 12.5
Average micron 17.7
Average yield (%) 70%
Lamb marking (%) 71%
Wool price received ($/kg clean) $19.76
Clean wool cut (kg/ha) 24
Clean wool cut (kg/dse) 2.0
Gross margin ($/dse) $10
Gross margin ($/ha/100mm) $20
Lamb Average
Stocking rate (DSE/ha) 18.8
Lamb marking (%) 100%
Average lamb weight (kg cwt) 21.1
Average lamb price ($/kg cwt) $6.19
Lamb produced (kg cwt /ha) 170
Gross margin ($/dse) $29
Gross margin ($/ha/100mm) $90
Beef Average
Stocking rate (DSE/ha) 21.1
Calving (%) 92%
Average weight sold (kg lwt) 416
Average beef price ($/kg lwt) $2.41
Beef produced (kg lwt /ha) 322
Gross margin ($/dse) $12
Gross margin ($/ha/100mm) $36

21 Livestock Farm Monitor Project | Victoria 2018 -19
Gippsland
FIGURE 40. GIPPSLAND EARNINGS BEFORE INTEREST AND TAX HISTORY ($/HA)
FIGURE 38. GIPPSLAND RETURN ON EQUITY (%) FIGURE 41. GIPPSLAND RETURN ON ASSETS AND RETURN ON EQUITY HISTORY (%)
Re
turn
on
eq
uit
y
-20%
5%
0%
-5%
-10%
-15%
Return on equity Average RoE
553
555
556
574
636 638
64
3
653
66
3
66
4
66
7
69
8
755
804
1014
1017
1018
1019
1021
1022
200
4-0
5
200
5-0
6
200
6-0
7
200
7-0
8
200
8-0
9
200
9-1
0
2010
-11
2011
-12
2012
-13
2013
-14
2014
-15
2015
-16
2016
-17
2017
-18
2018
-19
EB
IT ($
/ha
, re
al)
-$200
-$100
$400
$300
$200
$0
$100
200
4-0
5
200
5-0
6
200
6-0
7
200
7-0
8
200
8-0
9
200
9-1
0
2010
-11
2011
-12
2012
-13
2013
-14
2014
-15
2015
-16
2016
-17
2017
-18
2018
-19
Re
turn
(%)
-6%
6%
4%
2%
0%
2%
4%
Return on assets Return on equity
FIGURE 39. DISTRIBUTION OF GIPPSLAND FARMS BY CHANGE IN DEBT
Pro
po
rtio
n o
f fa
rms
45%
30%
35%
20%
25%
40%
10%
5%
15%
0%
Increased debt
Reduced debt
No change in debt
No debt at July 1st or June 30th
FIGURE 37. GIPPSLAND RETURN ON ASSETS (%)
Re
turn
(%)
-12%
-10%
-8%
4%
2%
0%
-2%
-4%
-6%
Return on assets Average RoA
553
555
556
574
636 638
64
3
653
66
3
66
4
66
7
69
8
755
804
1014
1017
1018
1019
1021
1022
Relative to other surveyed regions in Victoria, Gippsland has a higher proportion of farms with no financial obligations. Figure 39 indicates the movement of the financial position of businesses during the year. In 2018-19, 40 per cent of surveyed farms increased their total debt position, 25 per cent reduced debt, five per cent had no change and 30 per cent of participants had no financial obligations. Borrowed finance was used on a high proportion of farms to help cover the operating costs of the business.

Appendices

23 Livestock Farm Monitor Project | Victoria 2018 -19
Appendices : South West
Main Financial Indicators 2018-19 South WestTABLE A1
Farm No Gross Farm Income Variable Costs Overhead Costs Cost Structure O/O Allowance EBIT (Operating
income)Net Farm Income
Return on Assets Debt Ratio Return on
Equity
$/HA $/HA $/HA % $/HA $/HA $/HA % % %
14 $1,073 $640 $115 70% $119 $199 $176 3.1% 2% 2.9%39 $1,120 $567 $123 62% $53 $378 $234 3.9% 13% 3.3%43 $1,344 $482 $322 60% $50 $489 $370 8.0% 9% 10.0%55 $1,325 $461 $355 62% $7 $503 $503 5.5% 0% 5.5%66 $680 $475 $311 116% $57 -$163 -$163 -3.1% 0% -3.1%87 $646 $302 $163 72% $69 $111 $101 1.7% 2% 1.5%88 $1,065 $485 $244 68% $82 $253 $182 4.7% 7% 4.4%114 $603 $245 $155 66% $77 $126 $123 2.3% 1% 2.3%512 $1,423 $699 $154 60% $183 $387 $369 7.0% 1% 7.0%522 $904 $302 $184 54% $27 $392 $357 7.5% 4% 7.8%627 $478 $240 $169 86% $48 $21 -$56 0.4% 16% -1.6%628 $1,729 $622 $255 51% $26 $827 $729 9.3% 6% 10.8%659 $933 $349 $91 47% $137 $355 $286 6.0% 7% 7.8%693 $1,116 $554 $156 64% $252 $153 $91 1.9% 6% 1.5%715 $1,348 $357 $365 54% $169 $457 $396 4.5% 4% 4.8%751 $1,752 $824 $250 61% $68 $609 $559 8.8% 3% 9.9%754 $529 $188 $128 60% $152 $60 $32 0.6% 5% 0.3%758 $1,245 $494 $181 54% $177 $394 $238 3.6% 12% 4.3%759 $780 $246 $59 39% $77 $397 $342 6.0% 7% 6.2%761 $1,683 $506 $185 41% $176 $816 $813 9.1% 0% 9.1%807 $948 $578 $200 82% $128 $41 -$23 0.4% 7% -0.2%809 $1,657 $528 $251 47% $347 $531 $446 5.6% 5% 5.8%1006 $1,244 $437 $421 69% $225 $160 -$29 1.4% 15% -0.5%1016 $1,444 $744 $234 68% $176 $289 $269 2.9% 1% 2.9%1017 $1,480 $660 $315 66% $327 $179 $77 1.2% 7% 0.6%1018 $1,385 $473 $380 62% $143 $389 $186 2.7% 15% 1.6%
Average $1,151 $479 $222 63% $129 $321 $254 4.0% 6% 4.0%Top 20% # $1,482 $547 $239 53% $69 $627 $566 8.5% 4% 9.5%Top 20% * $1,629 $588 $259 52% $125 $657 $610 7.7% 3% 8.2%
# South West Top 20% ranked by RoA* South West Top 20% ranked by EBIT/ha

Livestock Farm Monitor Project | Victoria 2018 -19 24
Appendices : South West
Wool Sheep Production 2018-19 South West
Key Physical Data 2018-19 South West
TABLE A3
TABLE A2
Farm No Average Rainfall
2018-19 Rainfall Stocking Rate S.R. - RF S.R. - RF July Stocking
Rate P Applied P Applied P Nutrient Change
K Nutrient Change
S Nutrient Change
MM MM DSE/HA DSE/HA/ 100MM
DSE/HA/ 25MM OVER
250MMDSE/HA $/HA
KG P/GRAZED
HA/100MMKG/HA KG/HA KG/HA
14 687 557 17 3.1 1.4 13 14 2.6 14 19 1539 673 603 20 3.4 1.4 82 11 1.8 11 34 2343 600 517 17 3.2 1.6 12 20 3.8 19 7 1055 624 577 12 2.2 1.0 20 43 7.5 37 -10 4066 557 451 11 2.5 1.4 10 0 0.1 2 8 -187 653 581 13 2.3 1.0 13 5 0.9 3 -1 -188 654 575 18 3.1 1.4 11 15 2.6 13 27 16114 592 514 10 1.9 0.9 10 7 1.3 5 -1 2512 619 516 16 3.2 1.5 12 14 2.7 13 57 21522 610 579 14 2.5 1.1 14 6 1.0 5 11 3627 610 530 11 2.0 0.9 11 14 2.6 14 3 17628 652 641 28 4.4 1.8 18 17 2.6 15 33 2659 631 513 12 2.4 1.2 12 10 2.0 9 3 11693 570 532 15 2.9 1.4 14 13 2.4 11 4 -1715 744 654 23 3.5 1.4 22 17 2.5 15 21 12751 657 506 24 4.8 2.4 25 15 2.9 13 8 9754 572 582 13 2.2 1.0 11 10 1.7 8 -1 11758 750 629 20 3.1 1.3 21 15 2.3 13 25 17759 664 538 12 2.3 1.1 11 11 2.0 6 -6 -4761 840 688 19 2.8 1.1 15 16 2.3 13 11 2807 611 581 19 3.2 1.4 22 20 3.5 20 69 47809 630 513 15 3.0 1.5 21 11 2.1 7 20 10
1006 718 654 23 3.6 1.4 19 5 0.7 2 4 31016 718 655 20 3.1 1.3 15 3 0.4 0 -2 -31017 752 577 23 3.9 1.7 21 19 3.3 16 17 111018 697 589 15 2.5 1.1 11 96 16.4 91 -1 103
Average 657 571 17 3.0 1.3 18 16 2.8 14 14 14Top 20% # 672 586 21 3.5 1.6 17 15 2.5 13 14 5Top 20% * 680 585 20 3.4 1.5 20 20 3.5 17 12 13
Farm No Stocking Rate
Adult Clean Wool
Cut
Clean Wool Cut
Clean Wool Cut
Clean Wool Cut
Net Clean Wool Price
Average Wool
Micron
Average Wool Yield
Ave Sale Price
Gross Margin
Gross Margin
Gross Margin
Lamb Marking
DSE/HA KG/HD KG/HD KG/DSE KG/HA/100MM $/KG $/HD $/HA $/
HA/100MM $/DSE %
14 17.1 3.5 39.2 2.3 7.0 $19.06 17.2 65% $112 $380 $68 $22 70%39 20.4 3.6 52.1 2.6 8.6 $20.88 17.8 68% $79 $653 $108 $32 50%55 12.4 3.1 28.1 2.3 4.9 $20.45 17.3 68% $87 $470 $81 $38 85%66 11.2 2.7 22.6 2.0 5.0 $21.06 16.9 63% $109 $176 $39 $16 72%88 17.8 3.9 54.2 3.0 9.4 $21.39 19.2 70% $68 $251 $44 $14 0%114 10.0 3.2 25.6 2.6 5.0 $16.99 18.1 65% $85 $204 $40 $20 68%512 16.3 3.6 48.8 3.0 9.5 $16.77 17.0 61% $106 $662 $128 $41 105%522 14.3 3.5 36.9 2.6 6.4 $21.98 17.4 61% $72 $695 $120 $49 75%627 10.5 3.0 24.7 2.4 4.7 $21.79 16.7 73% $78 $219 $41 $21 50%659 12.4 3.6 30.6 2.5 6.0 $20.74 17.3 67% $93 $472 $92 $38 79%759 12.3 2.7 27.1 2.2 5.0 $21.67 15.8 66% $80 $570 $106 $47 82%
Average 14.1 3.3 35.4 2.5 6.5 $20.25 17.3 66% $88 $432 $79 $31 67%
# South West Top 20% ranked by RoA.* South West Top 20% ranked by EBIT/ha.

25 Livestock Farm Monitor Project | Victoria 2018 -19
Appendices : South West
Prime Lamb Production 2018-19 South WestTABLE A4
Farm No Ewe Breed Net Greasy Wool Price Gross Margin Gross Margin Gross Margin Lamb Marking Ewe
$/KG $/HA $/HA/100MM $/DSE % % OF DSE
43 Xbred $2.91 $772 $149 $47 144% 65%87 Xbred $6.50 $262 $45 $20 94% 64%88 Xbred $10.22 $572 $99 $32 104% 68%512 Merino $11.99 $353 $69 $22 96% 65%522 Xbred $6.91 $382 $66 $27 119% 93%627 Xbred $6.85 $461 $87 $44 100% 85%628 Xbred $3.49 $1,047 $163 $37 116% 66%659 Xbred $6.48 $465 $91 $38 126% 66%715 Xbred $0.72 $980 $150 $43 122% 60%751 Xbred $3.42 $538 $106 $22 131% 56%754 Xbred $5.49 $301 $52 $24 103% 58%758 Xbred $5.96 $475 $76 $24 88% 99%761 Xbred $3.65 $1,167 $170 $60 154% 81%807 Xbred $10.29 $268 $46 $14 117% 64%809 Xbred $5.83 $1,157 $226 $76 123% 93%1006 Xbred $850 $130 $37 106% 57%1016 Xbred $8.15 $220 $34 $11 94% 72%1017 Xbred $8.00 $1,116 $193 $49 148% 67%1018 Xbred $4.78 $500 $85 $35 123% 78%
Average $6.20 $626 $107 $35 116% 71%
Farm No. Stocking Rate Lamb Produced
Lamb Produced
Lamb Produced
Ave Lamb Weight
Ave Lamb Price
Ave Lamb Price
Adult Gr. Wool Cut
Greasy Wool Cut
Average Wool Micron
DSE/HA KG LWT/HA KG CWT/HA KG CWT / HA/100MM KG CWT $/KG CWT $/HD KG/HD KG/HA
43 16.6 274 126 24 16 $8.86 $143 3.0 18 3287 13.2 165 74 13 22 $6.53 $146 4.1 28 2888 17.8 293 132 23 22 $7.60 $170 2.3 18 25512 16.3 147 66 13 16 $7.11 $114 5.4 36 18522 14.3 217 98 17 21 $5.92 $125 4.3 17 29627 10.5 233 105 20 20 $6.36 $129 3.5 14 29628 28.1 480 216 34 23 $7.70 $176 3.4 35 33659 12.4 226 102 20 23 $6.33 $142 4.9 18 30715 22.8 195 88 13 10 $14.93 $156 4.4 38 34751 24.4 373 163 32 21 $7.60 $160 3.7 27 32754 12.6 248 112 19 19 $6.36 $121 4.8 36 28758 19.6 113 51 8 21 $7.71 $160 2.4 12 28761 19.4 404 182 26 24 $7.54 $181 6.6 46 30807 18.7 206 93 16 16 $7.42 $117 2.3 25 22809 15.3 435 196 38 26 $6.68 $173 3.8 27 301006 23.2 455 205 31 17 $6.68 $114 0 01016 20.4 290 131 20 21 $6.78 $140 3.7 38 271017 22.7 510 229 40 24 $7.18 $174 4.0 31 291018 14.5 273 123 21 22 $6.91 $153 4.2 28 29
Average 18.0 291 131 23 20 $7.48 $147 3.9 26 27

Livestock Farm Monitor Project | Victoria 2018 -19 26
Appendices : South West
Beef Cattle Production 2018-19 South WestTABLE A5
Farm No Stocking Rate Beef Produced Beef Produced Beef Sold Average Sale Price Average Lwt Sales Average Sale Price
DSE/HA KG LWT/HA KG LWT/HA/100MM KG LWT/HA $/HD KG LWT $/KG LWT
39 20.4 227 37.6 393 $1,186 352 $3.3787 13.2 241 41.5 250 $914 375 $2.4488 17.8 526 91.4 1712 $1,158 448 $2.59114 10.0 216 42.0 308 $1,101 521 $2.12522 14.3 215 37.2 335 $1,432 589 $2.43627 10.5 206 39.0 254 $909 389 $2.34693 15.4 333 62.6 303 $1,549 500 $3.10715 22.8 783 119.7 666 $1,021 399 $2.56751 24.4 957 189.1 1604 $938 387 $2.43754 12.6 231 39.7 234 $903 422 $2.14758 19.6 493 78.5 473 $1,363 527 $2.59807 18.7 621 106.8 943 $679 434 $1.57809 15.3 425 82.9 366 $2,378 627 $3.79
1016 20.4 307 46.9 354 $1,469 526 $2.791017 22.7 699 121.1 2174 $1,088 494 $2.20
1017 22.7 451 78.2 405 $1,167 530 $2.20Average 17.6 433 75.9 673 $1,203 470 $2.54
Farm No Gross Margin Gross Margin Gross Margin Time of Calving Calving Cow Beef Enterprise
$/HA $/HA/100MM $/DSE % %
39 -$721 -$120 -$35 Oct 9% Other87 $351 $60 $27 Mar 103% 26% Autumn88 $297 $52 $17 Mar 103% 1% Autumn114 $333 $65 $33 Oct 45% Other522 $196 $34 $14 Aug 61% 18% Spring627 $221 $42 $21 Apr 96% 31% Autumn693 $387 $73 $25 Aug 93% 100% Spring715 $721 $110 $32 Oct 100% 4% Other751 $2,213 $437 $91 Aug 98% 11% Autumn754 $377 $65 $30 Aug 88% 66% Spring758 $668 $106 $34 Sep 85% 83% Spring807 $139 $24 $7 Sep 98% 17% Spring809 $740 $144 $49 Mar 97% 52% Autumn1016 $323 $49 $16 Jul 96% 30% Autumn1017 $1,156 $200 $51 Apr 2% Autumn
1017 $264 $46 $12 Sep 100% 40% SpringAverage $479 $87 $26 94% 33%

27 Livestock Farm Monitor Project | Victoria 2018 -19
Appendices : South West
Wool Sheep Variable Costs 2018-19 South WestTABLE A6
Farm No Animal Health Contract Services
Supp Feed & Agistmt Pasture Casual Labour Freight/
CartageShearing Supplies Other Selling Costs Total Var.
Costs
$/DSE $/DSE $/DSE $/DSE $/DSE $/DSE $/DSE $/DSE $/DSE $/DSE
14 $2.81 $9.68 $15.89 $7.47 $1.00 $0.47 $0.24 $0.72 $3.14 $41.4139 $2.11 $8.07 $10.45 $7.36 $0.00 $0.38 $0.37 $0.09 $0.08 $28.9155 $6.28 $8.28 $7.47 $4.00 $0.14 $0.39 $0.50 $0.20 $3.65 $30.9066 $3.03 $8.03 $28.67 $2.27 $0.00 $0.00 $0.14 $0.93 $4.09 $47.1788 $4.36 $4.81 $16.85 $11.57 $2.64 $0.00 $0.22 $0.51 $7.82 $48.79114 $2.43 $7.91 $17.65 $4.39 $1.28 $0.10 $0.31 $0.03 $2.09 $36.20512 $5.32 $7.83 $29.91 $9.09 $0.27 $0.49 $0.47 $0.50 $5.53 $59.40522 $1.26 $9.50 $10.73 $0.00 $0.00 $0.66 $0.00 $0.56 $1.06 $23.76627 $4.47 $13.18 $0.00 $5.48 $0.00 $0.20 $0.24 $0.26 $3.32 $27.15659 $2.36 $8.13 $19.82 $5.14 $0.00 $0.33 $0.45 $0.27 $3.44 $39.93759 $3.68 $6.69 $7.15 $9.47 $0.13 $0.66 $0.32 $0.69 $3.29 $32.08
Average $3.46 $8.37 $14.96 $6.02 $0.50 $0.33 $0.30 $0.43 $3.41 $37.79
Farm No Animal Health Contract Services
Supp Feed & Agistmt Pasture Casual Labour Freight/
CartageShearing Supplies Other Selling Costs Total Var.
Costs
$/HA $/HA $/HA $/HA $/HA $/HA $/HA $/HA $/HA $/HA
14 $48 $166 $272 $128 $17 $8 $4 $12 $54 $70939 $43 $164 $213 $150 $0 $8 $8 $2 $2 $58955 $78 $103 $93 $50 $2 $5 $6 $2 $45 $38466 $34 $90 $321 $25 $0 $0 $2 $10 $46 $52888 $78 $86 $300 $206 $47 $0 $4 $9 $139 $868114 $24 $79 $176 $44 $13 $1 $3 $0 $21 $361512 $87 $128 $488 $148 $4 $8 $8 $8 $90 $969522 $18 $136 $154 $0 $0 $9 $0 $8 $15 $340627 $47 $138 $0 $57 $0 $2 $3 $3 $35 $284659 $29 $100 $245 $64 $0 $4 $6 $3 $42 $494759 $45 $82 $88 $116 $2 $8 $4 $8 $40 $393
Average $48 $116 $213 $90 $8 $5 $4 $6 $48 $538

Livestock Farm Monitor Project | Victoria 2018 -19 28
Appendices : South West
Prime Lamb Variable Costs 2018-19 South WestTABLE A7
Farm No Animal Health Contract Services
Supp Feed & Agistmt Pasture Casual Labour Freight/
CartageShearing Supplies Other Selling Costs Total Var.
Costs
$/DSE $/DSE $/DSE $/DSE $/DSE $/DSE $/DSE $/DSE $/DSE $/DSE
43 $2.82 $2.41 $11.18 $11.46 $0.00 $0.05 $0.08 $1.37 $0.07 $29.4487 $1.19 $5.54 $8.54 $9.98 $0.00 $0.74 $0.17 $0.25 $2.81 $29.2388 $2.79 $3.08 $6.24 $11.57 $1.69 $0.00 $0.14 $0.33 $1.89 $27.73
512 $3.11 $3.56 $13.71 $9.09 $0.12 $0.24 $0.22 $0.23 $6.50 $36.78522 $0.00 $0.00 $11.04 $0.00 $0.00 $0.86 $0.00 $0.00 $6.18 $18.09627 $3.85 $6.21 $0.00 $5.48 $0.00 $0.11 $0.11 $0.22 $2.05 $18.03628 $1.49 $3.50 $9.73 $6.72 $0.00 $0.00 $0.09 $0.82 $0.76 $23.11659 $1.40 $2.92 $11.73 $5.14 $0.00 $0.33 $0.16 $0.16 $1.33 $23.16715 $1.59 $3.39 $1.72 $6.68 $0.00 $0.40 $0.25 $2.10 $5.32 $21.44751 $1.37 $2.83 $21.75 $5.90 $0.26 $1.55 $0.07 $0.57 $3.03 $37.33754 $2.53 $8.74 $7.37 $4.22 $0.32 $2.73 $0.57 $0.29 $5.94 $32.69758 $0.60 $1.25 $0.00 $4.18 $0.00 $0.00 $0.01 $0.16 $4.75 $10.95761 $3.38 $7.65 $6.90 $4.81 $0.79 $1.21 $0.25 $1.56 $1.55 $28.10807 $2.92 $6.51 $14.41 $6.11 $0.00 $0.61 $0.00 $0.06 $1.17 $31.79809 $1.64 $3.42 $1.85 $6.69 $0.00 $0.13 $0.02 $0.28 $7.94 $21.99
1006 $0.00 $0.78 $5.31 $5.58 $0.00 $3.95 $0.00 $3.22 $3.75 $22.581016 $1.51 $2.05 $28.91 $7.08 $0.00 $0.14 $0.26 $0.00 $1.02 $40.971017 $3.61 $1.29 $9.88 $10.46 $0.00 $0.90 $0.12 $1.26 $1.36 $28.891018 $3.46 $3.87 $9.65 $8.49 $0.00 $0.74 $0.18 $0.63 $5.50 $32.51
Average $2.07 $3.63 $9.47 $6.82 $0.17 $0.77 $0.14 $0.71 $3.31 $27.10
Farm No Animal Health Contract Services
Supp Feed & Agistmt Pasture Casual Labour Freight/
CartageShearing Supplies Other Selling Costs Total Var.
Costs
$/HA $/HA $/HA $/HA $/HA $/HA $/HA $/HA $/HA $/HA
43 $47 $40 $185 $190 $0 $1 $1 $23 $1 $48887 $16 $73 $113 $132 $0 $10 $2 $3 $37 $38588 $50 $55 $111 $206 $30 $0 $3 $6 $34 $494
512 $51 $58 $224 $148 $2 $4 $4 $4 $106 $600522 $0 $0 $158 $0 $0 $12 $0 $0 $89 $259627 $40 $65 $0 $57 $0 $1 $1 $2 $21 $189628 $42 $98 $273 $189 $0 $0 $3 $23 $21 $650659 $17 $36 $145 $64 $0 $4 $2 $2 $16 $286715 $36 $77 $39 $152 $0 $9 $6 $48 $121 $489751 $33 $69 $532 $144 $6 $38 $2 $14 $74 $912754 $32 $110 $93 $53 $4 $34 $7 $4 $75 $412758 $12 $25 $0 $82 $0 $0 $0 $3 $93 $215761 $66 $149 $134 $93 $15 $23 $5 $30 $30 $546807 $55 $122 $270 $114 $0 $11 $0 $1 $22 $596809 $25 $52 $28 $102 $0 $2 $0 $4 $121 $336
1006 $0 $18 $123 $130 $0 $92 $0 $75 $87 $5251016 $31 $42 $591 $145 $0 $3 $5 $0 $21 $8371017 $82 $29 $224 $237 $0 $20 $3 $29 $31 $6561018 $50 $56 $140 $123 $0 $11 $3 $9 $80 $471
Average $36 $62 $178 $124 $3 $15 $2 $15 $57 $492

29 Livestock Farm Monitor Project | Victoria 2018 -19
Appendices : South West
Beef Cattle Variable Costs 2018-19 South WestTABLE A8
Farm No Enterprise Animal Health Contract Services
Supp Feed & Agistmt Pasture Casual Labour Freight/ Cartage Other Selling Costs Total Var. Costs
$/DSE $/DSE $/DSE $/DSE $/DSE $/DSE $/DSE $/DSE $/DSE
39 Other $1.45 $0.00 $0.00 $7.36 $0.00 $2.37 $0.00 $0.39 $11.5787 Autumn $1.52 $0.00 $0.00 $9.98 $0.26 $0.60 $0.07 $3.68 $16.1288 Autumn $6.41 $0.00 $69.95 $11.55 $7.34 $0.00 $0.00 $16.73 $111.99114 Other $0.67 $0.00 $4.16 $4.39 $0.43 $2.24 $0.04 $0.37 $12.30522 Spring $0.85 $0.00 $18.00 $0.00 $0.00 $1.09 $0.00 $0.55 $20.48627 Autumn $0.00 $0.00 $17.12 $5.48 $0.00 $0.00 $0.17 $4.20 $26.97693 Spring $2.21 $1.24 $18.83 $8.44 $4.77 $0.06 $1.15 $0.62 $37.32715 Other $0.00 $4.18 $0.00 $6.68 $0.00 $0.00 $0.00 $4.18 $15.04751 Autumn $0.53 $0.00 $0.00 $5.90 $0.00 $2.20 $0.00 $7.53 $16.17754 Spring $1.72 $0.02 $1.50 $4.22 $0.00 $1.43 $0.00 $3.07 $11.96758 Spring $1.81 $0.00 $19.74 $4.18 $0.00 $0.36 $0.16 $2.10 $28.35807 Spring $1.48 $1.48 $25.02 $6.11 $0.00 $1.20 $0.00 $0.00 $35.28809 Autumn $1.42 $1.78 $37.52 $6.69 $0.00 $0.10 $4.16 $3.42 $55.09
1016 Autumn $0.72 $0.00 $16.26 $7.08 $0.00 $1.68 $0.00 $0.37 $26.111017 Autumn $0.00 $0.00 $0.00 $10.46 $0.00 $0.00 $0.00 $9.26 $19.721017 Spring $4.02 $0.00 $13.04 $10.46 $0.00 $1.40 $0.93 $1.39 $31.24
Average $1.55 $0.54 $15.07 $6.81 $0.80 $0.92 $0.42 $3.62 $29.73
Farm No Animal Health Contract Services Supp Feed & Agistmt Pasture Casual Labour Freight/ Cartage Other Selling Costs Total Var. Costs
$/HA $/HA $/HA $/HA $/HA $/HA $/HA $/HA $/HA
39 $29 $0 $0 $150 $0 $48 $0 $8 $23687 $20 $0 $0 $132 $3 $8 $1 $48 $21288 $114 $0 $1,248 $206 $131 $0 $0 $298 $1,997114 $7 $0 $41 $44 $4 $22 $0 $4 $123522 $12 $0 $258 $0 $0 $16 $0 $8 $293627 $0 $0 $179 $57 $0 $0 $2 $44 $282693 $34 $19 $290 $130 $74 $1 $18 $10 $576715 $0 $95 $0 $152 $0 $0 $0 $95 $343751 $13 $0 $0 $144 $0 $54 $0 $184 $395754 $22 $0 $19 $53 $0 $18 $0 $39 $151758 $36 $0 $388 $82 $0 $7 $3 $41 $557807 $28 $28 $469 $114 $0 $22 $0 $0 $661809 $22 $27 $573 $102 $0 $1 $63 $52 $841
1016 $15 $0 $332 $145 $0 $34 $0 $8 $5341017 $0 $0 $0 $237 $0 $0 $0 $210 $4471017 $91 $0 $296 $237 $0 $32 $21 $32 $709
Average $28 $11 $256 $124 $13 $17 $7 $68 $522

Livestock Farm Monitor Project | Victoria 2018 -19 30
Appendices : South West
Pasture Costs Per Grazed Hectare 2018-19 South WestTABLE A9
Farm No Seed Chemicals Contract Services Fert & Soil Conditioners Other Total Pasture Cost
$/KG GRAZED HA $/KG GRAZED HA $/KG GRAZED HA $/KG GRAZED HA $/KG GRAZED HA $/KG GRAZED HA
14 $10 $3 $10 $116 $2 $14139 $12 $3 $0 $129 $0 $15243 $13 $11 $45 $116 $0 $19455 $9 $3 $5 $23 $0 $4066 $5 $5 $11 $4 $0 $2587 $17 $1 $30 $55 $19 $13488 $34 $14 $33 $144 $0 $225114 $3 $2 $3 $28 $0 $44512 $0 $7 $0 $147 $0 $166522 $0 $0 $0 $0 $0 $0627 $0 $0 $1 $56 $0 $57628 $50 $5 $9 $100 $34 $199659 $0 $6 $0 $63 $0 $68693 $19 $1 $56 $60 $2 $138715 $7 $18 $1 $128 $0 $152751 $20 $12 $3 $113 $8 $157754 $0 $8 $3 $44 $0 $54758 $0 $0 $0 $88 $0 $88759 $14 $9 $25 $29 $0 $81761 $46 $28 $45 $0 $3 $122807 $14 $7 $0 $107 $0 $128809 $37 $3 $0 $84 $0 $1251006 $27 $0 $0 $103 $0 $1301016 $17 $9 $0 $94 $40 $1611017 $50 $22 $0 $148 $29 $2491018 $19 $9 $3 $57 $18 $106
Average $16 $7 $11 $78 $6 $121Top 20% # $26 $11 $21 $66 $9 $134Top 20% * $32 $10 $12 $64 $9 $129
# South West Top 20% ranked by RoA* South West Top 20% ranked by EBIT/ha
Overhead Costs Per Hectare 2018-19 South WestTABLE A10
Farm No Paid Labour Fuel & Vehicle Insurance R&M - Plant and Equip.
R&M - Land and Improv. Admin Rates & Rents Sundries Depreciation Total Overheads
$/HA $/HA $/HA $/HA $/HA $/HA $/HA $/HA $/HA $/HA14 $8 $7 $11 $9 $19 $33 $15 $0 $13 $11539 $36 $10 $6 $1 $6 $24 $19 $0 $21 $12343 $97 $25 $8 $16 $84 $29 $14 $0 $48 $32255 $187 $8 $13 $14 $61 $14 $26 $0 $32 $35566 $130 $20 $11 $13 $54 $13 $23 $4 $43 $31187 $61 $18 $7 $8 $29 $16 $12 $2 $12 $16388 $43 $28 $27 $22 $30 $43 $16 $0 $35 $244114 $29 $22 $17 $3 $38 $18 $14 $3 $12 $155512 $14 $14 $17 $8 $17 $23 $16 $8 $37 $154522 $49 $15 $6 $3 $58 $10 $15 $0 $28 $184627 $10 $17 $20 $24 $47 $10 $19 $0 $23 $169628 $140 $8 $14 $10 $5 $38 $25 $0 $15 $255659 $0 $19 $6 $6 $8 $9 $17 $0 $25 $91693 $1 $22 $11 $21 $6 $28 $23 $4 $41 $156715 $25 $62 $15 $22 $49 $59 $103 $5 $24 $365751 $55 $2 $14 $25 $60 $28 $20 $0 $46 $250754 $1 $14 $9 $2 $31 $22 $14 $1 $33 $128758 $4 $35 $13 $4 $75 $23 $12 $1 $14 $181759 $1 $1 $8 $5 $3 $12 $10 $0 $20 $59761 $41 $0 $10 $39 $17 $25 $24 $0 $31 $185807 $16 $32 $18 $13 $3 $29 $25 $1 $62 $200809 $15 $41 $38 $40 $25 $24 $11 $1 $56 $251
1006 $76 $0 $3 $42 $142 $95 $22 $11 $30 $4211016 $42 $15 $17 $22 $52 $40 $17 $10 $20 $2341017 $0 $12 $23 $46 $24 $55 $22 $2 $131 $3151018 $10 $10 $22 $19 $84 $78 $14 $7 $136 $380
Average $42 $18 $14 $17 $40 $31 $21 $2 $38 $222Top 20% # $71 $6 $11 $19 $35 $25 $21 $0 $30 $218Top 20% * $87 $12 $18 $26 $34 $26 $21 $0 $36 $259
# South West Top 20% ranked by RoA* South West Top 20% ranked by EBIT/ha

31 Livestock Farm Monitor Project | Victoria 2018 -19
Capital Structure 2018-19 South WestTABLE A11
Farm Labour Efficiency and Enterprise Mix 2018-19 South WestTABLE A12
Average Top 20% # Top 20% *FARM AREA (HA)
Freehold Area 1,067 1357 1292
Area Leased In 89 286 1
Area Leased Out 0 0 0
Effective Area 1,064 1,498 1,099
LAND VALUES
Total Land Value per Effective Hectare $6,335 $5,274 $6,424
Total Land Value per DSE $386 $262 $361
Owned Land Value per Hectare $6,079 $5,266 $5,655
Leased Land Value per Hectare $3,354 $0 $4,878
OTHER ASSETS (per Effective Hectare)
Plant & Vehicles $373 $393 $473
Livestock $1,317 $1,488 $1,583
Hay & Grain on Hand $60 $25 $58
Other Assets $245 $42 $136
Total Assets $8,330 $7,221 $8,674
LIABILITIES
Liabilities per Effective Hectare $1,154 $1,301 $1,021
EQUITY
Equity per Effective Hectare $6,828 $5,920 $7,631
Average Equity % 83% 81% 88%
RATIOS
Debt Ratio 6% 4% 3%
Plant & Equipment Ratio 4.1 4.1 3.7
Average Top 20% # Top 20% *
SHEEP ENTERPRISES
Average Sheep Number 6,591 10,793 8,408
Sheep Labour Efficiency (ha/person) 499 558 356
Sheep Labour Efficiency (DSE/person) 8,016 10,632 7,379
BEEF ENTERPRISES
Average Cattle Number 234 200 73
Cattle Labour Efficiency (ha/person) 707 569 428
Cattle Labour Efficiency (DSE/person) 11,074 12,137 10,155
TOTAL LABOUR EFFICIENCY
Hectares per person 422 451 328
DSE per person 7,406 9,544 7,421
ENTERPRISE MIX
Wool Sheep (%) 28% 14% 15%
Prime Lambs (%) 48% 79% 66%
Beef (%) 20% 6% 12%
Hay/Cropping (%) 4% 1% 7%
Appendices : South West
# South West Top 20% ranked by RoA* South West Top 20% ranked by EBIT/ha
# South West Top 20% ranked by RoA* South West Top 20% ranked by EBIT/ha

Livestock Farm Monitor Project | Victoria 2018 -19 32
Appendices : South West
Supplementary Feed Data 2018-19 South WestTABLE A13
Yield (Wet T/HA)
Amount Fed to Sheep (Average wet KG/DSE)
Amount Fed to Cattle (Average wet KG/DSE)
Area Cut (HA)
Farm No Pasture Hay Silage Pasture Hay Silage Grain Pasture Hay Silage Grain Pasture Hay Silage
14 3.3 25.7 0.0 16.7 100 039 2.8 0.5 0.0 20.4 0.0 0.0 0.0 25 043 5.0 6.8 0.0 12.2 32 055 2.8 1.9 0.0 15.1 0 7566 43.8 0.0 31.4 0 087 6.0 0.0 23.6 9.8 0.0 30.4 0.0 0 10088 4.7 6.4 5.9 22.8 0.9 139.5 104.6 0.0 60 47114 4.7 0.0 30.4 29.2 0.0 1.8 0.0 0 45512 7.8 4.5 21.8 32.3 21.8 24 70522 3.4 5.9 0.0 0.0 21.3 16.5 0.0 23.8 40 107627 2.6 0.0 0.0 0.0 81.9 0.0 0.0 3 0628 7.5 0.0 14.6 21.0 0 50659 3.1 34.3 0.0 7.1 87 0693 5.1 46.5 0.0 0.0 28 0715 0.0 0.0 0.8 0.0 0.0 0.0 0 0751 17.0 0.0 71.3 17.9 0.0 0.0 0.0 0 100754 1.6 2.4 0.0 2.5 16.8 0.0 0.0 0.0 16 5758 3.2 0.0 0.0 0.0 33.3 0.0 0.0 46 0759 0.0 0.0 17.9 0 0761 7.2 2.8 17.3 5.7 0 49807 2.3 22.2 0.0 16.0 49.2 0.0 0.0 80 0809 3.5 5.4 5.2 0.0 0.0 73.2 41.7 0.0 41 161006 14.8 0.0 0.0 0 01016 11.0 70.9 0.0 0.0 45.3 0.0 0.0 204 01017 6.3 0.0 0.0 12.8 0.0 28.3 1.8 0 121018 4.6 6.3 14.3 8.6 7.0 56 16
Average 4.3 6.3 10.8 8.9 12.1 32.4 13.8 1.7 32 27

33 Livestock Farm Monitor Project | Victoria 2018 -19
Appendices : South West
Average Whole Farm Economic Performance – South WestTABLE A14
Note: ‘Real’ dollar values are the nominal values converted to 2018-19 dollar equivalents by the C.P.I. to allow for inflation. The data in the above table from 1970-71 to 2008-09 has been obtained from the South West Farm Monitor Project. Data from 2009-10 onwards has been obtained from the Livestock Farm Monitor Project.
Year Gross Income Variable Costs Overhead Costs Net Income EBIT (Operating Profit)
Return on Assets
Return on Equity
NOMINAL ($/HA)
REAL($/HA)
NOMINAL ($/HA)
REAL($/HA)
NOMINAL ($/HA)
REAL($/HA)
NOMINAL ($/HA)
REAL($/HA)
NOMINAL ($/HA)
REAL($/HA) % %
1970-71 $46 $516 $15 $168 $10 $112 $20 $225 2.9% 3.3%1971-72 $46 $485 $12 $126 $11 $116 $22 $232 3.8% 3.2%1972-73 $86 $838 $14 $136 $12 $117 $60 $585 12.6% 14.4%1973-74 $111 $944 $20 $170 $18 $153 $73 $621 12.6% 15.3%1974-75 $66 $480 $16 $116 $17 $124 $33 $240 3.1% 4.8%1975-76 $68 $442 $21 $136 $19 $123 $27 $175 2.7% 3.1%1976-77 $90 $515 $23 $132 $21 $120 $46 $263 6.6% 6.8%1977-78 $94 $498 $30 $159 $23 $122 $40 $212 4.7% 4.6%1978-79 $137 $668 $32 $156 $31 $151 $74 $361 6.3% 6.4%1979-80 $167 $734 $40 $176 $30 $132 $97 $427 6.7% 6.9%1980-81 $156 $631 $58 $235 $33 $134 $65 $263 2.9% 3.7%1981-82 $130 $475 $49 $179 $38 $139 $42 $153 1.0% 0.4%1982-83 $122 $401 $53 $174 $39 $128 $30 $99 -0.1% -0.2%1983-84 $188 $594 $48 $152 $43 $136 $97 $307 5.1% 4.0%1984-85 $191 $566 $54 $160 $46 $136 $91 $270 4.4% 3.5%1985-86 $197 $538 $51 $139 $45 $123 $101 $276 3.8% 3.3%1986-87 $235 $587 $53 $132 $49 $122 $133 $332 6.1% 5.4%1987-88 $335 $782 $75 $175 $59 $138 $200 $467 9.5% 9.3%1988-89 $343 $744 $80 $174 $61 $132 $202 $438 7.7% 7.2%1989-90 $326 $657 $90 $181 $66 $133 $170 $342 5.8% 4.6%1990-91 $221 $431 $73 $142 $57 $111 $91 $177 2.1% -0.5%1991-92 $190 $366 $68 $131 $55 $106 $67 $129 1.0% -2.2%1992-93 $198 $374 $67 $127 $54 $102 $77 $145 1.5% -1.1%1993-94 $220 $409 $85 $158 $54 $99 $82 $151 1.8% 0.1%1994-95 $278 $494 $104 $184 $84 $149 $91 $162 2.5% 0.9%1995-96 $273 $471 $98 $169 $82 $141 $93 $161 2.6% 0.8%1996-97 $287 $493 $113 $194 $76 $131 $97 $167 2.7% 1.1%1997-98 $302 $515 $117 $200 $80 $137 $104 $177 2.6% 1.3%1998-99 $285 $481 $116 $197 $79 $133 $90 $151 1.8% 0.3%1999-00 $308 $504 $126 $206 $80 $131 $102 $166 2.1% 0.8%2000-01 $418 $645 $125 $193 $95 $146 $198 $306 5.4% 5.2%2001-02 $536 $805 $150 $224 $102 $154 $284 $427 7.6% 8.7%2002-03 $515 $752 $200 $292 $106 $154 $209 $305 4.7% 4.9%2003-04 $519 $740 $183 $260 $85 $122 $251 $358 5.0% 5.7%2004-05 $501 $697 $206 $287 $92 $128 $203 $282 $137 $191 3.0% 2.3%2005-06 $453 $606 $202 $271 $91 $122 $160 $214 $80 $107 1.6% 1.2%2006-07 $429 $562 $239 $313 $103 $135 $87 $114 $27 $35 0.0% -2.9%2007-08 $636 $798 $260 $326 $122 $153 $255 $320 $189 $237 3.1% 2.4%2008-09 $602 $744 $274 $339 $130 $161 $199 $246 $82 $101 2.2% 1.0%2009-10 $658 $788 $259 $310 $121 $145 $278 $333 $210 $252 3.2% 2.5%2010-11 $793 $917 $214 $248 $137 $158 $442 $511 $366 $423 5.7% 5.7%2011-12 $696 $795 $341 $389 $137 $157 $293 $335 $225 $257 3.7% 3.3%2012-13 $547 $610 $285 $318 $141 $157 $121 $135 $60 $67 1.0% -1.2%2013-14 $608 $659 $252 $273 $150 $163 $206 $223 $142 $154 2.2% 0.8%2014-15 $698 $745 $319 $341 $158 $169 $221 $236 $153 $163 2.3% 1.8%2015-16 $764 $808 $306 $323 $159 $168 $299 $316 $228 $241 3.4% 2.9%2016-17 $752 $780 $221 $229 $180 $187 $179 $186 $457 $474 6.9% 8.0%2017-18 $1,061 $1,078 $344 $350 $194 $197 $317 $322 $389 $395 5.5% 5.8%2018-19 $1,151 $1,151 $479 $479 $222 $222 $254 $254 $321 $321 4.0% 4.0%
Long Term Average $639 $217 $139 $271 $228 4.1% 3.5%2018-19 vs LT avg $512 $262 $82 -$16 $94 0.0% 0.5%

Livestock Farm Monitor Project | Victoria 2018 -19 34
Appendices : South West
Note: ‘Real’ dollar values are the nominal values converted to 2018-19 dollar equivalents by the C.P.I. to allow for inflation. The data in the above table from 1970-71 to 2008-09 has been obtained from the South West Farm Monitor Project. Data from 2009-10 onwards has been obtained from the Livestock Farm Monitor Project.
Year Wool Sheep Prime Lambs Beef Cattle
NOMINAL ($/DSE)
REAL ($/DSE)
NOMINAL($/HA)
REAL($/HA)
NOMINAL ($/DSE)
REAL ($/DSE)
NOMINAL($/HA)
REAL($/HA)
NOMINAL ($/DSE)
REAL ($/DSE)
NOMINAL($/HA)
REAL($/HA)
1970-71 $2 $17 $18 $202 $2 $25 $31 $348 $3 $31 $40 $449 1971-72 $2 $23 $27 $285 $3 $27 $31 $327 $3 $31 $35 $369 1972-73 $8 $82 $96 $935 $8 $77 $96 $935 $3 $29 $34 $331 1973-74 $9 $75 $105 $893 $9 $79 $108 $918 $5 $44 $60 $510 1974-75 $5 $37 $53 $385 $6 $42 $67 $487 $1 $10 $16 $116 1975-76 $5 $33 $63 $409 $7 $46 $98 $636 -$0 -$2 -$3 -$19 1976-77 $7 $40 $85 $486 $9 $54 $115 $658 $1 $6 $12 $69 1977-78 $7 $35 $83 $440 $8 $42 $100 $530 -$1 -$5 -$12 -$64 1978-79 $9 $45 $114 $556 $9 $43 $98 $478 $8 $38 $100 $487 1979-80 $10 $45 $122 $537 $10 $44 $128 $563 $8 $36 $91 $400 1980-81 $8 $31 $86 $348 $8 $32 $116 $469 $3 $14 $41 $166 1981-82 $7 $26 $78 $285 $6 $20 $69 $252 $2 $7 $21 $77 1982-83 $6 $20 $64 $210 $7 $25 $96 $316 -$3 -$9 -$27 -$89 1983-84 $12 $37 $121 $382 $9 $27 $99 $313 $9 $27 $79 $250 1984-85 $12 $35 $129 $382 $9 $26 $118 $350 $10 $30 $110 $326 1985-86 $12 $33 $131 $358 $13 $35 $159 $434 $10 $28 $107 $292 1986-87 $15 $37 $157 $392 $20 $50 $255 $637 $11 $28 $125 $312 1987-88 $25 $59 $262 $612 $21 $49 $251 $586 $10 $22 $112 $261 1988-89 $24 $51 $249 $540 $23 $49 $264 $573 $10 $22 $110 $239 1989-90 $19 $37 $196 $395 $17 $34 $212 $427 $9 $17 $100 $201 1990-91 $10 $20 $106 $206 $12 $23 $139 $271 $11 $22 $147 $286 1991-92 $8 $16 $85 $164 $11 $22 $110 $212 $10 $20 $110 $212 1992-93 $9 $16 $86 $162 $13 $25 $174 $329 $13 $24 $142 $268 1993-94 $9 $16 $85 $158 $13 $24 $158 $294 $13 $23 $133 $247 1994-95 $14 $25 $139 $247 $14 $25 $201 $357 $7 $13 $83 $148 1995-96 $12 $20 $118 $203 $20 $35 $250 $432 $6 $11 $77 $133 1996-97 $12 $21 $143 $245 $17 $30 $282 $485 $3 $5 $42 $71 1997-98 $12 $21 $139 $237 $17 $29 $228 $390 $7 $11 $91 $155 1998-99 $9 $15 $108 $182 $15 $25 $204 $345 $11 $18 $140 $236 1999-00 $12 $20 $144 $236 $12 $19 $173 $283 $10 $17 $131 $215 2000-01 $17 $26 $221 $341 $17 $26 $251 $388 $21 $32 $292 $450 2001-02 $23 $35 $284 $427 $28 $41 $421 $632 $23 $34 $335 $502 2002-03 $16 $23 $232 $339 $20 $29 $346 $506 $11 $16 $190 $277 2003-04 $16 $23 $243 $347 $25 $35 $380 $542 $21 $30 $339 $484 2004-05 $13 $18 $201 $279 $20 $28 $314 $436 $20 $28 $309 $430 2005-06 $8 $10 $119 $159 $15 $20 $247 $330 $11 $15 $179 $239 2006-07 $8 $11 $112 $147 $11 $14 $139 $182 $9 $12 $177 $232 2007-08 $14 $18 $236 $296 $13 $16 $257 $322 $14 $18 $268 $336 2008-09 $12 $15 $179 $221 $18 $22 $271 $335 $20 $24 $312 $385 2009-10 $17 $21 $267 $320 $30 $36 $459 $550 $16 $19 $243 $291 2010-11 $37 $43 $550 $636 $41 $47 $628 $726 $32 $37 $538 $622 2011-12 $28 $32 $382 $437 $28 $32 $453 $517 $22 $25 $322 $368 2012-13 $12 $14 $166 $185 $15 $17 $232 $259 $16 $18 $237 $264 2013-14 $12 $13 $158 $171 $27 $30 $428 $464 $19 $21 $287 $311 2014-15 $14 $15 $188 $201 $25 $27 $394 $421 $30 $32 $414 $442 2015-16 $18 $19 $210 $222 $32 $34 $497 $525 $42 $44 $618 $653 2016-17 $42 $44 $362 $376 $53 $55 $496 $515 $47 $49 $484 $502 2017-18 $47 $47 $670 $680 $38 $39 $722 $734 $70 $71 $1,279 $1,300 2018-19 $31 $31 $432 $432 $35 $35 $626 $626 $26 $26 $479 $479
Long Term Average $29 $353 $34 $462 $23 $311 2018-19 vs LT avg $1 $79 $1 $163 $3 $168
Historical Gross Margins For Livestock EnterprisesTABLE A15

35 Livestock Farm Monitor Project | Victoria 2018 -19
Historical Data For Selected Average Profitability Indicators - South West
TABLE A16
Year Stocking Rate Wool Sheep
Micron Wool Cut (Gr.)
Net Wool Price Average Sale Price Lamb
DSE/HA (KG/HA) NOMINAL ($/KG) GR.
REAL ($/KG) GR.
NOMINAL($/HD)
REAL($/HD) %
1970-71 15.3 42 $0.71 $7.97 $3 $30 78%1971-72 14.0 43 $0.83 $8.75 $3 $26 66%1972-73 12.2 42 $2.25 $21.92 $7 $65 64%1973-74 12.5 47 $1.84 $15.64 $12 $103 81%1974-75 12.1 51 $1.30 $9.45 $4 $31 81%1975-76 13.6 51 $1.43 $9.28 $4 $25 84%1976-77 12.9 47 $1.88 $10.75 $9 $49 77%1977-78 14.0 46 $1.96 $10.38 $10 $52 79%1978-79 12.7 48 $2.05 $9.99 $16 $78 80%1979-80 13.0 42 $2.58 $11.35 $18 $80 85%1980-81 12.8 40 $2.60 $10.52 $17 $68 77%1981-82 12.0 36 $2.71 $9.90 $12 $44 72%
1982-83 11.7 38 $2.66 $8.74 $8 $27 79%
1983-84 11.7 42 $2.84 $8.98 $16 $51 83%1984-85 13.1 45 $3.17 $9.40 $14 $41 83%1985-86 12.0 44 $3.48 $9.51 $12 $33 84%1986-87 12.2 43 $4.02 $10.05 $17 $41 79%1987-88 11.8 43 $7.03 $16.41 $17 $41 82%1988-89 12.1 43 $6.84 $14.84 $19 $41 82%1989-90 12.4 45 $5.99 $12.07 $11 $22 77%1990-91 11.8 21.3 41 $4.30 $8.38 $5 $10 75%1991-92 11.4 21.3 38 $3.67 $7.06 $8 $16 71%1992-93 11.6 21.7 44 $2.95 $5.57 $13 $25 71%1993-94 11.3 21.3 37 $3.59 $6.67 $13 $25 72%1994-95 11.1 21.2 38 $5.60 $9.96 $15 $26 76%1995-96 12.4 21.3 45 $3.70 $6.38 $21 $36 77%1996-97 13.9 20.9 46 $4.50 $7.73 $19 $32 77%1997-98 13.3 20.7 42 $4.63 $7.91 $20 $35 75%1998-99 14.2 20.8 51 $3.45 $5.83 $17 $28 81%1999-00 14.4 20.4 52 $4.44 $7.26 $13 $21 84%2000-01 14.9 20.2 52 $5.57 $8.60 $26 $39 77%2001-02 15.2 20.1 55 $5.78 $8.68 $43 $65 77%2002-03 15.6 19.5 51 $6.90 $10.09 $35 $51 73%2003-04 16.0 19.4 54 $5.73 $8.17 $43 $62 72%2004-05 15.8 19.2 55 $5.32 $7.40 $41 $57 78%2005-06 15.5 18.9 43 $5.45 $7.29 $35 $47 76%2006-07 14.6 18.7 51 $6.40 $8.39 $30 $40 74%2007-08 17.5 18.4 52 $6.26 $7.85 $40 $50 79%2008-09 16.2 18.3 49 $6.28 $7.76 $44 $54 75%2009-10 16.0 18.2 48 $6.53 $7.82 $69 $83 73%2010-11 15.8 18.6 48 $9.51 $11.00 $104 $120 72%2011-12 15.3 18.4 44 $8.81 $10.07 $69 $79 84%2012-13 15.4 17.7 45 $7.85 $8.76 $42 $47 76%2013-14 15.0 17.5 44 $7.54 $8.17 $48 $52 67%2014-15 14.8 17.7 45 $7.60 $8.11 $64 $68 76%2015-16 14.0 17.8 38 $8.58 $9.07 $66 $70 81%2016-17 9.9 17.8 31 $11.70 $12.14 $104 $108 75%2017-18 17.8 17.4 49 $14.74 $14.97 $86 $87 79%
2018-19 17.0 17.3 54 $13.39 $13.39 $88 $88 67%
Long Term Average 13.7 19.4 45 $9.72 $50 77%
2018-19 vs LT avg 3.3 -2.0 8 $3.66 $38 -10%
Appendices : South West

Livestock Farm Monitor Project | Victoria 2018 -19 36
Historical Data For Selected Average Profitability Indicators - South West
TABLE A16 [CONTD.]
Year Prime Lamb Beef Cattle
Wool Cut (Gr.) Net Wool Price Average Sale Price Lamb Calving Average Sale Price
KG/HA NOMINAL ($/KG) GR.
REAL ($/KG) GR.
NOMINAL ($/HD)
REAL ($/HD) % % NOMINAL
($/HD)REAL($/HD)
1970-71 28 $0.68 $7.63 $4 $46 100% 93% $93 $1,044 1971-72 46 $0.74 $7.80 $4 $40 87% 89% $90 $949 1972-73 35 $1.95 $19.00 $7 $66 90% 89% $97 $945 1973-74 39 $1.23 $10.46 $14 $122 88% 92% $134 $1,139 1974-75 43 $0.94 $6.84 $6 $44 99% 92% $56 $407 1975-76 45 $1.33 $8.64 $7 $42 105% 91% $40 $260 1976-77 42 $1.66 $9.50 $10 $58 101% 87% $55 $315 1977-78 45 $1.66 $8.79 $13 $66 104% 84% $69 $365 1978-79 32 $1.89 $9.21 $17 $81 96% 91% $188 $916 1979-80 31 $2.07 $9.10 $21 $91 96% 90% $263 $1,157 1980-81 32 $1.90 $7.69 $19 $77 94% 90% $235 $951 1981-82 30 $2.39 $8.73 $13 $49 69% 90% $172 $628
1982-83 40 $1.99 $6.54 $11 $36 94% 93% $180 $592
1983-84 41 $1.93 $6.10 $19 $59 97% 95% $332 $1,049 1984-85 40 $2.20 $6.52 $15 $45 102% 88% $322 $955 1985-86 36 $2.30 $6.28 $18 $48 103% 87% $362 $989 1986-87 44 $2.92 $7.30 $25 $62 104% 89% $363 $907 1987-88 37 $4.79 $11.18 $25 $57 108% 90% $371 $866 1988-89 41 $4.24 $9.20 $26 $55 101% 86% $389 $844 1989-90 43 $3.39 $6.83 $24 $48 106% 89% $406 $818 1990-91 41 $1.79 $3.49 $21 $40 115% 89% $381 $742 1991-92 26 $2.82 $5.43 $19 $37 95% 88% $352 $678 1992-93 43 $2.53 $4.78 $33 $62 97% 88% $416 $786 1993-94 41 $2.64 $4.91 $37 $69 100% 84% $454 $843 1994-95 43 $3.67 $6.52 $32 $57 96% 88% $390 $693 1995-96 38 $3.23 $5.57 $48 $82 92% 88% $421 $725 1996-97 38 $3.84 $6.60 $39 $67 98% 89% $311 $535 1997-98 34 $3.49 $5.95 $38 $64 95% 90% $330 $563 1998-99 36 $2.48 $4.18 $33 $56 98% 91% $411 $694 1999-00 36 $2.85 $4.67 $30 $49 101% 91% $461 $755 2000-01 41 $3.32 $5.13 $38 $58 100% 92% $616 $951 2001-02 41 $4.25 $6.38 $61 $92 102% 89% $729 $1,094 2002-03 36 $5.28 $7.72 $62 $91 98% 90% $546 $798 2003-04 35 $3.95 $5.64 $71 $101 97% 88% $661 $942 2004-05 33 $3.62 $5.04 $67 $93 99% 88% $715 $994 2005-06 32 $2.96 $3.96 $56 $75 107% 86% $655 $876 2006-07 32 $3.94 $5.16 $56 $73 98% 89% $502 $658 2007-08 33 $3.57 $4.48 $62 $78 101% 85% $586 $735 2008-09 34 $3.13 $3.87 $74 $92 110% 88% $732 $904 2009-10 36 $4.10 $4.91 $91 $109 104% 90% $702 $841 2010-11 34 $5.74 $6.64 $123 $143 101% 87% $853 $987 2011-12 32 $4.49 $5.14 $95 $109 112% 84% $774 $885 2012-13 30 $4.19 $4.68 $70 $78 108% 85% $666 $743 2013-14 28 $5.15 $5.58 $95 $103 102% 88% $732 $793 2014-15 31 $4.81 $5.14 $95 $101 116% 87% $794 $848 2015-16 32 $5.15 $5.44 $101 $107 117% 93% $1,126 $1,190 2016-17 19 $6.60 $6.85 $134 $139 113% 85% $1,576 $1,635 2017-18 32 $4.94 $5.02 $129 $131 115% 91% $1,373 $1,395
2018-19 26 $6.20 $6.20 $147 $147 116% 94% $1,203 $1,203
Long Term Average 36 $6.70 $75 101% 89% $849
2018-19 vs LT avg -10 -$0.50 $72 15% 5% $355
Note: ‘Real’ dollar values are the nominal values converted to 2018-19 dollar equivalents by the C.P.I. to allow for inflation. The data in the above table from 1970-71 to 2008-09 has been obtained from the South West Farm Monitor Project. Data from 2009-10 onwards has been obtained from the Livestock Farm Monitor Project.
Appendices : South West

37 Livestock Farm Monitor Project | Victoria 2018 -19
Appendices : Northern Victoria
Main Financial Indicators 2018-19 NorthernTABLE B1
Farm No Gross Farm Income Variable Costs Overhead Costs Cost Structure O/O Allowance EBIT (Operating
income) Net Farm Income
Return on Assets Debt Ratio Return on
Equity
$/HA $/HA $/HA % $/HA $/HA $/HA % % %
584 $1,451 $700 $198 62% $25 $527 $366 4.4% 11% 6.4%
585 $302 $88 $87 58% $92 $36 $15 0.7% 7% 0.3%
586 $467 $211 $188 85% $111 -$43 -$43 -0.6% 0% -0.6%
588 $670 $182 $82 39% $61 $345 $316 6.2% 4% 7.2%
589 $470 $179 $148 70% $150 -$7 -$89 -0.1% 17% -1.2%
599 $904 $413 $76 54% $143 $272 $195 4.0% 9% 5.3%
614 $400 $126 $94 55% $79 $100 $61 1.3% 10% 1.5%
630 $613 $115 $123 39% $161 $214 $198 3.3% 3% 3.3%
678 $364 $258 $110 101% $201 -$205 -$295 -2.5% 25% -6.2%
683 $460 $124 $381 110% $31 -$77 -$77 -0.6% 0% -0.6%
688 $679 $111 $152 39% $16 $399 $399 7.7% 0% 8.0%
706 $618 $262 $338 97% $178 -$160 -$297 -1.9% 22% -4.2%
707 $990 $248 $101 35% $33 $608 $556 5.6% 5% 6.8%
708 $671 $221 $153 56% $49 $248 $248 2.3% 0% 2.3%
709 $583 $85 $78 28% $205 $214 $173 2.9% 7% 2.5%
711 $765 $309 $204 67% $235 $18 $4 0.3% 2% 0.1%
744 $755 $245 $193 58% $101 $215 $140 5.6% 10% 12.3%
745 $894 $556 $151 79% $90 $97 $61 1.3% 4% 1.2%
756 $600 $289 $121 68% $113 $77 -$76 1.0% 26% -2.3%
757 $1,438 $800 $448 87% $0 $189 $166 1.4% 2% 1.3%
800 $612 $441 $344 128% $0 -$173 -$174 -1.4% 0% -1.4%
802 $794 $910 $176 137% $177 -$469 -$735 -7.5% 34% -32.7%
803 $511 $339 $109 88% $114 -$51 -$62 -0.8% 2% -1.0%
1012 $155 $209 $91 193% $174 -$319 -$319 -4.9% 0% -4.9%
1013 $1,042 $703 $338 100% $151 -$150 -$336 -1.4% 18% -4.8%
1015 $473 $575 $190 162% $561 -$853 -$944 -12.5% 19% -17.7%
Average $680 $335 $180 81% $125 $40 -$21 0.5% 9% -0.7%
Top 20% # $909 $297 $145 47% $47 $419 $355 5.9% 6% 8.1%
Top 20% * $939 $331 $122 46% $56 $430 $366 5.6% 6% 6.7%
# Northern Top 20% ranked by RoA* Northern Top 20% ranked by EBIT/ha

Livestock Farm Monitor Project | Victoria 2018 -19 38
Appendices : Northern Victoria
Key Physical Data 2018-19 NorthernTABLE B2
# Northern Top 20% ranked by RoA* Northern Top 20% ranked by EBIT/ha
Farm No Average Rainfall
2018-19 Rainfall Stocking Rate SR-RF SR-RF July Stocking
Rate P Applied P Applied P Nutrient Change
K Nutrient Change
S Nutrient Change
MM MM DSE/HA DSE/HA/ 100MM
DSE/HA/ 25MM OVER
250MMDSE/HA KG P/
GRAZED HA
KG P/GRAZED
HA/100MMKG/HA KG/HA KG/HA
584 705 700 19 2.8 1.1 17 19 2.7 18 8 20585 775 568 9 1.5 0.7 7 0 0.0 -1 2 -1586 518 417 7 1.7 1.0 6 0 0.0 0 1 -1588 570 408 9 2.1 1.4 8 5 1.2 4 4 11589 579 502 13 2.6 1.3 12 0 0.0 0 2 -1599 695 510 13 2.6 1.3 10 2 0.3 1 1 -2614 468 433 7 1.7 1.0 8 0 0.0 -1 -2 -1630 729 547 11 2.0 0.9 12 6 1.0 4 -1 5678 521 385 8 2.2 1.6 8 7 1.8 8 10 8683 669 425 7 1.7 1.0 10 2 0.4 1 0 2688 695 464 11 2.4 1.3 10 7 1.6 6 1 1706 439 332 3 0.7 0.8 5 8 2.3 7 16 37707 950 911 14 1.5 0.5 12 9 1.0 6 -3 9708 845 640 14 2.2 0.9 15 9 1.5 9 5 11709 755 638 10 1.5 0.6 8 1 0.1 -2 -1 -3711 586 615 7 1.1 0.5 12 6 1.0 3 -4 2744 457 332 4 1.2 1.2 6 13 4.0 10 -4 1745 853 594 15 2.6 1.1 12 12 2.1 12 1 13756 770 473 10 2.0 1.1 7 3 0.6 2 6 6757 669 542 18 3.3 1.6 15 12 2.3 9 2 7800 707 575 11 2.0 0.9 11 2 0.3 1 3 -1802 547 341 10 3.1 2.9 9 19 5.7 24 53 9803 519 518 6 1.1 0.5 7 7 1.4 8 4 8
1012 625 391 4 1.1 0.7 9 4 1.1 4 1 51013 797 775 21 2.7 1.0 2 18 2.3 16 12 -11015 840 602 11 1.8 0.8 10 0 0.0 1 12 1
Average 665 525 10 2.0 1.1 9 7 1.3 6 5 6Top 20% # 675 563 11 2.0 1.1 11 11 2.1 9 1 8Top 20% * 723 599 13 2.3 1.1 11 8 1.4 7 2 8
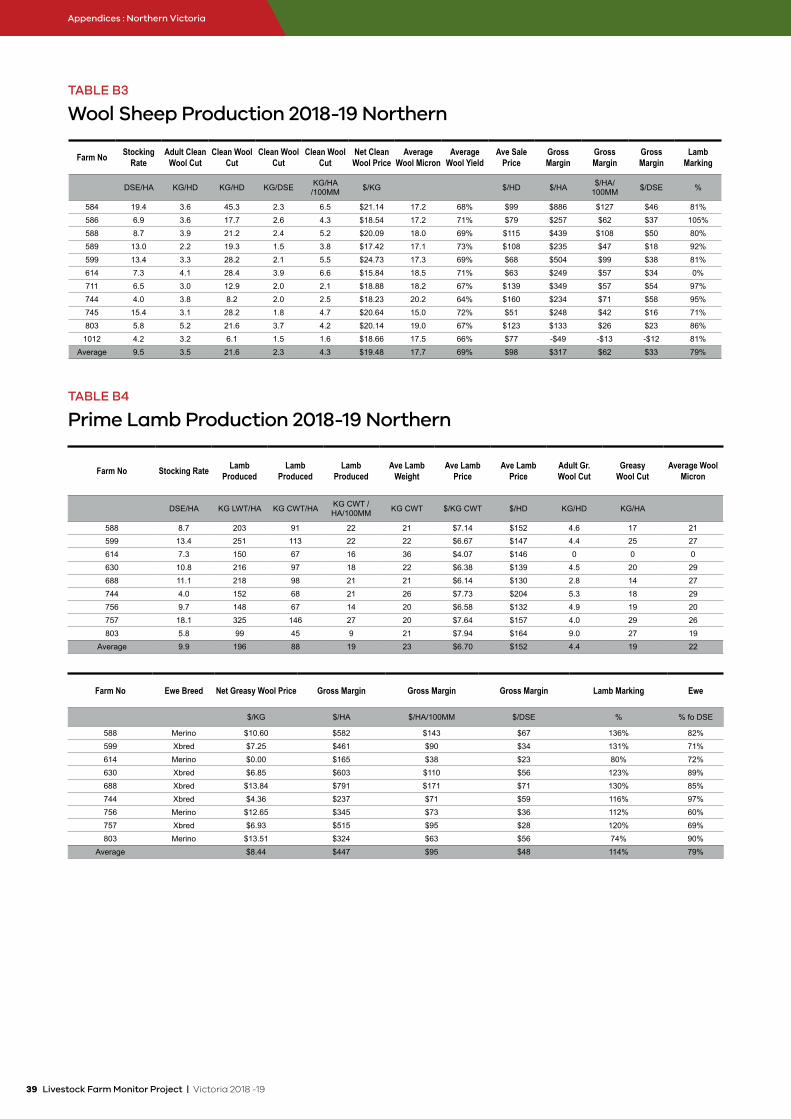
39 Livestock Farm Monitor Project | Victoria 2018 -19
Appendices : Northern Victoria
Prime Lamb Production 2018-19 NorthernTABLE B4
Farm No Stocking Rate Lamb Produced
Lamb Produced
Lamb Produced
Ave Lamb Weight
Ave Lamb Price
Ave Lamb Price
Adult Gr. Wool Cut
Greasy Wool Cut
Average Wool Micron
DSE/HA KG LWT/HA KG CWT/HA KG CWT / HA/100MM KG CWT $/KG CWT $/HD KG/HD KG/HA
588 8.7 203 91 22 21 $7.14 $152 4.6 17 21599 13.4 251 113 22 22 $6.67 $147 4.4 25 27614 7.3 150 67 16 36 $4.07 $146 0 0 0630 10.8 216 97 18 22 $6.38 $139 4.5 20 29688 11.1 218 98 21 21 $6.14 $130 2.8 14 27744 4.0 152 68 21 26 $7.73 $204 5.3 18 29756 9.7 148 67 14 20 $6.58 $132 4.9 19 20757 18.1 325 146 27 20 $7.64 $157 4.0 29 26803 5.8 99 45 9 21 $7.94 $164 9.0 27 19
Average 9.9 196 88 19 23 $6.70 $152 4.4 19 22
Farm No Ewe Breed Net Greasy Wool Price Gross Margin Gross Margin Gross Margin Lamb Marking Ewe
$/KG $/HA $/HA/100MM $/DSE % % fo DSE
588 Merino $10.60 $582 $143 $67 136% 82%599 Xbred $7.25 $461 $90 $34 131% 71%614 Merino $0.00 $165 $38 $23 80% 72%630 Xbred $6.85 $603 $110 $56 123% 89%688 Xbred $13.84 $791 $171 $71 130% 85%744 Xbred $4.36 $237 $71 $59 116% 97%756 Merino $12.65 $345 $73 $36 112% 60%757 Xbred $6.93 $515 $95 $28 120% 69%803 Merino $13.51 $324 $63 $56 74% 90%
Average $8.44 $447 $95 $48 114% 79%
Wool Sheep Production 2018-19 NorthernTABLE B3
Farm No Stocking Rate
Adult Clean Wool Cut
Clean Wool Cut
Clean Wool Cut
Clean Wool Cut
Net Clean Wool Price
Average Wool Micron
Average Wool Yield
Ave Sale Price
Gross Margin
Gross Margin
Gross Margin
Lamb Marking
DSE/HA KG/HD KG/HD KG/DSE KG/HA/100MM $/KG $/HD $/HA $/HA/
100MM $/DSE %
584 19.4 3.6 45.3 2.3 6.5 $21.14 17.2 68% $99 $886 $127 $46 81%586 6.9 3.6 17.7 2.6 4.3 $18.54 17.2 71% $79 $257 $62 $37 105%588 8.7 3.9 21.2 2.4 5.2 $20.09 18.0 69% $115 $439 $108 $50 80%589 13.0 2.2 19.3 1.5 3.8 $17.42 17.1 73% $108 $235 $47 $18 92%599 13.4 3.3 28.2 2.1 5.5 $24.73 17.3 69% $68 $504 $99 $38 81%614 7.3 4.1 28.4 3.9 6.6 $15.84 18.5 71% $63 $249 $57 $34 0%711 6.5 3.0 12.9 2.0 2.1 $18.88 18.2 67% $139 $349 $57 $54 97%744 4.0 3.8 8.2 2.0 2.5 $18.23 20.2 64% $160 $234 $71 $58 95%745 15.4 3.1 28.2 1.8 4.7 $20.64 15.0 72% $51 $248 $42 $16 71%803 5.8 5.2 21.6 3.7 4.2 $20.14 19.0 67% $123 $133 $26 $23 86%
1012 4.2 3.2 6.1 1.5 1.6 $18.66 17.5 66% $77 -$49 -$13 -$12 81%Average 9.5 3.5 21.6 2.3 4.3 $19.48 17.7 69% $98 $317 $62 $33 79%

Livestock Farm Monitor Project | Victoria 2018 -19 40
Appendices : Northern Victoria
Beef Cattle Production 2018-19 NorthernTABLE B5
Farm No Stocking Rate Beef Produced Beef Produced Beef Sold Average Sale Price Average Lwt Sales Average Sale Price
DSE/HA KG LWT/HA KG LWT/HA/100MM KG LWT/HA $/HD KG LWT $/KG LWT
584 19.4 455 65.0 427 $1,505 533 $2.83585 8.6 122 21.4 152 $880 345 $2.55588 8.7 117 28.6 135 $701 325 $2.16630 10.8 188 34.4 223 $970 424 $2.29678 8.4 152 39.4 176 $683 328 $2.08683 7.0 72 17.0 258 $1,133 413 $2.74688 11.1 118 25.5 107 $1,027 387 $2.66707 13.5 316 34.7 341 $1,286 441 $2.91708 14.2 218 34.1 236 $1,054 390 $2.70709 9.6 316 49.5 293 $958 565 $1.70745 15.4 140 23.6 305 $1,057 212 $4.98756 9.7 192 40.6 224 $829 428 $1.94757 18.1 409 75.5 338 $1,250 442 $2.83800 11.2 214 37.2 332 $618 329 $1.88802 10.4 296 86.8 288 $1,942 701 $2.77803 5.8 89 17.3 96 $993 396 $2.56
1013 20.6 469 60.5 333 $1,201 482 $2.501015 11.0 128 21.2 265 $1,351 434 $3.11
Average 11.9 223 39.6 252 $1,080 421 $2.62
Farm No Gross Margin Gross Margin Gross Margin Time of Calving Calving Cow Beef Enterprise
$/HA $/HA/100MM $/DSE % %
584 $469 $67 $24 Sep 81% 44% Spring585 $216 $38 $25 Aug 94% 100% Spring588 $219 $54 $25 Aug 100% 5% Spring630 $241 $44 $22 Apr 100% 29% Autumn678 $81 $21 $10 Apr 83% 100% Autumn683 $206 $48 $29 Oct 100% Other688 $136 $29 $12 Aug 102% 34% Spring707 $707 $78 $52 Aug 80% 100% Spring708 $376 $59 $26 Jul 83% 100% Spring709 $530 $83 $55 Sep 88% 100% Spring745 $346 $58 $23 Sep 95% 23% Spring756 $31 $7 $3 Sep 88% 14% Spring757 $70 $13 $4 Mar 87% 48% Autumn800 -$33 -$6 -$3 Oct 77% 100% Other802 -$106 -$31 -$10 Aug 93% 100% Spring803 $4 $1 $1 Mar 90% 51% Autumn
1013 $281 $36 $14 Jul 79% 100% Spring1015 -$40 -$7 -$4 Oct 74% 100% Other
Average $207 $33 $17 88% 69%

41 Livestock Farm Monitor Project | Victoria 2018 -19
Appendices : Northern Victoria
Wool Sheep Variable Costs 2018-19 Northern
Prime Lamb Variable Costs 2018-19 Northern
TABLE B6
TABLE B7
Farm No Animal Health Contract Services
Supp Feed & Agistmt Pasture Casual Labour Freight/ Cartage Shearing
Supplies Other Selling Costs Total Var. Costs
$/DSE $/DSE $/DSE $/DSE $/DSE $/DSE $/DSE $/DSE $/DSE $/DSE
584 $4.36 $7.27 $7.70 $9.04 $0.00 $0.51 $0.26 $0.89 $2.55 $32.57586 $1.63 $5.58 $22.21 $0.00 $0.00 $0.20 $0.47 $0.47 $5.98 $36.55588 $0.92 $3.49 $8.56 $4.75 $0.00 $0.48 $0.14 $0.70 $4.21 $23.25589 $1.02 $2.67 $8.03 $1.54 $0.00 $0.19 $0.00 $0.25 $2.12 $15.81599 $3.14 $11.21 $12.33 $1.67 $0.18 $0.56 $0.27 $0.72 $2.68 $32.75614 $2.76 $7.76 $1.22 $1.80 $0.00 $1.41 $0.48 $3.59 $1.66 $20.67711 $2.39 $4.47 $12.72 $4.29 $0.00 $0.76 $0.83 $0.12 $5.98 $31.56744 $2.11 $8.57 $22.28 $3.23 $0.26 $0.06 $0.37 $1.91 $7.34 $46.12745 $4.97 $9.81 $10.51 $6.30 $2.64 $0.16 $0.34 $0.81 $2.11 $37.64803 $3.09 $3.43 $63.15 $6.54 $0.00 $0.00 $1.31 $3.66 $6.10 $87.29
1012 $3.05 $2.40 $13.80 $25.73 $0.00 $0.17 $0.12 $4.37 $11.66 $61.31Average $2.68 $6.06 $16.59 $5.90 $0.28 $0.41 $0.42 $1.59 $4.76 $38.68
Farm No Animal Health Contract Services
Supp Feed & Agistmt Pasture Casual Labour Freight/ Cartage Shearing
Supplies Other Selling Costs Total Var. Costs
$/HA $/HA $/HA $/HA $/HA $/HA $/HA $/HA $/HA $/HA
584 $85 $141 $150 $176 $0 $10 $5 $17 $50 $633586 $11 $39 $153 $0 $0 $1 $3 $3 $41 $252588 $8 $30 $74 $41 $0 $4 $1 $6 $37 $202589 $13 $35 $105 $20 $0 $2 $0 $3 $28 $206599 $42 $150 $165 $22 $2 $7 $4 $10 $36 $440614 $20 $56 $9 $13 $0 $10 $3 $26 $12 $150711 $16 $29 $83 $28 $0 $5 $5 $1 $39 $205744 $8 $34 $89 $13 $1 $0 $1 $8 $29 $185745 $76 $151 $162 $97 $41 $2 $5 $12 $32 $579803 $18 $20 $367 $38 $0 $0 $8 $21 $35 $507
1012 $13 $10 $58 $108 $0 $1 $1 $18 $49 $258Average $28 $63 $129 $51 $4 $4 $3 $11 $35 $329
Farm No Animal Health Contract Services
Supp Feed & Agistmt Pasture Casual Labour Freight/
CartageShearing Supplies Other Selling Costs Total Var. Costs
$/DSE $/DSE $/DSE $/DSE $/DSE $/DSE $/DSE $/DSE $/DSE $/DSE
588 $0.84 $2.73 $20.30 $4.75 $0.00 $0.37 $0.11 $0.69 $8.48 $38.28599 $3.01 $7.53 $18.54 $1.67 $0.12 $0.58 $0.18 $0.62 $6.04 $38.29614 $0.00 $0.00 $13.30 $1.80 $0.00 $0.00 $0.00 $0.00 $2.75 $17.84630 $1.39 $2.91 $0.61 $4.88 $0.00 $0.35 $0.27 $0.15 $7.22 $17.79688 $1.06 $1.65 $0.65 $2.85 $0.00 $0.00 $0.25 $1.58 $4.58 $12.63744 $2.79 $9.69 $32.85 $3.23 $0.87 $2.63 $0.48 $2.09 $17.43 $72.07756 $2.01 $4.00 $7.75 $10.54 $1.34 $1.03 $0.29 $2.31 $4.60 $33.85757 $3.20 $4.89 $19.90 $4.89 $0.00 $1.19 $0.54 $0.00 $3.73 $38.34803 $2.43 $2.70 $56.44 $6.54 $0.00 $0.00 $1.03 $2.88 $9.69 $81.71
Average $1.86 $4.01 $18.93 $4.57 $0.26 $0.68 $0.35 $1.15 $7.17 $38.98
Farm No Animal Health Contract Services
Supp Feed & Agistmt Pasture Casual Labour Freight/
CartageShearing Supplies Other Selling Costs Total Var. Costs
$/HA $/HA $/HA $/HA $/HA $/HA $/HA $/HA $/HA $/HA
588 $7 $24 $177 $41 $0 $3 $1 $6 $74 $333599 $40 $101 $249 $22 $2 $8 $2 $8 $81 $514614 $0 $0 $96 $13 $0 $0 $0 $0 $20 $129630 $15 $31 $7 $52 $0 $4 $3 $2 $78 $191688 $12 $18 $7 $32 $0 $0 $3 $18 $51 $140744 $11 $39 $132 $13 $4 $11 $2 $8 $70 $289756 $19 $39 $75 $102 $13 $10 $3 $22 $44 $327757 $58 $89 $360 $89 $0 $22 $10 $0 $67 $694803 $14 $16 $328 $38 $0 $0 $6 $17 $56 $475
Average $20 $40 $159 $45 $2 $6 $3 $9 $60 $344

Livestock Farm Monitor Project | Victoria 2018 -19 42
Appendices : Northern Victoria
Beef Cattle Variable Costs 2018-19 NorthernTABLE B8
Farm No Animal Health Contract Services
Supp Feed & Agistmt Pasture Casual Labour Freight/ Cartage Other Selling Costs Total Var. Costs
$/HA $/HA $/HA $/HA $/HA $/HA $/HA $/HA $/HA
584 $13 $5 $582 $176 $0 $22 $10 $36 $844585 $4 $3 $76 $0 $0 $3 $3 $27 $115588 $5 $0 $25 $41 $0 $17 $6 $8 $102630 $13 $0 $48 $52 $0 $3 $1 $53 $171678 $8 $0 $172 $48 $0 $0 $18 $30 $276683 $11 $0 $0 $110 $0 $5 $4 $86 $217688 $4 $1 $110 $32 $0 $0 $8 $22 $176707 $36 $0 $50 $98 $0 $37 $20 $15 $254708 $2 $4 $125 $76 $0 $11 $1 $16 $234709 $17 $16 $0 $3 $0 $4 $20 $37 $98745 $9 $0 $367 $97 $35 $3 $11 $103 $625756 $23 $0 $171 $102 $0 $13 $16 $95 $419757 $38 $0 $855 $89 $0 $15 $0 $49 $1,045800 $34 $7 $275 $88 $0 $19 $21 $61 $506802 $13 $47 $667 $134 $6 $25 $18 $39 $949803 $11 $0 $179 $38 $0 $0 $9 $20 $256
1013 $29 $0 $350 $232 $0 $16 $8 $39 $674
1015 $3 $0 $480 $0 $0 $53 $31 $50 $617Average $15 $5 $252 $79 $2 $14 $11 $44 $421
Farm No Enterprise Animal Health
Contract Services
Supp Feed & Agistmt Pasture Casual
LabourFreight/ Cartage Other Selling Costs Total Var.
Costs
$/DSE $/DSE $/DSE $/DSE $/DSE $/DSE $/DSE $/DSE $/DSE
584 Spring $0.67 $0.26 $29.91 $9.04 $0.00 $1.15 $0.51 $1.85 $43.40585 Spring $0.42 $0.36 $8.89 $0.00 $0.00 $0.30 $0.30 $3.13 $13.40588 Spring $0.62 $0.00 $2.85 $4.75 $0.00 $1.96 $0.71 $0.87 $11.76630 Autumn $1.19 $0.00 $4.48 $4.88 $0.00 $0.32 $0.11 $4.92 $15.90678 Autumn $0.94 $0.00 $20.50 $5.74 $0.00 $0.00 $2.12 $3.59 $32.90683 Other $1.52 $0.00 $0.00 $15.68 $0.00 $0.76 $0.62 $12.29 $30.88688 Spring $0.33 $0.10 $9.88 $2.85 $0.00 $0.00 $0.73 $1.96 $15.85707 Spring $2.64 $0.00 $3.67 $7.21 $0.00 $2.71 $1.45 $1.12 $18.81708 Spring $0.14 $0.26 $8.75 $5.36 $0.00 $0.80 $0.06 $1.09 $16.46709 Spring $1.72 $1.70 $0.00 $0.33 $0.00 $0.47 $2.10 $3.87 $10.18745 Spring $0.61 $0.00 $23.85 $6.30 $2.30 $0.18 $0.68 $6.72 $40.64756 Spring $2.39 $0.00 $17.64 $10.54 $0.00 $1.33 $1.62 $9.83 $43.35757 Autumn $2.12 $0.00 $47.20 $4.89 $0.00 $0.81 $0.00 $2.68 $57.70800 Other $3.01 $0.64 $24.52 $7.87 $0.00 $1.71 $1.90 $5.40 $45.05802 Spring $1.26 $4.53 $64.02 $12.88 $0.57 $2.43 $1.69 $3.74 $91.13803 Autumn $1.86 $0.00 $30.78 $6.54 $0.00 $0.00 $1.53 $3.41 $44.12
1013 Spring $1.43 $0.00 $16.99 $11.25 $0.00 $0.75 $0.41 $1.89 $32.731015 Other $0.29 $0.00 $43.69 $0.00 $0.00 $4.83 $2.81 $4.57 $56.19
Average $1.29 $0.44 $19.87 $6.45 $0.16 $1.14 $1.08 $4.05 $34.47
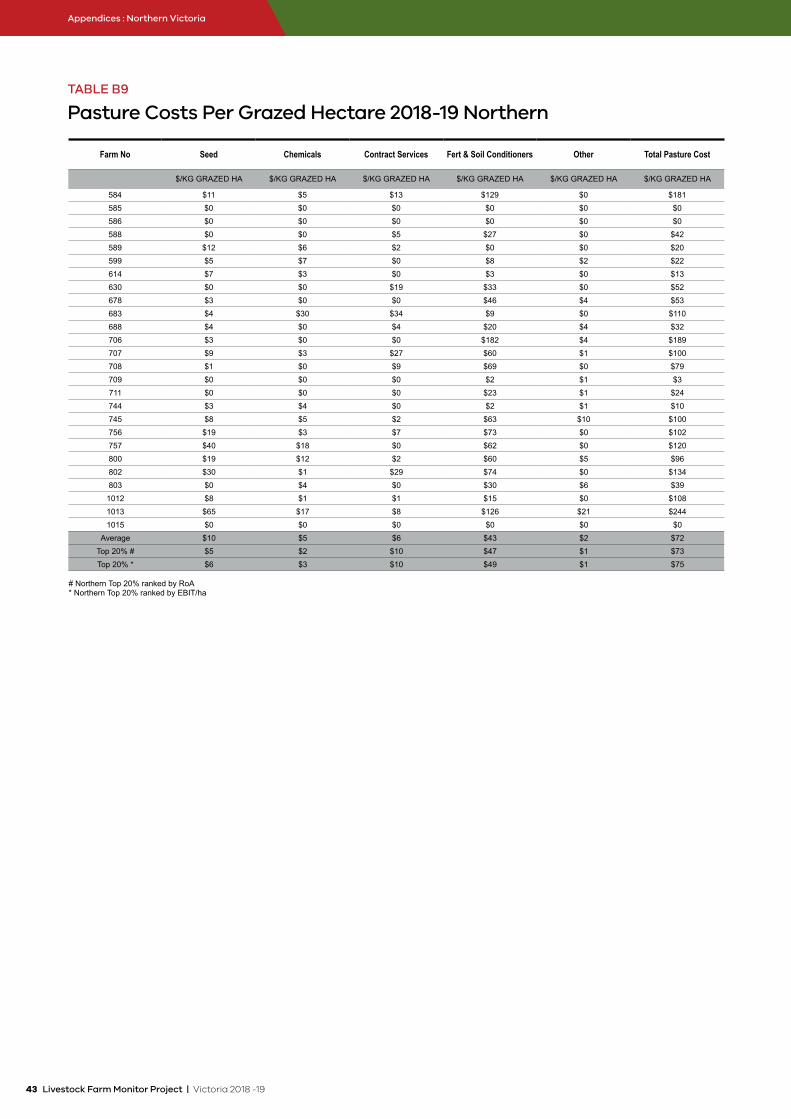
43 Livestock Farm Monitor Project | Victoria 2018 -19
Appendices : Northern Victoria
Pasture Costs Per Grazed Hectare 2018-19 NorthernTABLE B9
Farm No Seed Chemicals Contract Services Fert & Soil Conditioners Other Total Pasture Cost
$/KG GRAZED HA $/KG GRAZED HA $/KG GRAZED HA $/KG GRAZED HA $/KG GRAZED HA $/KG GRAZED HA
584 $11 $5 $13 $129 $0 $181585 $0 $0 $0 $0 $0 $0586 $0 $0 $0 $0 $0 $0588 $0 $0 $5 $27 $0 $42589 $12 $6 $2 $0 $0 $20599 $5 $7 $0 $8 $2 $22614 $7 $3 $0 $3 $0 $13630 $0 $0 $19 $33 $0 $52678 $3 $0 $0 $46 $4 $53683 $4 $30 $34 $9 $0 $110688 $4 $0 $4 $20 $4 $32706 $3 $0 $0 $182 $4 $189707 $9 $3 $27 $60 $1 $100708 $1 $0 $9 $69 $0 $79709 $0 $0 $0 $2 $1 $3711 $0 $0 $0 $23 $1 $24744 $3 $4 $0 $2 $1 $10745 $8 $5 $2 $63 $10 $100756 $19 $3 $7 $73 $0 $102757 $40 $18 $0 $62 $0 $120800 $19 $12 $2 $60 $5 $96802 $30 $1 $29 $74 $0 $134803 $0 $4 $0 $30 $6 $391012 $8 $1 $1 $15 $0 $1081013 $65 $17 $8 $126 $21 $2441015 $0 $0 $0 $0 $0 $0
Average $10 $5 $6 $43 $2 $72Top 20% # $5 $2 $10 $47 $1 $73Top 20% * $6 $3 $10 $49 $1 $75
# Northern Top 20% ranked by RoA* Northern Top 20% ranked by EBIT/ha
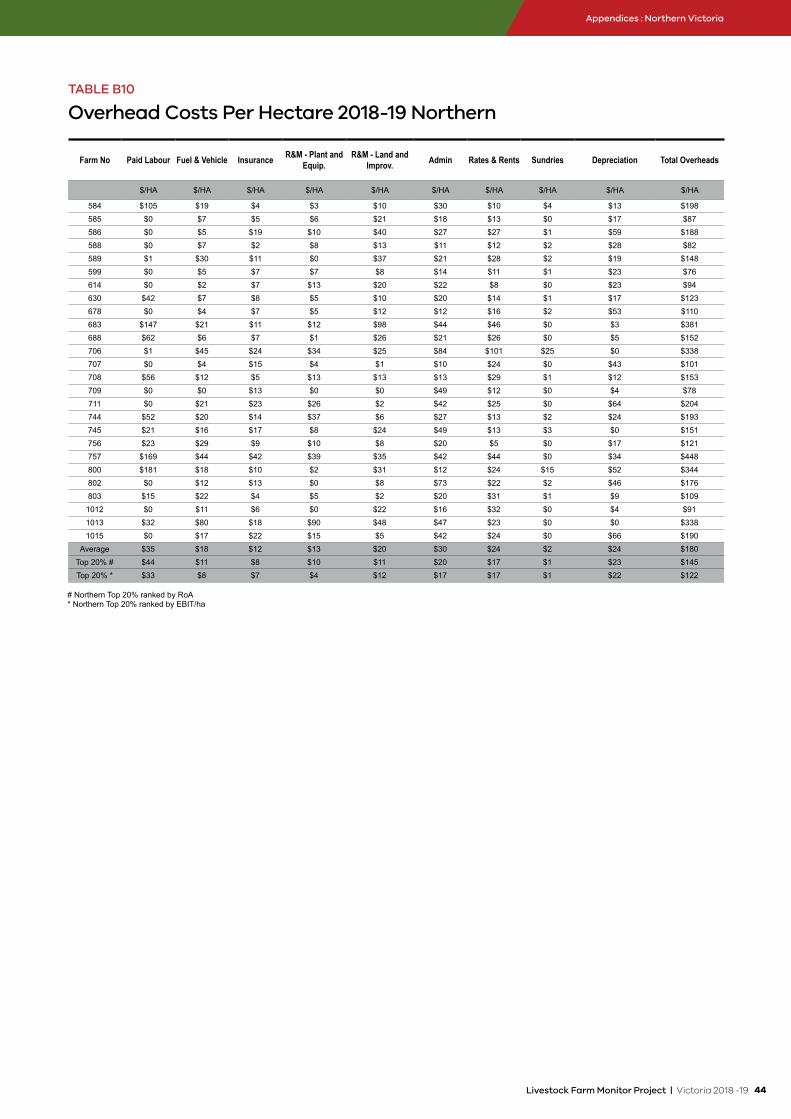
Livestock Farm Monitor Project | Victoria 2018 -19 44
Appendices : Northern Victoria
Overhead Costs Per Hectare 2018-19 NorthernTABLE B10
Farm No Paid Labour Fuel & Vehicle Insurance R&M - Plant and Equip.
R&M - Land and Improv. Admin Rates & Rents Sundries Depreciation Total Overheads
$/HA $/HA $/HA $/HA $/HA $/HA $/HA $/HA $/HA $/HA
584 $105 $19 $4 $3 $10 $30 $10 $4 $13 $198585 $0 $7 $5 $6 $21 $18 $13 $0 $17 $87586 $0 $5 $19 $10 $40 $27 $27 $1 $59 $188588 $0 $7 $2 $8 $13 $11 $12 $2 $28 $82589 $1 $30 $11 $0 $37 $21 $28 $2 $19 $148599 $0 $5 $7 $7 $8 $14 $11 $1 $23 $76614 $0 $2 $7 $13 $20 $22 $8 $0 $23 $94630 $42 $7 $8 $5 $10 $20 $14 $1 $17 $123678 $0 $4 $7 $5 $12 $12 $16 $2 $53 $110683 $147 $21 $11 $12 $98 $44 $46 $0 $3 $381688 $62 $6 $7 $1 $26 $21 $26 $0 $5 $152706 $1 $45 $24 $34 $25 $84 $101 $25 $0 $338707 $0 $4 $15 $4 $1 $10 $24 $0 $43 $101708 $56 $12 $5 $13 $13 $13 $29 $1 $12 $153709 $0 $0 $13 $0 $0 $49 $12 $0 $4 $78711 $0 $21 $23 $26 $2 $42 $25 $0 $64 $204744 $52 $20 $14 $37 $6 $27 $13 $2 $24 $193745 $21 $16 $17 $8 $24 $49 $13 $3 $0 $151756 $23 $29 $9 $10 $8 $20 $5 $0 $17 $121757 $169 $44 $42 $39 $35 $42 $44 $0 $34 $448800 $181 $18 $10 $2 $31 $12 $24 $15 $52 $344802 $0 $12 $13 $0 $8 $73 $22 $2 $46 $176803 $15 $22 $4 $5 $2 $20 $31 $1 $9 $109
1012 $0 $11 $6 $0 $22 $16 $32 $0 $4 $911013 $32 $80 $18 $90 $48 $47 $23 $0 $0 $3381015 $0 $17 $22 $15 $5 $42 $24 $0 $66 $190
Average $35 $18 $12 $13 $20 $30 $24 $2 $24 $180Top 20% # $44 $11 $8 $10 $11 $20 $17 $1 $23 $145Top 20% * $33 $8 $7 $4 $12 $17 $17 $1 $22 $122
# Northern Top 20% ranked by RoA* Northern Top 20% ranked by EBIT/ha

45 Livestock Farm Monitor Project | Victoria 2018 -19
Appendices : Northern Victoria
Farm Labour Efficiency and Enterprise Mix 2018-19 NorthernTABLE B12
Average Top 20% # Top 20% *
SHEEP ENTERPRISES
Average Sheep Number 2,722 7,537 8,363
Sheep Labour Efficiency (ha/person) 405 795 675
Sheep Labour Efficiency (DSE/person) 3,422 6,612 7,568
BEEF ENTERPRISES
Average Cattle Number 404 734 734
Cattle Labour Efficiency (ha/person) 486 793 793
Cattle Labour Efficiency (DSE/person) 5,733 10,273 10,273
TOTAL LABOUR EFFICIENCY
Hectares per person 500 706 699
DSE per person 5,554 9,133 9,632
ENTERPRISE MIX
Wool Sheep (%) 33% 37% 39%
Prime Lambs (%) 17% 20% 24%
Beef (%) 47% 36% 36%
Hay/Cropping (%) 3% 6% 1%
Capital Structure 2018-19 NorthernTABLE B11
Average Top 20% # Top 20% *FARM AREA (HA)
Freehold Area 631 1101 1097
Area Leased In 228 595 572
Area Leased Out 2 0 0
Effective Area 820 1,678 1,623
LAND VALUES
Total Land Value per Effective Hectare $6,534 $5,798 $6,307
Total Land Value per DSE $732 $535 $464
Owned Land Value per Hectare $6,560 $5,664 $5,869
Leased Land Value per Hectare $4,211 $5,505 $6,021
OTHER ASSETS (per Effective Hectare)
Plant & Vehicles $329 $201 $156
Livestock $890 $947 $1,108
Hay & Grain on Hand $59 $108 $88
Other Assets $355 $445 $449
Total Assets $8,166 $7,498 $8,108
LIABILITIES
Liabilities per Effective Hectare $611 $511 $298
EQUITY
Equity per Effective Hectare $6,423 $4,869 $5,374
Average Equity % 77% 65% 70%
RATIOS
Debt Ratio 9% 6% 6%
Plant & Equipment Ratio 3.2 6.8 7.4
# Northern Top 20% ranked by RoA* Northern Top 20% ranked by EBIT/ha
# Northern Top 20% ranked by RoA* Northern Top 20% ranked by EBIT/ha

Livestock Farm Monitor Project | Victoria 2018 -19 46
Appendices : Northern Victoria
Supplementary Feed Data 2018–19 NorthernTABLE B13
Yield (Wet T/HA)
Amount Fed to Sheep (Average wet KG/DSE)
Amount Fed to Cattle (Average wet KG/DSE)
Area Cut (HA)
Farm No Pasture Hay Silage Pasture Hay Silage Grain Pasture Hay Silage Grain Pasture Hay Silage
584 5.1 15.1 0.0 0.0 17.2 25.1 4.4 0.0 90 6585 0.0 0.0 0.0 0 0586 0.0 0.0 55.0 0 0588 1.6 0.0 9.0 7.9 0.0 0.0 0 0589 9.9 0.0 11.6 0 0599 0.0 0.0 32.9 0 0614 3.8 0.0 0.0 13.6 40 0630 0.0 0.0 0.0 8.2 0.0 0.0 0 0678 2.4 48.9 55.0 0.0 57 0683 0.0 0.0 0.0 0 0688 1.1 0.0 10.5 20.7 0.0 0.0 0 0706 0.0 0.0 5.5 0 0707 0.0 0.0 0.0 0 0708 2.5 23.9 5.7 0.0 0 44709 0.0 0.0 0.0 0 0711 0.0 0.0 28.9 0 0744 7.3 0.0 0.0 29.6 0 44745 5.1 6.9 1.1 6.4 12.7 51.4 5.4 0.0 25 13756 0.0 0.0 16.5 7.3 0.0 0.0 0 0757 4.1 6.4 0.0 3.9 12.9 54.0 49.5 0.0 55 40800 5.1 42.9 6.4 0.0 100 0802 0.0 28.4 5.7 0 0803 10.2 0.0 43.8 0.0 0.0 0.0 0 01012 0.0 0.0 0.0 0 01013 1.4 8.0 30.8 7.6 0.0 19 101015 0.0 4.1 3.3 0 0
Average 3.9 7.7 1.5 0.6 18.7 17.8 9.2 0.5 15 6

47 Livestock Farm Monitor Project | Victoria 2018 -19
Appendices : Northern Victoria
Year Wool Sheep Prime Lamb Beef Cattle
NOMINAL($/DSE)
REAL ($/DSE)
NOMINAL($/HA)
REAL ($/HA)
NOMINAL($/DSE)
REAL ($/DSE)
NOMINAL($/HA)
REAL ($/HA)
NOMINAL($/DSE)
REAL ($/DSE)
NOMINAL($/HA)
REAL ($/HA)
2004-05 $14.18 $19.73 $126 $175 2005-06 $11.15 $14.91 $107 $143 2006-07 $10.99 $14.40 $95 $124 2007-08 $15.55 $19.50 $123 $154 $10.52 $13.19 $90 $113 2008-09 $12.94 $15.98 $106 $131 $16.10 $19.89 $137 $169 2009-10 $24.06 $28.84 $202 $242 $24.79 $29.70 $225 $270 $29.47 $35.31 $350 $419 2010-11 $43.62 $50.45 $396 $458 $45.66 $52.82 $401 $464 $31.36 $36.27 $365 $422 2011-12 $33.04 $37.76 $332 $379 $28.03 $32.03 $250 $285 $25.09 $28.67 $285 $326 2012-13 $17.67 $19.72 $172 $192 $24.58 $27.44 $190 $212 $23.25 $25.95 $247 $276 2013-14 $22.62 $24.51 $234 $254 $31.56 $34.20 $319 $346 $25.83 $27.99 $317 $344 2014-15 $26.33 $28.11 $279 $298 $28.28 $30.19 $291 $311 $25.02 $26.71 $282 $301 2015-16 $24.89 $26.31 $217 $229 $31.61 $33.41 $221 $234 $38.75 $40.96 $434 $459 2016-17 $42.42 $44.00 $362 $376 $52.94 $54.92 $496 $515 $46.98 $48.73 $484 $502 2017-18 $62.47 $63.47 $501 $509 $53.44 $54.29 $517 $525 $40.81 $41.46 $448 $455 2018-19 $32.91 $32.91 $317 $317 $47.81 $47.81 $447 $447 $17.16 $17.16 $207 $207
Long Term Average $29.37 $265 $35.82 $324 $32.92 $3712018-19 vs LT avg +$3.54 +$51 +$12 +$123 -$15.76 -$164
Average Whole Farm Economic Performance – NorthernTABLE B14
Historical Gross Margins For Livestock Enterprises – NorthernTABLE B15
Year Gross Income Variable Costs Overhead Costs Net Income EBIT (Operating Profit) Return on Assets
Return on Equity
NOMINAL($/HA)
REAL($/HA)
NOMINAL($/HA)
REAL($/HA)
NOMINAL($/HA)
REAL($/HA)
NOMINAL($/HA)
REAL($/HA)
NOMINAL($/HA)
REAL($/HA)
2004-05 $272 $378 $107 $149 $57 $79 $108 $150 $53 $74 1.1% -0.2%2005-06 $272 $364 $111 $149 $63 $84 $99 $132 $45 $60 1.5% 0.0%2006-07 $275 $360 $164 $215 $66 $86 $46 $60 $0 $0 0.2% -1.8%2007-08 $293 $367 $114 $143 $65 $82 $114 $143 $62 $78 2.4% 1.5%2008-09 $263 $325 $121 $149 $72 $89 $69 $85 $8 $10 0.3% -1.3%2009-10 $340 $407 $103 $123 $83 $99 $154 $185 $82 $98 2.5% 2.0%2010-11 $499 $577 $112 $130 $108 $125 $279 $323 $183 $212 4.5% 4.9%2011-12 $436 $498 $132 $150 $106 $121 $199 $228 $118 $135 2.9% 2.6%2012-13 $383 $428 $168 $187 $106 $118 $110 $122 $25 $28 0.6% -1.8%2013-14 $433 $469 $151 $164 $104 $113 $178 $193 $102 $111 2.0% 0.9%2014-15 $461 $492 $181 $193 $120 $128 $160 $171 $86 $92 1.9% 1.0%2015-16 $513 $542 $207 $219 $145 $153 $161 $170 $77 $81 1.4% 0.5%2016-17 $752 $780 $221 $229 $180 $187 $179 $186 $251 $260 4.3% 4.4%2017-18 $720 $732 $222 $226 $188 $191 $125 $127 $183 $186 2.7% 2.7%2018-19 $680 $680 $335 $335 $180 $180 -$21 -$21 $40 $40 0.5% -0.7%
Long Term Average $493 $184 $122 $150 $98 1.9% 1.0%
2018-19 vs LT avg +$187 +$151 +$57 -$171 -$57 -1.4% -1.7%
Note: ‘Real’ dollar values are the nominal values converted to 2018-19 dollar equivalents by the C.P.I. to allow for inflation. The data in the above table from 2004-05 to 2008-09 has been obtained from the Sheep Farm Monitor Project. Data from 2009-10 onwards has been obtained from the Livestock Farm Monitor Project.
Note: ‘Real’ dollar values are the nominal values converted to 2018-19 dollar equivalents by the C.P.I. to allow for inflation. The data in the above table from 2004-05 to 2008-09 has been obtained from the Sheep Farm Monitor Project. Data from 2009 -10 onwards has been obtained from the Livestock Farm Monitor Project. Early figures for prime lamb and beef cattle enterprises were not reported in the old Sheep Farm Monitor Projects and are therefore not shown in the above table.

Livestock Farm Monitor Project | Victoria 2018 -19 48
Year Stocking Rate Wool Sheep
Micron Wool Cut (Gr.) Net Wool Price Ave Sale Price Lamb
DSE/HA KG/HA NOMINAL ($/KG) GR.
REAL ($/KG) GR.
NOMINAL($/HD)
REAL($/HD) %
2004-05 9.3 19.2 33.0 $4.86 $6.76 $46 $64 75%2005-06 9.8 18.8 30.0 $5.09 $6.81 $41 $55 79%2006-07 9.7 18.3 30.0 $6.94 $9.10 $33 $43 69%2007-08 8.2 18.8 29.0 $6.12 $7.68 $41 $52 72%2008-09 8.5 18.4 29.0 $5.71 $7.06 $45 $55 80%2009-10 8.8 18.3 27.0 $6.07 $7.28 $72 $86 77%2010-11 9.4 18.6 32.0 $8.79 $10.17 $102 $118 78%2011-12 9.3 18.5 29.3 $8.43 $9.63 $80 $91 84%2012-13 9.4 18.5 30.1 $7.47 $8.34 $56 $62 80%2013-14 9.8 18.0 32.5 $7.25 $7.86 $63 $68 77%2014-15 10.2 18.1 36.3 $8.22 $8.78 $76 $81 78%2015-16 8.8 17.8 28.0 $8.81 $9.31 $71 $75 85%2016-17 9.9 17.8 30.7 $11.73 $12.17 $104 $108 75%2017-18 10.7 18.0 31.7 $14.56 $14.79 $108 $109 89%2018-19 10.4 17.7 31.3 $13.41 $13.41 $98 $98 79%
Long Term Average 9.5 18.3 30.7 $9.28 $78 78%2018-19 vs LT avg 1.0 -0.6 0.7 $4.13 $21 0.5%
Year Prime Lamb Beef Cattle
Wool Cut (Gr.) Net Wool Price Ave Sale Price Lamb Calving Ave Sale Price
KG/HA NOMINAL ($/KG) GR.
REAL ($/KG) GR.
NOMINAL($/HD)
REAL($/HD) % % NOMINAL
($/HD)REAL($/HD)
2004-052005-062006-072007-08 18.0 $4.40 $5.52 $53 $66 87%2008-09 16.0 $3.24 $4.00 $68 $84 98%2009-10 18.0 $3.27 $3.92 $95 $114 111% 87% $640 $767 2010-11 20.0 $4.34 $5.02 $127 $147 105% 87% $847 $980 2011-12 18.7 $4.78 $5.46 $102 $116 107% 87% $815 $931 2012-13 21.5 $5.00 $5.58 $78 $88 111% 87% $814 $908 2013-14 22.8 $5.08 $5.50 $90 $98 109% 93% $698 $756 2014-15 22.2 $6.27 $6.69 $101 $108 112% 90% $937 $1,000 2015-16 18.0 $6.35 $6.71 $102 $108 119% 90% $1,189 $1,257 2016-17 19.4 $6.55 $6.79 $134 $139 113% 85% $1,576 $1,635 2017-18 21.9 $8.49 $8.63 $139 $141 118% 89% $1,292 $1,312 2018-19 18.7 $8.44 $8.44 $152 $152 114% 88% $1,080 $1,080
Long Term Average 19.6 $6.02 $113 109% 88% $1,0632018-19 vs LT avg -0.9 $2.42 $39 5% -0.5% $17
Appendices : Northern Victoria
Historical Data For Selected Average Profitability Indicators – Northern
TABLE B16
Note: ‘Real’ dollar values are the nominal values converted to 2018-19 dollar equivalents by the C.P.I. to allow for inflation. The data in the above table from 2004-05 to 2008-09 has been obtained from the Sheep Farm Monitor Project. Data from 2009 -10 onwards has been obtained from the Livestock Farm Monitor Project. Early figures for prime lamb and beef cattle enterprises were not reported in the old Sheep Farm Monitor Projects and are therefore not shown in the above table.

49 Livestock Farm Monitor Project | Victoria 2018 -19
Appendices : Gippsland
Main Financial Indicators 2018-19 GippslandTABLE C1
Farm No Gross Farm Income
Variable Costs
Overhead Costs
Cost Structure
O/O Allowance
EBIT (Operating
income)
Net Farm Income
Return on Assets Debt Ratio Return on
Equity
$/HA $/HA $/HA % $/HA $/HA $/HA % % %
553 $647 $511 $177 106% $114 -$154 -$205 -2.0% 8% -2.7%555 $614 $711 $146 139% $83 -$326 -$354 -5.0% 5% -7.0%556 $498 $746 $326 215% $14 -$588 -$650 -10.3% 12% -13.6%574 $884 $495 $190 78% $128 $71 -$123 0.8% 22% -16.2%636 $591 $788 $193 166% $50 -$440 -$440 -6.9% 0% -6.9%638 $1,169 $512 $376 76% $93 $187 $187 0.9% 0% 0.9%643 $830 $329 $219 66% $91 $191 $32 1.4% 19% 0.4%653 $366 $378 $108 133% $122 -$242 -$286 -5.4% 12% -7.0%663 $851 $590 $291 104% $243 -$273 -$278 -1.8% 1% -2.2%664 $1,216 $369 $489 70% $88 $271 $116 1.4% 13% 0.8%667 $1,666 $594 $363 57% $226 $483 $482 3.2% 0% 3.2%698 $1,267 $734 $372 87% $368 -$207 -$207 -1.0% 0% -1.0%755 $1,157 $719 $421 99% $82 -$65 -$119 -0.3% 5% -0.7%804 $1,803 $1,088 $599 94% $437 -$322 -$395 -0.9% 4% -1.3%1014 $570 $420 $299 126% $161 -$310 -$435 -3.4% 22% -13.3%1017 $277 $247 $110 129% $152 -$232 -$235 -5.8% 1% -5.9%1018 $657 $475 $292 117% $170 -$281 -$395 -3.5% 17% -6.8%1019 $441 $218 $114 75% $185 -$76 -$103 -1.8% 6% -2.6%1021 $447 $256 $79 75% $56 $56 $32 1.1% 5% 0.7%1022 $1,721 $905 $291 69% $204 $321 $81 1.7% 14% 0.9%
Average $884 $554 $273 104% $153 -$97 -$165 -1.9% 8% -4.0%Top 20% # $1,358 $549 $341 66% $152 $317 $178 1.9% 12% 1.3%Top 20% * $1,358 $549 $341 66% $152 $317 $178 1.9% 12% 1.3%
Key Physical Data 2018-19 GippslandTABLE C2
Farm No Average Rainfall
2018-19 Rainfall
Stocking Rate SR-RF SR-RF
July Stocking
RateP Applied P Applied P Nutrient
ChangeK Nutrient
ChangeS Nutrient Change
MM MM DSE/HA DSE/HA/ 100MM
DSE HA/25MM
OVER 250MMDSE/HA $/HA
KG P/GRAZED
HA/100MMKG/HA KG/HA KG/HA
553 670 490 15 3.0 1.5 19 4 0.8 5 10 1555 646 468 13 2.8 1.5 13 0 0.0 4 9 0556 595 410 13 3.0 2.0 12 0 0.0 3 8 2574 619 572 22 3.9 1.7 23 9 1.6 8 26 0636 653 448 10 2.3 1.3 11 4 0.8 7 11 2638 1,018 814 28 3.4 1.2 21 16 2.0 13 31 17
643 875 776 19 2.5 0.9 16 16 2.0 14 28 17
653 646 310 9 3.0 3.8 12 3 0.9 3 3 0663 1,094 1,032 27 2.7 0.9 20 37 3.6 35 5 3664 1,021 983 21 2.1 0.7 18 35 3.5 31 -2 -2667 1,032 974 21 2.1 0.7 17 23 2.4 18 20 25698 669 472 20 4.1 2.2 15 30 6.3 25 12 -4755 1,011 946 27 2.9 1.0 153 3 0.4 3 9 28804 899 546 23 4.2 1.9 24 25 4.5 21 13 6
1014 841 571 17 2.9 1.3 13 7 1.3 6 11 81017 583 390 7 1.8 1.2 11 1 0.3 1 3 -11018 778 460 13 2.9 1.6 12 6 1.4 5 4 31019 773 708 10 1.4 0.5 8 0 0.0 -1 2 -11021 673 588 12 2.0 0.9 12 10 1.7 9 1 -11022 1,097 1,000 36 3.6 1.2 29 32 3.2 29 23 38
Average 809 648 18 2.8 1.4 23 13 1.8 12 11 7Top 20% # 1,006 933 24 2.6 0.9 20 27 2.8 23 17 20Top 20% * 1,006 933 24 2.6 0.9 20 27 2.8 23 17 20
# Gippsland Top 20% ranked by RoA* Gippsland Top 20% ranked by EBIT/ha
# Gippsland Top 20% ranked by RoA* Gippsland Top 20% ranked by EBIT/ha

Livestock Farm Monitor Project | Victoria 2018 -19 50
Appendices : Gippsland
Wool Sheep Production 2018-19 GippslandTABLE C3
Farm No Stocking Rate
Adult Clean
Wool Cut
Clean Wool Cut
Clean Wool Cut
Clean Wool Cut
Net Clean Wool Price
Average Wool
Micron
Average Wool Yield
Ave Sale Price
Gross Margin
Gross Margin
Gross Margin
Lamb Marking
DSE/HA KG/HD KG/HD KG/DSE KG/HA/100MM $/KG $/HD $/HA $/HA
/100MM $/DSE %
553 15 2.6 26 1.8 5.4 $20.99 17.7 71% $80 $124 $25 $9 62%555 13 3.0 34 2.6 7.3 $21.62 16.9 66% $52 -$82 -$18 -$6 53%556 13 2.6 29 2.3 7.1 $17.50 17.3 68% $77 -$234 -$57 -$19 63%574 22 2.7 41 1.8 7.1 $16.73 18.0 69% $65 $165 $29 $7 99%636 10 2.8 26 2.5 5.7 $18.16 17.6 74% $69 -$214 -$48 -$21 86%653 9 3.0 16 1.7 5.0 $24.18 17.0 68% $98 $7 $2 $1 20%
1017 7 2.9 12 1.7 3.1 $17.55 18.5 71% $52 $14 $4 $2 79%1018 13 1.7 14 1.0 3.0 $21.25 18.8 69% $81 $737 $160 $56 85%1019 10 4.4 23 2.3 3.2 $19.85 17.9 70% $72 $612 $86 $62 96%
Average 12 2.9 24 2.0 5.2 $19.76 17.7 70% $72 $125 $20 $10 71%
Prime Lamb Production 2018-19 GippslandTABLE C4
Farm No Stocking Rate Lamb Produced
Lamb Produced Lamb Produced Ave Lamb
WeightAve Lamb
PriceAve Lamb
PriceAdult Gr. Wool Cut
Greasy Wool Cut
Average Wool Micron
DSE/HA KG LWT/HA KG CWT/HA KG CWT / HA/100MM KG CWT $/KG CWT $/HD KG/HD KG/HA
553 14.6 194 87 18 17 $6.33 $108 4.0 29 24555 13.3 297 134 29 27 $2.34 $63 4.5 29 17556 12.5 134 60 15 25 $5.55 $139 4.0 29 21574 22.4 504 227 40 20 $6.77 $138 3.1 61 24638 27.9 381 172 21 20 $6.23 $125 5.0 44 28643 19.3 386 174 22 20 $7.34 $145 3.9 43 291018 13.2 614 276 60 23 $6.43 $145 19 221019 9.8 68 31 4 16 $7.51 $123 7.1 31 261022 35.9 829 373 37 22 $7.23 $159 2.7 58 32
Average 18.8 379 170 27 21 $6.19 $127 4.3 38 25
Farm No Ewe Breed Net Greasy Wool Price Gross Margin Gross Margin Gross Margin Lamb Marking Ewe
$/KG $/HA $/HA/100MM $/DSE % % of DSE
553 Xbred $9.18 $218 $45 $15 103% 87%555 Xbred $13.21 -$169 -$36 -$13 80% 97%556 Merino $12.50 $53 $13 $4 61% 78%574 Xbred $6.33 $1,417 $248 $63 96% 89%638 Xbred $5.70 $457 $56 $16 118% 69%643 Xbred $6.06 $947 $122 $49 133% 86%
1018 Merino $8.98 $199 $43 $151019 Xbred $8.50 $327 $46 $33 76% 74%1022 Xbred $2.24 $2,739 $274 $76 134% 86%
Average $8.08 $688 $90 $29 100% 83%

51 Livestock Farm Monitor Project | Victoria 2018 -19
Appendices : Gippsland
Beef Cattle Production 2018-19 GippslandTABLE C5
Farm No Stocking Rate Beef Produced Beef Produced Beef Sold Average Sale Price Average Lwt Sales Average Sale Price
DSE/HA KG LWT/HA KG LWT/HA/100MM KG LWT/HA $/HD KG LWT $/KG LWT
553 14.6 256 52.3 269 $954 407 $2.34556 12.5 297 72.5 496 $659 453 $1.45574 22.4 93 16.3 66 $926 405 $2.29638 27.9 445 54.7 429 $1,048 358 $2.93643 19.3 244 31.5 207 $1,042 391 $2.67663 27.4 308 29.8 486 $1,193 427 $2.80664 20.9 407 41.4 353 $1,283 467 $2.75667 20.7 573 58.8 1098 $1,866 645 $2.89698 19.5 475 100.6 565 $994 429 $2.32698 19.5 442 93.6 590 $1,021 436 $2.37755 27.3 227 24.0 272 $882 376 $2.34755 27.3 215 22.7 256 $665 317 $2.10804 22.7 524 95.9 536 $1,500 527 $2.85
1014 16.6 389 68.1 344 $603 487 $1.241014 16.6 113 19.7 143 $1,135 365 $3.111018 13.2 89 19.4 392 $918 394 $2.331019 9.8 148 20.9 104 $591 360 $1.641021 11.8 178 30.3 231 $821 334 $2.461022 35.9 1013 101.3 1412 $619 304 $2.041022 35.9 9 0.9 656 $1,417 440 $3.22
Average 21.1 322 47.7 445 $1,007 416 $2.41
Farm No Gross Margin Gross Margin Gross Margin Time of Calving Calving Cow Beef Enterprise
$/HA $/HA/100MM $/DSE % %
553 $15 $3 $1 Aug 92% 28% Spring556 -$405 -$99 -$33 Sep 69% 39% Spring574 -$271 -$47 -$12 Sep 91% 58% Spring638 $727 $89 $26 Sep 87% 56% Spring643 $300 $39 $16 Aug 90% 70% Spring663 $281 $27 $10 Sep 91% 100% Spring664 $781 $79 $37 Sep 94% 100% Spring667 $872 $89 $42 Oct 100% Other698 $489 $103 $25 May 94% 42% Autumn698 $421 $89 $22 Aug 85% 55% Spring755 $129 $14 $5 Mar 94% 63% Autumn755 -$238 -$25 -$9 Sep 95% 37% Spring804 $582 $107 $26 Apr 90% 100% Autumn
1014 $304 $53 $18 Mar 100% 29% Autumn1014 $54 $9 $3 Sep 100% 71% Spring1018 -$41 -$9 -$3 Aug 91% 65% Spring1019 $28 $4 $3 Sep 97% 66% Spring1021 $190 $32 $16 Aug 94% 100% Spring1022 $1,535 $153 $43 Sep 93% 34% Spring1022 $45 $5 $1 Oct 56% Other
Average $290 $36 $12 92% 63%

Livestock Farm Monitor Project | Victoria 2018 -19 52
Appendices : Gippsland
Wool Sheep Variable Costs 2018-19 GippslandTABLE C6
Farm No Animal Health
Contract Services
Supp Feed & Agistmt Pasture Casual
LabourFreight/ Cartage
Shearing Supplies Other Selling Costs Total Var.
Costs
$/DSE $/DSE $/DSE $/DSE $/DSE $/DSE $/DSE $/DSE $/DSE $/DSE
553 $1.60 $5.56 $21.20 $2.17 $0.00 $0.72 $0.15 $0.64 $3.15 $35.18555 $2.35 $8.07 $43.02 $0.43 $0.00 $0.00 $0.25 $0.76 $2.82 $57.70556 $4.59 $7.72 $51.20 $5.72 $0.00 $1.32 $0.27 $0.49 $2.28 $73.59574 $2.16 $3.42 $13.67 $8.11 $0.00 $0.00 $0.00 $0.97 $4.85 $33.19636 $2.80 $6.05 $57.58 $4.15 $0.00 $4.87 $0.00 $1.07 $5.39 $81.91653 $1.30 $3.98 $31.00 $0.45 $0.00 $1.69 $0.28 $2.65 $0.00 $41.35
1017 $2.72 $4.54 $21.44 $2.43 $0.00 $4.08 $0.00 $0.22 $4.03 $39.461018 $3.28 $1.36 $0.00 $5.76 $0.00 $0.60 $0.00 $0.27 $1.64 $12.911019 $0.00 $0.00 $5.02 $4.01 $0.00 $0.00 $0.00 $0.00 $2.76 $11.79
Average $2.31 $4.52 $27.13 $3.69 $0.00 $1.48 $0.11 $0.79 $2.99 $43.01
Farm No Animal Health
Contract Services
Supp Feed & Agistmt Pasture Casual
LabourFreight/ Cartage
Shearing Supplies Other Selling Costs Total Var.
Costs
$/HA $/HA $/HA $/HA $/HA $/HA $/HA $/HA $/HA $/HA
553 $23 $81 $309 $32 $0 $11 $2 $9 $46 $513555 $31 $107 $571 $6 $0 $0 $3 $10 $37 $766556 $57 $96 $638 $71 $0 $16 $3 $6 $28 $917574 $48 $77 $306 $182 $0 $0 $0 $22 $109 $743636 $29 $62 $593 $43 $0 $50 $0 $11 $55 $843653 $12 $36 $284 $4 $0 $16 $3 $24 $0 $378
1017 $19 $32 $149 $17 $0 $28 $0 $2 $28 $2751018 $43 $18 $0 $76 $0 $8 $0 $4 $22 $1711019 $0 $0 $49 $39 $0 $0 $0 $0 $27 $116
Average $29 $57 $322 $52 $0 $14 $1 $10 $39 $525
Prime Lamb Variable Costs 2018-19 GippslandTABLE C7
Farm No Animal Health
Contract Services
Supp Feed & Agistmt Pasture Casual
LabourFreight/ Cartage
Shearing Supplies Other Selling
CostsTotal Var.
Costs
$/DSE $/DSE $/DSE $/DSE $/DSE $/DSE $/DSE $/DSE $/DSE $/DSE
553 $1.17 $6.77 $23.03 $2.17 $0.00 $2.12 $0.18 $1.87 $5.20 $42.52555 $1.82 $6.27 $32.65 $0.43 $0.00 $0.00 $0.20 $0.59 $5.86 $47.82556 $2.80 $4.72 $31.27 $5.72 $0.00 $0.80 $0.17 $0.30 $5.79 $51.57574 $1.40 $4.30 $15.87 $8.11 $0.00 $0.00 $0.00 $0.66 $6.80 $37.14638 $1.36 $3.72 $0.00 $9.02 $0.00 $1.50 $0.20 $1.05 $0.95 $17.81643 $3.57 $2.10 $0.00 $8.41 $2.18 $2.47 $0.00 $1.37 $4.69 $24.781018 $4.22 $7.76 $92.18 $5.76 $0.00 $15.43 $0.00 $0.00 $25.64 $150.991019 $2.12 $0.00 $6.17 $4.01 $0.00 $0.00 $0.00 $2.27 $2.40 $16.971022 $0.00 $3.64 $0.00 $3.69 $0.00 $0.00 $0.00 $0.00 $0.00 $7.33
Average $2.05 $4.36 $22.35 $5.26 $0.24 $2.48 $0.08 $0.90 $6.37 $44.10
Farm No Animal Health
Contract Services
Supp Feed & Agistmt Pasture Casual
LabourFreight/ Cartage
Shearing Supplies Other Selling
CostsTotal Var.
Costs
$/HA $/HA $/HA $/HA $/HA $/HA $/HA $/HA $/HA $/HA
553 $17 $99 $336 $32 $0 $31 $3 $27 $76 $620555 $24 $83 $433 $6 $0 $0 $3 $8 $78 $635556 $35 $59 $390 $71 $0 $10 $2 $4 $72 $643574 $31 $96 $356 $182 $0 $0 $0 $15 $152 $832638 $38 $104 $0 $251 $0 $42 $6 $29 $26 $496643 $69 $40 $0 $162 $42 $48 $0 $26 $90 $477
1018 $56 $103 $1,220 $76 $0 $204 $0 $0 $339 $1,9991019 $21 $0 $60 $39 $0 $0 $0 $22 $24 $1661022 $0 $131 $0 $132 $0 $0 $0 $0 $0 $263
Average $32 $79 $311 $106 $5 $37 $1 $15 $95 $681

53 Livestock Farm Monitor Project | Victoria 2018 -19
Beef Cattle Variable Costs 2018-19 Gippsland TABLE C8
Farm No Enterprise Animal Health
Contract Services
Supp Feed & Agistmt Pasture Casual
LabourFreight/ Cartage Other Selling Costs Total Var.
Costs
$/DSE $/DSE $/DSE $/DSE $/DSE $/DSE $/DSE $/DSE $/DSE
553 Spring $2.21 $0.00 $32.33 $2.17 $0.00 $1.26 $1.41 $3.08 $42.46556 Spring $0.67 $0.53 $45.28 $5.72 $0.00 $1.16 $0.00 $3.15 $56.51574 Spring $0.84 $0.00 $16.13 $8.11 $0.00 $0.00 $1.00 $0.43 $26.52638 Spring $1.48 $1.00 $6.65 $9.02 $0.00 $1.09 $0.62 $0.88 $20.74643 Spring $1.34 $0.00 $2.69 $8.41 $0.92 $1.28 $0.56 $1.67 $16.87663 Spring $1.96 $0.88 $1.11 $14.89 $0.00 $1.77 $0.72 $2.96 $24.28664 Spring $1.27 $0.00 $5.68 $6.60 $0.00 $1.27 $0.75 $0.33 $15.89667 Other $1.16 $0.00 $9.13 $10.41 $0.54 $4.64 $0.64 $0.52 $27.04698 Autumn $0.70 $0.00 $25.22 $7.58 $0.00 $0.05 $0.00 $4.36 $37.90698 Spring $1.46 $0.00 $21.68 $7.58 $0.00 $1.75 $0.00 $6.79 $39.25698 Other $1.31 $0.00 $5.91 $7.58 $0.00 $0.00 $0.00 $0.00 $14.80755 Autumn $5.88 $0.00 $16.91 $6.19 $0.00 $1.57 $0.00 $2.60 $33.16755 Spring $4.62 $0.00 $33.80 $6.19 $0.00 $1.75 $0.00 $3.15 $49.50804 Autumn $3.49 $0.00 $26.39 $8.71 $0.34 $0.63 $3.78 $0.15 $43.48
1014 Autumn $1.33 $3.34 $5.46 $6.46 $0.00 $4.00 $0.83 $4.01 $25.431014 Spring $0.93 $2.27 $7.67 $6.46 $0.00 $2.79 $0.52 $3.28 $23.921018 Spring $1.31 $0.00 $12.66 $5.76 $0.00 $3.07 $0.00 $5.15 $27.961019 Spring $0.16 $0.00 $23.77 $4.01 $0.00 $0.68 $0.03 $1.75 $30.401021 Spring $0.79 $0.00 $12.25 $5.96 $0.00 $1.36 $0.93 $2.61 $23.901022 Spring $2.60 $0.00 $0.00 $3.69 $0.00 $0.00 $0.78 $0.00 $7.071022 Other $0.00 $0.00 $30.67 $3.69 $0.00 $3.85 $1.16 $0.00 $39.36
Average $1.69 $0.38 $16.26 $6.91 $0.09 $1.62 $0.65 $2.23 $29.83
Farm No Animal Health Contract Services
Supp Feed & Agistmt Pasture Casual Labour Freight/
Cartage Other Selling Costs Total Var. Costs
$/HA $/HA $/HA $/HA $/HA $/HA $/HA $/HA $/HA
553 $32 $0 $471 $32 $0 $18 $21 $45 $619556 $8 $7 $564 $71 $0 $15 $0 $39 $704574 $19 $0 $361 $182 $0 $0 $22 $10 $594638 $41 $28 $185 $251 $0 $30 $17 $25 $578643 $26 $0 $52 $162 $18 $25 $11 $32 $325663 $54 $24 $30 $408 $0 $49 $20 $81 $665664 $27 $0 $119 $138 $0 $27 $16 $7 $333667 $24 $0 $189 $215 $11 $96 $13 $11 $559698 $14 $0 $493 $148 $0 $1 $0 $85 $740698 $29 $0 $423 $148 $0 $34 $0 $133 $767698 $26 $0 $115 $148 $0 $0 $0 $0 $289755 $161 $0 $462 $169 $0 $43 $0 $71 $907755 $126 $0 $924 $169 $0 $48 $0 $86 $1,353804 $79 $0 $599 $198 $8 $14 $86 $3 $9871014 $22 $56 $91 $107 $0 $67 $14 $67 $4231014 $15 $38 $128 $107 $0 $46 $9 $55 $3981018 $17 $0 $168 $76 $0 $41 $0 $68 $3701019 $2 $0 $233 $39 $0 $7 $0 $17 $2981021 $9 $0 $144 $70 $0 $16 $11 $31 $2811022 $93 $0 $0 $132 $0 $0 $28 $0 $2541022 $0 $0 $1,102 $132 $0 $138 $42 $0 $1,415
Average $39 $7 $326 $148 $2 $34 $15 $41 $612
Appendices : Gippsland

Livestock Farm Monitor Project | Victoria 2018 -19 54
Pasture Costs Per Grazed Hectare 2018-19 GippslandTABLE C9
Farm No Seed Chemicals Contract Services Fert & Soil Conditioners Other Total Pasture Cost
$/KG GRAZED HA $/KG GRAZED HA $/KG GRAZED HA $/KG GRAZED HA $/KG GRAZED HA $/KG GRAZED HA
553 $8 $1 $0 $23 $1 $33555 $0 $3 $0 $3 $0 $6556 $0 $6 $7 $27 $32 $71574 $61 $17 $3 $54 $4 $145636 $12 $1 $16 $13 $0 $43638 $0 $1 $0 $261 $5 $267643 $0 $1 $0 $149 $7 $165653 $0 $0 $0 $4 $0 $4663 $0 $0 $0 $416 $0 $416664 $3 $1 $0 $137 $7 $148667 $0 $8 $0 $224 $0 $233698 $44 $16 $20 $23 $69 $172755 $35 $9 $13 $160 $0 $217804 $73 $45 $94 $318 $0 $5301014 $11 $0 $0 $105 $0 $1161017 $9 $3 $0 $5 $0 $171018 $45 $6 $0 $28 $0 $781019 $6 $31 $0 $5 $0 $421021 $5 $4 $4 $57 $0 $701022 $5 $2 $23 $103 $0 $132
Average $16 $8 $9 $106 $6 $145Top 20% # * $2 $3 $6 $153 $3 $170Top 20% * $2 $3 $6 $153 $3 $170
Overhead Costs Per Hectare 2018-19 GippslandTABLE C10
Farm No Paid Labour Fuel & Vehicle Insurance R&M - Plant
and Equip.R&M - Land and Improv. Admin Rates &
Rents Sundries Depreciation Total Overheads
$/HA $/HA $/HA $/HA $/HA $/HA $/HA $/HA $/HA $/HA
553 $6 $17 $15 $30 $16 $22 $32 $1 $37 $177555 $65 $6 $10 $5 $6 $22 $23 $1 $8 $146556 $110 $14 $17 $20 $46 $44 $17 $16 $44 $326574 $68 $2 $17 $0 $25 $36 $8 $6 $28 $190636 $105 $2 $8 $5 $9 $15 $21 $3 $24 $193638 $170 $3 $29 $6 $57 $34 $50 $0 $27 $376643 $49 $3 $12 $11 $67 $20 $25 $0 $31 $219653 $0 $0 $17 $13 $24 $3 $27 $0 $24 $108663 $2 $0 $21 $21 $83 $67 $39 $15 $44 $291664 $142 $42 $33 $0 $136 $33 $53 $10 $41 $489667 $176 $4 $24 $28 $57 $44 $45 $2 -$17 $363698 $0 $57 $33 $26 $18 $101 $70 $7 $62 $372755 $176 $36 $30 $0 $82 $13 $20 $3 $62 $421804 $0 $17 $55 $154 $21 $58 $83 $0 $211 $599
1014 $44 $39 $10 $32 $101 $36 $27 $0 $10 $2991017 $22 $11 $6 $10 $26 $15 $16 $1 $5 $1101018 $72 $48 $12 $13 $15 $33 $21 $10 $70 $2921019 $30 $14 $9 $14 $6 $42 $0 $0 $0 $1141021 $31 $5 $5 $5 $2 $20 $7 $0 $4 $791022 $113 $45 $13 $7 $11 $20 $23 $0 $60 $291
Average $69 $18 $19 $20 $40 $34 $30 $4 $39 $273Top 20% # $120 $23 $20 $12 $67 $29 $37 $3 $29 $340Top 20% * $120 $23 $20 $12 $67 $29 $37 $3 $29 $340
Appendices : Gippsland
# Gippsland Top 20% ranked by RoA* Gippsland Top 20% ranked by EBIT/ha
# Gippsland Top 20% ranked by RoA* Gippsland Top 20% ranked by EBIT/ha

55 Livestock Farm Monitor Project | Victoria 2018 -19
Capital Structure 2018-19 GippslandTABLE C11
Farm Labour Efficiency and Enterprise Mix 2018-19 GippslandTABLE C12
Average Top 20% # Top 20% *
FARM AREA (HA)
Freehold Area 762 661 661
Area Leased In 78 138 138
Area Leased Out 2 12 12
Effective Area 703 659 659
LAND VALUES
Total Land Value per Effective Hectare $10,376 $13,945 $13,945
Total Land Value per DSE $539 $603 $603
Owned Land Value per Hectare $8,396 $11,401 $11,401
Leased Land Value per Hectare $8,994 $12,492 $12,492
OTHER ASSETS (per Effective Hectare)
Plant & Vehicles $455 $376 $376
Livestock $1,416 $2,063 $2,063
Hay & Grain on Hand $38 $14 $14
Other Assets $174 $303 $303
Total Assets $12,459 $16,700 $16,700
LIABILITIES
Liabilities per Effective Hectare $982 $2,526 $2,526
EQUITY
Equity per Effective Hectare $10,045 $12,083 $12,083
Average Equity % 80% 73% 73%
RATIOS
Debt Ratio 8% 12% 12%
Plant & Equipment Ratio 3.4 4.1 4.1
Average Top 20% # Top 20% *
SHEEP ENTERPRISES
Average Sheep Number 2,313 775 775
Sheep Labour Efficiency (ha/person) 286 90 90
Sheep Labour Efficiency (DSE/person) 4,056 2,264 2,264
BEEF ENTERPRISES
Average Cattle Number 597 1,276 1,276
Cattle Labour Efficiency (ha/person) 476 459 459
Cattle Labour Efficiency (DSE/person) 8,553 11,182 11,182
TOTAL LABOUR EFFICIENCY
Hectares per person 373 292 292
DSE per person 6,231 6,983 6,983
ENTERPRISE MIX
Wool Sheep (%) 27% 0% 0%
Prime Lambs (%) 9% 10% 10%
Beef (%) 62% 90% 90%
Hay/Cropping (%) 2% 1% 1%
Appendices : Gippsland
# Gippsland Top 20% ranked by RoA* Gippsland Top 20% ranked by EBIT/ha
# Gippsland Top 20% ranked by RoA* Gippsland Top 20% ranked by EBIT/ha

Livestock Farm Monitor Project | Victoria 2018 -19 56
Supplementary Feed Data 2018-19 GippslandTABLE C13
Appendices : Gippsland
Yield (Wet T/HA)
Amount Fed to Sheep (Average wet KG/DSE)
Amount Fed to Cattle (Average wet KG/DSE)
Area Cut (HA)
Farm No Pasture Hay Silage Pasture Hay Silage Grain Pasture Hay Silage Grain Pasture Hay Silage
553 5.1 0.0 29.6 29.0 74.4 27.5 0.0 0 47555 0.0 0.0 135.4 0 0556 0.0 0.0 83.3 5.6 0.0 14.6 0 0574 27.3 0.0 8.2 40.0 0.0 0.0 0 0636 40.4 7.1 76.2 0 0638 3.0 0.0 0.0 0.0 18.5 0.0 0.0 40 0643 3.0 9.5 0.0 0.0 0.0 1.5 6.7 0.0 13 10653 24.7 0.0 0.0 0 0663 2.0 1.6 0.0 0.0 5 0664 5.5 7.1 7.7 9.6 0.0 25 17667 9.9 10.8 15.0 19.6 0.0 17 13698 8.4 0.0 0.0 0 0755 5.0 4.6 47.4 39.1 0.0 30 44804 1.9 3.4 15.7 108.3 0.0 8 351014 4.7 2.1 14.9 7.3 0.0 30 121017 0.0 0.0 0.0 0 01018 2.0 1.0 0.0 0.0 9.2 6.3 3.3 0.0 10 101019 3.1 2.4 0.0 0.0 0.0 48.1 7.0 0.0 20 201021 0.0 0.0 0.0 0 01022 0.0 0.0 0.0 0.0 0.0 0.0 0 0
Average 4.0 5.1 7.7 3.1 28.4 19.1 14.3 0.9 10 10

57 Livestock Farm Monitor Project | Victoria 2018 -19
Year Gross Income Variable Costs Overhead Costs Net Income EBIT (Operating Profit)
Return on Assets
Return onEquity
NOMINAL($/HA)
REAL($/HA)
NOMINAL($/HA)
REAL($/HA)
NOMINAL($/HA)
REAL($/HA)
NOMINAL($/HA)
REAL($/HA)
NOMINAL($/HA)
REAL($/HA)
2004-05 $344 $479 $114 $159 $74 $103 $156 $217 $92 $128 3.0% 4.0%
2005-06 $282 $377 $144 $193 $78 $104 $60 $80 -$22 -$29 -0.4% -1.6%
2006-07 $293 $384 $140 $183 $85 $111 $67 $88 -$27 -$35 -0.7% -2.2%
2007-08 $604 $757 $251 $315 $105 $132 $248 $311 $148 $186 2.1% 1.0%
2008-09 $392 $484 $240 $297 $116 $143 $36 $44 -$52 -$64 -1.6% -5.0%
2009-10 $456 $546 $187 $224 $117 $140 $152 $182 $59 $71 0.4% -0.5%
2010-11 $697 $806 $202 $234 $164 $190 $330 $382 $178 $206 2.6% 2.1%
2011-12 $690 $788 $226 $258 $196 $224 $268 $307 $90 $103 1.9% 0.7%
2012-13 $536 $599 $236 $264 $207 $231 $93 $104 -$68 -$76 0.3% -0.8%
2013-14 $695 $753 $259 $281 $415 $450 $21 $23 $86 $93 1.2% -0.1%
2014-15 $776 $828 $259 $277 $204 $218 $313 $334 $168 $179 2.0% 1.5%
2015-16 $795 $840 $325 $344 $200 $211 $270 $285 $152 $161 2.2% 3.2%
2016-17 $1,192 $1,236 $371 $385 $283 $293 $320 $332 $362 $376 3.6% 4.5%
2017-18 $920 $934 $339 $345 $256 $260 $95 $96 $143 $145 1.8% 2.4%
2018-19 $884 $884 $554 $554 $273 $273 -$165 -$165 -$97 -$97 -1.9% -4.0%
Long Term Average $713 $287 $206 $175 $90 1.1% 0.3%
2018-19 vs LT avg $170 $267 $67 -$339 -$187 -3.0% -4.4%
Appendices : Gippsland
Historical Gross Margins For Livestock Enterprises – GippslandTABLE C15
Year Wool Sheep Prime Lamb Beef Cattle
NOMINAL($/DSE)
REAL ($/DSE)
NOMINAL($/HA)
REAL ($/HA)
NOMINAL($/DSE)
REAL ($/DSE)
NOMINAL($/HA)
REAL ($/HA)
NOMINAL($/DSE)
REAL ($/DSE)
NOMINAL($/HA)
REAL ($/HA)
2004-05 $15 $21 $162 $225
2005-06 $8 $11 $91 $122
2006-07 $9 $12 $99 $130
2007-08 $18 $23 $243 $305 $17 $21 $277 $347
2008-09 $4 $4 $48 $59 $15 $19 $221 $273
2009-10 $15 $18 $145 $174 $25 $30 $353 $423 $18 $21 $249 $298
2010-11 $34 $39 $327 $378 $41 $48 $710 $821 $24 $28 $418 $483
2011-12 $29 $33 $324 $371 $35 $40 $627 $716 $19 $21 $344 $394
2012-13 $23 $26 $259 $290 $20 $23 $435 $486 $13 $15 $220 $245
2013-14 $52 $57 $664 $720 $38 $41 $636 $689 $28 $30 $605 $656
2014-15 $20 $21 $246 $263 $34 $36 $710 $758 $25 $27 $480 $512
2015-16 $37 $39 $449 $475 $33 $35 $475 $502 $30 $32 $472 $499
2016-17 $40 $42 $450 $467 $40 $42 $651 $676 $44 $46 $816 $846
2017-18 $52 $53 $664 $675 $38 $38 $636 $646 $28 $28 $605 $615
2018-19 $10 $10 $125 $125 $29 $29 $688 $688 $12 $12 $290 $290
Long Term Average $27 $318 $33 $585 $26 $484
2018-19 vs LT avg -$17 -$193 -$4 $103 -$14 -$194
Note: ‘Real’ dollar values are the nominal values converted to 2018-19 dollar equivalents by the C.P.I. to allow for inflation. The data in the above table from 2004-05 to 2008-09 has been obtained from the Sheep Farm Monitor Project. Data from 2009 -10 onwards has been obtained from the Livestock Farm Monitor Project. Early figures for prime lamb and beef cattle enterprises were not reported in the old Sheep Farm Monitor Projects and are therefore not shown in the above table.
Average Whole Farm Economic Performance – GippslandTABLE C14
Note: ‘Real’ dollar values are the nominal values converted to 2018-19 dollar equivalents by the C.P.I. to allow for inflation. The data in the above table from 2004-05 to 2008-09 has been obtained from the Sheep Farm Monitor Project. Data from 2009-10 onwards has been obtained from the Livestock Farm Monitor Project.

Livestock Farm Monitor Project | Victoria 2018 -19 58
Year Prime Lamb Beef Cattle
Wool Cut (Gr.) Net Wool Price Ave Sale Price Lamb Calving Av Sale Price
KG/HA NOMINAL($/KG) GR.
REAL($/KG) GR.
NOMINAL($/HD)
REAL($/HD) % % NOMINAL
($/HD)REAL($/HD)
2004-052005-062006-072007-08 32.0 $3.80 $4.76 $72 $91 103%2008-09 24.8 $3.42 $4.23 $79 $97 99%2009-10 30.5 $3.61 $4.32 $99 $119 103% 89% $652 $781 2010-11 35.0 $4.30 $4.97 $132 $153 103% 88% $780 $902 2011-12 35.9 $4.65 $5.31 $108 $123 111% 90% $783 $895 2012-13 43.1 $4.72 $5.26 $79 $88 109% 90% $682 $761 2013-14 38.0 $5.08 $5.50 $103 $112 100% 91% $677 $734 2014-15 41.0 $5.69 $6.07 $105 $112 106% 89% $854 $912 2015-16 38.0 $6.83 $7.22 $96 $101 102% 91% $1,053 $1,113 2016-17 31.7 $5.23 $5.43 $129 $134 111% 89% $1,285 $1,333 2017-18 29.2 $7.65 $7.77 $130 $132 102% 90% $1,063 $1,080 2018-19 38.0 $8.08 $8.08 $127 $127 100% 92% $1,007 $1,007
Long Term Average 34.5 $5.53 $115 104% 90% $9522018-19 vs LT avg 3.5 $2.55 $12 -4% 2% $55
Year Stocking Rate Wool Sheep
Micron Wool Cut (Gr.) Net Wool Price Ave Sale Price Lamb
DSE/HA KG/HA NOMINAL ($/KG) GR.
REAL ($/KG) GR.
NOMINAL ($/HD)
REAL ($/HD) %
2004-05 11.4 19.0 36 $5.33 $7.42 $41 $57 74%2005-06 11.7 18.8 37 $5.38 $7.19 $31 $41 73%2006-07 11.2 18.4 36 $6.47 $8.47 $23 $30 74%2007-08 15.3 18.8 43 $6.86 $8.60 $42 $53 79%2008-09 13.0 18.5 34 $5.62 $6.95 $37 $46 70%2009-10 13.0 18.2 31 $6.28 $7.53 $62 $75 62%2010-11 15.4 18.6 34 $8.79 $10.17 $92 $106 66%2011-12 17.2 18.4 37 $7.92 $9.05 $72 $82 84%2012-13 17.0 18.7 44 $7.81 $8.72 $54 $61 81%2013-14 18.0 18.6 43 $7.88 $8.54 $48 $52 80%2014-15 18.2 18.2 48 $7.71 $8.23 $58 $62 77%2015-16 0.2 17.7 51 $9.10 $9.62 $72 $76 81%2016-17 17.4 18.0 43 $11.42 $11.84 $92 $95 59%2017-18 16.9 18.1 42 $14.19 $14.41 $91 $93 67%2018-19 18.1 17.7 35 $13.74 $13.74 $72 $72 71%
Long Term Average 14.3 18.4 40 $9.37 $67 73%2018-19 vs LT avg 3.8 -0.6 -4 $4.38 $5 -2%
Appendices : Gippsland
Historical Data For Selected Average Profitability Indicators – Gippsland
TABLE C16
Note: ‘Real’ dollar values are the nominal values converted to 2018-19 dollar equivalents by the C.P.I. to allow for inflation. The data in the above table from 2004-05 to 2008-09 has been obtained from the Sheep Farm Monitor Project. Data from 2009 -10 onwards has been obtained from the Livestock Farm Monitor Project. Early figures for prime lamb and beef cattle enterprises were not reported in the old Sheep Farm Monitor Projects and are therefore not shown in the above table.

59 Livestock Farm Monitor Project | Victoria 2018 -19
Glossary
Cost structure
Variable costs as a percentage of total costs, where total costs equal variable costs, overhead costs and owner/operator allowance.
Debt ratio
Interest and lease costs as a percentage of gross farm income.
Earnings before interest and tax (EBIT)
Previously reported as operating profit.
EBIT is calculated by subtracting variable costs, overhead costs and owner/operator allowance from gross farm income. EBIT is the return from all the capital used in the business.
Effective hectares
All figures expressed per hectare are per effective hectare unless otherwise stated.
Total hectares minus the area of land which is of little or no value for livestock or crop production (e.g. house and shed area).
Equity
Total assets minus total liabilities. Equal to the total value of capital invested in the farm business by the owner/ operator(s).
Grazed hectares
Effective hectares minus two thirds of the cropped area- assumes that a third of the cropped area is grazed at some time during the year.
Gross farm income
Income from each enterprise, wool, lamb and beef, etc., and is calculated by multiplying price received per unit by the number of units. Non-cash income such as changes in inventory of livestock or stocks of other inputs/output such as feed produced and conserved are also included.
Gross margin
Gross income minus variable costs for a specific enterprise.
Net Income
Gross farm income minus variable and overhead costs, not including owner/operator labour.
Net farm income
EBIT minus interest and lease charges. The amount of profit available for capital investment, loan principal repayments and tax.
Overhead costs
All fixed costs that cannot be easily allocated to a specific enterprise (e.g. fuel, permanent labour, rates, administration, depreciation, etc) but excluding interest, leases, capital expenditure, principal repayments and tax.
Owner/operator allowance
Allowance for the owner/operator’s own labour. Set at $87,349 per year (pro rata for actual time worked) for 2018-19. In addition, an allowance of $45,973 per year (pro rata for actual time worked) is provided for other unpaid family labour.
Return on assets (RoA)
EBIT divided by the value of total assets. RoA gives an indication of how efficiently a business generates profit from its assets under management (owned and leased).
Return on equity (RoE)
Net farm income divided by the equity value. RoE gives an indication of efficiency by measuring the return on the farmers’ equity. If RoE is lower than RoA, the cost of the capital invested is greater than the profit generated on the additional assets.
Variable costs
Variable costs are costs that are specific to an enterprise, such as animal health and supplementary feed costs, and vary directly in relation to the size of the enterprise. Subtracting specific variable costs, i.e. wool variable costs, from specific enterprise income, i.e. wool income, gives a wool gross margin.

Livestock Farm Monitor Project | Victoria 2018 -19 60
List of abbreviations
ABARES Australian Bureau of Agricultural and Resource Economics and Sciences
AWEX Australian Wool Exchange
BoM Bureau of Meteorology
cwt Carcass weight
DJPR Department of Jobs, Precincts and Regions, Victoria
DSE Dry Sheep Equivalent
LFMP Livestock Farm Monitor Project
EBIT Earnings before interest and tax
ha Hectare(s)
kg Kilograms
lwt Live weight
M Million
ML Megalitre
MLA Meat and Livestock Australia
mm Millimetres. 1 mm is equivalent to 4 points or 1/25th of an inch of rainfall
NFI Net Farm Income
OTH Over the hook
RoA Return on assets
RoE Return on equity
t Tonne = 1,000 kg
yrs Years old
Standard values
Standard values are used to calculate changes in value of stock on hand. The main standard values used in 2018-19 are shown below.
WOOL SHEEP ($/HEAD) 2018-19
Ewes $109
Weaners $98
Wethers $109
Rams $71
CATTLE ($/HEAD) 2018-19
Cows $1,190
Heifers $892
Weaners $340
Steers 1-2 yrs $960
Steers 2+ yrs $1,458
Bulls $1,778
CROPS ($/TONNE WET) 2018-19
Pasture hay $359
Silage $190
Wheat $414
Oats $460
Barley $399
Canola $512
PRIME LAMBS ($/HEAD) 2018-19
Ewes $169
Weaners $177
Wethers $101
Rams $227


Customer Service Centre 136 186 www.agriculture.vic.gov.au