
Livestock exclusion influences on riparian vegetation ...lshs.tamu.edu/docs/lshs/end-notes/livestock...
10
Many streams in the United States experience severe bank retreat and habitat destruction resulting from live- stock access (lUck;ird and Cuslririg 1982: Stuber 1985; Brown 2003; VDCR 2)06). Unrestricted stream access results in frequent defecation in and near the water, a decrease in riparian vegetation diversity and densit . and weakened streambanks that are highly erod- ible and physically degraded (Kauffman and Krueger 1984: Chanc y et al. 1 99) );Wilhianisori et al. 1992: Trnisble and Mendel 1995; Fitch and Adams 1998: Clary 1999; Scarsbrook and Halliday 1999: Strand and Merritt 1999: Soto-Grajales 2002: Parkvn et al. 2003). Numerous studies have found that livestock access creates a combination of reduced channel boundar y resistance and rncre,iscd stream power such that bank erosion and subsequent mass failure occur (Chancy et ,il 1991); P Ia tts 199t M ,Irstou P94; LJSBLM 1994). The reduction of riparian vegetation ni.iv also result ill increased water tempera- tures and fine bed sediment; hence, aquatic invertebrate density may be reduced (Rabeni and Minshall 1977: Mnishall 1984; Chancy et al. 1990; WohI and Canine 1995; Br;iccia and Voshcll 20806). A review by Belsky et al. (1999) indicated that approximately 85% of rip.iriari livestock studies concluded that live- stock access negativel y impacts stream mor- phology and aquatic habitat. The USI )A Natural Resnurces Conservation Service's (NRCS) Conserva-tion Reserve Enhancement Program (CREP) is the most funded conservation programs ni Virginia. with $91 million in federal and state fund- ing allocated for the program 'earl (VI)CR 2006). The goal of CREP is to reduce sedi- mnent and nutrients runoff troni agricultural lands into streams through livestock exclusion and the establishnient of pollution-filtering vegetation (l3lann et al. 2002: USDA NRCS 2005; VDCR 2(106). Unfortunately, since the CRE1' program is vo1unta1-; iriiplemcntatmon of livestock exclusion practices tends to hap- pen piecemeal, resulting ill protection of short stretches of stream, while the remaining stream lengths continue to be impacted by livestock access. Few best management practices (BMPs), including livestock exclusion practices, are monitored to evaluate their effctiveness following minplenieritation (Kondolf 1995; Kondolf and Michell 1995; Bash and Ryan 2002; Blain et al. 2)102: l&om et al. 2002; Palmer et al. 2005). The goal of this research was to determine the success of livestock exclusion practices in improving channel morphology,riparian vegetation, and ben - thic mnacroinvertebrate assemblages over time. To accomplish this, we focused on two main objectives: (I) assess the effectiveness of existing livestock exclusion projects in south- western Virginia and (2) evaluate the time to achieve unproved channel morphology and benthic niacroirivertebrate assemblages once exclusion projects have been implemented. doi:io.2489/jswc.64.1.33 Livestock exclusion influences on riparian vegetation, channel morphology, and benthic macroinvertebrate assemblages S.C. Ranganath, W.C. Hession, and T.M. Wynn Abstract: Measurements in paired stream reaches with and without livestock access iii south- western Virginia suggest that livestock exclusion practices installed oil isolated stream reaches result in improved geomorphic and riparian vegetation conditions, but do not signifi- cantly improve benthic niacroinvertehrate assemblages. Numerous state and federal programs encourage agricultural producers to protect environmentall y sensitive lands (such as streams and wetlands) through the elimination of livestock access to these sensitive areas. In addi- tion to achieving soil conservation goals, it is widel y believed that livestock exclusion from streanis will result in improvements in riparian vegetation, channel morphology, as well as instream habitat and aquatic insect assemblages. This research assessed the changes in chan- nel morphology, riparian vegetanon, and benthic macroinvertebrate assemblages as affected b y livestock exclusion over time. Study sites consisted of paired, nearly contiguous stream reaches (five pairs), with and without active livestock access, across a range of time since livestock exclusion was implemented. Four of the livestock exclusion reaches ranged in time since best management practice implementation froin I to 14 years, while one site consisted of a grazed reach paired with a reach that has been forested and without cattle access for at least 50 years. Livestock exclusion reaches were significantly deeper, had larger iiiedian riffle substrate, and scored higher oil Reach Condition Index (a qualitative geomorphic assess- ment methodology ). The livestock exclusion reaches also had significantly higher riparian groundcover vegetation bioinass; however, the benthic macroinvertebrate assemblages were not significantly different. The only parameter that showed correlation with time since live- stock exclusion was the Reach Condition Index, which increased (indicating improved hank stability) with time since livestock exclusion. ()ill- observations suggest that, while livestock exclusion From streanis has positive impacts oil best management practice miplemen_ tation along short stream stretches does not have the desired instream benefits. In particular, bentlsic n1acroinvertebrate response depends more on upstream watershed-scale conditions and impacts than localized, reach-scale livestock-access issues. Therefore, a more targeted approach addressing entire stream lengths and the associated watersheds may be required to restore the integrity of aquatic ecosystems. Key words: hentlnc nia(:roinvertehrates—channel morphology—livestock exclusion— riparian butlers JOURNAL OF SOIL AND WATER CONSERVATION JAN/FEB 2009—VOL. 64, NO. i 1 33
Transcript of Livestock exclusion influences on riparian vegetation ...lshs.tamu.edu/docs/lshs/end-notes/livestock...

Many streams in the United Statesexperience severe bank retreat andhabitat destruction resulting from live-stock access (lUck;ird and Cuslririg 1982:Stuber 1985; Brown 2003; VDCR 2)06).Unrestricted stream access results in frequentdefecation in and near the water, a decrease inriparian vegetation diversity and densit . andweakened streambanks that are highly erod-ible and physically degraded (Kauffman and
Krueger 1984: Chancy et al. 1 99) );Wilhianisoriet al. 1992: Trnisble and Mendel 1995; Fitchand Adams 1998: Clary 1999; Scarsbrookand Halliday 1999: Strand and Merritt 1999:Soto-Grajales 2002: Parkvn et al. 2003).Numerous studies have found that livestockaccess creates a combination of reducedchannel boundary resistance and rncre,iscdstream power such that bank erosion andsubsequent mass failure occur (Chancy et ,il
1991); P Ia tts 199t M ,Irstou P94; LJSBLM1994). The reduction of riparian vegetationni.iv also result ill increased water tempera-tures and fine bed sediment; hence, aquaticinvertebrate density may be reduced (Rabeniand Minshall 1977: Mnishall 1984; Chancyet al. 1990; WohI and Canine 1995; Br;icciaand Voshcll 20806). A review by Belsky et al.(1999) indicated that approximately 85% ofrip.iriari livestock studies concluded that live-stock access negativel y impacts stream mor-phology and aquatic habitat.
The USI )A Natural Resnurces ConservationService's (NRCS) Conserva-tion ReserveEnhancement Program (CREP) is the mostfunded conservation programs ni Virginia.with $91 million in federal and state fund-ing allocated for the program 'earl (VI)CR2006). The goal of CREP is to reduce sedi-mnent and nutrients runoff troni agriculturallands into streams through livestock exclusionand the establishnient of pollution-filteringvegetation (l3lann et al. 2002: USDA NRCS2005; VDCR 2(106). Unfortunately, since theCRE1' program is vo1unta1-; iriiplemcntatmonof livestock exclusion practices tends to hap-pen piecemeal, resulting ill protection ofshort stretches of stream, while the remainingstream lengths continue to be impacted bylivestock access.
Few best management practices (BMPs),including livestock exclusion practices, aremonitored to evaluate their effctivenessfollowing minplenieritation (Kondolf 1995;Kondolf and Michell 1995; Bash and Ryan2002; Blain et al. 2)102: l&om et al. 2002;Palmer et al. 2005). The goal of this researchwas to determine the success of livestockexclusion practices in improving channelmorphology,riparian vegetation, and ben -thic mnacroinvertebrate assemblages overtime. To accomplish this, we focused on twomain objectives: (I) assess the effectiveness ofexisting livestock exclusion projects in south-western Virginia and (2) evaluate the time toachieve unproved channel morphology andbenthic niacroirivertebrate assemblages onceexclusion projects have been implemented.
doi:io.2489/jswc.64.1.33
Livestock exclusion influences on riparianvegetation, channel morphology, andbenthic macroinvertebrate assemblagesS.C. Ranganath, W.C. Hession, and T.M. Wynn
Abstract: Measurements in paired stream reaches with and without livestock access iii south-western Virginia suggest that livestock exclusion practices installed oil isolated streamreaches result in improved geomorphic and riparian vegetation conditions, but do not signifi-cantly improve benthic niacroinvertehrate assemblages. Numerous state and federal programsencourage agricultural producers to protect environmentall y sensitive lands (such as streamsand wetlands) through the elimination of livestock access to these sensitive areas. In addi-tion to achieving soil conservation goals, it is widel y believed that livestock exclusion fromstreanis will result in improvements in riparian vegetation, channel morphology, as well asinstream habitat and aquatic insect assemblages. This research assessed the changes in chan-nel morphology, riparian vegetanon, and benthic macroinvertebrate assemblages as affectedby livestock exclusion over time. Study sites consisted of paired, nearly contiguous streamreaches (five pairs), with and without active livestock access, across a range of time sincelivestock exclusion was implemented. Four of the livestock exclusion reaches ranged in timesince best management practice implementation froin I to 14 years, while one site consistedof a grazed reach paired with a reach that has been forested and without cattle access for atleast 50 years. Livestock exclusion reaches were significantly deeper, had larger iiiedian rifflesubstrate, and scored higher oil Reach Condition Index (a qualitative geomorphic assess-ment methodology). The livestock exclusion reaches also had significantly higher ripariangroundcover vegetation bioinass; however, the benthic macroinvertebrate assemblages werenot significantly different. The only parameter that showed correlation with time since live-stock exclusion was the Reach Condition Index, which increased (indicating improved hankstability) with time since livestock exclusion. ()ill- observations suggest that, while livestockexclusion From streanis has positive impacts oil best management practice miplemen_tation along short stream stretches does not have the desired instream benefits. In particular,bentlsic n1acroinvertebrate response depends more on upstream watershed-scale conditionsand impacts than localized, reach-scale livestock-access issues. Therefore, a more targetedapproach addressing entire stream lengths and the associated watersheds may be required torestore the integrity of aquatic ecosystems.
Key words: hentlnc nia(:roinvertehrates—channel morphology—livestock exclusion—riparian butlers
JOURNAL OF SOIL AND WATER CONSERVATION JAN/FEB 2009—VOL. 64, NO. i1 33

/
J.
)
- —0 30 60 120 160 240 km
NFl
SCA2SCA1
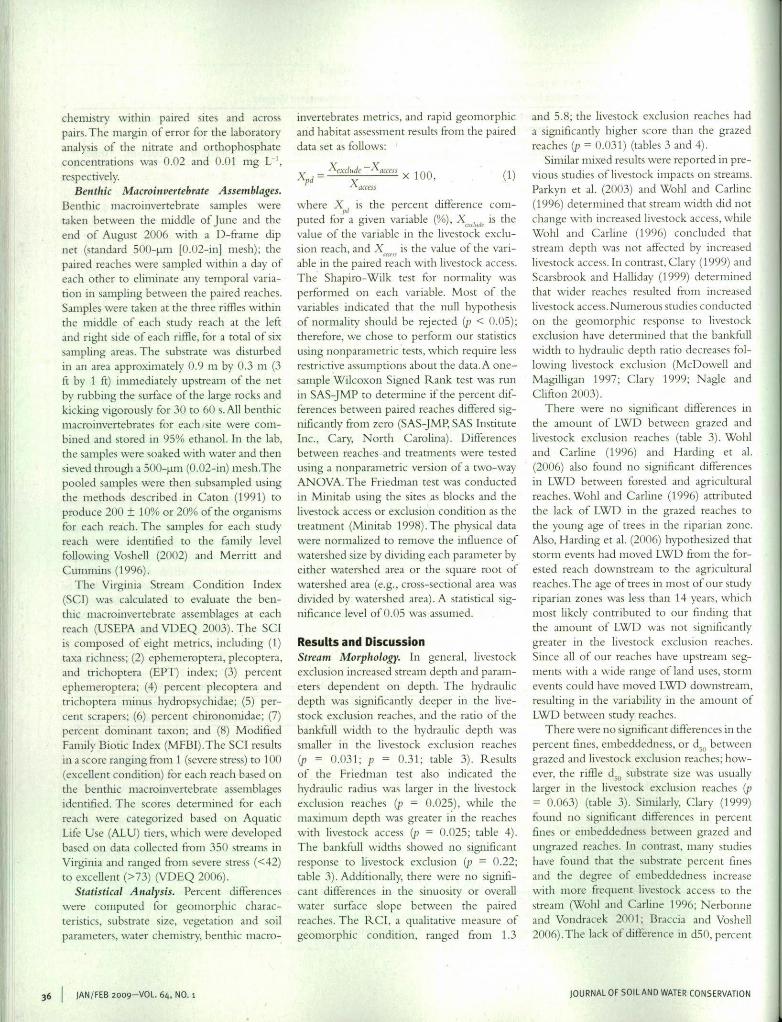
Notes: TCI = grazed Tom's Creek reach. TC2 = livestock exclusion Tom's Creek reach.SCA1 = grazed Sinking Creek A reach. SCA2 = livestock exclusion Sinking Creek A reach.SCB1 grazed Sinking Creek reach. SCB2 = livestock exclusion Sinking Creek B reach.NFl = grazed North Fork of the Roanoke River reach. NF2 = livestock exclusion North Fork ofthe Roanoke River reach. JC1 = grazed Johns Creek reach. JC2 = livestock exclusionJohns Creek reach.
Figure 1Location of study sites for livestock exclusion study in Virginia.
Materials and MethodsStudy Location and Watershed Characteristics.Five pa irs of contiguous stream reaches withand without livestock access were stud-ied during 2006. The paired reaches arelocated in agricultural watersheds in south-western Virginia oil North Fork of theRoanoke River, Toiss's Creek, Johns Creek,and Sinking Creek (figure I). The reacheswith livestock access to the stream were usedby heifer cattle as water and shade sources:between 15 and 6)) head of cattle grazed thebanks and accessed the streams dail y (table1). Since the paired reaches essentially havethe same contributing watershed, any dif1ir-ences found were assunied to be caused bylocal conditions (e.g., soils, topography, ripar-ian condition, and livestock or no livestock).The grazed reaches had unrestricted live-stock access. Four of the livestock exclusionreaches ranged in tulle since BMP unple-nientation from one to 14 years, while onesite consisted of a grazed reach paired withan ungrazed reach that has been forested forat least 50 years. The upstre:uu and down-stream extents of each reach were locatedwith a global positioning system (GPS) withdifferential correction Watershed boundarieswere delineated for each study reach usingthe National Watershed Boundary 1 )atasetfor Virginia (VDCR 2007) as a base map;the watersheds boundaries were then refinedto match the reach outlets using heads-updigitizing in ArcGlS 9.0 (ESRI. Redlands.California) (figure ]:table 2).Tlic watershed-level land use characteristics for each reachwere then quantified using the watershedboundaries intersected with digital land usespatial data layers From 2000 (RESAC 2)103)(table 1).
Stream Morpholog) To quantify thephysical condition of each reach, surveyingand standard streani nsorphologv assessmentmethods were used (Harrelson et al 1994).Study reaches were surveyed for a nmiinniumn
len-th of 20 times the bankfull width using aLeicaTC 307 total station (Leica GeosystenisA(',, St. Gallen, Switzerland). Longitudinalprofiles were surveyed to determine streanigradient, water surfisce slope, and the loca-tion of bed features, such as riffles and pools.Channel cross-sectional profiles were sur-veyed for two riffles and two pools alongeach reach and used to quantify channeldimensions and floodplain features. Thecross-sectional data were used to deter-niine bankfull width, average bankfull depth,
•Fenced or forested reachesOGrazed reaches
II Watershed boundariesStreams
width to depth ratio, and cross-sectional area.Average, or hydraulic, depth in each crosssection was deternimned by dividing thecross-sectional area b y the width at bank-full stage (Mecklenburg 2004). The widthto depth ratio was calculated in each crosssection as the hankfull top width divided bythe average bankfull depth. The means of thebankfull hydraulic depth and width to depthratio were then calculated over the four sur-veyed cross sections in each reach.
Reach-averaged grain-size distributionswere determined in each hedformn type(pools and riffles) using a modification ofthe Wolman (1954) pebble count (Riley etal. 2003). Within each reach, 100 pebbleswere measured in two pools and two rifflesfor a total of 4110 pebbles using a US ForestService gravelonieter. Median particle sizes(d5 ) were computed for the entire reach, as
JC1
^,2 C2
well as for the riffles separately; the percentfines in each reach were determined by cal-culating the percent of bed material less than2 nun (0.08 in) in diameter. Eniheddednesswas estimated within a single riffle ineach study reach using methods describedin Barbour et al. (1999). The nuniber oflarge woody debris (LWI)) pieces withinthe bankfitll channel greater than 0.10 in((1.33 ft) diameter and 1.0 in (3.3 ft) lengthwere counted (Montgonierv et al. 1995).
The Virginia l)epartusen t of F nvilon-mental Quality (VI )EQ) Reach ConditionIndex (RCI) was used to evaluate streamgeomorphic condition, adjustment pro-cesses, and reach sensitivity (USE1A andVDEQ 2(106). The RCI was determinedbased oil field evaluation of channel condi-tion, instreain habitat, and riparian land useand land cover.
34)AN/FEB 2009—VOL. 64. NO. i JOURNAL OF SOILAND WATER CONSERVATION

Table Paired reach and watershed characteristics for Livestock exclusion study conducted in southwestern Virginia.
Livestocknumber orGrazingexclusiondensity Urban!Natural
Paired site Reachpractice(AU ha- 1)ForestresidentialgrassPastureCroplandsOther
Toms Creek 30 cattle27.643.1%36.8%1.9%6.4%10.2%1.5%TCFenced 2 years5.043.8%36.2%2.1%6.3%10.1%1.5%
I Sinking Creek-ASCA20 cattle18.456.2%6.6%0.6%9.4%26.9%
0.4%SCAFenced 2 years3.756.7%6.6%0.6%9.0%26.7%0.4%
Sinking Creek-BSC13-111115 cattle13.858.3%9.3%1.6%8.6%21.8%
0.3%SCB Ide
Fenced 4 years34.257.2%9.2%1.7%8.7%22.8%
0.3%North Fork Roanoke RiverNF60 cattle55.260.9%11.2%1.6%7.9%18.0%0.3%
Fenced 14 years32.060.5%11.7%1.6%7.9%18.0%
0.3%Johns Creek JC.40 cattle36.878.0%7.2%11.1%0.0%0.0%
3.6%
JC dForested0.078.0%7.5%10.9%0.0%0.0%3.7%Note: AU ha = animal units per hectare of grazed pasture. Values for AU from National Range and Pasture Handbook (USDA NRCS 2003).
Streambank Soils and Riparian Vegetation.Soil hulk densities were measured in thestreambanks of each reach by taking anundisturbed soil core at each depositionallayer usina 3 cm by 5 ciii (2 in by 2 in) alu-nunum cylinder with a slide hammer (Wynnand Mostaghimi 2006). Since the soil sanipleswere taken from alluvial streanihanks, the soillayers that were present were linked moreto depositional events and did not exhibit atypical upland soil profile. Additiona11, thereaches with livestock access had highly dis-turbed banks with little distinct la yering inareas of intense trampling. Soil cores weretaken at two random locations on the sideof each streambank for a total of four loca-tions per soil layer. Because the streambanksoil stratigraphy varied between sites, the
samples were not taken the sanie distancedown the hank face, but were instead takenin each depositional layer. The soil sampleswere weighed and dried at 105°C (221'F)withui eight hours of samplin g (USDANRCS 201(4). Livestock grazing intensityvaried along the study reaches; therefore,the niedian hulk density was deteriinned tocapture the reach-wide impacts of livestockaccess. All groundcover below I in (3.3ft) height was cut to ground level in 1 1112
(3.3 ft) areas; groundcover greater than Ini (3.3 f}) height within the I ni (3.3 ft)area was left uncut (Bonhani I 989). Thesevegetation samples were dried in an oven at60°C (140°F) and then weighed to deter-mine dry bioniass at each site (kg Iia' [lbac'])
Insirean Habitat and Water ChemistryThe Rapid Habitat Assessment (1 1.3 IA) wasused to evaluate the habitat quality of eachreach (Barbour et al. 1999).The RHA assignsa score ranging front 0 (poor habitat condi-tion) to 200 (optimal habitat condition) to astre.iiii reach based on streanihed characteris-tics, channel niorphology, bank structure, andriparian zone.
To quickly evaluate gross stream-waterchiernistr a grab-sample was taken at eachpaired reach and a laboratory analysis wasconducted for nitrate and orthophosphateconcentrations (USEPA 1983; Clesceri etal. 1998).These grab sanmples were taken thesame day benthic niacroinvertebrates werecollected and were prnnarmhy taken to ensurethat there were no major differences in water
Table 2Drainage area, stream order, distance between reaches, and soil texture in livestock exclusion study conducted in southwestern Virginia.
Drainage areaStreamReach positionDistance betweenReachBank soilReach(km2) order*in pair reachest (m)length (m)texture
TC 25.7 3 Upstream 216.8 237.0Sandy clay loamTC ,ie26.4 3 Downstream- 159.8
Sandy loam
SCA40.5 3 Downstream612.4 201.3
Sandy clay loamSCAed38.2 3 Upstream - 117.0Sandy clay loamSCB107.2 4 Downstream1145.2 142.9
Sandy loam
SCB do97.4 4 Upstream - 198.7
Sandy loam
NE0105.8 4 Upstream 656.4 174.2
Sandy clay loamNF , d109.3 4 Downstream 267.2Sandy clay loamJC 171.0 5 Downstream1237.4 421.0Sandy loamJC 0 ,166.5 5 Upstream - 184.3
Sandy loam
Notes: IC = Toms Creek. SCA = Sinking Creek A. SOB = Sinking Creek B. NF = North Fork of the Roanoke River. JC = Johns Creek.* USGS (1:24,000) quad sheets were used to determine stream order. Blue line streams were considered 1st order.t The distance from the outlet of the upstream reach to the inlet of the downstream reach.
JOURNAL OF SOILAND WATER CONSERVATION IAN/FEB 2009-VOL. 64, NO.1 1 35
chemistry within paired sites and acrosspairs. The margin of error for the laboratoryanalysis of the nitrate and orthophosphateconcentrations was 0.02 and ().01 mg L,respectively.
Benthic Macro in verteb rate Assemblages.Benthic macroinvertebrate samples weretaken between the middle of June and theend of August 2006 with a 1)-frame dipnet (standard 500-(am 10.02-in] mesh): thepaired reaches were sampled within a day ofeach other to eliminate any temporal varia-tion in sampling between the paired reaches.Samples were taken at the three riffles withinthe middle of each study reach at the leftand right side of each riffle, for a total of sixsampling areas. The substrate was disturbedin an area approximately 0.9 ill ((.3 inft by 1 ft) immediately upstream of the netby rubbing the surface of the large rocks andkicking vigorously for 30 to 60 s. All benthicmacroinvertebrates for each site were com-bined and stored in 95% ethanol. In the lab,the samples were soaked with water and thensieved through a 500-nl (0.02-in) mesh.Thepooled samples were then subsampled usingthe methods described in Caton (1991) toproduce 200 ± 10% or 20% of the organismsfor each reach. The samples for each studyreach were identified to the famil y levelfollowing Voshell (2002) and Merritt andCummins (1996).
The Virginia Stream Condition Index(SCI) was calculated to evaluate the hen-thic niacronivertcbrate assemblages at eachreach (USEPA and VDEQ 2003). The SCIis composed of eight metrics, including (I)taxa richness: (2) ephcnieroptera, plecoptera,and trichoptera (EPT) index: (3) percentephenieroptera; (4) percent plecoptera andtrichoptera minus hvdropsychidae; (5) per-cent scrapers: (6) percent chirononudae: (7)percent dominant taxon: and (8) ModifiedFamil y Biotic Index (MFBI).The SCI resultsill score ranging from 1 (severe stress) to 1(1(1(excellent condition) for each reach based onthe benthmc niacroinvertebrate assemblagesidentified. The scores determined for eachreach were categorized based oilLife Use (ALU) tiers, which were developedbased on data collected from 35(1 streams inVirginia and ranged from severe stress (<42)to excellent (>73) (VDEQ 2006).
Statistical Analysis. Percent differenceswcl -e computed for geomorphic charac-teristics, substrate size, vegetation and soilpnheters, water chernistry, benthic macro-
invertebrates metrics, and rapid geomorphicand habitat assessment results from the paireddata set as follows:
= X.viuex 100, (1)
where X is the percent difference com-puted for a given variable (%). X ,: j is thevalue of the variable in the livestock exclu-sion reach, and X is the value of the van-able in the paired reach with livestock access.The Shapiro-Wilk test for normality wasperformed oil variable. Most of thevariables indicated that the null hypothesisof normality should be rejected (p < 0.115);therefore, we chose to perform our statisticsusing nonparanietric tests, which require lessrestrictive assumptions about the data. A onesample Wilcoxon Signed Rank test was runin SAS-JMP to determine if the percent dif-ferences between paired reaches differed sig-nificantly from zero (SAS-JMP. SAS InstituteInc., Cary, North Carolina). I )ifferencesbetween reaches and treatments were testedusing a nonparametric version of a two-wayANOVA. The Friedman test was conductedin Mmitab using the sites as blocks and thelivestock access or exclusion condition as thetreatment (Minitab 1998). The physical datawere normalized to remove the influence ofwatershed size by dividing each parameter byeither watershed area or the square root ofwatershed area (e.g., cross-sectional area wasdivided by watershed area). A statistical sig-nificance level of (((5 was assumed.
Results and DiscussionStream Morphology. In general, livestockexclusion increased stream depth and param-eters dependent on depth. The hydraulicdepth was significantly deeper in the live-stock exclusion reaches, and the ratio of thehankfull width to the hydraulic depth wassmaller in the livestock exclusion reaches(p = 0.031: p = 0.31; table 3). Resultsof the Friedman test also indicated thehydraulic radius was larger in the livestockexclusion reaches (p = (1.025), while themaximum depth was greater in the reacheswith livestock access (p = 0.025; table 4).The bankfull widths showed no significantresponse to livestock exclusion (p ((.22;table 3). Additionally, there were no signifi-cant differences in the sinuosity or overallwater surface slope between the pairedreaches. The Rd, a qualitative measure ofgeomorphic condition, ranged from 1.3
and 5.8; the livestock exclusion reaches hada significantly higher score than the grazedreaches (p = 0.031) (tables 3 and 4).
Similar mixed results were reported in pre-vious studies of livestock impacts on streams.Parkvn et al. (2003) and WohI and Carline(1996) determined that stream xvidth did notchange with increased livestock access, whileWohl and Carline (1996) concluded thatstream depth was not affected by increasedlivestock access. In contrast. diary (1999) andScarsbrook and Halliday (1999) determinedthat wider reaches resulted from increasedlivestock access. Numerous studies conductedoil the geomorphic response to livestockexclusion have determined that the bankfiillwidth to hydraulic depth ratio decreases fol-lowing livestock exclusion (McDowell andMagilligan 1997; Chary 1999: Nagle andClifton 2003).
There were no significant differences inthe amount of LWD between grazed andlivestock exclusion reaches (table 3). WohIand Carlmne (1996) and Harding et al.(2(11)6) also found no significant differencesin LWD between forested and agriculturalreaches. Wohl and Carhmne (1996) attributedthe lack of LWI) in the grazed reaches tothe young age of trees in the riparian zone.Also. Harding et al. (2006) hypothesized thatstorm events had moved LWI) from the for-ested reach downstream to the agriculturalreaches.The age of trees in most of our studyriparian zones was less than 14 years, whichmost likely contributed to our finding thatthe aillount of LWD was not significantlygreater in the livestock exclusion reaches.Since all of our reaches have upstre.mni seg-ments with a wide range of land uses, stormevents could have moved LWD downstream,resulting in the variability in the amount ofLWI) between study reaches.
There were no significant differences in thepercent fines. embeddedness, or d, betweengrazed and livestock exclusion reaches: how-ever, the riffle d. substrate size was usuallylarger in the livestock exclusion reaches (p= ((.1(63) (table 3). Similarly. Clary (1999)found no significant ditTrences m percentfines or emnbeddcdness between grazed andummgrazed reaches. In contrast, many stnmdmeshave found that the substrate percent finesand the degree of emiibeddedness increasewith more frequent livestock access to thestream ('Wohl and C:u'lmmie 1996; Nerhonneand Vommdracek 2(1(11; Braccia and Voshell2006).The lack of difference in 60. percent
36JAN/FE8 2009—VOL. 64, NO. 1 JOURNAL OF SOIL AND WATER CONSERVATION
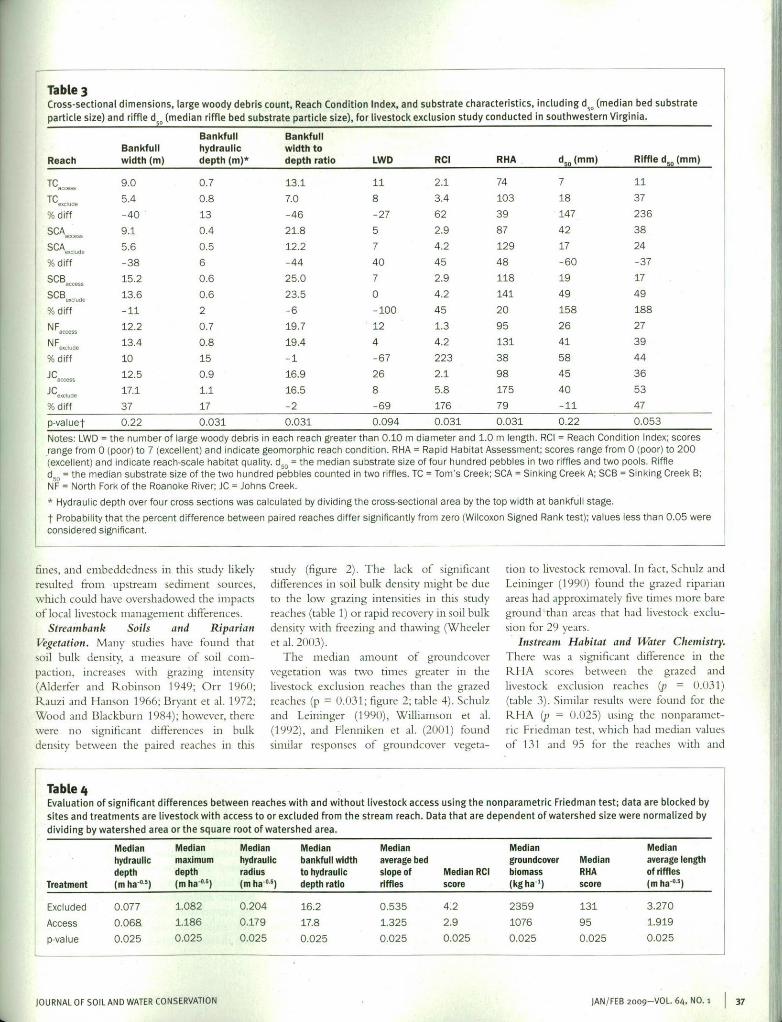
Table 3Cross-sectional dimensions, large woody debris count, Reach Condition Index, and substrate characteristics, including d 50 (median bed substrateparticle size) and riffle d 50 (median riffle bed substrate particle size), for livestock exclusion study conducted in southwestern Virginia.
BankfullBankfullBankfullhydraulicwidth to
Reachwidth (m)depth (m)*depth ratioLWDRCIRNAd50 (mm)Riffle d 50 (mm)
9.00.7 13.1112.17471.1
TC5.40.87.0 83.41031837
%diff-4013 -46-276239147236
SCA CCS9.1 0.4 21.8 5 2.98742 38SCA 15.6 0.5 12.2 7 4.212917 24%diff-386 -44404548-60-37
SOB15.20.625.072.91181917access
SCB Id13.6 0.6 23.5 0 4.214149 49%diff-112 -6 -1004520158188
NF12.20.7 19.7121.3952627
NF,13.40.819.444.21314139
%diff1015 -1 -67223385844
JC12.50.916.9262.1984536
iC id17.1 1.1 16.5 8 5.817540%diff3717 -2 -6917679-1147
p-valuet0.220.0310.0310.0940.0310.0310.220.053Notes: LWD = the number of large woody debris in each reach greater than 0.10 m diameter and 1.0 m length. RCI = Reach Condition Index; scores.range from 0 (poor) to 7 (excellent) and indicate geomorphic reach condition. RHA = Rapid Habitat Assessment; scores range from 0 (poor) to 200(excellent) and indicate reach-scale habitat quality. d 0 = the median substrate size of four hundred pebbles in two riffles and two pools. Riffled 5o = the median substrate size of the two hundred pebbles counted in two riffles. TO = Toms Creek; SCA = Sinking Creek A: SOB = Sinking Creek B;NF = North Fork of the Roanoke River; JC Johns Creek.* Hydraulic depth over four cross sections was calculated by dividing the cross-sectional area by the top width at bankfull stage.
t Probability that the percent difference between paired reaches differ significantly from zero (Wilcoxon Signed Rank test); values less than 0.05 wereconsidered significant.
fines, and enibeddedness in this study likelyresulted froni upstream sediment sources,which could have overshadowed the impactsof local livestock management differences.
StreambankSoilsandRiparianVegetation. Many studies have found thatsoil hulk density, .i measure of soil cuni-paction. increases with grazing intensity(Alderfer and Robinson 1949: Orr 1960;R.auzi and Hanson 1966: Bryant et al. 1972;Wood and Blackburn 1984); however, therewere no significant differences in bulkdensity between the paired reaches in this
study (figure 2). The lack of significantdifferences in soil bulk density might be dueto the low grazing intensities in this studyreaches (table 1) or rapid recover y in soil bulkdensity with freezing and thawing (Wheeleret al. 21)1)3).
The median amount of groundcovervegetation was two nines greater in thelivestock exclusion reaches than the grazedreaches (p = ).()31; figure 2; table 4). Schulzand Leinniger (1990), Williamson et al.(1992), and Flenniken et a]. (20111) foundsimilar responses of groundcover vegeta-
tion to livestock removal. In fact. Schulz andLeininger (1990) found the grazed riparianareas had approximately five tnmles niore bareground than areas that had livestock exclu-sion for 29 years.
fnstreaum Habitat and Water Chemistry.There was a significant difference in theRHA scores between the grazed andlivestock exclusion reaches (j) = 0.031)(table 3). Similar results were found for theRHA (j) = 0.025) using the nonparaniet-nc Fricdnian test, which had median valuesof 131 and 93 for the reaches with and
Table 4Evaluation of significant differences between reaches with and without livestock access using the nonparametric Friedman test; data are blocked bysites and treatments are livestock with access to or excluded from the stream reach. Data that are dependent of watershed size were normalized bydividing by watershed area or the square root of watershed area.
MedianMedianhydraulicmaximumdepthdepth
Treatment(m ha 15 )( m ha1 5)
Excluded0.0771.082
Access0.0681.186
Lp-value0.0250.025
JOURNAL OF SOILAND WATER CONSERVATION
MedianMedianMedianhydraulicbankfull widthaverage bedradiusto hydraulicslope of(m ha 15 )depth ratioriffles
0.20416.20.5350.17917.81.3250.0250.0250.025
Mediangroundcover
Median RCIbiomassscore(kg ha')
4.223592.910760.0250.025
MedianMedianaverage lengthRNAof rifflesscore(m ha-0 5)
1313.270951.919
0.0250.025
AN/FEB 2009-VOL. 64, NO. 137
TIC SCASOB NE JC
oj
EC.)
18CQ
.0C
a)
2.0
1.8
1.6
1.4
1.2
1.0
0.8
0.6
0.4
0.2
0.0
Figure 2Groundcover vegetation biomass and median bulk density for each paired reach in livestockexclusion study conducted in southwestern Virginia.
4,000 -1
TC SCASCB NE JC
Paired reaches
Paired reachesNotes: IC = Tom's Creek. SCA = Sinking Creek A. SCB = Sinking Creek B. NF = North Fork ofthe Roanoke River. JC = Johns Creek. Bulk density error bars indicate +1 standard deviation withn ^: 4. The median bulk density value was determined considering all the bulk densities taken ateach soil horizon in each study reach.
3,500
3,000
2,500
2,000
1,500
1,000
500
18(8
E0.0
0I.,
C
0C,
Without livestock exclusion, respectively(table 4) 1 herefbre. both statistical techniquesprovided sinular results, providing additionalconfidence iii their validity.
The VDEQ screened several sets ofVirginia habitat quality data to determinethat the Ridge and Valle y Ecoregion usu-ally has a rani.e of RHA scores between 120and 140. A habitat score below 120 indicatesthe reach has poor habitat condition. Whilea score above 140 indicates the reach hasgood habitat conditions (VDEQ 2006). TheRHA scores from this study were generallyon the lower end of the VDEQ Ridge andValley Ecorcgion scores in the grazed reaches(74 to 118) and on the higher end in thelivestock exclusion reaches (103 to 175).Stone et al. (2005) and Braccia and Voshell(2006) used the RHA to distinguish habitatconditions between study reaches in Virginiawith varying degrees of cattle density. Bracciaand Vosliell (2006) assigned an RHA score of156 to their reference reach in southwesternVirginia, which is lower than the score forthe forested reach ill this study (175).
There were no significant dith,rences inthe nitrate and orthophosphate concen-trations between the grazed and livestockexclusion reaches. In contrast, Galeone et al.(2006) deternuncd that nitrate and phospho-rus concentrations increase with increasedagricultural land use. The overall summerorthophosphate concentrations range troi ii
11.00050 to ((.12 ing L for streams in theRidge and Vallcy Ecoregion (USEPA 20()0).The orthophosphate concentrations for thisstudy reaches (0.017 to ((.12 nit I. ') werewithin this range and were higher tliaiithe mean concentration (0016 mg L) forstreams in the Ridge and Valley Ecoregion(USEPA 20)1))). The nitrate concentrationsfor this study reaches (0.040 to (1.1(81 mg L)fell in the lower range of values typical ofnitrite/nitrate concentrations in Ridge andValley Ecoregion streams ((1.003 to 8.950 nigI. ': LJSE1A 2000).
Benthic Macroin,'ertebrates. We tested fordifferences in the EPT index, the SCI, aswell as the eight components used in theSC]. There were no significant dif}rencesin any of the henthic inacromnvertebratemetrics. In the interest of space, we onlyreport Taxa Richness, HI T index .and SC!(table 5). Nerbonne and Vondracek (2)1(11),WohI and Carline (1995). and Parkyn etal. (2003) similarly found no significantdifferences in the henthic imlacroinverte-
brate metrics between grazed and livestockexclusion reaches. Stone et al. (2005) foundno significant differences in the EPT scoresbetween reaches with a range of agriculturalland use: however, Scarsbrook and Halliday1999) and Galeone et al. (2(1(16) found
higher E1T scores with decreased livestockaccess to time streani. In addition. Galeone etal. (2006) found that taxa richness increasedwith increased agricultural land nse. Carlineand Walsh (2)11)7) found that nlacroinverte-brate diversity indices did not change afterfencing, but densit y did increase. F lowever.
our sanmplmng methods were not designed tomeasure density.
Nerbonne and Vondracek (2(11)1) attrib-uted the lack of benthic niacrommivertebrateresponse in their study in southeasternMunmesota to the influence of watershedcharacteristics rather than localized livestockgrazuig uifluei ices. Watershed topographyand land use dictate the conditions to whichbenthic nmacroiuvertcbrates respond, includ-
ig temperature. discharge, flood frequencyand inagimitude, and delivery of sedimentand nutrients (Troelstrup and Perr y 1989:
38 1 IAN/FEB 2009—VOL. 64, NO. i JOURNAL OF SOIL AND WATER CONSERVATION

Table 5Taxa richness, Ephemeroptera, P(ecoptera,Trichoptera index, and Stream Condition Index forlivestock exclusion study conducted in southwestern Virginia.
Reach Taxa richness
TC
14TCflCIUde 17
% diff
21
SCA
20
SCA,.F 23
% diff
15
SCB
21
S CB
17
% diff -19
NE
14
N F
17
% diff
21
Jc
18
J C
18
% diffpvalue* 0.19
Nerboiiiie and Vondracek 2001). Parkynet al. (2003) attributed the lack of benthiciiiacroiiivcrtehrate response to livestockexclusion to variations ill betweenreaches. The age, length. and vegetation typein buffers affect the amount of shading avail-able to the stream reach and mw alter thestream temperature to which certain hcnthicmacroinvertebratc assenib1ases are sensitive(Quinn et al. 1992: Rutherford et al. 1999;Parkyn ct al. 2003). In our study reaches, fourof the livestock exclusion reaches were mostlikely not niature enough (2 to 14 years) tosignificantly increase shading and thereforeuitluciice stream teniperature.
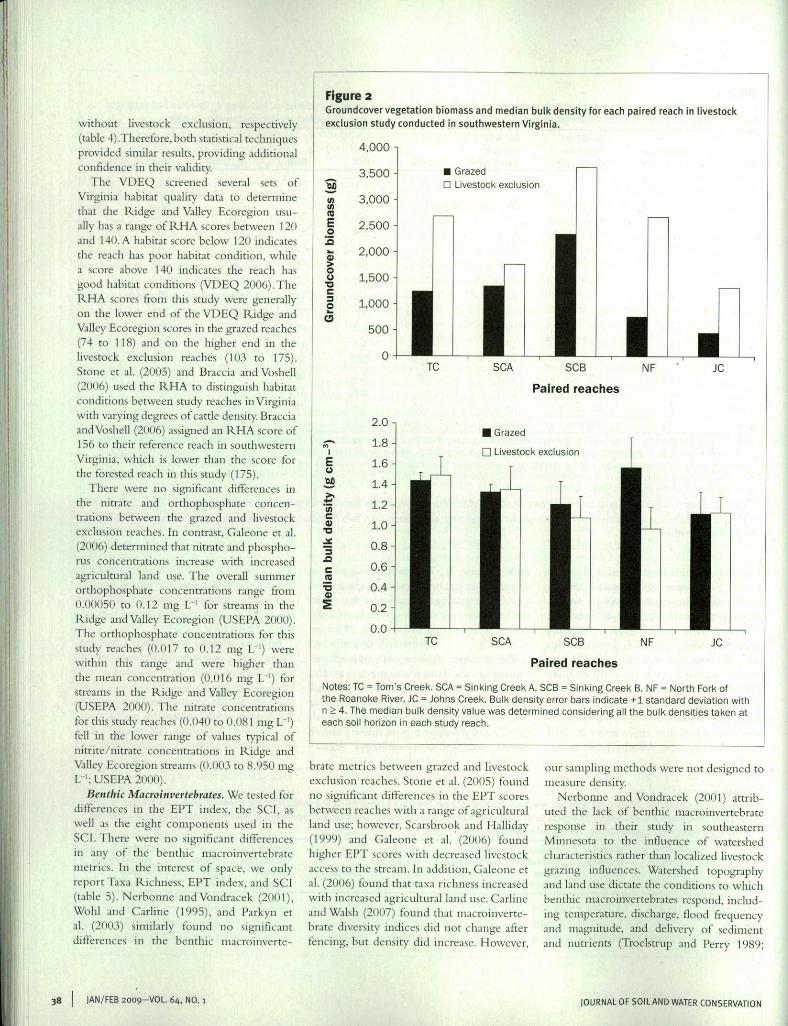
Time to Recovery. To evaluate the timerequired for recovery ni channel morphol-ogy once exclusion projects are iniplemented,several parameters were plotted oil scatterPlots (figure 3). Only the RCI plot displayeda relationship to tine (figure 3); however.the RCI is a qualitative nieasure estimatedusing visual observation. Therefore, onemight expect RCI to have the most rapidresponse to livestock exclusion practices.Sinular qualitative geomorphic assessilientswere conducted by Parkyn et A. (2003),Scrimiigeour and Kend.ill (2003). and Hardinget al. (2006). and the y all found improve-mlleiits iii bank stability indices followinglivestock exclusion. Galeone et al. (2006) also
Stream ConditionEPT index Index
7 60.6
7 60.1
0 -1
11 73.2
13
69.5
18 -5
11
74.5
72.8
-18 -2
7 60.0
7 59.3
0 -1
9 70.5
8 73.7
-11 5
0.70 086
conducted qualitative visual geomorphicassessnients and determined that the avail-able substrate cover, pool to riffle ratio, andbank stability showed iniprovenients withinfour years following streanibank fencing forlivestock exclusion.
Closer inspection of the bankfull widths(figure 3) highlights the coniplexiry involvedin evaluating changes over rime since exclu-sion. Nunierous studies have reported thatlivestock access results in wider streani chan-nels (Truiible and Mendel 1995: Clary 1999:Scarsbrook and Halliday 1990). Trmible andMendel (1993) presented a sclseniatic rep-resenting the recovery of a stream channelafter livestock exclusion that suggested that,once the cattle were removed, the grassesalong the streanihank would he allowed togrow, resulting in increased sediment trap-pig and channel narrowing. Additionally,there arc nunierous studies that suggest thatsniall streanis with riparian forests are widerthai] those with non-forested, or grassy, veg-etation (1 )avies-Collev 1997: Trinible 1997;Hession et al. 2003). While the data set inthis study is small (n = 5), the sites wherecattle were recently excluded (2. 2.5, and4 years) fall below the [A1 luie ill figure 3(livestock exclusion narrower than grazed),and the sites with older exclusion (14 and>50 years) plot above the line. In addition,
the oldest site plots the furthest above the1: I line, suggesting it has widened the most.Such a progression from a narrov4 grassychannel to a wider, forested channel hasbeen predicted by several authors (Davies-Colley 1997; Trinible 201)4). The complexinteractions between cattle impacts and theinfluence of riparian vegetation oilwidth highlight the need for iiiore researchto better understand the processes and tun-ing of channel recovery and change afterlivestock exclusion.
The remaining study paraiiieters were notsignificantly correlated to duration of live-stock exclusion. McDowell and Magilligan(1997) sinularly determined that the degreeof channel aquatic and geouiorphic recov-ery was not directly related to the aniountof tune livestock were excluded. Theyattributed this finding to possible difflr-ences iii initial conditions, local controls, andhydrologic conditions during the period oflivestock exclusion. Sinularly, these pairedstudy Sites are in ditrent watersheds withdifferent watershed characteristics, upstreanidisturbances, and initial conditions. To moorethoroughly evaluate the changes over time,one would need a much larger data set tofill the gaps in the distribution of time snicefencing and to provide multiple sites withsimilar exclusion durations. However, thesefindings suggest the first paranieter in whichone would expect to see changes is a visualqualitative index of physical characteristics(RCI).The riparian and aquatic wildlife willlikely take Icuger to recover and niay requireunproved upstream and watershed condi-tion for complete recovery.
Summary and ConclusionsFive paired stream reaches \vitli and with-out cattle access in southwestern Virginiawere studied to (I) assess the effectivenessof existing livestock exclusion projectsin unproving stream niorpholog stream-bank and riparian characteristics, andbenthic niacrouiivertebrate assemblages and(2) determine the range of iiiprovenieuitexpected over inne since livestock exclu-sion insplenientation. There were significantdifhrcnces in stream niorphology and ripar-ian vegetation between paired grazed andlivestock exclusion reaches; however, thehenthic niacroinvertebrate assemblages werenot significantly different. The B.Cl, a quali-tative geoniorphic assessment niethodologyincreased with rime since livestock exclm.i-
Notes: EPT = Ephemeroptera, Plecoptera, Trichoptera. TC = Tom's Creek. SCA = Sinking Creek A.SCB = Sinking Creek B. NE = North Fork of the Roanoke River. JC = Johns Creek.* Probability that the percent differences between paired reaches differ significantly from zero(Wilcoxon Signed Rank test); values less than 0.05 were considered significant.
JOURNAL OF SOIL AND WATER CONSERVATION AN/FEB 20D9—VOL. 64. NO. 139

024681012141618
18
16
14
12
10
8
6
4
E
C
C0
UCIl,0
—j
Figure 3Ban klull width in two riffle and two pool cross sections and Reach Condition Index (RC I) forth epaired reaches in the livestock exclusion study conducted in southwestern Virginia.
Grazed ban kfull width (m)
01234567
Grazed RCI
C.)
C5C('I
4U*C
300
0
sion. All other parameters showed no cleartemporal response.
The lack of benthic niacroinvertebrateassemblage response likel y resulted from theoverall land use, soils, and geologic featuresof the watersheds rather than the localizedimpacts of livestock access to the streamreach. These results suggest that short see-
dons of livestock eXClLlSiOii may not resultin improved biological integrity. Rather, awatershed-wide initiative to reduce nega-tive impacts (including livestock access) tostreams must be taken to meet the goals ofthe US Clean Water Act. Roughly 591 mil-lion is budgeted annually for the CREI'program to fence livestock out of streams;
however, the fencing and buffering of sniallisolated stream reaches without addressingadditional stressors at the watershed-scalemay not be the best restoration strategy. 'Wesuggest a more targeted approach to iniple-menting BMPs, such as livestock exclusionthat focuses on long stretches ofstrcains and/or entire watersheds.
AcknowledgementsWe isoull like to ili.,,ik rh' 'soil and Wirer Csits•rvatioiSiscierv On ill_ar til,lus'tar\ ,,'olst,ince iii the lot its of a K.E.Grant Scholarship to S.C. Ratiganath. in addition, we sin-cerely thank the landowners who allowed us to conduct thisresearch oil property and, tti particular, we dedicate thismanuscript to Fred Sithlett who passed ,IWaV in 2007.2iiii7. Theauthors would also like to thank the faculty, stalL Undergrad-uate. and graduate students at Virginia Tech that providedthe technical and held assistance required for this research.These people include J . P... Vosliell. Kristine 13rottttettkattt.Dave Stewart. Jessica Kozarek. Shasvnt Rosettqtiist, AprilEilerv Bethany Hezak, Andrea Ludwig, Sara Morris. KyleHall, julie Jordan, Laur,, Teentt Barbra Utley. Kes'tti tir.intuatt.Gene Yagow. 'AT. Michael Ansi ,.it,d Fred Betifield in addi-non, we would like to thi,,t,k those 55-ho ofFered their sup-port at the Virginia i )epartittenit of Environmental Qn.slire,the Soil and Water Conservation District, .itid the USDANatural Resources Conservation Service, We also svo,tl,l likeis desist three reviewers and editor for their comments.
ReferencesAldesier, Ii, ii., and R.R. Robuttson, 1949. Runoff from
pature si s'cl.stiont to grazing intensity and soil corn-'sactsost Journ.il of the American Societ y of Agrononiv39:948-958,
Harbour, MT., J. Gerritsen, Il. Snyder. and J. Stribling.1999. Rapid Bioassesitient Protocols for use inStreams and Wideable Rivers. Pernphytou. BentlucMacrotnvertebrates and Fish, \'sLisltntgton. DC: USEnvirot,iiieutai Protection Ageticv
Bash, J.S.. and C.M. lf..van. 20812. Streaiti restorationandesshi,iticeitie,tt projects: 1, anyone isionitorltig?Euvironiit,ental Management 29(6)877-885.
Belskt A., A. Matzke, atid S. Usel,ttan. 1999. Survey of live-stock itihisietices oil stream and ripariatt ecosvstenis mtthe western United States. journal of Soil md WaterConservation 54(l):4 19-431.
lOam,, K i.E Nerbonnte,an,i B.Vondr,ieek. 2(11)2. Rel.imsonslupof ripari.mii huller type to water ientperature in the drift-less area ecoregioti of Minnesota. North AmericanJournal of Fisheries Management 22121:441-451
i3onh.itin, C.D. 19119. Measurements for terrestrial vegetation.Nev, York. NY: Johns Wile y A Sons.
l3raccna, A., and J. Vosheli. 2006e Environmental dictumaccounting for lseiith,c unacroinvertebrate assemblagestructure it the sample scale iii stre.mnits subjected to itgradient of cattle gr.sziisg. Hidrohiulogia 573(l):55-73.
Brosvti. S. 2003, Forests in Transition. h(tp://www.cl1esa-
Bryant.Bts'.mitt. El.. K.E. Bl,iser, and .1k. Peterson, 1972. Etl'ect oftrampling isv cattle isis bluegrass yield and soil coot-p.menots itt' it mneadosvvihle baits. Agronomy Journal64:331-334.
:.srhtie. K.E. and M.C. Walsh. 2007. Responses to rip.ir_iii restor.,tmcmti nit tile Spring Creek watershed, central
Peititsvlvaitia. Restoration Ecology 11(4):731-742.
Notes: IC = Tom's Creek. SCA = Sinking Creek A. SCB = Sinking Creek B. NF = North Fork of theRoanoke River. JC = Johns Creek. The number in the parenthesis indicates the duration of timethat livestock exclusion practices have been in place on the livestock exclusion reaches. Pointsabove the 1:1 line indicate that the parameter is larger in the livestock exclusion reaches, andpoints below the 1:1 line indicate that the parameter is larger in the grazed reaches. To observea time distribution for improved geomorphic condition, the data points would follow a trend withtwo years as being the closest to the 1:1 line and 50 years as the furthest away.
40IAN/FEB 2009—VOL. 64, NO. i JOURNAL OF SOILAND WATER CONSERVATION
( atori. L.W. 199 1. Ititproving Suissanrpling Methods forthe EPA Rapid Bioassesstrterrt" Ilenthic Protocols.Bulletin of the North American Berrthological Society8(3):3 17-3 19.
Gitaries E.. W. Elmore, and WS. PInts. 1990. LivestockGrazing oil Rtpariari Areas. Eagle. II):Northwest Resource Irif)rririarrort Center.
Ci,rrs, UT 1999. Stream channel arid vegetation resporrses tolate spring cattle grazing Journal oI Range Mariageirreirr52(3):21S-227.
Clesceri. LS.. A.E. Greenberg, A.D. Eaton. eds. 1998.Standard methods for the examination of water andwastewater No. 20, Washington, DC: American PublicHe,ritir Association.
l)as'ies-Collea R.J. 1997. Stream channels are narrower inpasture than forest. New Zealand Journal ofMartne andFreslrsvater Research 31)5):399-608.
Frrclt, L.. and OW. Adams. 1998. Cart costs arid fislr coex-ist? Canadian journal ot'Plant Science 78(2):191-198.
Flenniken, M . , R.R. McE1I)nss'itev, WC. Leintirger. G.WFrasier, and M .J . 'Frhca, 2001. Hydrologic responsesof a montane ripariall ecosystem following cattle rise.Journal of Range Management 34)3):567_574.
Galeone, 13G., R.A. Brightbill. D.J. Loss; and D.L.O'Brien. 2006. Effects of srreaitrbank fericiirg of pas-lure Bird nit betrtluc irracrsrnirs'errehrates and thequality of surface water and sh,illosv ground seater inrite Big Spring Run Basin of Mill Creek Waterslned,Lancaster Corirrrs; Pennsylvania, 1993-2001. ScientificInvestigations Report 2096. US Geological Survey, USI )epartnreirt of tire Interior.
I larding, J ., K. Claasserr. and E. Niels. 2106. Cart forestfragments reset physical and starer qualit y conditionsill agricultural catcirtrrents and act as refrrgra for brettstreann invertebrates? Hvdrohioiogia 568(1):391-402.
Harrelson, CC., C.L. Rawlins, and J.P Potvoitdv. 1994.Stream channel reference sates: Ali illustrated guide tofield technique. Fort Collins. CO: US] )A.
Hesston, W.C. J.E. Iiizzirto, R .P Johnson, and R.J.Horwitz. 2003. irnfitrerice of bank vegetation oilirrorphologs' in ruralrrrral intl urbait watersheds. GeologicalSociety ofAnirerica 31(2):147-1,51).
l<,sufftrnari. J.B. and WC. Krueger. 1984, Livestock impactsrot riparian ecosstenns and strearinside rtr;siragenierititiplicatioins-:s reviess. Jsnurnr.ii of Range Management37(5):430-438.
Kortdolf, G.M. 1995, Five elements for efiecrrve evalu-ation of streatit restoration. Restoration Ecology3)2):133-136,
Kondolli G.M.. and E.R. Mrclnelr. 1995. Evaluating streanirestoration projects. Environmental Management19(1):1-15.
Marston, It.. .A - 1994. P,.is-er cnrtrenielnirterrt rn sirrali rinotrirtairivalleys of the ssesterti USA: lrttluersce of beater, graz-ing arid clearcrrt logging. it,.evne de Geographic sic Lyon69:11-15.
McDowell. PP.. and F.J. M.igiilig.nrr. 1997, Response ofstream channels to reriios',sl t,f cattle grazing distur-bance: Overview of ss'esterrr US exclostire studies. l,rManagement of Landscapes Disturbed by ChannelIncision, ed. S.S.Y. Wring. F.J. Larrgeridoeri. and El).Shields. 469-473. Oxford, MS: The University ofMississippi.
Meckleriburg, D.E., and A. W.rrd. 2014.. STREAM mod-tiles Spreadsheet tools for river evaluation. assessmentrod rriirnnroriirg. Fri Proceednm s for the ASAE SpecialtyConnferenice Self-Susta ining Solutions for Streams.Wetlands, and Watersheds. September 12-I5. 2004.St. Joseph, Ml: Anrieric,irr Sssciers' of' Agricitlrural andBiolog ical Engineers.
Merritt. it-W.aird K. W. Crrrnrrrtrns. 1996. Arm nrtrctdtrcttrstnto the aquatic rnsects of North America. Dubuque, IA:Kendall Hunt.
Miirrt,sh Inc. 1998 Minitab for Windows. Release 12.1. StateCollege, PA: Minirab Inc.
Mrinsimall, GUT 1984. Aquatic insect-substrartrnrr relartoitsltips.Inn The Ecology of Aquatic insects, ed. V H. Resir andD.M. lt..oseniberg.358-4t(il. NewYork. NY: Praeger.
Mr.rintgonrrers-. l).R .. J.M - Btrtlirrgtsrnr. K.D. Sinirtlr.K.M. Schriridt. and U. Pess. 1995. Pool spacing in forestcit.rrrrrels.Water Resources Research 3](4):101)7-1116.
N.rglv. U.N.. airs1 CF. Clifisrit. 21.11(3. Channel changes oser 12years on grazed and ungrazed reaches ofWnckup CreekailEasterir Oregon. Pitvsic.il Geography 24)l):77-93.
Nerhonnie, B.A., and Ii. Vorrdracek. 2010. Effects of locallaird use oil physical habitat. benrhrc rtracrninvertehrates.and fish ill tire Whirewater River. Minnesota. USA.Ertvtrnrtnrerrt,rl Management 28)1)87-99,
Orr, I I.K. 1960. Soil porosity and bulk density oil andprotected Kentucky bluegrass range in therite Bi,rck Hills.journal of Range Management 13:80-86.
Palmer. MA.. E.S.Bernhardt. J.D. All.sir, PS Like, C.Alexander, S. Brooks, J . Carr, S. Clayton, C.N. Dalirrr.J.F Shah. D.L. Calar. S.C. Loss. P Goodsvinr, 1)1). H,srr,B. I lassetr. R. ienrkrrrson. G.M. Kondsnlf. ft. Late, JI.L.Mever.T.K. ()'I)cirrrrell. L. Pagaino. irish E. Sudduth. 205.55.Standards for ecologicall y successful river restoratts,ur.Journal of Applied Ecssisigs' 42:208-217
Park ymn, SM., R.J. Davres-Collev, N.J. Halliday. K.J. Costlev,ants1 G.F. Croker. 2003. Phainred ripariani butler Csnrns'srn Ness' Zealand: 11cr they live up to expect.strsnr is?Restoration Ecology 11 (4):436-447.
Plants, 'VS. 1982. Livestock arid riparian-fishery interac-tions: Whit are the f,rcrs? Transactions of the NorthAmerican Wildlife ansi Natural Resources Conference47:507-513,
lthrr ts . U'S. 1991. Livestock grazing: Influences of forestand rangeland intatragenrretnt oil salntnorntd fishes andtheir habitats. itt Influences of Forest rind RangelarndManiagernnernr oil S,ilriroinid Fishes and Their I Iahrrais(Special Prrhlicatiomn 19), ed. WIt,,. Meehan.389-423.Bethesda, MD: Annreric.ini Fisheries Society.
Qtsinrt.J.M.. R..B,Willtusitnsomn, K.K. Snrrtli, ants1 .M.L.Vnckeis.1992. EtI'ec ns of ri1s.srn,rit grazing and cinatnnielusarion ssnnstre,inii ' tnt Southland. Ness- Zealand. 2. Beutthic ninseite-brates. New Zai.iuiii journal of Marine .tntd FreshwaterResearch 26)22):259-273.
Rabennn, C.F.,annd G.W Miitsltail. 1977. Factors affect-rug nnrcrodistributtstni of stream i,eriiinnc insects. Oikos29(1):33-43.
Rauzi, F. and C.L. Hanson. 1966. Wirer intake and runoffis affected by intensity of grIming. Jottrnn,tl of RangeManagement 19(1):351-351.
RESAC (Regional Earth Scieurce Apphc.ttioi)s Centter). 255)53.Land ('over Mapping of the Chesapeake llav Watershed.College Park. MI): Deparrnnennt t)t Geogr.ipinv, Universityof Marylaund. hitp:/.' ss'srw.geog.rinud.edu /resac/.
Rickard. W.H.. and C.E. Cushing. 1982. Recover y ofstreainrsrde ssoodv s'eget.tfroit after exclttsnt,tt of livestockgr.rziing. Jrntrtial of Ramrge M.sntagemntentn 35(3):360-361.
Rrlev, R.1 L. C.R. Toss'ni,eutd, D.K. Niyogm. C.A. Arbuckle.and K A. Peacock. 25)1(3. Headwater snre.itn responseto grassland agricultural development in Nets- Zealand.Nesv Zealand Jsnrrrnirl of Mature and FreshwaterResearch 27(2)389-403.
Ronti, P.T.J. lieeclrie, R.E. Biliss: F.E. Leotnetni, M.M. Pollock.and G.R. Pets, 2002. A resiess of stream restorationteclstit(Irtes and ,r bnner,irclitcal strategy for prioritizingrestoration in Pacific Northwest ss'aterchteds. NorthAnrtericair Jsnurmnal of i'nslnernes Mantagernennt 22(1):1-20.
Rutherford, C., R.J. l),iyies-Grjlles; I.M. Quinn, M.J.Stroud. and A.B. Cooper. 1999. Stream shade: Towardsa restorauionn strategy. Wellington. New Zealand:National Institute of Water and Ainriosplreric Research.I )eparttirent of Consers,ttintt -
Scarslnrirok, MR.. and J . Hallisl,sv. 1999 Transition frontfroimipasture to rn.irrs'e ('siren land-use along stream continua:Effects oil srre.rnr ecosystems anrd ntttplic.rtionis for rc'stO-rauiorr. Ness- Zealand -Journal srI M;trine and Fresitss;iterResearch 33(2):293-710.
Schttlz.T.T.. aird W.C. Lerininiger. I 990. I )nfferenrces in riparians'egerarroin structure beoveeur grazed areas and exclo-sstres.Journr.il of Range Management 13(4):293-299.
Scritnrgeoirr, (LJ.,.tutd S. Keirdail, 2003. Effects of livestockgrazing Ott isentthnc invertebrates t'rsnnin a native grasslandecos\'stenni. Freshwater Biology 48(2):347,.
Soto-Grajales. N. 2002. Livestock grazing anrd riparian areastnt The Northeast. Washington, DC: US Department ofAgriculture Natural Resources Conservation Service.Sers'nce.
Stone, ML., M.Ii...Winrles, J.A.Webher, K.J.Williard. indJ.D.Reese. 2(1)3 Macroinverrehr,sre coinlnnstinitnes in agrnciil-ttir,r)iv impacted southern Illinois streams: Patterns svtrinripariann vegetannonm, ss.urer quality, and in-streannn in.rhiratqntalinv.Joiirinal of Environmental Qualit y 34:907-917.
Snranmd. M., and it. UT. Merritt. 1999. Impacts of livestockcraning ,ietivities stir streatru insect coinirnirinittret andthe rns'erine eurs'rtonrurrenrr. American Eurtonrnlsngnsr45(l):13-29.
Stinter. It.J. 1 985. Trout lnahmr.ir, abundance. and fish-ing opportunities inn fenced vs. unfenced riparianhabitat along sheep en eek. Colorado, US Departmentof Agricinitstre Forest Servnce Rclrintc,sl Report RM-i 20:31)5-314, Washington, 1.31.): US Department ofAgriculture Forest Service.
Trmnnihie, S.W. 1997. Streanur channel erosiomn rind changeresulting from riparian forests. Geology 23)5):467-469.
Trimble. S. UT 2004, Effects of rip.sri.tmn vegetation Oil srre,inurchannel stability arrsi sedrnient budgets. Iii RiparianVegetation laidarid Fluvial Geomorphology. ed. S.J. Beinnnernand A. Simon, 133-169. Water Science and Application8, Washington. DC: American Geophysical Union.
Trimble, S.W. and A.C. ,vlertdel, 1993. The cots as a geo-morphic agent: A critical review Geountorphologs'13(0:233-253.
l'rsmelstritp. N.H.. and J.A. Perr y. 1989. Water quality insoutheasterin Minnesota streams: Observations along
gradient of land use and geology. journal of theMinnnesot.i Acashentv of Science '55(1):6-31.
USI(LM (US Bsnre,uu of [.,and Management). 1994.Rangeland Refornit '94: Draft ennvtn onnmnreurtal nitspacrsr.teunreirt. W.ishinngrsnn, 1)1.1: Dep.srnnuueunr of the Interior.Brrrearr of Lind Management.
USDA NRGS (Natural Resources Conservation Service).2003. National range un2 pasture iu,turdbstok. http:/svss'ss. glnr - ttrcs.srsd.u.gov / tecitinic.sI/pnthlim'.rtions /nirpht -hitnnii
USDA NRCS. 2104. Soil Survey Laboratory MetlicislsManual. Soil Surrsvs' Investigations Report No. 42.Lincoln. NE: USDA N,ititr,tl Resources ConservationService National Soil Sttrvev Ceuurer.
USDA NRCS. 20153 Conservation Reserve Eirin.uuicennenitProgram Practice List. Virginia Nlt( IS Programs.RuchiuomnsI,VA: USDA N.mturai Resources ConservationService. http:./ /ss'wss'.r'a.nnrcs.usda.gsnv/prograumts/GRE P Pr,ic List. Intunil.
USDA NRCS. 20)57. Soil l).nt,r Mart. Washington. DC:USDA Natrnr.uI Resources Conservation Service. Itttp://ssnldatanuuart.rtrcs.unsda.gov/.
JOURNAL OF SOIL AND WATER CONSERVATION jAN/FEB 2009-VOL. 64. NO. 141
USEI'A (US Environmental Protection Agenc y). 1983.Methods for chemical utlaIvsis of water arid wastes.Wishitigrori. 1 )C: Office uI Research and Development,US Environmental Protection Agency.
USEI'A, 2000. Ambient water gualiiv criteria recoin-iriendations. Waslntigrori. DC: Office of Water.. USEnvironmental Pi otec riots Agencs
USEI'A arid VI )EQ (Virginia Department of Ens'iroriiiieiitalQuality). 2)1)53. A Stream Condition Index for VirginiaNon-Coastal Streams. Owings Mills. Maryland:U.S. Environmental Protection Agenc y and VirginiaDepartment of Eiivui-ouiunienital Quality http:/ /www.tfeq.sLtte.va.iis/svareriiionlnrorinig/pdf/vastrniconpdf
USERS and VI )EQ. 2006. Stream Impact and CoinpciusationAssessment Manual. U.S Arm y Corps of Engineers,Norfolk District and Virginia Department ofEnvironmental Quality. littp:/!wwss:deq.virginia.gov/%k-etlaiidsl,'pLif/USMFi ii al-01 I 8-l(7.pdf.
USGS (US Geological Service). 2007. UsGs C;eographicDaLd Download. Washington, IX:: US GeologicalService. li t tp: //edc2.Li.SSs.gov/geodati/iiide.N.php.
(Virginia I )ep.irrment of Conservation andRecreation). 2006. Virginia Conservation ReserveEnliaiicennmcnt Program. Virginia NRCS Programs.Rnchntnnd. VA: Iieparinient of C mmnservatioti andRecreation. hap: //wsvw.ilcr.virginia.gov/ssv/ciephtnnm
VI )YIC,. 21)1)7. I Ivdrologic Unit Geograph y. I&iclinnu,nd, VA:Virginia Department of Conservation and Recre,,timsnIittp:/ /svwsv.dcr.virgmimma.gov/soml&waterzhci.sjii
VDEQ (Vn-ginma I )ep;mrtnienui of Enviicmimntnental Qmm,ilirv).2006. hnial 2006 305(b)/3113() Water QdialitvAssessment Integrated Report. R.ichmmnond. VA: VirginiaF)epariimiemnt of Environmental Quality. Iirtp://wwsv.deq.virgina.goy/svm1a/3o3d.lmmnnl,
Vosltell. J . l. . 2002. A Guide to Common FreshwaterInmsertelsrates of North America. Blacksburg, VA:McDonald and Vcoodw.nrd Ikmblislnmmg Co.
Wheeler. MA.. M.J. Jilica, G.W. Frasier, and J.D. Reeder.2003. Seasonal grazing affects soil ph y sical propertiesOf a itiuiitaaie riparian ccnnnni(ntifl: journal of RangeManagement .51(1):49 -56.
Wrlltammison, . RB., Ii,..I< . Smith, alld j.M4. Quinn. 1992. Effects on riparian grazing and clmaninelisaiionm oilni Souililand, Nev, 7.ealand. I. Channel form and sta-hilitv.Nesy. Zealand Journal of Marine and FreshwaterIi.,csearcl i 26(2):24 1-2514.
WohI, N.E., and ICE Cairline. 1995. Relations .imnionigriparian graving. secfnmneitr loads, niacroinvs'rtebrates,and fishes ill tIn cc central l'ennnsvlvairia streams.Canadian Jommrmtal 01 Fisheries and Ac1tiatic Sciences.)3(j):261)-200.
Wolmiman . M C. 1954. A method for sampling course river-best Auierican Geophysical Union Transactiism,35:951-956.
\X./,iosl, M .K . , and 54/ H. Blackburn, 1984. Vegetationand soil responses to ernIe glazing svstenns ni thelexas rolling planis. Journal of Range Manaigenient37(4)303-3014.
Wynn, T. and S. Mostaghmnii. 21 ,06. The effects of vegeta-.troni and soil type oil srreannnhank erosion, SouthwesternVirginia. USA. Journal of the American WaterResources Ass,, ( m,mtmon 120)(0-82.
42 1 JAN/FEB 2009—VOL. 64, NO. 1 JOURNAL OF SOIL AND WATER CONSERVATION


![[Vegetation and Remote Sensing] Vegetation](https://static.fdocuments.us/doc/165x107/577cdfd71a28ab9e78b21a32/vegetation-and-remote-sensing-vegetation.jpg)