Livelihood Baseline Survey Report Tanzania 2014 - Final 30 Apr 2014
94
Livelihoods in Tanzania – Findings of a Field Survey African Livelihoods Partnership (ALPs) Livelihood Basix Inc. April 2014
-
Upload
mzee-mandawa -
Category
Documents
-
view
183 -
download
0
Transcript of Livelihood Baseline Survey Report Tanzania 2014 - Final 30 Apr 2014

Livelihoods in Tanzania – Findings of a Field Survey
African Livelihoods Partnership (ALPs)
Livelihood Basix Inc.
April 2014
Acknowledgement
We would like to thank Swiss Agency for Development and Cooperation (SDC), for their
sponsorship of the African Livelihoods Partnership (ALPs). The SDC Office in Dar-Es-
Salam gave us many insights into the livelihood issues of Tanzania.
We would also like to thank the Ministry of Information, Culture, Youth and Sports,
Government of Tanzania, as well as the Mwanza Regional Administrator’s Office and
the Mwanza City Council for giving us guidance and access.
The Vocational Education and Training Authority (VETA) of Tanzania were kind enough
to share their Graduate Tracer Study report which we found very useful as a
background document.
The insights of the faculty from the Business Management and Entrepreneurship
Department of St Augustine University of Tanzania (SAUT) were also useful in conduct
of the study.
The ALPs team for the survey was guided by Vijay Mahajan and Sanjay Behuria and
led by Suman Laskar in the field. Narayan Reddy also supervised part of the survey
while Navn T. provided valuable support in data analysis using SPSS.
The survey would not have been possible but for the field support of the team from the
Youth of United Nations Association (YUNA) of Tanzania, comprising
1. Lwidiko Edward - Overall Supervisor 2. Omary Hassan - Finances Director 3. Shadrack Msuya - Field Coordinator 4. Hajji Mussa - Supervisor Kilimanjaro 5. Innocent Mkota - Supervisor Morogoro 6. Abinoam Msiliwa - Data Collector 7. Mzee Mandawa - Supervisor Mwanza
Data collectors:
Morogoro: 1. Abbinoam Wingi 2.Yusuph Mayo 3. Alex Daud 4. Innocent Mkota
Mwanza: 1. Mzee Mandawa 2. Hussein Melele 3. Lucy Malisa 4. Neema Moses
Kilimanjaro: 1. Justina Haule 2. Noel Ligate 3.Colman Mosty 4. Hildagelda Urassa
ii
Disclaimer
The views expressed herein can in no way be taken to reflect the official opinion of the
SDC. The SDC and other donors to ALPs shall have no responsibility or liability
whatsoever in respect of any information in any external website or in any document
mentioned in this report. The present material is for information only, and the reader
relies upon it at his/her own responsibility.
Dissemination
This publication may be reproduced in whole or in part and in any form for educational
or non-profit purposes without special permission from ALPs, provided the source is
acknowledged. The ALPs would appreciate receiving a copy of any publication that
uses this publication as a source.
No use of this publication may be made for resale or for any other commercial purpose
whatsoever without prior permission in writing from the ALPs, email:
iii
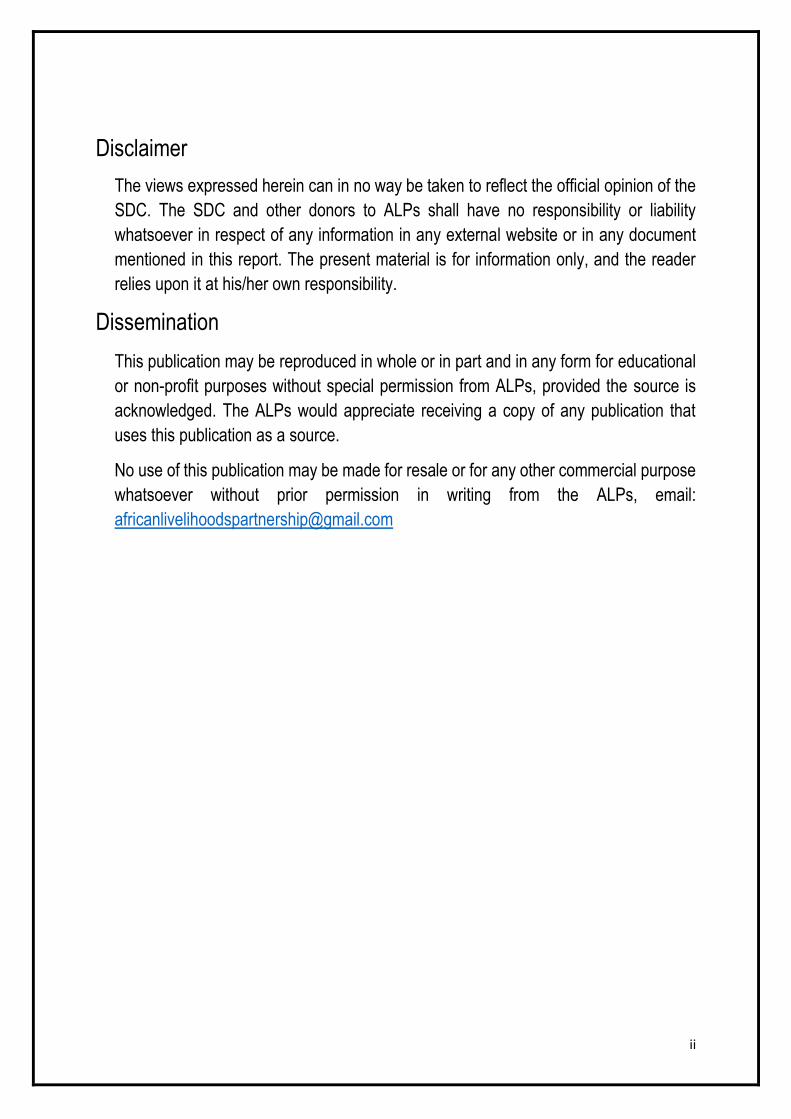
Regions Covered by ALPs Baseline Survey in Tanzania

iv
Abbreviations and Acronyms
ALIF African Livelihoods Investment Fund ALPs African Livelihoods Partnership BASICS Ltd. Bhartiya Samruddhi Investments and Consulting Services Limited BDS Business Development Services
CIDR Centre International de Développement et de Recherche GAPI Mozambique Small Scale Investment Support Office
IDSM Institutional Development for Scaling up and Mainstreaming LBI Livelihoods BASIX Inc
MFI Micro Finance Institution
MIFED Microfinance et Developpement, Cameroon
NGO Non-Government Organisation PAMIGA Participatory Microfinance Group of Africa
PPI Progress out of Poverty Index PRIDE Promotion of Rural Initiative and Development Enterprises Limited
SDC Swiss Agency for Development and Cooperation SPSS A software package used for statistical analysis
TLS The Livelihood School TSH Tanzanian Shilling
VETA Vocational Educational and Training Authority

v
Table of Contents
Foreword and Key Findings of the Survey………………………………………… 1
1. Introduction .................................................................................................... 5
2. Objectives, Methodology and Coverage of the Survey ......................................... 7
2.1 Objectives ............................................................................................... 7
2.2 Sampling Methodology .............................................................................. 7
2.3 Questionnaire .......................................................................................... 8
2.4 Field work resources and logistics .............................................................. 9
2.5 Data Analysis ........................................................................................... 9
2.6 Research Limitations................................................................................. 9
2.7 Survey Coverage ...................................................................................... 9
2.8 Respondent information .......................................................................... 10
3. Findings ...................................................................................................... 11
3.1 Demographic Information ........................................................................ 11
3.1.1 Education ........................................................................................... 11
3.1.2 Marital Status ...................................................................................... 12
3.1.3 Working Male and Female in Family ...................................................... 12
3.1.4 Poverty .............................................................................................. 15
3.1.5 Household Income ............................................................................... 16
3.1.6 Household Expenditure ........................................................................ 16
3.1.7 Income Variability ................................................................................ 17
3.1.8 Gender Dimension ............................................................................... 18
3.2 Financial Inclusion .................................................................................. 22
3.2.1 Bank Accounts .................................................................................... 22
3.2.2 Borrowing ........................................................................................... 24
3.2.3 Savings .............................................................................................. 26
3.2.4 Insurance ........................................................................................... 27
3.2.5 Remittance / Money Transfer ................................................................ 29
vi
3.3 Smallholder Farming as a Livelihood ......................................................... 30
3.3.1 Farm Practices .................................................................................... 30
3.3.2 Livestock and Veterinary Services ......................................................... 35
3.3.3 Farm Training and Extension Services: .................................................. 36
3.3.4 Farmers Groups .................................................................................. 37
3.3.5 Demand for Services ........................................................................... 39
3.4 Non-Farm Livelihoods ............................................................................. 42
3.4.1 Ownership .......................................................................................... 42
3.4.2 Problems faced by micro-enterprises ..................................................... 43
3.4.3 Skills and Services Received ................................................................ 44
3.4.4 Producers’ Groups ............................................................................... 45
3.4.5 Access to Finance ............................................................................... 47
3.4.6 Demand for Services ........................................................................... 48
3.4.7 Skill Development ................................................................................ 50
4. Conclusion ................................................................................................. 52
Annexure ........................................................................................................... 53
1. List of Wards/Villages, Divisions, Districts and Regions Covered ..................... 53
2. Questionnaire – Farm................................................................................. 55
5. Questionnaire – Non Farm .......................................................................... 72

Foreword
This survey is meant to draw attention to the urgent task of promoting livelihoods in
Tanzania. The findings show that while almost everyone of working age is working, as
many as 60 percent are not making enough income to even cross the poverty line. In
addition, there is high variability in incomes, with risks due to various kinds of adverse
events - illness, drought, floods, pest attack, and sudden fall in market prices and so on.
Instead of further dwelling on the details of the situation, which the report does, I would
like to draw the attention of the reader to the fact that the three foci of livelihoods in
Tanzania have to be
Rural – since a large part of the population is still living in rural areas
Agricultural – since the predominant livelihood in rural areas is agriculture, including
livestock rearing and horticulture, and
Youth – since a large number of Tanzanians, male and female, are still very young.
And the way ALPs intends to address these is through a “Livelihood Triad” strategy:
Rural Inclusive Financial Services – particularly access to credit for farmers and
youth micro-entrepreneurs
Agricultural Productivity Enhancement for Smallholder and Linking them with Value
Chains, and
Youth Entrepreneurship and Self-employment in farm and non-farm sectors
All these will themes will be addressed through Hybrid Organisations of Producers and
Entrepreneurs (HOPE). By this term we mean those organisations which
Produce in rural areas and sell in urban areas where there is more purchasing
power;
Are involved in not just primary agricultural production but full value addition chain,
and
Are a combination of individual producer-owned enterprises for primary production
and producer-owned or individual entrepreneur owned companies for the more
capital-intensive secondary and tertiary parts of the value chain.
We hope this survey report provides the basis for a whole set of new generation hybrid
livelihood promotion organisations in Tanzania, which are sustainable, financially,
institutionally, as also environmentally. This constitutes the RAY of HOPE strategy for
livelihood promotion in Tanzania.
Vijay Mahajan, Founder and CEO, BASIX Social Enterprise Group, India, and
Founder, African Livelihoods Partnership (ALPs)

2
Key Findings of the Survey
Survey introduction
The survey covered three zones of Tanzania, viz. Lake zone (Mwanza Region), Mountain
zone (Kilimanjaro Region) and Plain zone (Morogoro Region). The sample was 1800
households, covering the categories men / women; youth / non-youth and farmers / non-
farm workers
Demographics and Poverty
Half of surveyed youth ended their education by primary level.
Surveyed households had 2.8 dependents for every working person
Men and women participated equally in the workforce in surveyed households
Three-fifths of surveyed households were poor
Wages contributed a major share to cash income of poor surveyed households
Income poverty was six times higher among surveyed poor farm households
Surveyed households spend about four-fifth of expenditure on food
Surveyed households are not covered against risks to lives nor livelihoods
Role of women
Equal numbers of females participated in workforce in surveyed households.
Women played a partial role in decision making related to livelihoods and
household issues in over half of the surveyed households
Women were partially free in terms of their social mobility in over four-fifth of surveyed households
Women were individual or joint owners in two-fifth of surveyed non-farm
enterprises
Access to Financial Services
Only about one-third of surveyed households had access to any financial
services from formal institutions Two-third of surveyed households were indebted.
Three-fifth among indebted house-holds depended on non-institutional agencies
for credit.
Two-thirds of the indebted households borrowed for livelihood purposes.
Only about one-third of surveyed households saved in formal institutions

3
Large proportion of surveyed households were not covered against risks to lives
or livelihoods. Only about one-fourth of surveyed households were protected
under life risk coverage. Only about one-sixth covered had enterprise insurance
coverage.
Farm Based Livelihoods
Three-fourths of surveyed households used mobile technology for money transfer
Seven-eighths of surveyed farmers used traditional technology for land
preparation
Two-thirds of the surveyed farm households used seeds retained from own
production
Close to half of the surveyed households used chemical fertilizer for productivity
enhancement
One-third surveyed households had difficulties in marketing agricultural produce
Lack of transportation and non-remunerative prices were the major reasons for
the inability to market of agricultural produce
Post-harvest practices were utilized by only about half of the surveyed farmers
About one-fifth of the surveyed households did not practice storage in protected
structures
About four-fifth of the surveyed households practiced livestock rearing
Half of surveyed farm households were not able to get any extension services
Extension services by the government had very limited outreach – only 1% of the
surveyed farmers
Two-fifth of the surveyed households were part of farmers’ groups
About three-fourth of the surveyed households wish to be part of or continue to
be in farmers’ groups
Over four-fifth of the surveyed farm households expressed the need for training
and extension services
About two-fifth of the surveyed farmers wanted credit services, while half wanted
composite financial services inclusive of credit
While one third of the surveyed farmers expressed the need for market linkage
services (input and output) about half preferred a combination of services which
also incorporated extension and post-harvest services

4
Non-farm activity based livelihoods
Women were individual or joint owners in two-fifth of surveyed non-farm
enterprises
Access to finance and marketing were the two major challenges affecting
surveyed non-farm enterprises, affecting two-fifth of them
About half of the surveyed non-farm households had received training for
business development
About one-third of surveyed non-farm enterprises had membership in
associations
About three out of ten surveyed non-farm enterprises had access to credit
Four-fifths of the surveyed non-farm households expressed the need for BDS
services
Half of the surveyed non-farm households wanted a combination of services
While a little less than half of those surveyed had attended skills training, only about one-sixth received formal skills training
About seven-eighths of the surveyed non-farm enterprise were desirous of attending skills training
About seven-eighths of the surveyed non-farm enterprise were desirous of attending skills training

5
1. Introduction
The African Livelihoods Partnership (ALPs), funded by the Swiss Agency for
Development and Cooperation (SDC), is to promote the concept of South-South co-
operation in development. Livelihood BASIX Inc. (LBI, a US based non-profit), BASICS
Ltd. (an India based Social Enterprise Group) and PAMIGA (A France based
Microfinance platform that was founded by CIDR a French NGO) are the 3 founding
members and members of the Executive Committee. MIFED in Cameroun, PRIDE in
Tanzania and GAPI in Mozambique are strategic partners in each of the countries.
ALPs seeks innovative solutions to poverty by working at the grass roots to improve the
social, physical and financial capital of the poor. Specifically it works with rural
population, mainly women and the young to provide them opportunities in the local
context that are sustainable and generate self-employment.
We currently work in Cameroun, Mozambique and Tanzania through a graded
partnership model. Together we select local partners (Field Innovation Testing) to pilot
interventions that have high chance of impact for achieving our objectives. To document
and disseminate the results, The Livelihood School in India (TLS) and local universities
partner with us for action research and knowledge management.
As part of its evaluation strategy, ALPs is mandated to conduct baseline surveys in all
the three 1st phase operational countries. The current report is on Tanzania where we
have covered 3 regions, 6 districts and 12 divisions to provide information that could be
used to assess the outcomes and impacts of this support. This document presents the
findings of the baseline survey.
Under ALPs the results to be achieved are better living conditions of poor end users
and better performing, transparent institutions, gender equality etc. through three
instruments being applied – 1) Knowledge building, dissemination and utilization; 2)
Entrepreneurship and leadership training and institutional development and 3)
Promoting innovations through collaborations and synergistic interventions.
A grant fund has been approved by SDC for implementing the 1st phase of ALPs from
April 2013 to December 2015, during which the ALPs Executive Committee through its
officials and advisors will implement the ALPs project as envisaged in the Project
Document and Yearly Plan Operations. The 1st phase targets the following Outcomes:
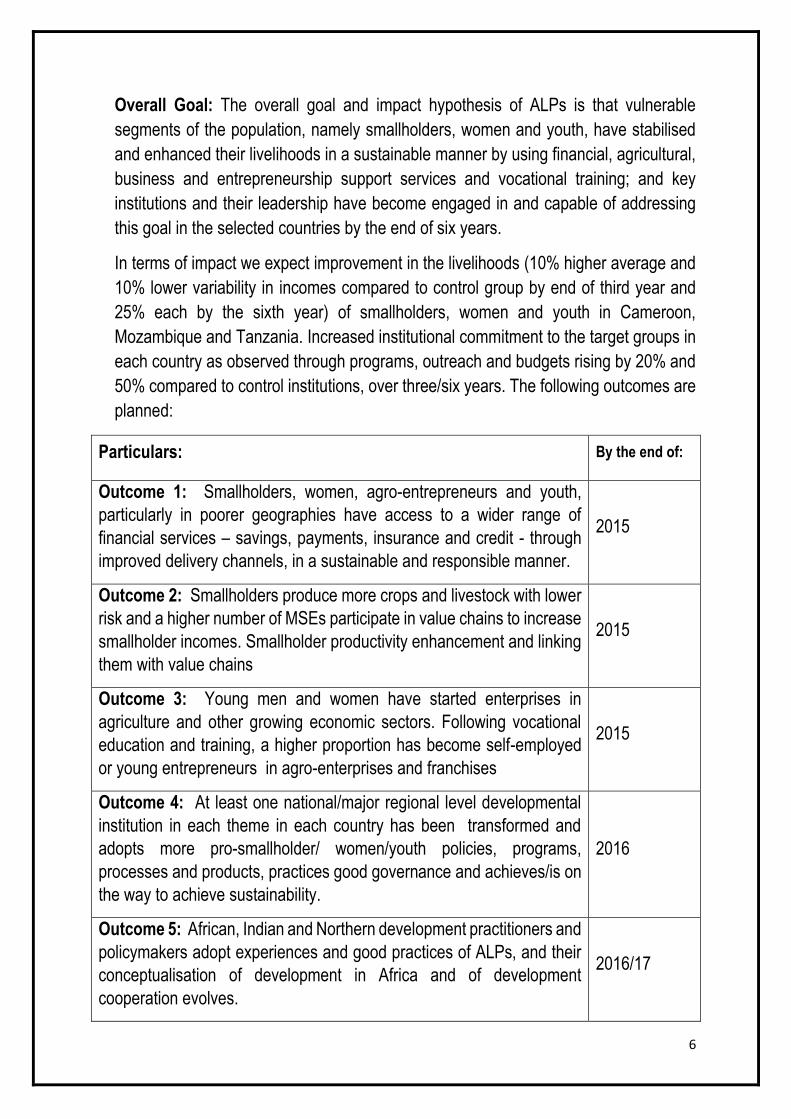
6
Overall Goal: The overall goal and impact hypothesis of ALPs is that vulnerable
segments of the population, namely smallholders, women and youth, have stabilised
and enhanced their livelihoods in a sustainable manner by using financial, agricultural,
business and entrepreneurship support services and vocational training; and key
institutions and their leadership have become engaged in and capable of addressing
this goal in the selected countries by the end of six years.
In terms of impact we expect improvement in the livelihoods (10% higher average and
10% lower variability in incomes compared to control group by end of third year and
25% each by the sixth year) of smallholders, women and youth in Cameroon,
Mozambique and Tanzania. Increased institutional commitment to the target groups in
each country as observed through programs, outreach and budgets rising by 20% and
50% compared to control institutions, over three/six years. The following outcomes are
planned:
Particulars: By the end of:
Outcome 1: Smallholders, women, agro-entrepreneurs and youth,
particularly in poorer geographies have access to a wider range of
financial services – savings, payments, insurance and credit - through
improved delivery channels, in a sustainable and responsible manner.
2015
Outcome 2: Smallholders produce more crops and livestock with lower
risk and a higher number of MSEs participate in value chains to increase
smallholder incomes. Smallholder productivity enhancement and linking
them with value chains
2015
Outcome 3: Young men and women have started enterprises in
agriculture and other growing economic sectors. Following vocational
education and training, a higher proportion has become self-employed
or young entrepreneurs in agro-enterprises and franchises
2015
Outcome 4: At least one national/major regional level developmental
institution in each theme in each country has been transformed and
adopts more pro-smallholder/ women/youth policies, programs,
processes and products, practices good governance and achieves/is on
the way to achieve sustainability.
2016
Outcome 5: African, Indian and Northern development practitioners and
policymakers adopt experiences and good practices of ALPs, and their
conceptualisation of development in Africa and of development
cooperation evolves.
2016/17

7
Outcome 6: ALPs is institutionalised as an African entity and has
become operational and later sustainable beyond SDC support. 2015/18
Outcome 7: ALIF is established as an investment vehicle for
developmental enterprises in Africa. 2015
The cross-cutting themes of transformational change, gender, scale and sustainability
are considered along project and intervention cycle management processes.
2. Objectives, Methodology and Coverage of the Survey
2.1 Objectives
The ALPs livelihoods baseline survey in Tanzania aimed to provide representative
quantitative information on livelihoods in terms of three thematic areas, viz. financial
inclusion, smallholder agri value chain development and youth entrepreneurship & self-
employment with three segments, viz. women, youth and smallholder farmer covering
three regions viz. Kilimanjaro, Morogoro and Mwanza. Baseline information was
required to represent the three broad agro-ecological zones.
The livelihoods baseline survey results will be a fundamental part of ALPs’s evaluation
strategy that includes a before-after assessment of ALPs interventions and a “with
treatment / without treatment” analysis using results from control villages.
The livelihoods baseline survey aims to provide the basis to evaluate the effectiveness
and outcomes of the ALPs. Findings of the survey in ALPs intervention areas and
control areas will be compared with findings at mid-term and, more importantly, the end
of the project.
2.2 Sampling Methodology
The sampling methodology was designed to allow statistical comparisons amongst the
three zones, Viz. Lake zone (Mwanza Region), Mountain zone (Kilimanjaro Region)
and Plain zone (Morogoro Region). The sampling also required to consider the three
themes, viz. financial inclusion, smallholder agri value chain development and youth
entrepreneurship and self-employment and three segments, viz. women, youth and
smallholder. For any group of region-thematic-segmental minimum representative
sample size had to be 30. Hence the sample size for the survey worked out to 810.
Considering missed responses and errors the total sample size was increased to 900.
This target was doubled to 1800 considering half of the sample as intervention group
and half of the sample as control group. The strata wise sampling is given below:

8
2.3 Questionnaire
The questionnaire for the livelihoods baseline survey was designed around key
expected outcomes and associated indicators of the ALPs project. Indicators were also
identified for critical questions and key assumptions inherent within the ALPs strategy.
However, not all of these indicators were selected for inclusion in the evaluation
strategy. The aim was to have a questionnaire that was simple to answer and record
responses, and not take more than 45 minutes on average to complete. There were no
open questions in the questionnaire making recording of answers simple and quick.
Two sets of questionnaires were developed, one for the mainly farm dependent
household and the other for non-farm micro-enterprise dependent household. There
were questions which were common for all the households like basic informations on
demographic details, skills, poverty, access to financial and non-financial services,
income-expenditure, income variability, gender and decision making by women etc. In
case of farm, specific questions were incorporated regarding farm practices, post-
harvest practices, access to services, livestock, farmer’s group participation etc. In case
of non-farm, questions were asked regarding enterprise related issues, access to
finance and other services, participation in groups etc. In both farm and non-farm,
concluding questions were asked on the demand for skill, finance and services.
Strata 1 Strata 2 Strata 3 Strata 4 Samples Women Youth Farm Non-farm Morogoro Moshi Mwanza
Total -> 1800 900 900 900 900 600 600 600
Morogoro Youth Man Farm 75 75 75 75
Morogoro Youth Man Non-Farm 75 75 75 75
Morogoro Youth Women Farm 75 75 75 75 75
Morogoro Youth Women Non-Farm 75 75 75 75 75
Morogoro Not Youth Man Farm 75 75 75
Morogoro Not Youth Man Non-Farm 75 75 75
Morogoro Not Youth Women Farm 75 75 75 75
Morogoro Not Youth Women Non-Farm 75 75 75 75
Kilimanjaro Youth Man Farm 75 75 75 75
Kilimanjaro Youth Man Non-Farm 75 75 75 75
Kilimanjaro Youth Women Farm 75 75 75 75 75
Kilimanjaro Youth Women Non-Farm 75 75 75 75 75
Kilimanjaro Not Youth Man Farm 75 75 75
Kilimanjaro Not Youth Man Non-Farm 75 75 75
Kilimanjaro Not Youth Women Farm 75 75 75 75
Kilimanjaro Not Youth Women Non-Farm 75 75 75 75
Mwanza Youth Man Farm 75 75 75 75
Mwanza Youth Man Non-Farm 75 75 75 75
Mwanza Youth Women Farm 75 75 75 75 75
Mwanza Youth Women Non-Farm 75 75 75 75 75
Mwanza Not Youth Man Farm 75 75 75
Mwanza Not Youth Man Non-Farm 75 75 75
Mwanza Not Youth Women Farm 75 75 75 75
Mwanza Not Youth Women Non-Farm 75 75 75 75
Strata Wise Sample Division
9
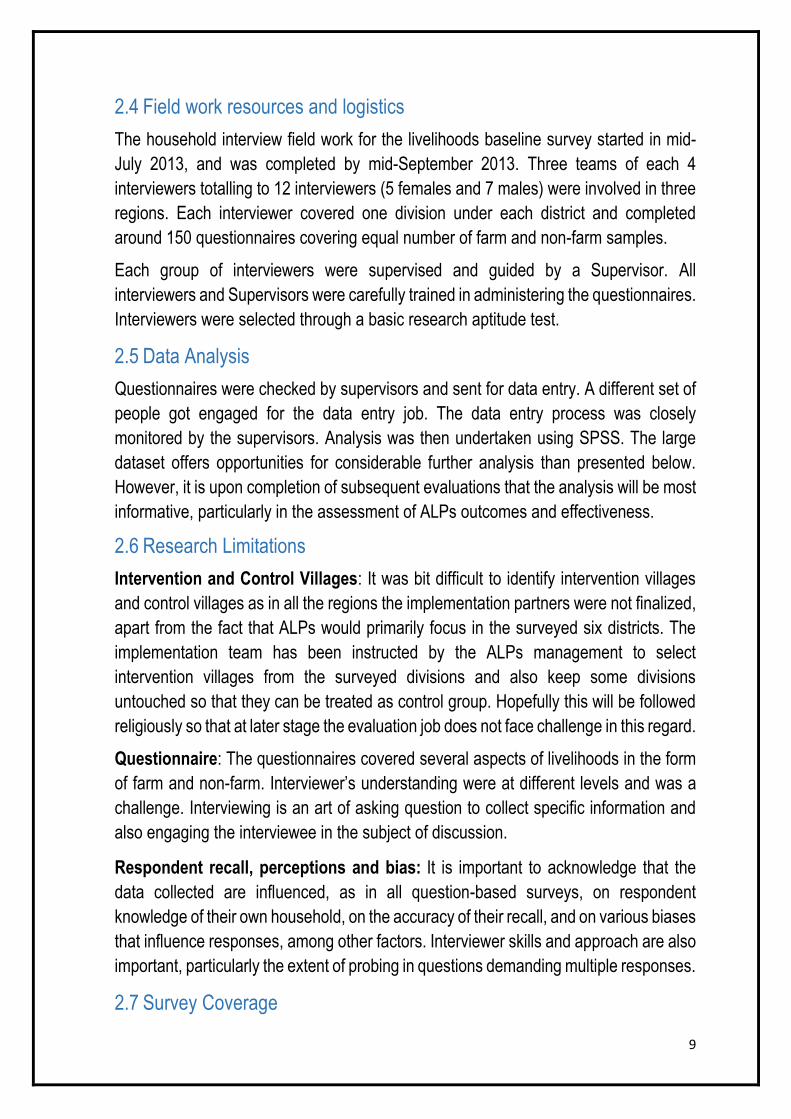
2.4 Field work resources and logistics
The household interview field work for the livelihoods baseline survey started in mid-
July 2013, and was completed by mid-September 2013. Three teams of each 4
interviewers totalling to 12 interviewers (5 females and 7 males) were involved in three
regions. Each interviewer covered one division under each district and completed
around 150 questionnaires covering equal number of farm and non-farm samples.
Each group of interviewers were supervised and guided by a Supervisor. All
interviewers and Supervisors were carefully trained in administering the questionnaires.
Interviewers were selected through a basic research aptitude test.
2.5 Data Analysis
Questionnaires were checked by supervisors and sent for data entry. A different set of
people got engaged for the data entry job. The data entry process was closely
monitored by the supervisors. Analysis was then undertaken using SPSS. The large
dataset offers opportunities for considerable further analysis than presented below.
However, it is upon completion of subsequent evaluations that the analysis will be most
informative, particularly in the assessment of ALPs outcomes and effectiveness.
2.6 Research Limitations
Intervention and Control Villages: It was bit difficult to identify intervention villages
and control villages as in all the regions the implementation partners were not finalized,
apart from the fact that ALPs would primarily focus in the surveyed six districts. The
implementation team has been instructed by the ALPs management to select
intervention villages from the surveyed divisions and also keep some divisions
untouched so that they can be treated as control group. Hopefully this will be followed
religiously so that at later stage the evaluation job does not face challenge in this regard.
Questionnaire: The questionnaires covered several aspects of livelihoods in the form
of farm and non-farm. Interviewer’s understanding were at different levels and was a
challenge. Interviewing is an art of asking question to collect specific information and
also engaging the interviewee in the subject of discussion.
Respondent recall, perceptions and bias: It is important to acknowledge that the
data collected are influenced, as in all question-based surveys, on respondent
knowledge of their own household, on the accuracy of their recall, and on various biases
that influence responses, among other factors. Interviewer skills and approach are also
important, particularly the extent of probing in questions demanding multiple responses.
2.7 Survey Coverage

10
The study covered about
1,793 respondents from the
three regions namely
Kilimanjaro, Morogoro and
Mwanza. An equal number
of respondents were from
the three regions. They were
about 599 from Kilimanjaro,
596 from Morogoro and 598
from Mwanza. Close to 300 i.e., about one-sixth were represented from six districts. An
equal number were represented from the districts – which were 304 from Moshi, 295
from same, 303 from Morogoro Rural, 293 from Mvomero, 316 from Geita and 282 from
Sengerema.
2.8 Respondent information
Age: More than half i.e., 54.6% of
the respondents were youth below 30
years. About a less than half i.e.,
45.5% belonged to more than 30
years category. A significant percent
of population i.e., about 41% were in
the age group of 25 to 30 years.
Sex: The study provided almost equal
representation to both male and
female respondents. A little over half of
the respondents i.e. 52.9% were male
and a little less than half i.e., 47.1%
were females.
Region District Frequency Percent Cumulative Percent
Kilimanjaro Moshi Rural 304 17.0 17.0
Same 295 16.5 33.5
Morogoro Morogoro
Rural
303 16.9 50.4
Mvomero 293 16.3 66.7
Mwanza Geita 316 17.6 84.3
Sengerema 282 15.7 100.0
1793 100.0
Frequency Percent
Cumulative Percent
Less than 25 years 243 13.6 13.6
Between 25 and 30 years
735 41.0 54.5
More than 30 years 815 45.5 100.0
Total 1793 100.0
Frequency Percent
Cumulative Percent
Male 948 52.9 52.9
Female 845 47.1 100.0
Total 1793 100.0

11
3. Findings
3.1 Demographic Information
3.1.1 Education
Half of the surveyed persons ended their education by primary level.
Low education levels are a defining characteristic of surveyed youth. About half of the
surveyed youth do not go beyond primary level education. The findings reveal that
about half of the youth (52.3%) were educated till primary education. This was more in
the case of Morogoro at 75.9% followed by Kilimanjaro at 54.2%. Over one-third
(37.9%) finished secondary education. Only about one-tenth (9.7%) completed their
graduation. Mwanza had a higher population (68.3%) who completed either secondary
or a graduation. Overall educational levels were comparatively better at Mwanza
followed by Kilimanjaro and Morogoro. Low levels of education have implications for
employability of youth. Low employability means youth end up joining the ranks of
unskilled labour force in their future employment.
Region * Education Cross tabulation
Education
Total
Graduate Secondary Primary
Not completed
primary Never gone
to school Any other
Kilimanjaro Count 55 218 268 36 21 1 599
% within Region
9.2% 36.4% 44.7% 6.0% 3.5% .2% 100.0%
Morogoro Count 9 163 368 21 31 0 592
% within Region
1.5% 27.5% 62.2% 3.5% 5.2% .0% 100.0%
Mwanza Count 110 296 155 14 14 5 594
% within Region
18.5% 49.8% 26.1% 2.4% 2.4% .8% 100.0%
Total Count 174 677 791 71 66 6 1785
% within Region
9.7% 37.9% 44.3% 4.0% 3.7% .3% 100.0%

12
3.1.2 Marital Status
Over three-fourths (78.4%) of the respondents were married. Of this 13% are either
widowed or single parents. The larger number of unmarried which is over one-fourth
were from Kilimanjaro (27.9%) and Morogoro (25.2%).
Region * Marital status
Marital status
Total
Married Unmarried Widow Single Mother
Single Father
Region Kilimanjaro
Count 353 167 57 14 8 599
% within Region
58.9% 27.9% 9.5% 2.3% 1.3% 100.0%
Morogoro Count 360 149 31 32 20 592
% within Region
60.8% 25.2% 5.2% 5.4% 3.4% 100.0%
Mwanza Count 454 69 25 29 17 594
% within Region
76.4% 11.6% 4.2% 4.9% 2.9% 100.0%
Total Count 1167 385 113 75 45 1785
% within Region
65.4% 21.6% 6.3% 4.2% 2.5% 100.0%
3.1.3 Working Male and Female in Family
Surveyed households have 2.8 dependents for every working person.
There were about 2,830 working population above 17 years. Male and female working
population was similar. Male working population was 1,412 and female working
population was 1,418. There were about 3,439 persons below 17 from the sample
households. Assuming about one non-working member above 17 years per family
among 1793 households, there are about 8,062 persons from sample households. This
makes the dependency ratio among sample households at 2.8. There were about 1.6
person working members per household.
Equal numbers of men and women participated in workforce in surveyed households.
Gender-wise an equal number of working persons were found. While there were about
1,412 male earning members, there were about 1,418 working female. This indicates
equal participation of women in workforce.
13
The total working male within
the households was about
1,412. A little less than one-
third (31.2%) of the households
are dependent on one male
earning member. A little less
than one-fifth (18.6%)
households depend on two
male earning members and
similarly one-fifth (19.8%)
depend on four earning
members. A little less than one-
fifth (19.2%) households did
not have any male earning member.
Region * Male 17 years or more
Male 17 years or more
Total Four or
more Three Two One None
Region Kilimanjaro Count 51 54 95 247 152 599
% within Region 8.5% 9.0% 15.9% 41.2% 25.4% 100.0%
Morogoro Count 140 25 14 27 15 221
% within Region 63.3% 11.3% 6.3% 12.2% 6.8% 100.0%
Mwanza Count 88 81 153 166 104 592
% within Region 14.9% 13.7% 25.8% 28.0% 17.6% 100.0%
Total Count 279 160 262 440 271 1412
% within Region 19.8% 11.3% 18.6% 31.2% 19.2% 100.0%

14
The number of female earning members is
equivalent to number of male earning
members. There were about 1,418 female
earning members in comparison to 1,412 male
earning members. More than one-third of the
households (36.6%) had one female earning
member. A little less than one-fifth (18.9%)
households had four or more earning female
members. One-fifth households (20.2%) did
not have any female earning members.
Region * Female 17 years or more
Female 17 years or more
Total
Four or
more Three Two One None
Regio
n
Kilimanjaro Count 68 82 42 287 119 598
% within
Region 11.4% 13.7% 7.0% 48.0% 19.9% 100.0%
Morogoro Count 142 35 4 35 10 226
% within
Region 62.8% 15.5% 1.8% 15.5% 4.4% 100.0%
Mwanza Count 58 91 91 197 157 594
% within
Region 9.8% 15.3% 15.3% 33.2% 26.4% 100.0%
Total Count 268 208 137 519 286 1418
% within
Region 18.9% 14.7% 9.7% 36.6% 20.2% 100.0%

15
3.1.4 Poverty
Three-fifths of surveyed households were poor
While about one-fourth surveyed households are poor by national standards, about three-fifth are poor by international standards. As
per the PPI calculations done on 1604 households, about 22.6% of the households fell below the Tanzanian national poverty line. As
per international poverty lines of $1.25 per earning member per day, 58.8% of households fell below the same. About 29.6% fell above
international poverty line but in low income category. Only about 11.6% households were above poor and low income category. A high
level of poverty has a bearing on poor human development outcomes of Tanzanian households. This would also mean working
towards reducing the poverty levels would result in improving human development outcomes.
Food 100% 150% 200% $1.25 $2.5 Food 100% 150% 200% $1.25 $2.5
0-4 55.2 81.3 95.7 98.6 70.2 99.4 100.0 0 0.0% 0.0 0.0 0.0 0.0 0.0 0 0
5-9 45.9 17.8 93.3 97.9 50.0 99.1 100.0 4 0.2% 0.1 0.0 0.2 0.2 0.1 0.2 0.2
10-14 33.8 64.8 88.4 97.9 37.3 99.2 100.0 11 0.7% 0.2 0.4 0.6 0.7 0.3 0.7 0.7
15-19 31.2 57.2 82.1 93.6 35.2 96.9 99.7 29 1.8% 0.6 1.0 1.5 1.7 0.6 1.8 1.8
20-24 30.9 53.5 81.5 92.2 33.9 90.6 99.7 50 3.1% 1.0 1.7 2.5 2.9 1.1 2.8 3.1
25-29 26.1 48.4 81.5 92.2 25.9 90.6 99.7 58 3.6% 0.9 1.8 2.9 3.3 0.9 3.3 3.6
30-34 17.6 38.7 73.1 89.6 16.6 88.6 99.3 114 7.1% 1.3 2.8 5.2 6.4 1.2 6.3 7.1
35-39 13.2 29.6 57.9 81.0 12.9 77.7 98.9 178 11.1% 1.5 3.3 6.4 9.0 1.4 8.6 11.0
40-44 7.7 22.8 54.3 75.1 7.3 70.5 95.3 224 14.0% 1.1 3.2 7.6 10.5 1.0 9.8 13.3
45-49 7.4 21.2 50.8 70.8 7.3 65.1 92.7 250 15.6% 1.2 3.3 7.9 11.0 1.1 10.1 14.4
50-54 7.4 17.0 40.8 62.7 6.0 48.9 86.8 268 16.7% 1.2 2.8 6.8 10.5 1.0 8.2 14.5
55-59 5.4 12.0 31.5 54.2 4.0 32.9 81.6 175 10.9% 0.6 1.3 3.4 5.9 0.4 3.6 8.9
60-64 3.5 7.8 27.1 45.8 2.8 29.1 71.3 116 7.2% 0.3 0.6 2.0 3.3 0.2 2.1 5.2
65-69 0.7 7.0 19.4 37.7 0.6 19.3 62.3 83 5.2% 0.0 0.4 1.0 2.0 0.0 1.0 3.2
70-74 0.7 3.2 12.8 34.0 0.6 11.7 53.0 21 1.3% 0.0 0.0 0.2 0.4 0.0 0.2 0.7
75-79 0.7 2.0 6.9 22.0 0.6 6.0 48.5 12 0.7% 0.0 0.0 0.1 0.2 0.0 0.0 0.4
80-84 0.6 2.0 6.8 19.1 0.5 4.8 47.5 8 0.5% 0.0 0.0 0.0 0.1 0.0 0.0 0.2
85-89 0.0 0.0 1.7 11.5 0.0 0.0 29.1 3 0.2% 0.0 0.0 0.0 0.0 0.0 0.0 0.1
90-94 0.0 0.0 0.0 5.9 0.0 0.0 6.6 0 0.2% 0.0 0.0 0.0 0.0 0.0 0.0 0.0
95-100 0.0 0.0 0.0 0.0 0.0 0.0 0.0 0 0.0% 0.0 0.0 0.0 0.0 0.0 0 0
1604 100.0% 9.9 22.6 48.4 68.1 9.5 58.8 88.4
Tanzania ScorecardSample Scores
Sample Results
Distribution of poverty likelihoods (%) by poverty line Poverty Likelihood (%)
National USAID
Extreme
Intl. 2005 PPP
Poverty rate by Poverty Levels - Sample
ScoreNational USAID
Extreme
Intl. 2005 PPP Frequen
cy%

16
3.1.5 Household Income
Wages contributed a major share to the cash income of surveyed households
About 60% of income for both farm and non-farm households are contributed by wage
income. While the average income of farm households in 529.4, about 310.2 is contributed
by wages. In the case of Non-farm households, while average income is 3,378.4 about
2,036.4 is contributed by wages.
Income poverty was six times higher among surveyed poor farm households
While income levels of both non-farm and farm households continues to be low, income
poverty among farm households is six times higher than the non-farm households. While
average non-farm income is 3,378.4, the farm income is only 529.4. This suggests that a
great inequality exists in income among farm and non-farm households. It also indicates
the need to improve agricultural incomes.
3.1.6 Household Expenditure Surveyed households spent about four-fifth of expenditure on food A key feature found among expenditure patterns in poor households is its spending on food. Poor households normally spend over 50% of the income on food. This is much higher among surveyed households. Here over four-fifth (84%) expenditure is incurred on food. Lesser levels of income for other requirements results in this financial behaviour for poor households. This has major implications. This means lesser amount is spent on other important necessities such as education and health resulting in poor human development outcomes for the household.
17
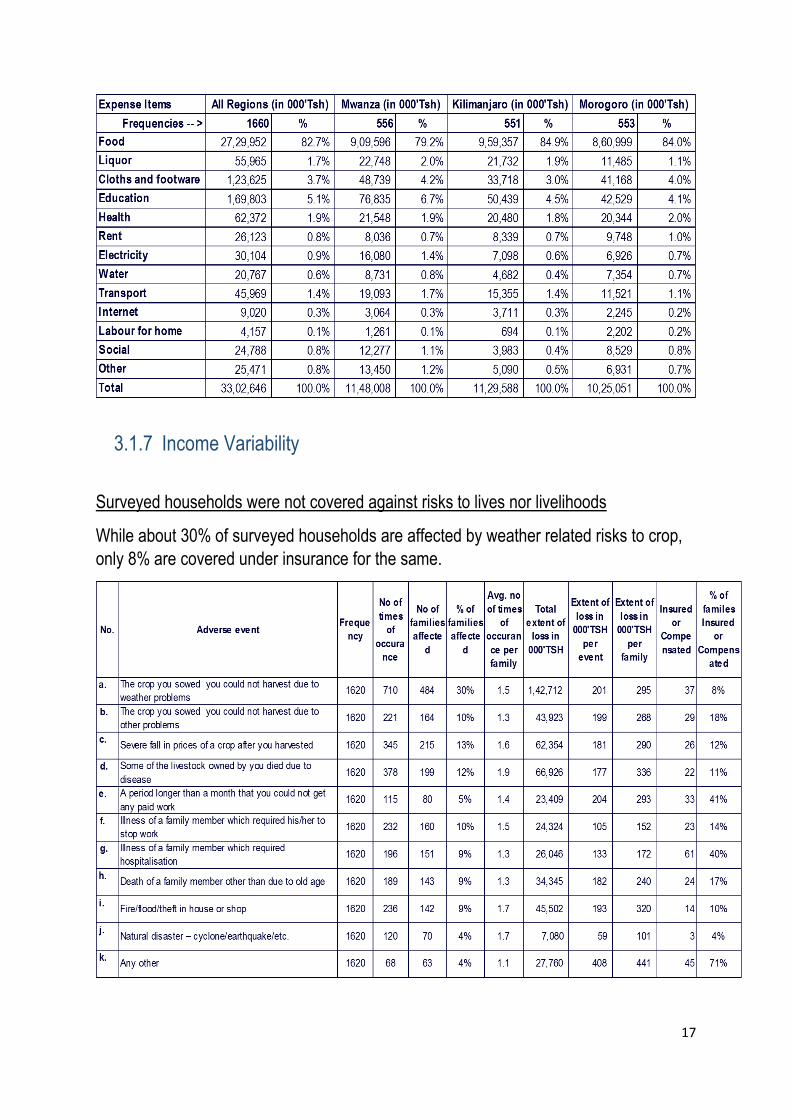
3.1.7 Income Variability
Surveyed households were not covered against risks to lives nor livelihoods
While about 30% of surveyed households are affected by weather related risks to crop,
only 8% are covered under insurance for the same.

18
3.1.8 Gender Dimension
Women played a partial role in decision making related to livelihoods and household
issues in over half of the surveyed households
While in about two-third (64.2%)
household’s women only played a
partial role in decision making
related to crops and animals, in
about one-fourth (27.2%)
households, they played a major
role in decisions related to crops
and animals. This indicates that
while women are not fully
empowered, they do play a
decent role and are provided
space for the same in surveyed households.
Region * Women control over decisions related to crops and animals Cross tabulation
Women control over decisions related to crops and animals
Total Major role Partial role No say
Region KILIMANJARO Count 124 402 23 549
% within Region 22.6% 73.2% 4.2% 100.0%
MOROGORO Count 142 365 69 576
% within Region 24.7% 63.4% 12.0% 100.0%
MWANZA Count 182 292 50 524
% within Region 34.7% 55.7% 9.5% 100.0%
Total Count 448 1059 142 1649
% within Region 27.2% 64.2% 8.6% 100.0%
Similarly in decision making related to household expenses and purchase, about two-third (66.6%) women played a partial role in making choices and a little less than one-fourth (23.8%) women did play a major role in making such choices. This indicates that while women are not empowered in decision making related to expenditure, they do have a space which however needs to expand.

19
Region * Women control over decision related to expenses and purchase
Women control over decision related to expenses and purchase
Total Major role Partial role No say
Region KILIMANJARO Count 97 423 37 557
% within Region 17.4% 75.9% 6.6% 100.0%
MOROGORO Count 141 372 66 579
% within Region 24.4% 64.2% 11.4% 100.0%
MWANZA Count 158 314 56 528
% within Region 29.9% 59.5% 10.6% 100.0%
Total Count 396 1109 159 1664
% within Region 23.8% 66.6% 9.6% 100.0%
About half of the women (51.8%) had a partial say in decisions related to having a baby. In about one-fourth households (28%) they did have a major say. In about one-fifth households women did not have any say at all in matters related to decision making on having a baby. Compared to livelihood and financial matters in matters related to having children, women’s role is much more limited.
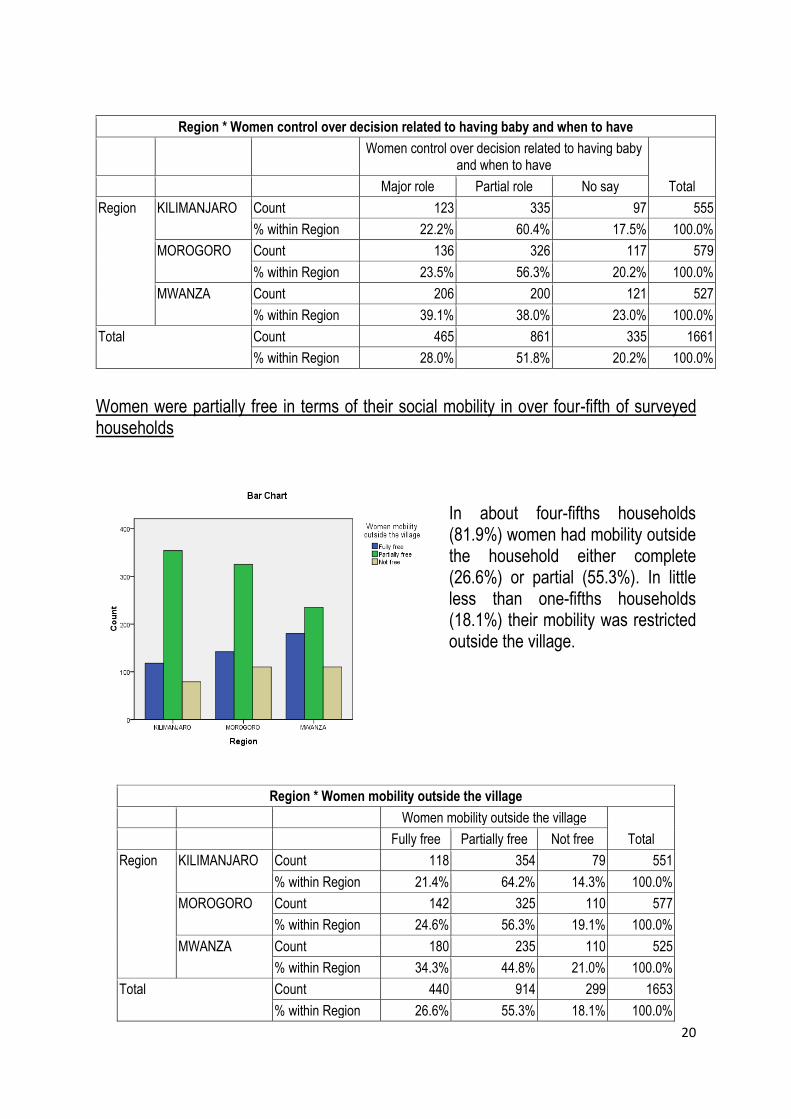
20
Region * Women control over decision related to having baby and when to have
Women control over decision related to having baby and when to have
Total Major role Partial role No say
Region KILIMANJARO Count 123 335 97 555
% within Region 22.2% 60.4% 17.5% 100.0%
MOROGORO Count 136 326 117 579
% within Region 23.5% 56.3% 20.2% 100.0%
MWANZA Count 206 200 121 527
% within Region 39.1% 38.0% 23.0% 100.0%
Total Count 465 861 335 1661
% within Region 28.0% 51.8% 20.2% 100.0%
Women were partially free in terms of their social mobility in over four-fifth of surveyed households
In about four-fifths households (81.9%) women had mobility outside the household either complete (26.6%) or partial (55.3%). In little less than one-fifths households (18.1%) their mobility was restricted outside the village.
Region * Women mobility outside the village
Women mobility outside the village
Total Fully free Partially free Not free
Region KILIMANJARO Count 118 354 79 551
% within Region 21.4% 64.2% 14.3% 100.0%
MOROGORO Count 142 325 110 577
% within Region 24.6% 56.3% 19.1% 100.0%
MWANZA Count 180 235 110 525
% within Region 34.3% 44.8% 21.0% 100.0%
Total Count 440 914 299 1653
% within Region 26.6% 55.3% 18.1% 100.0%

21
In decisions related to engagement outside home for out of home economic activities, women have no or lesser say. About three-fourth (75%) households had similar or more say in engaging out of home commercial activities. In one-fourth (25%) of the households women were less free to engage in out of home commercial activities.
Region * Women difficulty in engaging in out of home commercial activity
Women difficulty in engaging in out of home commercial activity
Total More Same Less
Region KILIMANJARO Count 230 203 116 549
% within Region 41.9% 37.0% 21.1% 100.0%
MOROGORO Count 239 181 157 577
% within Region 41.4% 31.4% 27.2% 100.0%
MWANZA Count 86 300 141 527
% within Region 16.3% 56.9% 26.8% 100.0%
Total Count 555 684 414 1653
% within Region 33.6% 41.4% 25.0% 100.0%
Women face difficulty in being member of farmer associations. About fourth-fifth (78.1%) households expressed that women have more difficulty than men in being part of farmer associations. In about one-fifth (21.9%) households women had lesser difficulty in being part of farmer association. This has major implications in terms of women empowerment. As a result their
participation in collective action remains marginal.

22
Region * Women difficulty in being part of farmer association
Women difficulty in being part of farmer association
Total More Same Less
Region KILIMANJARO Count 212 229 109 550
% within Region 38.5% 41.6% 19.8% 100.0%
MOROGORO Count 261 174 144 579
% within Region 45.1% 30.1% 24.9% 100.0%
MWANZA Count 107 308 108 523
% within Region 20.5% 58.9% 20.7% 100.0%
Total Count 580 711 361 1652
% within Region 35.1% 43.0% 21.9% 100.0%
3.2 Financial Inclusion
Only about one-third of surveyed households had access to any financial services from
formal institutions
3.2.1 Bank Accounts
About one-third (34.2%) respondents had a bank account. This varied widely across the regions. Compared to Mwanza where about two-third (68.1%) respondents had a bank account, the same in the case of Kilimanjaro was one-fifth (21.8%) respondents and Morogoro one-eighth (12.4%) respondents. This means that there are large numbers of households (two-third) which are financially excluded.

23
Region * Have bank account
Have bank account
Total Yes No
Region KILIMANJARO Count 128 471 599
% within Region 21.4% 78.6% 100.0%
MOROGORO Count 72 507 579
% within Region 12.4% 87.6% 100.0%
MWANZA Count 407 191 598
% within Region 68.1% 31.9% 100.0%
Total Count 607 1169 1776
% within Region 34.2% 65.8% 100.0%
Similarly over one-third (36.3%) households had a bank account. This varied widely across the regions. Compared to Mwanza where a little less than three-fourth (74.4%) households had a bank account, the same in the case of Kilimanjaro was one-sixth (15.1%) households and Morogoro one-fifth (19.5%) households.
Region * Family bank account
Family bank account
Total Yes No
Region KILIMANJARO Count 90 505 595
% within Region 15.1% 84.9% 100.0%
MOROGORO Count 112 463 575
% within Region 19.5% 80.5% 100.0%
MWANZA Count 434 149 583
% within Region 74.4% 25.6% 100.0%
Total Count 636 1117 1753
% within Region 36.3% 63.7% 100.0%
24
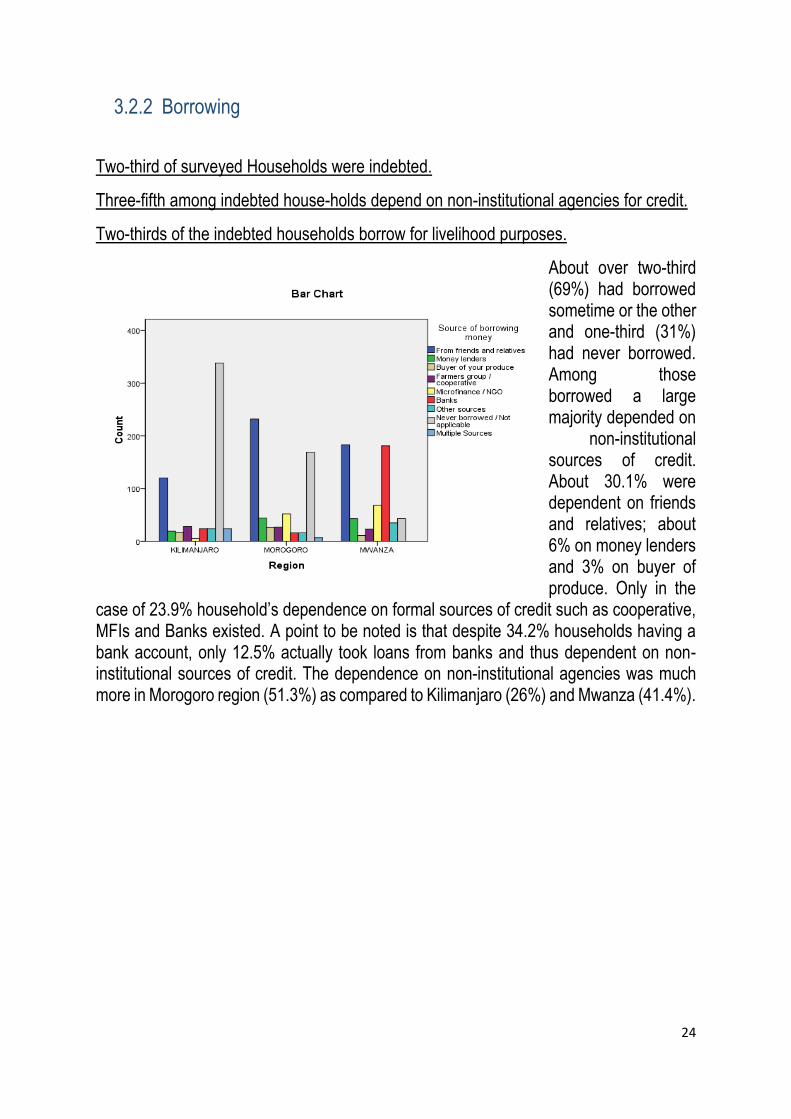
3.2.2 Borrowing
Two-third of surveyed Households were indebted.
Three-fifth among indebted house-holds depend on non-institutional agencies for credit.
Two-thirds of the indebted households borrow for livelihood purposes.
About over two-third (69%) had borrowed sometime or the other and one-third (31%) had never borrowed. Among those borrowed a large majority depended on
non-institutional sources of credit. About 30.1% were dependent on friends and relatives; about 6% on money lenders and 3% on buyer of produce. Only in the
case of 23.9% household’s dependence on formal sources of credit such as cooperative, MFIs and Banks existed. A point to be noted is that despite 34.2% households having a bank account, only 12.5% actually took loans from banks and thus dependent on non-institutional sources of credit. The dependence on non-institutional agencies was much more in Morogoro region (51.3%) as compared to Kilimanjaro (26%) and Mwanza (41.4%).

25
Among the households about two-fifths (42.3%) borrowed for livelihood purposes, one-third (15.9%) for household well-being purposes and one-twelfth (8.2%) on social events and other purposes. Loan borrowing for livelihood purposes was more in Morogoro region (58.8%) in comparison to Kilimanjaro (30.1%) and Mwanza (48.3%). Borrowing for household wellbeing purposes was more in Mwanza (30.2%) in comparison to Morogoro (11.2%) and Kilimanjaro (6.3%).
To buy
agricultur
e inputs
To buy
other
business
inputs
To buy
equipm
ent
To
construct
house
For
education
purpose
For
health
purpose
For social
events
Any
other
Not
applicable
Multiple
PurposesTotal
Count 142 19 19 2 32 4 0 30 338 13 599
% within Region 23.70% 3.20% 3.20% 0.30% 5.30% 0.70% 0.00% 5.00% 56.40% 2.20% 100.00%
Count 111 150 25 4 19 43 8 21 169 37 587
% within Region 18.90% 25.60% 4.30% 0.70% 3.20% 7.30% 1.40% 3.60% 28.80% 6.30% 100.00%
Count 48 186 52 19 147 13 20 66 41 0 592
% within Region 8.10% 31.40% 8.80% 3.20% 24.80% 2.20% 3.40% 11.10% 6.90% 0.00% 100.00%
Count 301 355 96 25 198 60 28 117 548 50 1778
% within Region 16.90% 20.00% 5.40% 1.40% 11.10% 3.40% 1.60% 6.60% 30.80% 2.80% 100.00%
MWANZA
Region
Total
Region * Why borrow money Crosstabulation
Why borrow money
KILIMANJARO
MOROGORO

26
3.2.3 Savings
Only about one-third of surveyed households saved in formal institutions
Savings across formal and informal sources was equally divided. About 47.3% households had savings either in the form of home savings or had lent out. About 32.2% had saved in formal sources such as cooperative (3.7%), MFI (2.8%) and Banks (25.7%). Informal savings was much more in Morogoro (73.3%) in comparison to Kilimanjaro (40.9%) and Mwanza (28.0%). Higher number of households in Mwanza had savings in formal
sources (67.4%) in comparison to Morogoro (18%) and Kilimanjaro (11.2%). This indicates high level of financial exclusion with two-third excluded from formal financial institutions.
At home
Borrowed
to friend
or relative
With
cooperative
or any group
With
MFIs/NGO Banks
Any
other
places
Multiple
ways Total
Count 230 15 11 4 52 70 217 599
% within Region 38.40% 2.50% 1.80% 0.70% 8.70% 11.70% 36.20% 100.00%
Count 385 43 24 26 55 26 25 584
% within Region 65.90% 7.40% 4.10% 4.50% 9.40% 4.50% 4.30% 100.00%
Count 150 16 30 20 349 28 0 593
% within Region 25.30% 2.70% 5.10% 3.40% 58.90% 4.70% 0.00% 100.00%
Count 765 74 65 50 456 124 242 1776
% within Region 43.10% 4.20% 3.70% 2.80% 25.70% 7.00% 13.60% 100.00%Total
Region * How save money Crosstabulation
How save money
KILIMANJARO
MOROGORO
MWANZA
Region

27
3.2.4 Insurance
Only about one-fourth of surveyed households were protected under life risk coverage.
Only about one-sixth covered had enterprise insurance coverage.
Only about one-fourth (23.9%) of the
households were insured. A large
majority i.e., three-fourths were outside
the risk coverage through insurance.
Coverage of household through
insurance was better in Mwanza
(51.1%) in comparison to Kilimanjaro
(7.4%) and Morogoro (13.2%). This
points to lack of protection from risks for surveyed households.
Region * Insurance for self and family
Insurance for self and family
Total Yes No
Region KILIMANJARO Count 44 547 591
% within Region 7.4% 92.6% 100.0%
MOROGORO Count 77 505 582
% within Region 13.2% 86.8% 100.0%
MWANZA Count 299 286 585
% within Region 51.1% 48.9% 100.0%
Total Count 420 1338 1758
% within Region 23.9% 76.1% 100.0%

28
Only about one-sixth (17.1%) households had risk coverage of their business. A large majority i.e., about five-sixths (82.9%) were outside risk coverage of their business. Risk coverage of business was much lesser in Morogoro (5.1%) than Kilimanjaro (10.7%) and Mwanza (35.7%).
Region * Insurance for business / crop
Insurance for business / crop
Total Yes No
Region KILIMANJARO Count 64 532 596
% within Region 10.7% 89.3% 100.0%
MOROGORO Count 30 556 586
% within Region 5.1% 94.9% 100.0%
MWANZA Count 208 374 582
% within Region 35.7% 64.3% 100.0%
Total Count 302 1462 1764
% within Region 17.1% 82.9% 100.0%

29
3.2.5 Remittance / Money Transfer
Three-fourths of surveyed households used mobile technology for money transfer
Over three-fourths (76.3%) households send and receive money through use of mobile technology. This was much more in Mwanza where about nine-tenth (89.3%) of the households use mobile technology as compared to Kilimanjaro 76% and Morogoro 63.6%.
Region * Money received sent from mobile
Money received sent from mobile
Total Yes No
Region KILIMANJARO Count 455 144 599
% within Region 76.0% 24.0% 100.0%
MOROGORO Count 368 211 579
% within Region 63.6% 36.4% 100.0%
MWANZA Count 525 63 588
% within Region 89.3% 10.7% 100.0%
Total Count 1348 418 1766
% within Region 76.3% 23.7% 100.0%
30
3.3 Smallholder Farming as a Livelihood
3.3.1 Farm Practices
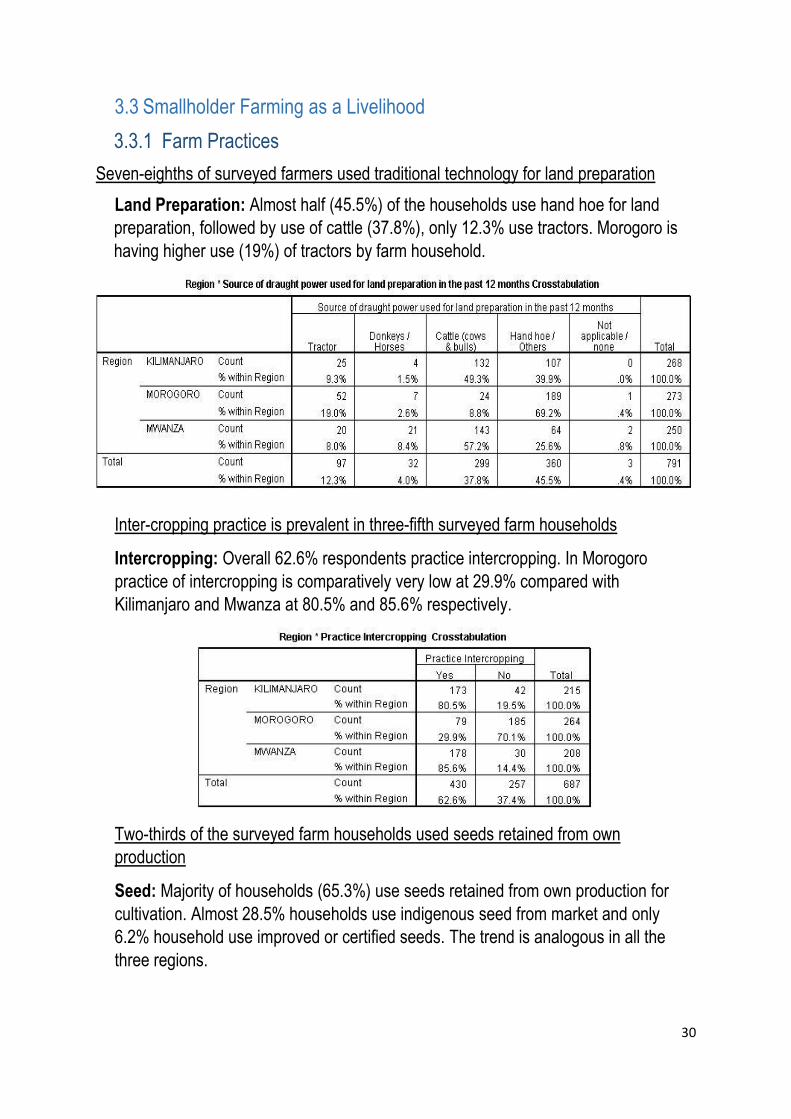
Seven-eighths of surveyed farmers used traditional technology for land preparation
Land Preparation: Almost half (45.5%) of the households use hand hoe for land
preparation, followed by use of cattle (37.8%), only 12.3% use tractors. Morogoro is
having higher use (19%) of tractors by farm household.
Inter-cropping practice is prevalent in three-fifth surveyed farm households
Intercropping: Overall 62.6% respondents practice intercropping. In Morogoro
practice of intercropping is comparatively very low at 29.9% compared with
Kilimanjaro and Mwanza at 80.5% and 85.6% respectively.
Two-thirds of the surveyed farm households used seeds retained from own
production
Seed: Majority of households (65.3%) use seeds retained from own production for
cultivation. Almost 28.5% households use indigenous seed from market and only
6.2% household use improved or certified seeds. The trend is analogous in all the
three regions.

31
Close to half of the surveyed households used chemical fertilizer for productivity
enhancement
Fertilizer: Overall 44.2% of the respondents use chemical fertilizers in their fields.
Compared to Kilimanjaro (59.5%) and Mwanza (58.2%) the application of chemical
fertilizer is minimal in Morogoro (15%).
Over one-sixth households used pesticides for dealing with pest attack
Crop Protection: Almost 84.4% farm households never used pesticides and herbicides
through spraying in the farm fields. The trend is similar across the three regions.

32
One-third the surveyed households had difficulties in marketing agricultural produce
Selling of Surplus Produce: Out of all 29% had difficulties in selling the surplus crops.
Around 16.1% reported that they did not face difficulties in selling the crops. This has
implications on agricultural incomes.
Lack of transportation and non-remunerative prices were the major reasons for the
inability to market of agricultural produce
High cost of transportation to the market (13.1%) and also low prices in the accessible
markets (14.6%) are the major reasons for difficulties in selling the crops. There are
also other reasons along with these two which are indicated in the table below. In 19%
cases combination of several reasons act as a barrier for selling. In Morogoro low
prices of the produce (26.9%) play as a major difficulty for selling the crops.

33
Post-Harvest Practices:
Post-harvest practices were utilized by only about half of the surveyed farmers
Overall 42.2% respondents said that commodity was dried to reduce spoilage before
storage. Also 35.5% reported it as not an applicable question. This practice is prevalent
in Morogoro with 57.8% people practicing drying of commodity before storing. About
one-fourth did not adopt this practice.
About one-fifth of the surveyed households did not practice storage in protected
structures
Overall almost 51.1% respondents said that commodity is stored in protected
structure to protect from rats, mice and moisture. This practice is widely followed
by most of the households. Amongst regions Morogoro reported better at 64.5%
following this practice.
Around 40% of the households reported that they have treated commodity with
chemicals during storage to control insects and pests. This practices is followed in
all the regions.

34
21.5% reported that pests and insects are main cause of loss during storage of
commodity. Around half 53.1% reported that cause of loss during storage of
commodity is not applicable to them. Rats, mice and other animals also contribute
to the extent of almost 16% towards loss during storage.

35
3.3.2 Livestock and Veterinary Services
About four-fifth of the surveyed households practiced livestock rearing
Interestingly 20.5% reported that they don’t rear any kind of livestock at home. In Morogoro
45.1% reported that they don’t rear any livestock. 30% of the households keep
combinations of different livestock like goats, pigs, cattle and chickens. Goats and Cattles
are reared by 16% and 20.3% families respectively. Cattle rearing and goat rearing are
more popular.
Almost half (49.6%) of the households reported that either they don’t rear livestock or
never availed any livestock services. The remaining 50% households, those who availed
veterinary services, got services mainly from veterinary doctor (17.5%), private
organizations (15.6%) and village para-vets (11.1%). Interestingly Morogoro reported
81.3% households either don’t rear livestock or never availed any livestock services.
Livestock services are quite prevalent in Kilimanjaro region with almost 80% of the
households having access to veterinary services.
36
3.3.3 Farm Training and Extension Services:
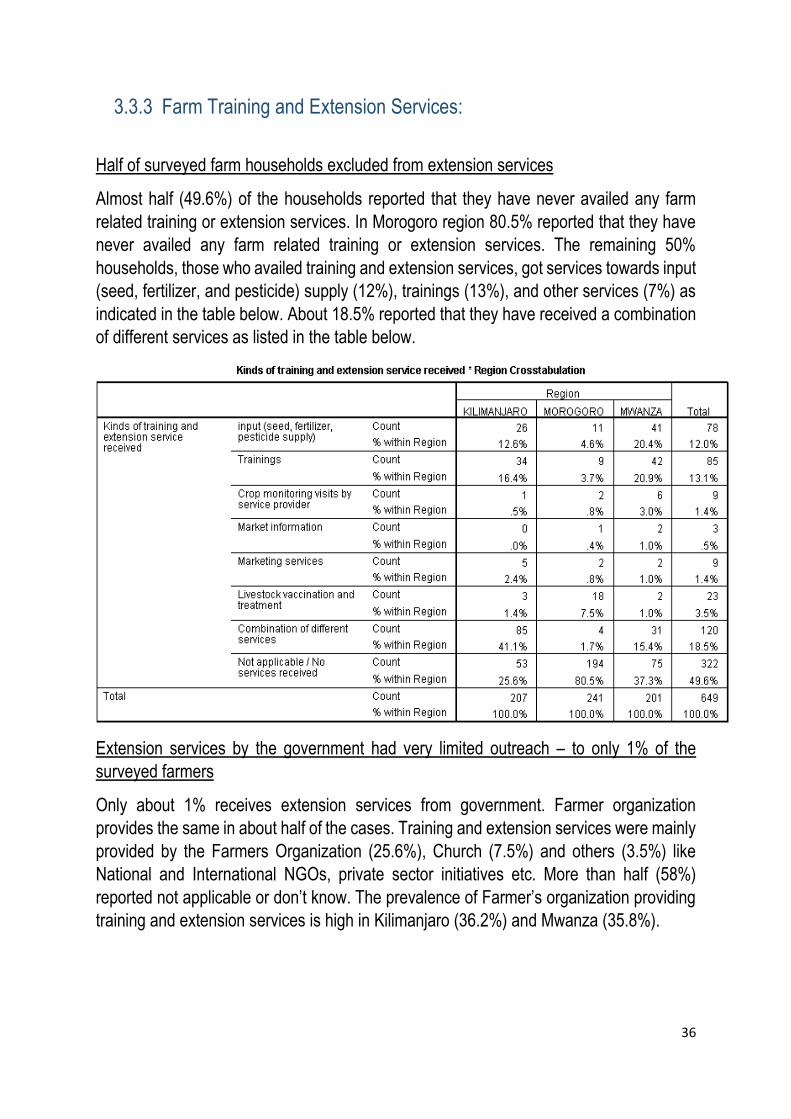
Half of surveyed farm households excluded from extension services
Almost half (49.6%) of the households reported that they have never availed any farm
related training or extension services. In Morogoro region 80.5% reported that they have
never availed any farm related training or extension services. The remaining 50%
households, those who availed training and extension services, got services towards input
(seed, fertilizer, and pesticide) supply (12%), trainings (13%), and other services (7%) as
indicated in the table below. About 18.5% reported that they have received a combination
of different services as listed in the table below.
Extension services by the government had very limited outreach – to only 1% of the
surveyed farmers
Only about 1% receives extension services from government. Farmer organization
provides the same in about half of the cases. Training and extension services were mainly
provided by the Farmers Organization (25.6%), Church (7.5%) and others (3.5%) like
National and International NGOs, private sector initiatives etc. More than half (58%)
reported not applicable or don’t know. The prevalence of Farmer’s organization providing
training and extension services is high in Kilimanjaro (36.2%) and Mwanza (35.8%).
37
3.3.4 Farmers Groups
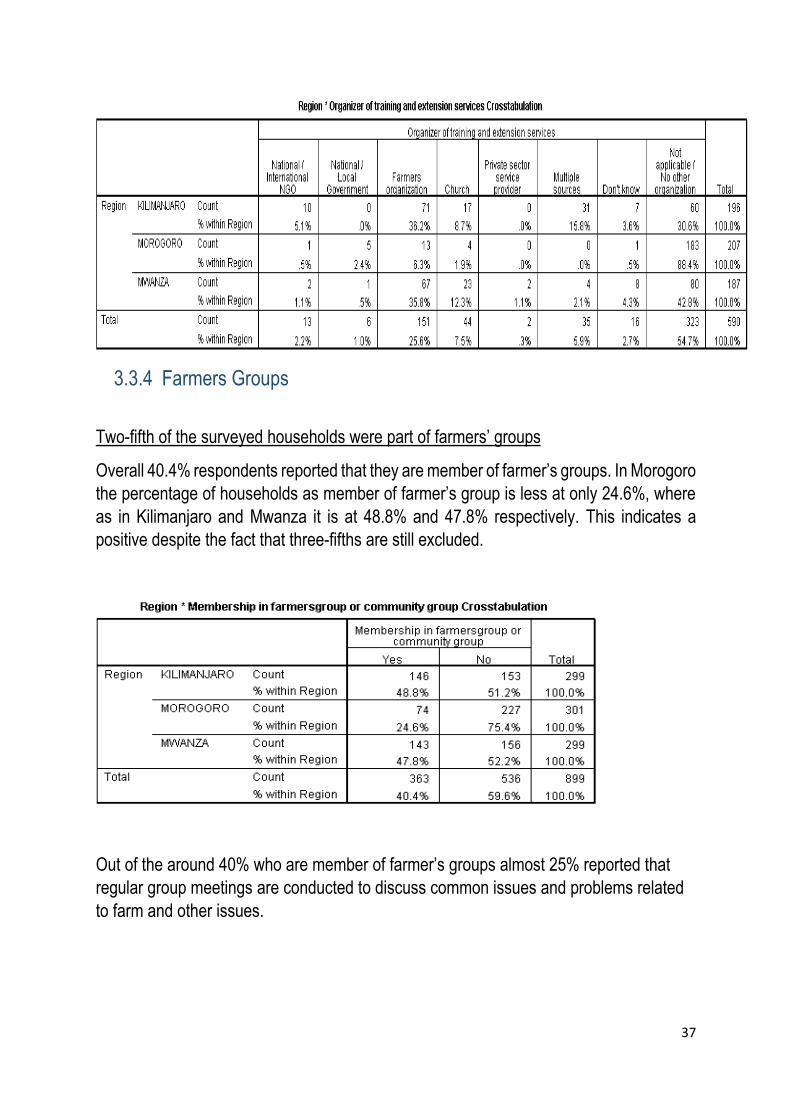
Two-fifth of the surveyed households were part of farmers’ groups
Overall 40.4% respondents reported that they are member of farmer’s groups. In Morogoro
the percentage of households as member of farmer’s group is less at only 24.6%, where
as in Kilimanjaro and Mwanza it is at 48.8% and 47.8% respectively. This indicates a
positive despite the fact that three-fifths are still excluded.
Out of the around 40% who are member of farmer’s groups almost 25% reported that
regular group meetings are conducted to discuss common issues and problems related
to farm and other issues.

38
About three-fourth of the surveyed households wish to be part of or continue to be in
farmers’ groups
Out of all the respondents almost 74% reported that either they are interested to become
a new member of a farmer’s group or continue if already an existing member.
Interestingly around 26% of the respondents replied otherwise.
Out of the 40% who reported that they are part of farmer’s groups, 14% said that they
received input supply from the farmer’s group. Trainings, output transportation and
output storage services were received by 3.6%, 4.3% and 1.2% respectively. Around
8.4% reported that they had received multiple services from the farmer’s group.

39
3.3.5 Demand for Services
Skill Development:
Over four-fifths of the surveyed farm households expressed the need for training and
extension services
Of the 899 farm households, about 772 expressed the need for training and extension
services. 48.3% expressed the need for combinations of different skills as indicated in the
table below followed by 33% for farm management and production related of existing
crops. 11.3% of the respondent expressed the need for learning to grow new commercial
crops.
40
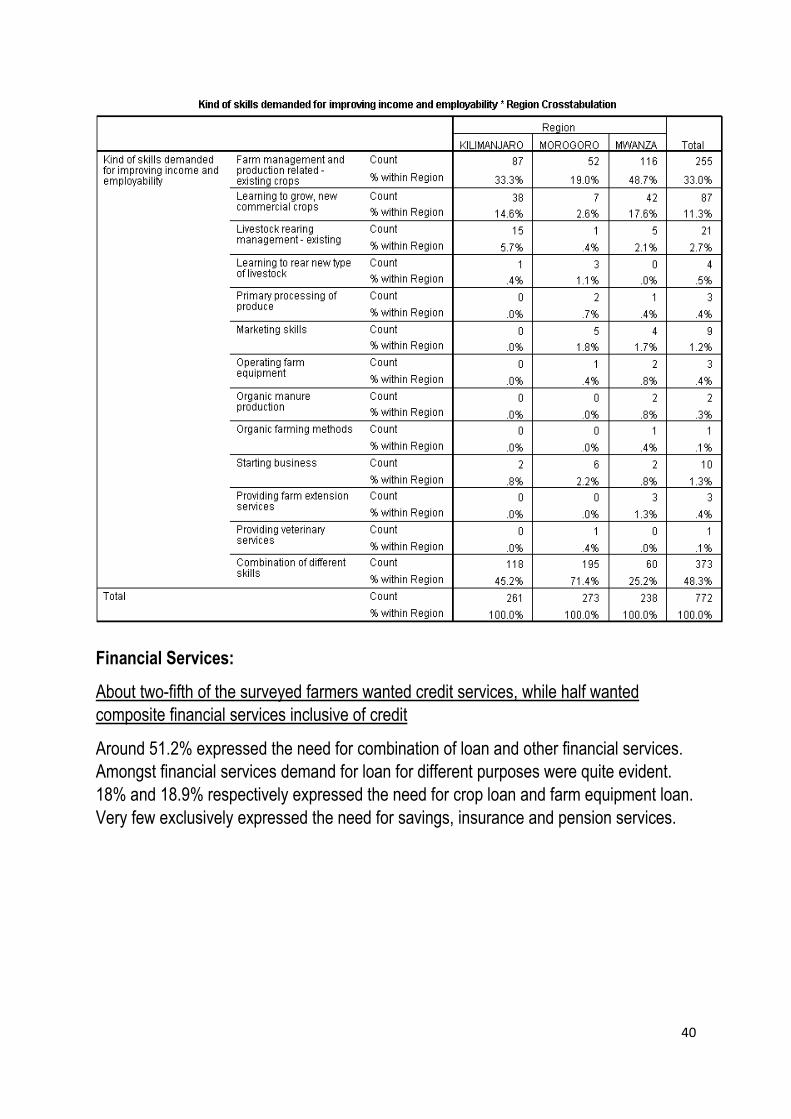
Financial Services:
About two-fifth of the surveyed farmers wanted credit services, while half wanted
composite financial services inclusive of credit
Around 51.2% expressed the need for combination of loan and other financial services.
Amongst financial services demand for loan for different purposes were quite evident.
18% and 18.9% respectively expressed the need for crop loan and farm equipment loan.
Very few exclusively expressed the need for savings, insurance and pension services.

41
Farm Related Services:
While one third of the surveyed farmers expressed the need for market linkage services
(input and output) about half preferred a combination of services which also incorporated
extension and post-harvest services
Exclusively around 30.9% expressed the need for quality inputs supply like seeds,
fertilizers and pesticides. The demand for extension services for crop and livestock
together was around 11.6%. Amongst all 54.3% expressed the need for a combination of
different farm related services.

42
3.4 Non-Farm Livelihoods
3.4.1 Ownership
Women individual or joint owners in two-fifth of the surveyed non-farm enterprises
In about two-fifth (41.6%) households women were either individually or jointly owners of non-farm enterprises. About one-fifth (19.1%) of non-farm households had a single female proprietor and a less than a quarter (22.5%) had joint proprietorship of husband and wife. Female ownership either individually or jointly was more in Mwanza (53.6%) in comparison to Kilimanjaro (19.9%) and Morogoro (49.7%).

43
Region * Ownership arrangement
Ownership arrangement
Total
Female,
one proprietor
Male, one proprietor
Multiple proprietors-husband and wife
Multiple proprietors
- blood relatives
Multiple proprietors
- non-family Other
Region KILIMANJARO
Count 11 59 38 29 27 82 246
% within Region
4.5% 24.0% 15.4% 11.8% 11.0% 33.3% 100.0
%
MOROGORO Count 61 92 82 16 22 15 288
% within Region
21.2% 31.9% 28.5% 5.6% 7.6% 5.2% 100.0
%
MWANZA Count 77 89 56 15 9 2 248
% within Region
31.0% 35.9% 22.6% 6.0% 3.6% .8% 100.0
%
Total Count 149 240 176 60 58 99 782
% within Region
19.1% 30.7% 22.5% 7.7% 7.4% 12.7% 100.0
%
3.4.2 Problems faced by micro-enterprises
Access to finance and marketing were the two major challenges affecting surveyed non-
farm enterprises, affecting two-fifth of them
Access to finance was the major problem faced by enterprises (19.8%) followed by
marketing of produce (19.4%). Access to finance as a major problem was most prevalent
in Morogoro with 25.3% enterprises facing the challenge. In Kilimanjaro quality of input
supply was the major problem faced by enterprises (29.8%). Mwanza had also about one-
sixth enterprises facing the challenge of access to new technology.
Access to
finance
Quality
input
supply
Availability
of new
technology
/ machinery
/ tools
Marketin
g /
selling
related
issues
Unavailabilit
y of proper
technical and
managerial
guidance
Labour
issues
(both
quality and
quantity)
Regulatory
/ Licencing
/ Tax issues
Combina
tion of
multiple
problems Total
Count 30 71 8 39 4 10 45 31 238
% within Region 12.60% 29.80% 3.40% 16.40% 1.70% 4.20% 18.90% 13.00% 100.00%
Count 70 11 19 65 26 1 12 73 277
% within Region 25.30% 4.00% 6.90% 23.50% 9.40% 0.40% 4.30% 26.40% 100.00%
Count 50 19 40 43 15 11 15 51 244
% within Region 20.50% 7.80% 16.40% 17.60% 6.10% 4.50% 6.10% 20.90% 100.00%
Count 150 101 67 147 45 22 72 155 759
% within Region 19.80% 13.30% 8.80% 19.40% 5.90% 2.90% 9.50% 20.40% 100.00%
KILIMANJARO
MOROGORO
MWANZA
Region
Total
Region * Kind of problems faced by enterprises Crosstabulation
Kind of problems faced by enterprises

44
3.4.3 Skills and Services Received
About half of the surveyed non-farm households had received training for business
development
About half households (46.9%) stated that they acquired skill which helped them in contributing their business. This was more so in the case of Kilimanjaro where the figure was 61.3%, followed by Mwanza at 58.7% and Morogoro with the least at 22.3%.
Region * Skill acquisition contributing to business
Skill acquisition contributing to business
Total Yes No
Region KILIMANJARO Count 179 113 292
% within Region 61.3% 38.7% 100.0%
MOROGORO Count 63 220 283
% within Region 22.3% 77.7% 100.0%
MWANZA Count 138 97 235
% within Region 58.7% 41.3% 100.0%
Total Count 380 430 810
% within Region 46.9% 53.1% 100.0%
About 45% (45.8%) enterprises stated that they received business development services for their enterprises. This was more in the case of Mwanza at 84.3% followed by Kilimanjaro at 39.4% and Morogoro at 20.5%.
Region * Business development services received by enterprise
Business development services received by enterprise
Total Yes No
Region KILIMANJARO Count 115 177 292
% within Region 39.4% 60.6% 100.0%
MOROGORO Count 58 225 283
% within Region 20.5% 79.5% 100.0%
MWANZA Count 198 37 235
% within Region 84.3% 15.7% 100.0%
Total Count 371 439 810
% within Region 45.8% 54.2% 100.0%

45
Among the non-farm households, about 12.9% received management training followed by technical advice and training by 10.1% households. This was followed with marketing assistance by 8.8% households. Overall about 37.5% enterprises in Kilimanjaro, 19.1% enterprises in Morogoro and 83.5% in Mwanza had received some or the other type of BDS services.
3.4.4 Producers’ Groups
About one-third of surveyed non-farm enterprises had membership in associations
About 30.7% of the non-farm enterprises had membership in business network /
association. This was more in Mwanza which had 40.8% enterprises with membership in
enterprises, followed by Kilimanjaro at 36.6%. In Morogoro membership in network /
association was the least at 17%. While the larger number of enterprises still continues to
be informal, there is still scope for formalization of about two-third enterprises.
Region * Membership in business network / association
Membership in business network / association
Total Yes No
Region KILIMANJARO Count 106 184 290
% within Region 36.6% 63.4% 100.0%
MOROGORO Count 48 235 283
% within Region 17.0% 83.0% 100.0%
MWANZA Count 89 129 218
% within Region 40.8% 59.2% 100.0%
Total Count 243 548 791
% within Region 30.7% 69.3% 100.0%
Managem
ent
training
Technical
advice and
training
Marketing
assistance
Informal
advice/traini
ng
assistance
Other types
of Non-
Financial
assistance
Combinati
on of
services
Not
Applicable
Count 25 34 15 12 17 3 177 283
% within Region 8.80% 12.00% 5.30% 4.20% 6.00% 1.10% 62.50% 100.00%
Count 15 8 22 4 3 1 225 278
% within Region 5.40% 2.90% 7.90% 1.40% 1.10% 0.40% 80.90% 100.00%
Count 61 37 32 20 25 12 37 224
% within Region 27.20% 16.50% 14.30% 8.90% 11.20% 5.40% 16.50% 100.00%
Count 101 79 69 36 45 16 439 785
% within Region 12.90% 10.10% 8.80% 4.60% 5.70% 2.00% 55.90% 100.00%Total
Region * Type of BDS services received by Enterprise Crosstabulation
Type of BDS services received by Enterprise
Total
Region
KILIMANJARO
MOROGORO
MWANZA

46
About one-fourth (28.1%) non-farm enterprises expressed that they received benefits through membership. This was more in Mwanza at 37.2% followed by Kilimanjaro at 32.8% and Morogoro at 16.3%.
Region * Benefits received from membership
Benefits received from membership
Total Yes No Not Applicable
Region KILIMANJARO Count 95 11 184 290
% within Region 32.8% 3.8% 63.4% 100.0%
MOROGORO Count 46 2 235 283
% within Region 16.3% .7% 83.0% 100.0%
MWANZA Count 81 8 129 218
% within Region 37.2% 3.7% 59.2% 100.0%
Total Count 222 21 548 791
% within Region 28.1% 2.7% 69.3% 100.0%
About 28.5% non-farm enterprises expressed the type of benefits they received from membership in associations. About 12.9% benefitted through exchange of information; 3.5% benefitted through jointly selling output; 3.4% received credit. The larger number of beneficiaries from membership were from Mwanza (33.7%) followed by Kilimanjaro (34.1%) and Morogoro (16.1%). Benefits through exchange of information was most prevalent at Kilimanjaro (20.8%).
Exchange
of
information
Purchase
d inputs
jointly
Sold
output
jointly
Received
credit
through
associatio
n/group
Access to
Non-
financial
assistance
Worked
together
Combinati
on of
multiple
benefits
Not
Applicable
Count 58 2 11 3 1 7 13 184 279
% within Region 20.80% 0.70% 3.90% 1.10% 0.40% 2.50% 4.70% 65.90% 100.00%
Count 17 5 3 12 2 1 5 235 280
% within Region 6.10% 1.80% 1.10% 4.30% 0.70% 0.40% 1.80% 83.90% 100.00%
Count 24 12 13 11 2 13 3 129 207
% within Region 11.60% 5.80% 6.30% 5.30% 1.00% 6.30% 1.40% 62.30% 100.00%
Count 99 19 27 26 5 21 21 548 766
% within Region 12.90% 2.50% 3.50% 3.40% 0.70% 2.70% 2.70% 71.50% 100.00%Total
Region * Type of benefits received from membership Crosstabulation
Type of benefits received from membership
Total
Region
KILIMANJARO
MOROGORO
MWANZA
47
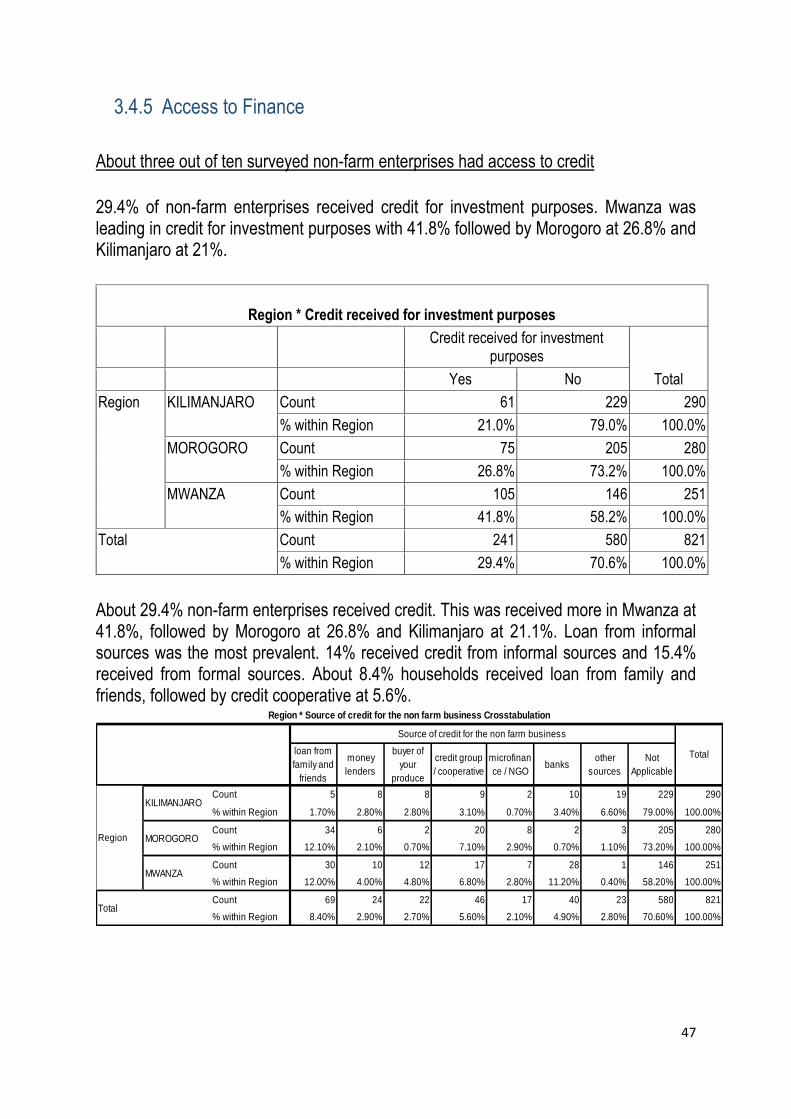
3.4.5 Access to Finance
About three out of ten surveyed non-farm enterprises had access to credit
29.4% of non-farm enterprises received credit for investment purposes. Mwanza was leading in credit for investment purposes with 41.8% followed by Morogoro at 26.8% and Kilimanjaro at 21%.
Region * Credit received for investment purposes
Credit received for investment purposes
Total Yes No
Region KILIMANJARO Count 61 229 290
% within Region 21.0% 79.0% 100.0%
MOROGORO Count 75 205 280
% within Region 26.8% 73.2% 100.0%
MWANZA Count 105 146 251
% within Region 41.8% 58.2% 100.0%
Total Count 241 580 821
% within Region 29.4% 70.6% 100.0%
About 29.4% non-farm enterprises received credit. This was received more in Mwanza at 41.8%, followed by Morogoro at 26.8% and Kilimanjaro at 21.1%. Loan from informal sources was the most prevalent. 14% received credit from informal sources and 15.4% received from formal sources. About 8.4% households received loan from family and friends, followed by credit cooperative at 5.6%.
loan from
family and
friends
money
lenders
buyer of
your
produce
credit group
/ cooperative
microfinan
ce / NGObanks
other
sources
Not
Applicable
Count 5 8 8 9 2 10 19 229 290
% within Region 1.70% 2.80% 2.80% 3.10% 0.70% 3.40% 6.60% 79.00% 100.00%
Count 34 6 2 20 8 2 3 205 280
% within Region 12.10% 2.10% 0.70% 7.10% 2.90% 0.70% 1.10% 73.20% 100.00%
Count 30 10 12 17 7 28 1 146 251
% within Region 12.00% 4.00% 4.80% 6.80% 2.80% 11.20% 0.40% 58.20% 100.00%
Count 69 24 22 46 17 40 23 580 821
% within Region 8.40% 2.90% 2.70% 5.60% 2.10% 4.90% 2.80% 70.60% 100.00%Total
Region * Source of credit for the non farm business Crosstabulation
Source of credit for the non farm business
Total
Region
KILIMANJARO
MOROGORO
MWANZA

48
3.4.6 Demand for Services
Four-fifths of the surveyed non-farm households expressed the need for BDS services
Out of 900 households, about 744 (82%) have expressed the need for BDS. About one-
fourth expressed the need for training assistance, one-fourth marketing assistance, one-
fifth technical advice. The non-farm households expressed demand for business
development services. About one-fourth (25.9%) non-formal enterprises expressed the
need for informal advice & training assistance, followed by demand for marketing
assistance by 23.3% enterprises and technical advice by 21.1% enterprises. In Kilimanjaro
and Morogoro the major demand was for training assistance expressed the need for by
34.2% and 28.7% respectively. In Mwanza the major demand was for marketing
assistance.
Respondents expressed the need for services which covers both technical and business dimensions of the enterprise. Over three-fifths (60.7%) of the non-formal enterprises expressed the need for skills training with a combination of production, processing, marketing, equipment maintenance and entrepreneurial skills. In Morogoro the demand for such services came from fourth-fifth (78.9%) of the respondents. This was followed by Kilimanjaro at 63.3% and Mwanza at 38.8%.
Managem
ent
training
Technical
advice and
training
Marketing
assistanc
e
Informal
advice/trai
ning
assistanc
e
Other
types of
Non-
Financial
assistanc
e
Combinati
on of
services
Count 18 70 52 94 27 14 275
% within Region 6.50% 25.50% 18.90% 34.20% 9.80% 5.10% 100.00%
Count 38 55 67 76 7 22 265
% within Region 14.30% 20.80% 25.30% 28.70% 2.60% 8.30% 100.00%
Count 39 32 54 23 34 22 204
% within Region 19.10% 15.70% 26.50% 11.30% 16.70% 10.80% 100.00%
Count 95 157 173 193 68 58 744
% within Region 12.80% 21.10% 23.30% 25.90% 9.10% 7.80% 100.00%Total
Region * Type of BDS services would like to receive Crosstabulation
Type of BDS services would like to receive
Total
Region
KILIMANJARO
MOROGORO
MWANZA

49
Half of the surveyed non-farm households wanted a combination of services Over half of the enterprises (54.5%) expressed the need for a combination of non-financial services which covers input linkages services, advisory business development services, storage facilities, value addition services, output services etc. The demand for this large combination of services was about two-third from Morogoro and Kilimanjaro region and by about one-fourth respondents at Mwanza.
production
related
processing
of produce
marketing
skills
operating
equipment
starting
business
risk
manage
ment
franchising
Combinati
on of
above
Count 11 6 44 9 31 7 0 186 294
% within Region 3.70% 2.00% 15.00% 3.10% 10.50% 2.40% 0.00% 63.30% 100.00%
Count 6 18 15 8 8 5 0 225 285
% within Region 2.10% 6.30% 5.30% 2.80% 2.80% 1.80% 0.00% 78.90% 100.00%
Count 18 12 65 13 38 19 2 106 273
% within Region 6.60% 4.40% 23.80% 4.80% 13.90% 7.00% 0.70% 38.80% 100.00%
Count 35 36 124 30 77 31 2 517 852
% within Region 4.10% 4.20% 14.60% 3.50% 9.00% 3.60% 0.20% 60.70% 100.00%Total
Region * Skill development that will improve income Crosstabulation
Skill development that will improve income
Total
Region
KILIMANJARO
MOROGORO
MWANZA
Quality
input / raw
material
supply
advisory
services for
business
improvement
output
management,
packaging
and storage
services
local value
addition
marketing
of produce
any other
services
Combinati
on of
different
supports
Count 20 24 2 5 21 26 192 290
% within Region 6.90% 8.30% 0.70% 1.70% 7.20% 9.00% 66.20% 100.00%
Count 8 34 11 7 20 14 187 281
% within Region 2.80% 12.10% 3.90% 2.50% 7.10% 5.00% 66.50% 100.00%
Count 19 32 18 11 57 34 56 227
% within Region 8.40% 14.10% 7.90% 4.80% 25.10% 15.00% 24.70% 100.00%
Count 47 90 31 23 98 74 435 798
% within Region 5.90% 11.30% 3.90% 2.90% 12.30% 9.30% 54.50% 100.00%Total
Region * Non financial services that will be helpful to improve production and income Crosstabulation
Non financial services that will be helpful to improve production and income
Total
Region
KILIMANJARO
MOROGORO
MWANZA

50
3.4.7 Skill Development
While a little less than half of those surveyed had attended skills training, only about one-sixth received formal skills training About 45.4% of the respondents stated that they attended skill training. The larger proportion of those who attended skill training was at Mwanza at 59.5%, followed by Kilimanjaro at 54.4% and the least at Morogoro at 22.4%.
Region * Skill training attended Cross tabulation
Skill training attended
Total Yes No
Region KILIMANJARO Count 326 273 599
% within Region 54.4% 45.6% 100.0%
MOROGORO Count 133 461 594
% within Region 22.4% 77.6% 100.0%
MWANZA Count 352 240 592
% within Region 59.5% 40.5% 100.0%
Total Count 811 974 1785
% within Region 45.4% 54.6% 100.0%
Only about one-sixth (15.3%) received the formal certification i.e., VETA certification. The larger proportion of VETA certification recipients were at Mwanza at 30.3% followed by Kilimanjaro at 9.3% and Morogoro at 6%.
Region * VETA Certification Cross tabulation
VETA Certification
Total Yes No
Region KILIMANJARO Count 56 543 599
% within Region 9.3% 90.7% 100.0%
MOROGORO Count 35 550 585
% within Region 6.0% 94.0% 100.0%
MWANZA Count 181 417 598
% within Region 30.3% 69.7% 100.0%
Total Count 272 1510 1782
% within Region 15.3% 84.7% 100.0%
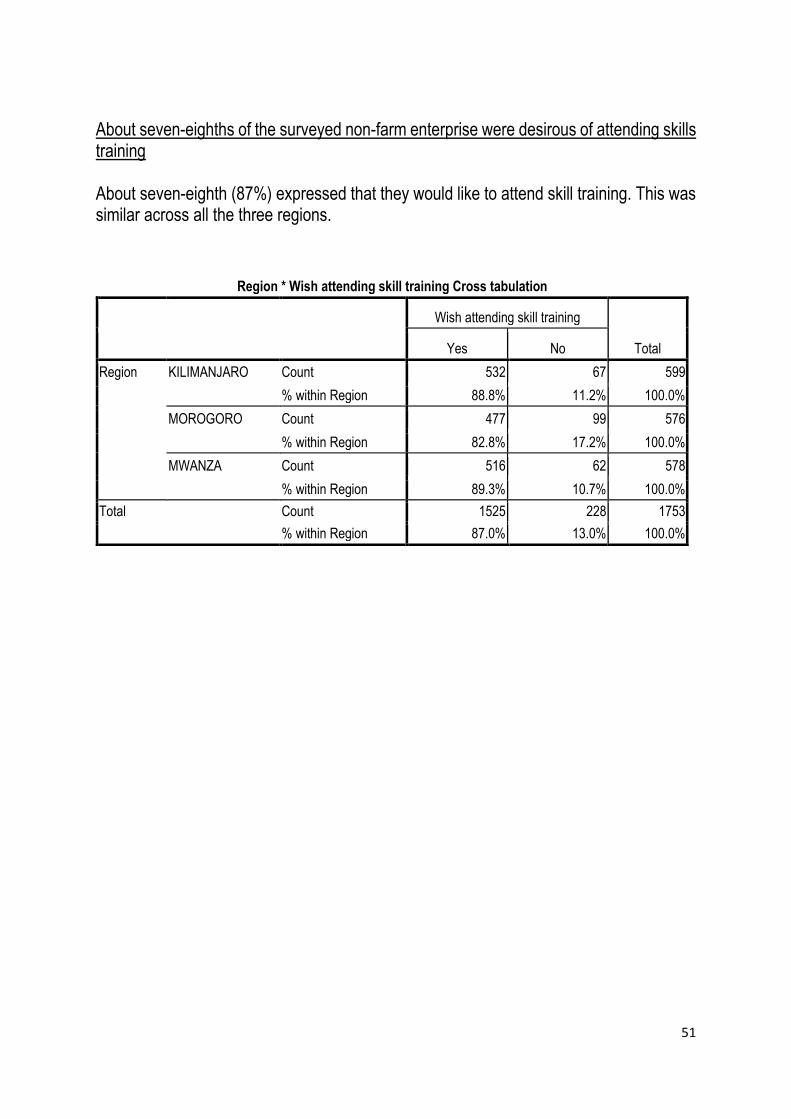
51
About seven-eighths of the surveyed non-farm enterprise were desirous of attending skills training About seven-eighth (87%) expressed that they would like to attend skill training. This was similar across all the three regions.
Region * Wish attending skill training Cross tabulation
Wish attending skill training
Total Yes No
Region KILIMANJARO Count 532 67 599
% within Region 88.8% 11.2% 100.0%
MOROGORO Count 477 99 576
% within Region 82.8% 17.2% 100.0%
MWANZA Count 516 62 578
% within Region 89.3% 10.7% 100.0%
Total Count 1525 228 1753
% within Region 87.0% 13.0% 100.0%

52
4. Conclusion
The study revealed a high level of inadequacy of livelihoods i.e., in about 60% of
households, not enough to earn above the poverty line. This was true among both the
farm and non-farm households. While incomes among both the farm and non-farm
households were low, farm households were receiving one-sixth lesser income than non-
farm households. Wages tended to be the major contributors to household income.
Major reasons for the poor livelihood status were found to be
exclusion from financial services,
exclusion from agricultural extension,
lack of business development services and skills training,
lack of post-harvest support, and
low access to and under-developed markets,
The findings showed that about two-third households were financially excluded. About
three-fourth were indebted and from among them three-fifths were dependent on non-
institutional sources for credit. Over five-sixths were also not covered for any business /
livelihood risk.
It was found that farm households lacked access to finance, training and extension
services, post-harvest support, market linkage services etc. which in turn were contributing
low agricultural incomes. While there are farmer groups, there are large number still
uncovered and were to become part of the same.
Among non-farm enterprises, finance and marketing were the two major challenges. Most
of them were also non-formal enterprises with implications in mobilizing capital.
About four-fifths of households expressed the need for an integrated set of services which
included credit, insurance, extension services, market linkage services, post-harvest
services, business development services, skills training etc.
Among the youth, half had ended their education by the time they completed primary
education. But they were desirous and willing to take up vocational education and skills
training for employment.
A positive finding was equal participation of women in the workforce. They played partial
role both within household and in outside sphere. However, this needs to further widen.
The study showed that while there were livelihood challenges which need to be
addressed, the desire of the community and its search for livelihood solutions can be a
basis for a new generation of integrated livelihood promotion initiatives.
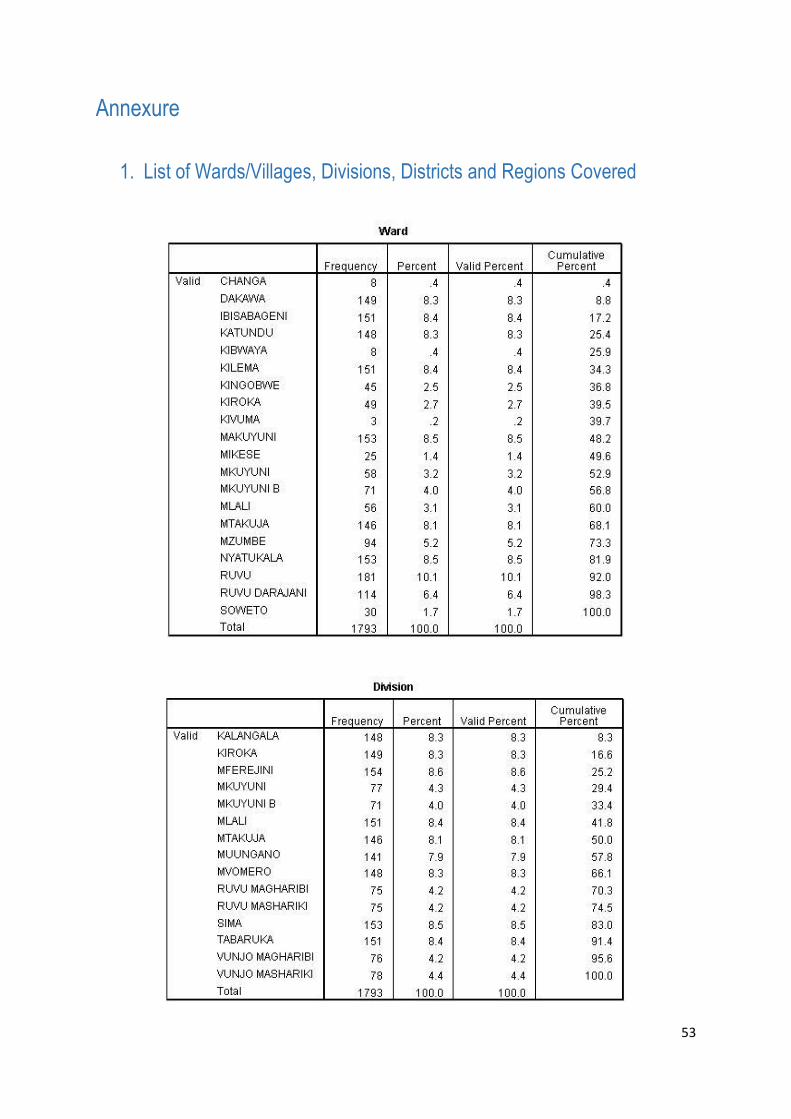
53
Annexure
1. List of Wards/Villages, Divisions, Districts and Regions Covered

54

55
2. Questionnaire – Farm
LIVELIHOOD BASELINE SURVEY QUESTIONNAIRE for the ALPs in TANZANIA
Farm
Investigators’ Sheet
Form Serial : Date :
(Région/District/Division/Location S. No.)
Form Category (round it) : Y – W / Y – M / NY – W / NY - M
Name of the Réspondent :
Mobile No: Rural (1) / Urban (2):
House No: Village (R) / Area (U) :
Ward : Division:
District: Region:
Investigator Code (Please enter the code alloted to you) :
(To be filled by Investigator) Name :
Signature :
Supervisor Code (Please enter the code alloted to you) :
(To be filled by Supervisor) Name:
Signature :
Verified and approved by Code (Please enter the code alloted to you)
(To be filled by Chief Investigator) Name
Signature

56
The following section has to be filled by the Data Entry Team
Data Entry Date :
Item of work: Team Member
Code Name Signature
Verified by :
Data entry by :
Quality check :
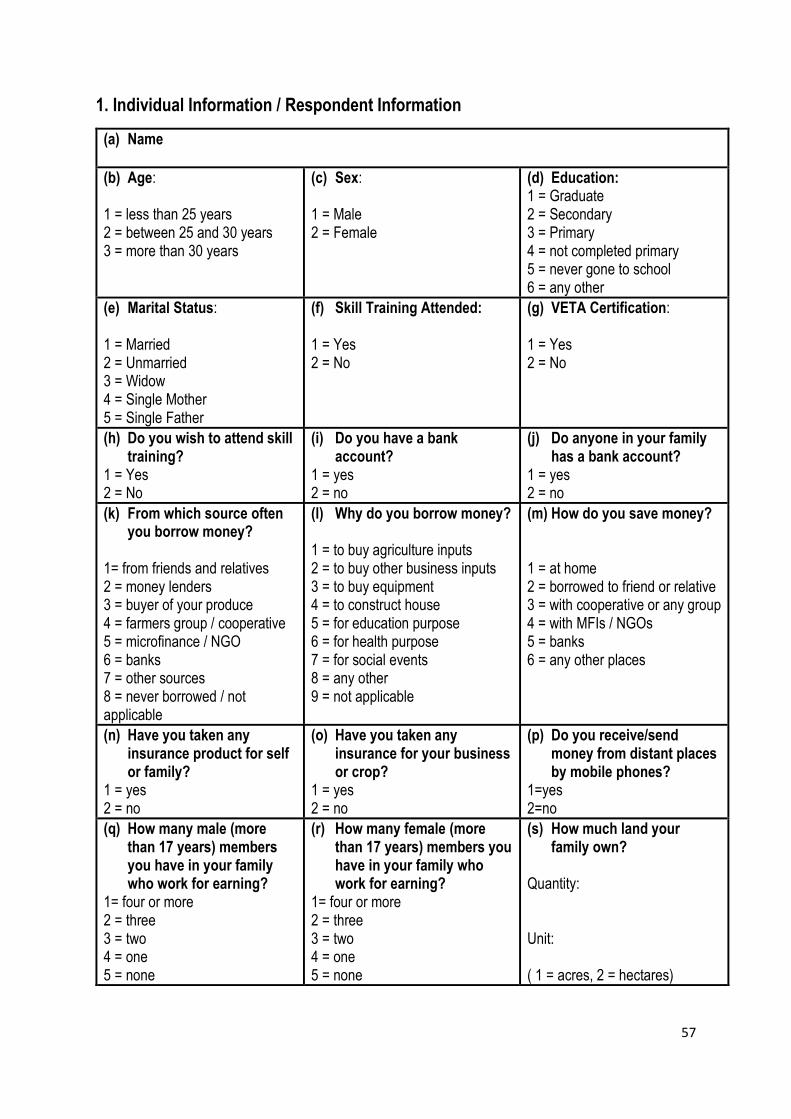
57
1. Individual Information / Respondent Information
(a) Name
(b) Age:
1 = less than 25 years 2 = between 25 and 30 years 3 = more than 30 years
(c) Sex:
1 = Male 2 = Female
(d) Education: 1 = Graduate 2 = Secondary 3 = Primary 4 = not completed primary 5 = never gone to school 6 = any other
(e) Marital Status:
1 = Married 2 = Unmarried 3 = Widow 4 = Single Mother 5 = Single Father
(f) Skill Training Attended:
1 = Yes 2 = No
(g) VETA Certification:
1 = Yes 2 = No
(h) Do you wish to attend skill training?
1 = Yes 2 = No
(i) Do you have a bank account?
1 = yes 2 = no
(j) Do anyone in your family has a bank account?
1 = yes 2 = no
(k) From which source often you borrow money?
1= from friends and relatives 2 = money lenders 3 = buyer of your produce 4 = farmers group / cooperative 5 = microfinance / NGO 6 = banks 7 = other sources 8 = never borrowed / not applicable
(l) Why do you borrow money? 1 = to buy agriculture inputs 2 = to buy other business inputs 3 = to buy equipment 4 = to construct house 5 = for education purpose 6 = for health purpose 7 = for social events 8 = any other 9 = not applicable
(m) How do you save money? 1 = at home 2 = borrowed to friend or relative 3 = with cooperative or any group 4 = with MFIs / NGOs 5 = banks 6 = any other places
(n) Have you taken any insurance product for self or family?
1 = yes 2 = no
(o) Have you taken any insurance for your business or crop?
1 = yes 2 = no
(p) Do you receive/send money from distant places by mobile phones?
1=yes 2=no
(q) How many male (more than 17 years) members you have in your family who work for earning?
1= four or more 2 = three 3 = two 4 = one 5 = none
(r) How many female (more than 17 years) members you have in your family who work for earning?
1= four or more 2 = three 3 = two 4 = one 5 = none
(s) How much land your family own?
Quantity: Unit: ( 1 = acres, 2 = hectares)

58
(t) How much land your family cultivate?
Quantity: Unit: ( 1 = acres, 2 = hectares)
2. Family Information (PPI Questions)
(a) How many household members are 17-years-old or younger?
1= four or more 2 = three 3 = two 4 = one 5 = none
(b) Do all children ages 6 to 17 attend school?
1 = No 2 = Yes / no children ages 6 to 17
(c) Can the female head/spouse read and write?
1 = No 2 = Yes, but not in Kiswahili nor English 3 = No female head / spouse 4 = Yes, only in Kiswahili 5 = Yes, in English (regardless of others)
(d) What is the main building material of the floor of the main dwelling?
1 = Earth 2 = Concrete, cement, tiles, timber or other
(e) What is the main building material of the roof of the main dwelling?
1 = mud and grass 2 = grass, leaves, bamboo 3 = concrete, cement, metal sheets (GCI), asbestos sheets, tiles, or other
(f) How many bicycles, mopeds, motorcycles, tractors, or motor vehicles does your household own?
1 = none 2 = one 3 = two or more
(g) Does your household own any radios or radio cassettes?
1 = Yes 2 = No
(h) Does your household own any lanterns?
1 = Yes 2 = No
(i) Does your household own any irons (charcoal or electric)?
1 = Yes 2 = No
(j) How many tables does your household own?
1 = None 2 = One 3 = Two 4 = Three or more

59
3. Savings (in kind) behaviour In the last two years, have you bought or sold any of these assets, and if so, how much worth?
Item/Asset Bought 1 = Yes 2 = No
Bought for Tsh (‘000)
Sold 1 = Yes 2 = No
Sold for Tsh (‘000)
Land
Livestock
Housing
Vehicles
Consumer durables
Jewellery
Other
Total
60
4. Family’s non-wage income from multiple activities (all figures are in ‘000 Tsh)
Months -> Jan Feb Mar Apr May Jun Jul Aug Sep Oct Nov Dec Total
Agriculture Production
Revenue during the month (Tsh)
Expenditure during the month (Tsh)
Livestock Rearing
Revenue during the month (Tsh)
Expenditure during the month (Tsh)
Processing/ Manufacturing
Revenue during the month (Tsh)
Expenditure during the month (Tsh)
Services / Repairs
Revenue during the month (Tsh)
Expenditure during the month (Tsh)
Trading Revenue during the month (Tsh)
Expenditure during the month (Tsh)
Any Other Activities
Revenue during the month (Tsh)
Expenditure during the month (Tsh)
Total from all Activities
Revenue during the month (Tsh)
Expenditure during the month (Tsh)
Net income during the month (Tsh)

61
5 Wage income from multiple sources for each working members (in ‘000 Tsh)
5. a. Male members of the family (in ‘000 Tsh)
Months -> Jan Feb Mar Apr May Jun Jul Aug Sept Oct Nov Dec Total
Wage Labour in farms/plantations
No of Person Days
Average Daily Income (Tsh)
Other Wage Labour
No of Person Days
Average Daily Income (Tsh)
Salary – part-time or full-tme
No of Person Days
Average Daily Income (Tsh)
Pensions or other government/Church payments
No of Person Days
Average Daily Income (Tsh)
Remittances from migrant family members
No of Person Days
Average Daily Income (Tsh)
Wage work on migrating (farm/non-farm)
No of Person Days
Average Daily Income (Tsh)
Any Other (like rent, interest, etc.)
No of Person Days
Average Daily Income (Tsh)
Total from all Sources
No of Person Days
Average Daily Income (Tsh)

62
5. b. Female members of the family (in ‘000 Tsh)
Months -> Jan Feb Mar Apr May Jun Jul Aug Sept Oct Nov Dec Total
Wage Labour in farms/plantations
No of Person Days
Average Daily Income (Tsh)
Other Wage Labour
No of Person Days
Average Daily Income (Tsh)
Salary – part-time or full-tme
No of Person Days
Average Daily Income (Tsh)
Pensions or other government/Church payments
No of Person Days
Average Daily Income (Tsh)
Remittances from migrant family members
No of Person Days
Average Daily Income (Tsh)
Wage work on migrating (farm/non-farm)
No of Person Days
Average Daily Income (Tsh)
Any Other (like rent, interest, etc.)
No of Person Days
Average Daily Income (Tsh)
Total from all Sources
No of Person Days
Average Daily Income (Tsh)
63
6. Family Expenditure (only household level, as expenditure for earning activities has been asked separately) (in ‘000 Tsh)
Jan Feb Mar Apr May Jun Jul Aug Sept Oct Nov Dec Total
Food
Liquor
Clothes and footwear
Education
Health
Rent if paid
Electricity for home
Water for home
Transport
Interest Payment
Hiring of Labour for home
Social events/entertainment
Others
Total revenue expenditure

64
7. Income Variability due to Shocks. In the last two years how many times have you faced the following? (Extent of loss in ‘000 Tsh)
No. Adverse event No of times Extent of loss Insured? (1=yes, 2=no)
a. The crop you sowed you could not harvest due to weather problems
b. The crop you sowed you could not harvest due to other problems
c. Severe fall in prices of a crop after you harvested
d. Some of the livestock owned by you died due to disease
e. A period longer than a month that you could not get any paid work
f. Illness of a family member which required his/her to stop work
g. Illness of a family member which required hospitalisation
h. Death of a family member other than due to old age
i. Fire/flood/theft in house or shop
j. Natural disaster – cyclone/earthquake/etc.
k. Any other
8. Agriculture and Farm Related Questions (This should be used only for Farmers)
8 What is the total amount of land your household owns/ cultivates on
a regular basis? (a) Quantity :
(b) Units :
Units codes 1 = hectares 2 = acres
9 How much land does your household use for agriculture (including land that is owned, rented/leased in, and borrowed, i.e., used without payment)?
(a) Quantity :
(b) Units :
10 With which source of draught power did you cultivate the most land during the past 12 months?
1 = Tractor 2 = Donkeys/Horses 3 = Cattle (cows & bulls) 4 = hand hoe / Other 5 = Not applicable/none

65
11 How do you divide agricultural work among household members and whether men and women have different responsibilities?
Codes for source of labour: 1 = Female household members 2 = Male household members 3 = Shared among male and female household members 4 = Hired labour 5 = Other 6 = Not applicable
(a) Ploughing
(b) Hoeing
(c) Planting
(d) Weeding
(e) Applying fertilizer/pesticides
(f) Irrigation
(g) Harvesting
(h) Shelling/threshing maize/beans/groundnuts/rice
(i) Post-harvest cleaning and sorting
(j) Marketing decisions (selling, transport to market, negotiating, etc.)
12 Which crops did you plant and harvest? (multiple answer possible) Season 1 Season 2 1 = Maize, 2 = Rice, 3 = Millet, 4 = Casava, 5 = Beans, 6 = Banana, 7 = Sweet Potato, 8 = Cotton, 9 = Sugar, 10 = Cashew nuts, 11 = Sunflower, 12 = Ground Nuts, 13 = Simsim, 14 = Soya 15 = Other
13 Did you intercrop this crop with another crop? 1 = Yes , 2 = No
14 How much area did you plant to this crop? (a) Quantity :
(b) Units :
(a) Quantity :
(b) Units :
1 = hectares, 2 = acres, 3 =?
15 How much did you harvest? (a) Quantity :
(b) Units :
(a) Quantity :
(b) Units :
1 = kilogrammes, 2 = 100 kg bags, 3 = 90 kg bags, 4 = 50 kg bags, 5 = metric tonnes, 7 = quintals 8 = Other ( )
16 What kind of seed have you used? 1: retained from your own production
66
2: indigenous seed, from market 3: improved/certified seed
17 How much did you spend on seed? in ‘000 Tsh
18 What quantity of chemical fertilizer from market have you used? (a) Quantity :
(b) Units :
(a) Quantity :
(b) Units :
1 = kilogrammes, 2 = 100 kg bags, 3 = 90 kg bags, 4 = 50 kg bags, 5 = quintals 6 = Other ( )
19 How much did you spend on chemical fertilizer? in ‘000 Tsh
20 What quantity of manure have you used? (a) Quantity :
(b) Units :
(a) Quantity :
(b) Units :
1 = kilogrammes, 2 = 100 kg bags, 3 = 90 kg bags, 4 = 50 kg bags, 5 = quintals 6 = Other ( )
21 How much did you spend on manure? in ‘000 Tsh
22 How many times had you used pesticide, herbicides, or any kind of spraying
0 = not used, 1 = once, 2 = twice , 3 = thrice, 4 = more than three times
23 How much did you spend on pesticide, herbicides, or any kind of spraying?
in ‘000 Tsh
24 How much did you spend on non-labor expenses incurred to plant, tend, and harvest this crop (for example, e.g., leasing land or irrigating,)?
in ‘000 Tsh
25 How many days of labor did you hire for preparing land, weeding, harvesting or any other activities for this crop?
26 Considering cash, and the value of in-kind payment, what was the total amount you paid for this labor?
in ‘000 Tsh
27 How much of the quantity that you harvested have you sold? (a) Quantity :
(b) Units :
(a) Quantity :
(b) Units:
1 = kilogrammes, 2 = 100 kg bags, 3 = 90 kg bags, 4 = 50 kg bags, 5 = metric tonnes, 7 = quintals 8 = Other
28 Did you have any difficulty selling this crop? 1 = Yes, 2 = No

67
29 What were the two most significant problems you had selling this crop?
Problems selling crop 1 = High cost of transport to market 2 = Low prices in accessible markets 3 = High market fees/taxes 4 = Poor transportation infrastructure 5 = Trade restrictions 6 = Difficult/unable to find buyer 7 = Not able to meet quality requirements of buyers 8 = Lack of price information 9 = Unpredictable prices 10 = Farmers’ organization not effective at selling your commodities 11 = Late or slow payment from buyers 12 = Other 13 = Not applicable (no other problem)
30 Did you sell within four weeks of harvest? 1 = Yes, 2 = No
31 Did you store and sell at a later date? 1 = Yes, 2 = No
32 Did you dry the commodity adequately to reduce spoilage during storage?
1 = Yes, 2 = No
33 Did you store the commodity in a structure that kept out rats, mice, and moisture?
1 = Yes, 2 = No
34 Did you treat the commodity with chemicals during storage to control insect pests?
1 = Yes, 2 = No
35 What was the main cause of loss during storage? 1 = Mould/spoilage 2 = Pests/insects 3 = Rats/mice/etc. 4 = Other animals 5 = Other 6 = Don’t know 7 = not applicable

68
36 What are the types of livestock you have? 1 = Pig 2 = Goat 3 =Cattle (Cow and Buffalo) 4 = Chickens 5 = all of them 6 = none
37 In last 12 months how much have you invested in buying new livestock? Also convert the in kind exchanges.
in ‘000 Tsh
38 What value of livestock have you sold in last 12 months? Also convert the in kind exchange.
in ‘000 Tsh
39 What is the total value of all the livestock you have? in ‘000 Tsh
40 Who provides veterinary services for your livestock? 1 = village paravet 2 = veterinary doctor 3 = Private organization 4 = NGOs 5 = Government services 6 = any other 7 = not applicable / no services
41 Did you pay for the veterinary services? 1 = yes, 2 = no
42 What kind of training have you attended /extension services have you received?
1 = input (seed, fertilizer, pesticides) supply 2 = trainings 3 = crop monitoring visits by service provider 4 = harvesting equipment supply 5 = post-harvest services 6 = market information 7 = marketing services 8 = livestock vaccination and treatment 9 = any other services 10 = not applicable

69
43 Who organized trainings/extension services for you? (multiple answers possible)
1 = National/international NGO 2 = National/local government 3 = Farmers’ organization 4 = Church 5 = Private sector service provider 6 = Other 7 = Don’t know 8 = Not applicable/no (other) organization
44 How much had you paid to avail the extension services? in ‘000 Tsh
45 Are you a member of any farmer’s group or community group? (if “NO” jump to 50 )
1 = yes, 2 = no
46 How many years are you part of this group? Number of years =
47 Does group regularly meet to discuss issues and common problems?
1 = yes, 2 = no
48 What services does this group provide (multiple choice possible) 1= Training 2= Input supply 3=Output transportation 4=Output storage 5= Output marketing 6=Output processing 7= Use of common facilities 8= Channelizes government subsidies/services 9= Provides credit 10=Other
49 Would you like to be a member of a farmers’ group which provides services (read options from 48) on a fee-basis?
1 = yes, 2 = no

Baseline Survey in Tanzania – Non-Farm Form Serial No: ______________
70
50. Gender Dimension
These question should be asked to both women and men respondents
(a) Do you feel women have control over deciding for their household what crops to grow and what animals to rear?
1 = Major role 2 = Partial Role 3 = No say
(b) Do you feel women have control over deciding for their household what expenses to make and what assets to buy?
1 = Major role 2 = Partial Role 3 = No say
(c) Do you feel women have control over deciding whether to have a baby and when to have it?
1 = Major role 2 = Partial Role 3 = No say
(d) Do you feel women are free to move around safely outside the village as they like for social or work purposes?
1 = Fully free 2 = Partially free 3 = Not free
(e) Do you feel women have more difficulty than men in engaging in either out-of-home commercial activities?
1 = More 2 = Same 3 = Less
(f) Do you feel women have more difficulty than men in engaging in or in playing a public role like joining an association of farmers?
1 = More 2 = Same 3 = Less
51. Concluding Questions:
(a) What kind of skill development do you feel will improve your income and also
the employability? (multiple answer possible)
1 = farm management and production related – existing crops 2 = learning to grow new, commercial crops 3 = livestock rearing and management –existing livestock 4= learning to rear new type of livestock 5= fishing and related 6 = primary processing of produce 7 = marketing skills 8 = operating farm equipment 9 = organic manure production 10 = organic farming methods 11 = starting business 12 = providing farm extension services 13 = providing veterinary services 14 = soil testing and other technical skills 15 = any other

Baseline Survey in Tanzania – Non-Farm Form Serial No: ______________
71
(b) What kind of financial services do you need to improve your income from your
current farm activities? (multiple answer possible)
1 = crop Loan 2 = farm equipment loan 3 = livestock loan 4 = loan for other purposes 5 = savings 6 = crop insurance 7 = health insurance for self and family 8 = remittance services 9 = pension services 10 = any other
(c) What kind of farm related support do you think will be helpful to have better
production and improve the income? (multiple answer possible)
1 = Quality input supply (seed, pesticides, fertilizer) 2 = Extension services for farm and crop management 3 = Extension services for livestock rearing and management 4 = Loan for farm equipment 5 = Loan for working capital 6 = post-harvest management and storage services 7 = local value addition 8 = marketing of produce 9 = any other services
(d) Would you like to start a business? If so which type
1 = Buying from other farmers and selling farm produce to towns 2 = Processing and selling farm produce (in village/ in town) 3 = Selling inputs bought from the town, to other farmers in village 4 = A grocery store (in village/ in town) 5 = A restaurant (in village/ in town) 6 = A mobile phone shop (in village/ in town) 7 = A workshop for repair of vehicles (in village/ in town) 8 = A school for children 9 = Migrate to big city 10 = any other

Baseline Survey in Tanzania – Non-Farm Form Serial No: ______________
72
5. Questionnaire – Non Farm
LIVELIHOOD BASELINE SURVEY QUESTIONNAIRE for the ALPs in TANZANIA
Non-Farm
Investigator’s Sheet
Form Serial : Date :
(Région/District/Division/Location S. No.)
Form Category (round it) : Y – W / Y – M / NY – W / NY - M
Name of the Réspondent :
Mobile No: Rural (1) / Urban (2):
House No: Village (R) / Area (U) :
Ward : Division:
District: Region:
Investigator Code (Please enter the code alloted to you) :
(To be filled by Investigator) Name :
Signature :
Supervisor Code (Please enter the code alloted to you) :
(To be filled by Supervisor) Name:
Signature :
Verified and approved by Code (Please enter the code alloted to you)
(To be filled by Chief Investigator) Name
Signature

Baseline Survey in Tanzania – Non-Farm Form Serial No: ______________
73
The following section has to be filled by the Data Entry Team
Data Entry Date :
Item of work: Team Member
Code Name Signature
Verified by :
Data entry by :
Quality check :

Baseline Survey in Tanzania – Non-Farm Form Serial No: ______________
74
1. Individual Information / Respondent Information
(u) Name
(v) Age:
1 = less than 25 years 2 = between 25 and 30 years 3 = more than 30 years
(w) Sex:
1 = Male 2 = Female
(x) Education: 1 = Graduate 2 = Secondary 3 = Primary 4 = not completed primary 5 = never gone to school 6 = any other
(y) Marital Status:
1 = Married 2 = Unmarried 3 = Widow 4 = Single Mother 5 = Single Father
(z) Skill Training Attended:
1 = Yes 2 = No
(aa) VETA Certification:
1 = Yes 2 = No
(bb) Do you wish to attend skill training?
1 = Yes 2 = No
(cc) Do you have a bank account?
1 = yes 2 = no
(dd) Do anyone in your family has a bank account?
1 = yes 2 = no
(ee) From which source often you borrow money?
1= from friends and relatives 2 = money lenders 3 = buyer of your produce 4 = farmers group / cooperative 5 = microfinance / NGO 6 = banks 7 = other sources 8 = never borrowed / not applicable
(ff) Why do you borrow money?
1 = to buy agriculture inputs 2 = to buy other business inputs 3 = to buy equipment 4 = to construct house 5 = for education purpose 6 = for health purpose 7 = for social events 8 = any other 9 = not applicable
(gg) How do you save money?
1 = at home 2 = borrowed to friend or relative 3 = with cooperative or any group 4 = with MFIs / NGOs 5 = banks 6 = any other places
(hh) Have you taken any insurance product for self or family?
1 = yes 2 = no
(ii) Have you taken any insurance for your business or crop?
1 = yes 2 = no
(jj) Do you receive/send money from distant places by mobile phones?
1=yes 2=no
(kk) How many male (more than 17 years) members you have in your family who work for earning?
1= four or more 2 = three 3 = two 4 = one 5 = none
(ll) How many female (more than 17 years) members you have in your family who work for earning?
1= four or more 2 = three 3 = two 4 = one 5 = none
(mm) How much land your family own?
Quantity: Unit: ( 1 = acres, 2 = hectares)

Baseline Survey in Tanzania – Non-Farm Form Serial No: ______________
75
(nn) How much land your family cultivate?
Quantity: Unit: (oo) ( 1 = acres, 2 =
hectares)
2. Family Information (PPI Questions)
(k) How many household members are 17-years-old or younger?
1= four or more 2 = three 3 = two 4 = one 5 = none
(l) Do all children ages 6 to 17 attend school?
1 = No 2 = Yes / no children ages 6 to 17
(m) Can the female head/spouse read and write?
1 = No 2 = Yes, but not in Kiswahili nor English 3 = No female head / spouse 4 = Yes, only in Kiswahili 5 = Yes, in English (regardless of others)
(n) What is the main building material of the floor of the main dwelling?
1 = Earth 2 = Concrete, cement, tiles, timber or other
(o) What is the main building material of the roof of the main dwelling?
1 = mud and grass 2 = grass, leaves, bamboo 3 = concrete, cement, metal sheets (GCI), asbestos sheets, tiles, or other
(p) How many bicycles, mopeds, motorcycles, tractors, or motor vehicles does your household own?
1 = none 2 = one 3 = two or more
(q) Does your household own any radios or radio cassettes?
1 = Yes 2 = No
(r) Does your household own any lanterns?
1 = Yes 2 = No
(s) Does your household own any irons (charcoal or electric)?
1 = Yes 2 = No
(t) How many tables does your household own?
1 = None 2 = One 3 = Two 4 = Three or more

Baseline Survey in Tanzania – Non-Farm Form Serial No: ______________
76
3. Savings (in kind) behaviour In the last two years, have you bought or sold any of these assets, and if so, how much worth?
Item/Asset Bought 1 = Yes 2 = No
Bought for Tsh (‘000)
Sold 1 = Yes 2 = No
Sold for Tsh (‘000)
Land
Livestock
Housing
Vehicles
Consumer durables
Jewellery
Other
Total

Baseline Survey in Tanzania – Non-Farm Form Serial No: ______________
77
4. Family’s non-wage income from multiple activities (all figures are in ‘000 Tsh)
Months -> Jan Feb Mar Apr May Jun Jul Aug Sep Oct Nov Dec Total
Agriculture Production
Revenue during the month (Tsh)
Expenditure during the month (Tsh)
Livestock Rearing
Revenue during the month (Tsh)
Expenditure during the month (Tsh)
Processing/ Manufacturing
Revenue during the month (Tsh)
Expenditure during the month (Tsh)
Services / Repairs
Revenue during the month (Tsh)
Expenditure during the month (Tsh)
Trading Revenue during the month (Tsh)
Expenditure during the month (Tsh)
Any Other Activities
Revenue during the month (Tsh)
Expenditure during the month (Tsh)
Total from all Activities
Revenue during the month (Tsh)
Expenditure during the month (Tsh)
Net income during the month (Tsh)
Baseline Survey in Tanzania – Non-Farm Form Serial No: ______________
78
5 Wage income from multiple sources for each working members (in ‘000 Tsh)
5. a. Male members of the family (in ‘000 Tsh)
Months -> Jan Feb Mar Apr May Jun Jul Aug Sept Oct Nov Dec Total
Wage Labour in farms/plantations
No of Person Days
Average Daily Income (Tsh)
Other Wage Labour
No of Person Days
Average Daily Income (Tsh)
Salary – part-time or full-tme
No of Person Days
Average Daily Income (Tsh)
Pensions or other government/Church payments
No of Person Days
Average Daily Income (Tsh)
Remittances from migrant family members
No of Person Days
Average Daily Income (Tsh)
Wage work on migrating (farm/non-farm)
No of Person Days
Average Daily Income (Tsh)
Any Other (like rent, interest, etc.)
No of Person Days
Average Daily Income (Tsh)
Total from all Sources
No of Person Days
Average Daily Income (Tsh)

Baseline Survey in Tanzania – Non-Farm Form Serial No: ______________
79
5. b. Female members of the family (in ‘000 Tsh)
Months -> Jan Feb Mar Apr May Jun Jul Aug Sept Oct Nov Dec Total
Wage Labour in farms/plantations
No of Person Days
Average Daily Income (Tsh)
Other Wage Labour
No of Person Days
Average Daily Income (Tsh)
Salary – part-time or full-tme
No of Person Days
Average Daily Income (Tsh)
Pensions or other government/Church payments
No of Person Days
Average Daily Income (Tsh)
Remittances from migrant family members
No of Person Days
Average Daily Income (Tsh)
Wage work on migrating (farm/non-farm)
No of Person Days
Average Daily Income (Tsh)
Any Other (like rent, interest, etc.)
No of Person Days
Average Daily Income (Tsh)
Total from all Sources
No of Person Days
Average Daily Income (Tsh)
Baseline Survey in Tanzania – Non-Farm Form Serial No: ______________
80
6. Family Expenditure (only household level, as expenditure for earning activities has been asked separately) (in ‘000 Tsh)
Jan Feb Mar Apr May Jun Jul Aug Sept Oct Nov Dec Total
Food
Liquor
Clothes and footwear
Education
Health
Rent if paid
Electricity for home
Water for home
Transport
Interest Payment
Hiring of Labour for home
Social events/entertainment
Others
Total revenue expenditure

Baseline Survey in Tanzania – Non-Farm Form Serial No: ______________
81
7. Income Variability due to Shocks (In the last two years how many times have you faced the following? (Extent of loss in ‘000 Tsh)
No. Adverse event No of times Extent of loss Insured? (1=yes, 2=no)
l. The crop you sowed you could not harvest due to weather problems
m. The crop you sowed you could not harvest due to other problems
n. Severe fall in prices of a crop after you harvested
o. Some of the livestock owned by you died due to disease
p. A period longer than a month that you could not get any paid work
q. Illness of a family member which required his/her to stop work
r. Illness of a family member which required hospitalisation
s. Death of a family member other than due to old age
t. Fire/flood/theft in house or shop
u. Natural disaster – cyclone/earthquake/etc.
v. Any other

Baseline Survey in Tanzania – Non-Farm Form Serial No: ______________
82
Non - Farm Questions
8) What product or services you produce? (see the code list separately given)
9) When did you start this enterprise? (YYYY)
10) What is the ownership arrangement?
1 = Female, one proprietor 2 = Male, one proprietor 3 = Multiple proprietors-husband and wife 4 = Multiple proprietors - blood relatives 5 = Multiple proprietors - non-family 6 = Other
11) What kind of problems the enterprise face? (multiple answers possible)
1 = Access to finance 2 = Quality input supply 3 = Availability of new technology / machinery / tools 4 = Marketing / selling related issues 5 = Unavailability of proper technical and managerial guidance 6 = Labour issues (both quality and quantity) 7 = Regulatory / Licencing / Tax issues
12) Sales of Goods and Services over the last 12 months
2012 -2013 Did this enterprise have sales this month? 1 = Yes 0 = No
What is your estimate of the approximate value of sales during each of these months? (think in terms of summing over all days worked in each of these months) (in ‘000 TSh)
Total value of goods and services sold over 12 months (Total Revenue in ‘000 TSh)
Jun,2013
May,2013
Apr,2013
Mar,2013
Feb,2013
Jan,2013
Dec,2012
Nov,2012
Oct,2012
Sept,2012
Aug,2012
July,2012

Baseline Survey in Tanzania – Non-Farm Form Serial No: ______________
83
13) Expenditure for manufacturing or provisioning of services for past 12 months (in ‘000 TSh)
Jun May Apr Mar Feb Jan Dec Nov Oct Sept Aug July Total
Input / Raw Material
Labour
Transport
Rent
Taxes/Fees
Interest Payment
Repairs
Water
Fuel (if any)
Electricity / Energy
Other Expenses
Monthly Expenses (TSh)
Total Yearly Expenditure (in ‘000 TSh):
14) Net Income of the Enterprise in (in ‘000 TSh):
Baseline Survey in Tanzania – Non-Farm Form Serial No: ______________
84
15) Present Value of the business / enterprise (in ‘000 TSh)
Items The value of today (in ‘000 TSh)
Raw Material
Furniture / Fittings
Machinery / Equipment
Hand tools
Infrastructure (if owned by the proprietor)
Land (if owned by proprietor and used in the business)
Stored Outputs
Total Value of the Business
16) Did you acquire any skills through formal training that contribute to your ability to operate this business?
1 = yes 2 = no
17) Did this enterprise receive any kind of non-financial business development services?
1 = yes 2 = no
18) What kind of non-financial business development services did this enterprise receive? (multiple answers possible)
1 = Management training 2 = Technical advice and training 3 = Marketing assistance 4 = Informal advice/training assistance 5 = Other types of Non-Financial assistance
19) What type(s) of non-financial business development services would you like to receive? (multiple answers possible)
20) Do you (the owner) belong to any business support group or informal business network such as a women’s group, trade association, and cooperative, or informal business group? (if “NO” jump to 23)
1 = yes 2 = no
21) Have you (the owner) received any benefits from such membership?
1 = yes 2 = no
22) What type(s) of benefits did you (the owner) receive from such membership?
1 = Exchange of information 2 = Purchased inputs jointly 3 = Sold output jointly 4 = Received credit through association/group 5 = Access to Non-financial assistance 6 = Worked together

Baseline Survey in Tanzania – Non-Farm Form Serial No: ______________
85
23) Has this enterprise have received any type of credit for operating and/or investment purposes? (if “NO” jump to 25)
1 = yes 2 = no
24) From which source you received credit?
1 = loan from family and friends 2 = money lenders 3 = buyer of your produce 4 = credit group / cooperative 5 = microfinance / NGO 6 = banks 7 = other sources
25. Gender Dimension
These question should be asked to both women and men respondents
(g) Do you feel women have control over deciding for their household what crops to grow and what animals to rear?
1 = Major role 2 = Partial Role 3 = No say
(h) Do you feel women have control over deciding for their household what expenses to make and what assets to buy?
1 = Major role 2 = Partial Role 3 = No say
(i) Do you feel women have control over deciding whether to have a baby and when to have it?
1 = Major role 2 = Partial Role 3 = No say
(j) Do you feel women are free to move around safely outside the village as they like for social or work purposes?
1 = Fully free 2 = Partially free 3 = Not free
(k) Do you feel women have more difficulty than men in engaging in either out-of-home commercial activities?
1 = More 2 = Same 3 = Less
(l) Do you feel women have more difficulty than men in engaging in or in playing a public role like joining an association of farmers?
1 = More 2 = Same 3 = Less

Baseline Survey in Tanzania – Non-Farm Form Serial No: ______________
86
26. Concluding Questions:
(e) What kind of skill development do you feel will improve your income and also
the employability? (multiple answer possible)
1 = production related 2 = processing of produce 3 = marketing skills 4 = operating equipment 5 = starting business 6 = risk management 7 = franchising 8 = any other
(f) What kind of financial services do you need to improve your income from your
current farm activities? (multiple answer possible)
1 = enterprise Loan 2 = equipment loan 3 = loan for other purposes 4 = savings 5 = enterprise insurance 6 = health insurance for self and family 7 = remittance services 8 = pension services
(g) What kind of farm related support do you think will be helpful to have better
production and improve the income? (multiple answer possible)
1 = Quality input / raw material supply 2 = advisory services for business improvement 3 = output management, packaging and storage services 4 = local value addition 5 = marketing of produce 6 = any other services 7 = not applicable / don’t want
Baseline Survey in Tanzania – Non-Farm Form Serial No: ______________
87
(h) Would you like to start a business? If so which type
1 = Buying from others and selling produce to towns 2 = Processing and selling (in village/ in town) 3 = Selling inputs bought from the town, to others 4 = A grocery store (in village/ in town) 5 = A restaurant (in village/ in town) 6 = A mobile phone shop (in village/ in town) 7 = A workshop for repair of vehicles (in village/ in town) 8 = A school for children 9 = Migrate to big city 10 = any other