LiveBench-6: Large-Scale Automated Evaluation of Protein...
6
LiveBench-6: Large-Scale Automated Evaluation of Protein Structure Prediction Servers Leszek Rychlewski, 1 * Daniel Fischer, 2 and Arne Elofsson 3 1 Bioinformatics Laboratory, BioInfoBank Institute, Poznan, Poland 2 Bioinformatics, Department of Computer Science, Ben Gurion University, Beer-Sheva, Israel 3 Stockholm Bioinformatics Center, Stockholm University, Stockholm, Sweden ABSTRACT The aim of the LiveBench experi- ment is to provide a continuous evaluation of struc- ture prediction servers in order to inform potential users about the current state-of-the-art structure prediction tools and in order to help the developers to analyze and improve the services. This round of the experiment was conducted in parallel to the blind CAFASP-3 evaluation experiment. The data collected almost simultaneously enables the com- parison of servers on two different benchmark sets. The number of servers has doubled from the last evaluated LiveBench-4 experiment completed in April 2002, just before the beginning of CAFASP-3. This can be partially attributed to the rapid develop- ment in the area of meta-predictors (consensus servers). The current results confirm the high sensi- tivity and specificity of the meta-predictors. Never- theless, the comparison between the autonomous (not meta) servers participating in the last CAF- ASP-2 and LiveBench-2 experiment and the current set of autonomous servers demonstrates that progress has been made also in sequence structure fitting functions. In addition to the growing number of participants, the current experiment marks the introduction of new evaluation procedures, which are aimed to correlate better with functional charac- teristics of models. Proteins 2003;53:542–547. © 2003 Wiley-Liss, Inc. Key words: protein structure prediction; consensus fold recognition; CAFASP; Meta-Server; ToolShop; LiveBench INTRODUCTION LiveBench belongs to a group of community-wide pro- tein structure prediction evaluation programs, which in- cludes CASP, 1 CAFASP 2 and EVA. 3 These programs have a common goal to assess the current accuracy of structure prediction approaches, but differ in procedural details. CASP and CAFASP evaluate blind predictions, operating on targets, which don’t have a known structure at the time the prediction is being made. LiveBench evaluates only fully automated fold recognition methods and uses protein structures freshly released in the PDB 4 . Only non-trivial PDB entries are used as targets (we define a non-trivial target as one that does not exhibit strong sequence similar- ity to other previously known structures, as measured by Blast using an E-value cutoff of 0.001). Circa 5 new proteins extracted weekly from the PDB result in a set of over 100 non-trivial targets submitted in 6 months. The collected predictions are evaluated automatically and the summaries of the performance of participating servers are updated continuously and available at the homepage of the program http://BioInfo.PL/LiveBench/. The final summary presented in this manuscript is based on 98 targets submitted between August and December of 2002. MATERIALS AND METHODS The CASP experiment is known to change the evalua- tion procedure with every new biannual session in a search for a single “best” scoring protocol. The LiveBench experi- ment is no exception to this practice. This round 5 new evaluation methods were introduced, which are added to the 4 used previously (MaxSub, 5 two LGscore 6 versions and Touch). 7 The selection of the new methods is the result of a struggle to find objective criteria for comparing evaluation procedures. The rationale behind the selection relates to the purpose of using structure prediction meth- ods by biologists. In most of the cases the user is interested in the function of the target protein. The structure predic- tion is used as a guide to restrict the set of potential functions of the target, by analyzing the functions found in proteins, which share the predicted fold. One of the possibilities to use this query as an evaluation criteria for fold recognition methods would be to ask if the predicted structure modeled based on a template share the same functional / structural class as the target. We have chosen the SCOP 8 database as the standard of truth for this task, as it is known to be biased towards functional and evolu- tionary properties of the proteins. There are three major drawbacks of this evaluation procedure. First, servers that do not use templates for structure prediction (e.g. ab initio servers) cannot be evaluated based on the functional or structural similarity between the template and the target. Second, this evalua- tion method ignores the accuracy of the alignment, which Grant sponsor: Swedish Strategic Research Foundation; Grant sponsor: Carl Trygger Foundation; Grant sponsor: Swedish National Research Council. *Correspondence to: Leszek Rychlewski, Bioinformatics Labora- tory, BioInfoBank Institute, ul. Limanowskiego 24A, 60-744 Poznan, Poland. E-mail: [email protected] Received 17 February 2003; Accepted 15 May 2003 PROTEINS: Structure, Function, and Genetics 53:542–547 (2003) © 2003 WILEY-LISS, INC.
Transcript of LiveBench-6: Large-Scale Automated Evaluation of Protein...
LiveBench-6: Large-Scale Automated Evaluation of ProteinStructure Prediction ServersLeszek Rychlewski,1* Daniel Fischer,2 and Arne Elofsson3
1Bioinformatics Laboratory, BioInfoBank Institute, Poznan, Poland2Bioinformatics, Department of Computer Science, Ben Gurion University, Beer-Sheva, Israel3Stockholm Bioinformatics Center, Stockholm University, Stockholm, Sweden
ABSTRACT The aim of the LiveBench experi-ment is to provide a continuous evaluation of struc-ture prediction servers in order to inform potentialusers about the current state-of-the-art structureprediction tools and in order to help the developersto analyze and improve the services. This round ofthe experiment was conducted in parallel to theblind CAFASP-3 evaluation experiment. The datacollected almost simultaneously enables the com-parison of servers on two different benchmark sets.The number of servers has doubled from the lastevaluated LiveBench-4 experiment completed inApril 2002, just before the beginning of CAFASP-3.This can be partially attributed to the rapid develop-ment in the area of meta-predictors (consensusservers). The current results confirm the high sensi-tivity and specificity of the meta-predictors. Never-theless, the comparison between the autonomous(not meta) servers participating in the last CAF-ASP-2 and LiveBench-2 experiment and the currentset of autonomous servers demonstrates thatprogress has been made also in sequence structurefitting functions. In addition to the growing numberof participants, the current experiment marks theintroduction of new evaluation procedures, whichare aimed to correlate better with functional charac-teristics of models. Proteins 2003;53:542–547.© 2003 Wiley-Liss, Inc.
Key words: protein structure prediction; consensusfold recognition; CAFASP; Meta-Server;ToolShop; LiveBench
INTRODUCTION
LiveBench belongs to a group of community-wide pro-tein structure prediction evaluation programs, which in-cludes CASP,1 CAFASP2 and EVA.3 These programs havea common goal to assess the current accuracy of structureprediction approaches, but differ in procedural details.CASP and CAFASP evaluate blind predictions, operatingon targets, which don’t have a known structure at the timethe prediction is being made. LiveBench evaluates onlyfully automated fold recognition methods and uses proteinstructures freshly released in the PDB4. Only non-trivialPDB entries are used as targets (we define a non-trivialtarget as one that does not exhibit strong sequence similar-ity to other previously known structures, as measured byBlast using an E-value cutoff of 0.001). Circa 5 new
proteins extracted weekly from the PDB result in a set ofover 100 non-trivial targets submitted in 6 months. Thecollected predictions are evaluated automatically and thesummaries of the performance of participating servers areupdated continuously and available at the homepage of theprogram http://BioInfo.PL/LiveBench/. The final summarypresented in this manuscript is based on 98 targetssubmitted between August and December of 2002.
MATERIALS AND METHODS
The CASP experiment is known to change the evalua-tion procedure with every new biannual session in a searchfor a single “best” scoring protocol. The LiveBench experi-ment is no exception to this practice. This round 5 newevaluation methods were introduced, which are added tothe 4 used previously (MaxSub,5 two LGscore6 versionsand Touch).7 The selection of the new methods is the resultof a struggle to find objective criteria for comparingevaluation procedures. The rationale behind the selectionrelates to the purpose of using structure prediction meth-ods by biologists. In most of the cases the user is interestedin the function of the target protein. The structure predic-tion is used as a guide to restrict the set of potentialfunctions of the target, by analyzing the functions found inproteins, which share the predicted fold. One of thepossibilities to use this query as an evaluation criteria forfold recognition methods would be to ask if the predictedstructure modeled based on a template share the samefunctional / structural class as the target. We have chosenthe SCOP8 database as the standard of truth for this task,as it is known to be biased towards functional and evolu-tionary properties of the proteins.
There are three major drawbacks of this evaluationprocedure. First, servers that do not use templates forstructure prediction (e.g. ab initio servers) cannot beevaluated based on the functional or structural similaritybetween the template and the target. Second, this evalua-tion method ignores the accuracy of the alignment, which
Grant sponsor: Swedish Strategic Research Foundation; Grantsponsor: Carl Trygger Foundation; Grant sponsor: Swedish NationalResearch Council.
*Correspondence to: Leszek Rychlewski, Bioinformatics Labora-tory, BioInfoBank Institute, ul. Limanowskiego 24A, 60-744 Poznan,Poland. E-mail: [email protected]
Received 17 February 2003; Accepted 15 May 2003
PROTEINS: Structure, Function, and Genetics 53:542–547 (2003)
© 2003 WILEY-LISS, INC.

is often crucial for the confirmation of the predictedfunction (for example through comparison of aligned activesite residues). Third, the assessment would be delayed asthe SCOP classification of all new targets and templateshas to be performed before the results can be evaluated. Asa compromise we have asked the question, which of thestandard model quality assessment methods correlate bestwith the SCOP similarity between the template and thetarget (Fig. 1). To our surprise very good correlation can beobtained with a simple measure, which scores modelsbased on the number of residues that can be superimposedon the native structure within 3Å (“residues” in Figure 1).
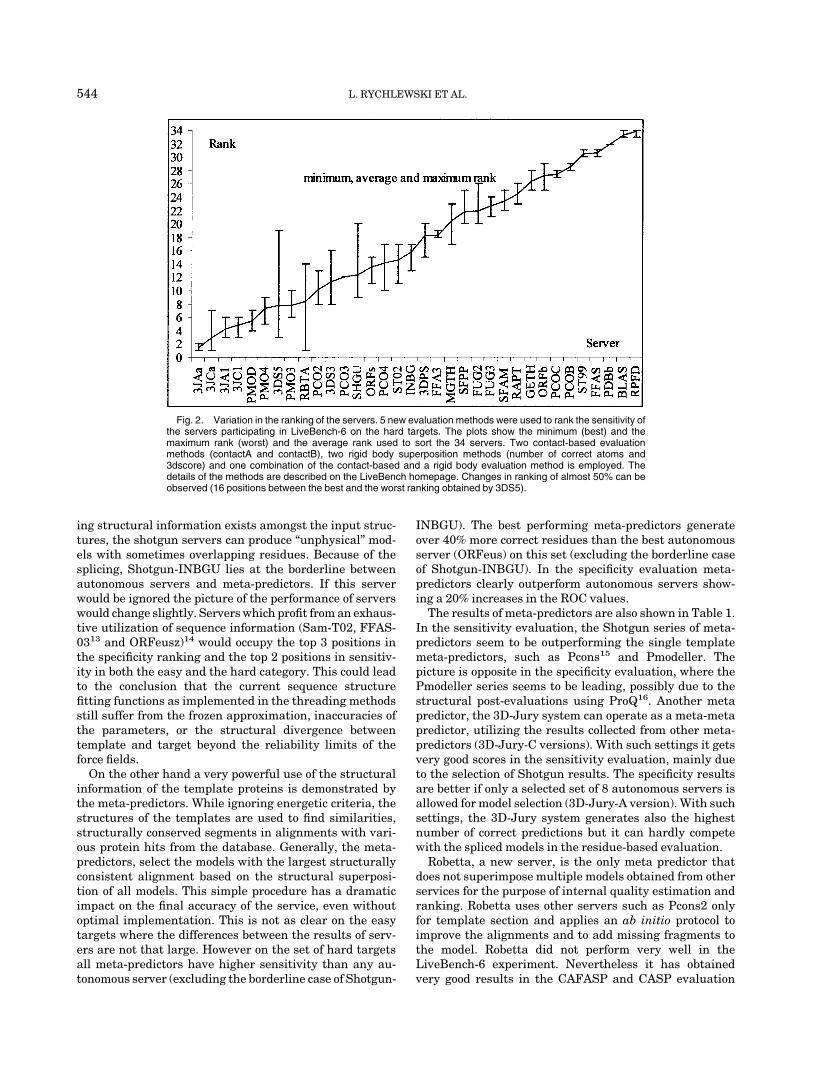
Because of these results we will focus in this manuscriptmainly on the analysis of methods evaluated using the“residues” measure. Results obtained using other mea-sures are available from the accompanying website and acomparison of the ranking using 5 measures is shown inFigure 2. For the “residues” measures we have chosen thecutoff of 40 correct residues to define a correct model.Models that have more correctly positioned residues havea 90% chance that the corresponding template belongs tothe same SCOP fold as the target (data not shown). Amodel, which has less than 30 correct residues, is definedas wrong. Models with between 30 and 40 correct residuesare borderline models and we exclude them from thespecificity analysis, for which wrong models have to bedefined (see below).
9 sequence comparison servers, 12 fold recognition serv-ers (servers which use the structural information of thetemplate) and 13 versions of meta-predictors (servers,which use other servers as main knowledge base) areevaluated here. Information about the servers and theircorresponding abbreviations are available on the Live-Bench pages (http://bioinfo.pl/Meta/servers.html). Thequery sequences were divided into 32 easy and 66 hardtargets based on the e-value of the first hit reported byPDB-Blast. If the e-value is below 0.001 the target isdefined as easy. The main sensitivity ranking was calcu-lated using the sum of correctly positioned residues for allcorrect models. This is a different procedure than theZ-score based procedures used frequently by the CASPassessors. The main difference is that in LiveBench miss-ing models or wrong predictions are heavily penalized anddo not obtain a minimum Z-score of zero as in CASP. Alsothe Z-score based assessment gives disproportional manypoints to correct “outliers” which are wrong but muchbetter than other models for a given target. Often (in thedifficult fold recognition category) the distribution of com-pletely wrong models would be used as a reference distribu-tion. From the users point of view such “outliers” are verydifficult to use or validate and should not obtain additionalpoints from the fact that other methods failed completely.The LiveBench scoring is proportional to the quality of themodels (defined for example as the number of correctresidues) and does not depend on the performance of othermethods (in contrast to the application of Z-scores). Thiscould also help in the global analysis of the progress in thefield.
RESULTS
Table 1 shows the sensitivity of the participating serv-ers, measured as the total number of correctly positionedresidues in correct models, separated into the easy andhard category. The best autonomous server performance isreported for the Sam-T029server on the easy targets, andfor Shotgun-INGBU10 on the hard targets. If only thenumber of correctly predicted targets is taken into ac-count, the top ranking of the Shotgun-INBGU method isconfirmed in the hard category, while the results are tooclose in the easy category to distinguish the servers.
Table 1 shows also the specificity evaluation of theservers. The Specificity is defined as in previous Live-Bench-4 experiment, as the average number of correctpredictions with higher confidence score than the first totenth false predictions (similar to the Receiver OperatorCharacteristics11 for the first 10 targets). Here the rankingof the autonomous servers is lead by the Shotgun-INBGUmethod.
The Shotgun-INBGU server uses a meta-predictor layeron top of the 5 prediction components of the originalINBGU.12 The new layer shows much better predictionperformance than the original procedure implemented inINBGU to rank all generated models. A feature of theShotgun servers is that they assemble hybrid models bysplicing fragments from different templates. The maindisadvantage is that for the hardest targets, where conflict-
Fig. 1. Simple measures like “residues” perform as well as othermeasures. ROC plot of the similarity between model assessment meth-ods and SCOP classification of the target and the template. Modelscollected in LiveBench-2 and LiveBench-4 for targets larger than 70amino acids with templates classified in SCOP version 1.61 are sortedaccording to their quality assessed using 7 different sequence-dependent(alignment-dependent) procedures. The x-axis shows the ten first modelsbased on templates with different SCOP fold class than the target (falsepositives). The y-axis sums the models with correct (identical) SCOP-foldclassification (correct positives). Even the very simple and intuitiveevaluation method based on the number of correctly positioned residues(“residues”) shows relatively a very good agreement with the SCOPclassification. Two other methods introduced on the LiveBench pages(“contactA” and “contactB”), which are based on the analysis of distancesbetween contacting residues are also plotted. A more detailed descriptionof the methods can be found at the LiveBench pages:http://bioinfo.pl/Meta/evaluation.html.
LIVEBENCH-6 543
ing structural information exists amongst the input struc-tures, the shotgun servers can produce “unphysical” mod-els with sometimes overlapping residues. Because of thesplicing, Shotgun-INBGU lies at the borderline betweenautonomous servers and meta-predictors. If this serverwould be ignored the picture of the performance of serverswould change slightly. Servers which profit from an exhaus-tive utilization of sequence information (Sam-T02, FFAS-0313 and ORFeusz)14 would occupy the top 3 positions inthe specificity ranking and the top 2 positions in sensitiv-ity in both the easy and the hard category. This could leadto the conclusion that the current sequence structurefitting functions as implemented in the threading methodsstill suffer from the frozen approximation, inaccuracies ofthe parameters, or the structural divergence betweentemplate and target beyond the reliability limits of theforce fields.
On the other hand a very powerful use of the structuralinformation of the template proteins is demonstrated bythe meta-predictors. While ignoring energetic criteria, thestructures of the templates are used to find similarities,structurally conserved segments in alignments with vari-ous protein hits from the database. Generally, the meta-predictors, select the models with the largest structurallyconsistent alignment based on the structural superposi-tion of all models. This simple procedure has a dramaticimpact on the final accuracy of the service, even withoutoptimal implementation. This is not as clear on the easytargets where the differences between the results of serv-ers are not that large. However on the set of hard targetsall meta-predictors have higher sensitivity than any au-tonomous server (excluding the borderline case of Shotgun-
INBGU). The best performing meta-predictors generateover 40% more correct residues than the best autonomousserver (ORFeus) on this set (excluding the borderline caseof Shotgun-INBGU). In the specificity evaluation meta-predictors clearly outperform autonomous servers show-ing a 20% increases in the ROC values.
The results of meta-predictors are also shown in Table 1.In the sensitivity evaluation, the Shotgun series of meta-predictors seem to be outperforming the single templatemeta-predictors, such as Pcons15 and Pmodeller. Thepicture is opposite in the specificity evaluation, where thePmodeller series seems to be leading, possibly due to thestructural post-evaluations using ProQ16. Another metapredictor, the 3D-Jury system can operate as a meta-metapredictor, utilizing the results collected from other meta-predictors (3D-Jury-C versions). With such settings it getsvery good scores in the sensitivity evaluation, mainly dueto the selection of Shotgun results. The specificity resultsare better if only a selected set of 8 autonomous servers isallowed for model selection (3D-Jury-A version). With suchsettings, the 3D-Jury system generates also the highestnumber of correct predictions but it can hardly competewith the spliced models in the residue-based evaluation.
Robetta, a new server, is the only meta predictor thatdoes not superimpose multiple models obtained from otherservices for the purpose of internal quality estimation andranking. Robetta uses other servers such as Pcons2 onlyfor template section and applies an ab initio protocol toimprove the alignments and to add missing fragments tothe model. Robetta did not perform very well in theLiveBench-6 experiment. Nevertheless it has obtainedvery good results in the CAFASP and CASP evaluation
Fig. 2. Variation in the ranking of the servers. 5 new evaluation methods were used to rank the sensitivity ofthe servers participating in LiveBench-6 on the hard targets. The plots show the minimum (best) and themaximum rank (worst) and the average rank used to sort the 34 servers. Two contact-based evaluationmethods (contactA and contactB), two rigid body superposition methods (number of correct atoms and3dscore) and one combination of the contact-based and a rigid body evaluation method is employed. Thedetails of the methods are described on the LiveBench homepage. Changes in ranking of almost 50% can beobserved (16 positions between the best and the worst ranking obtained by 3DS5).
544 L. RYCHLEWSKI ET AL.
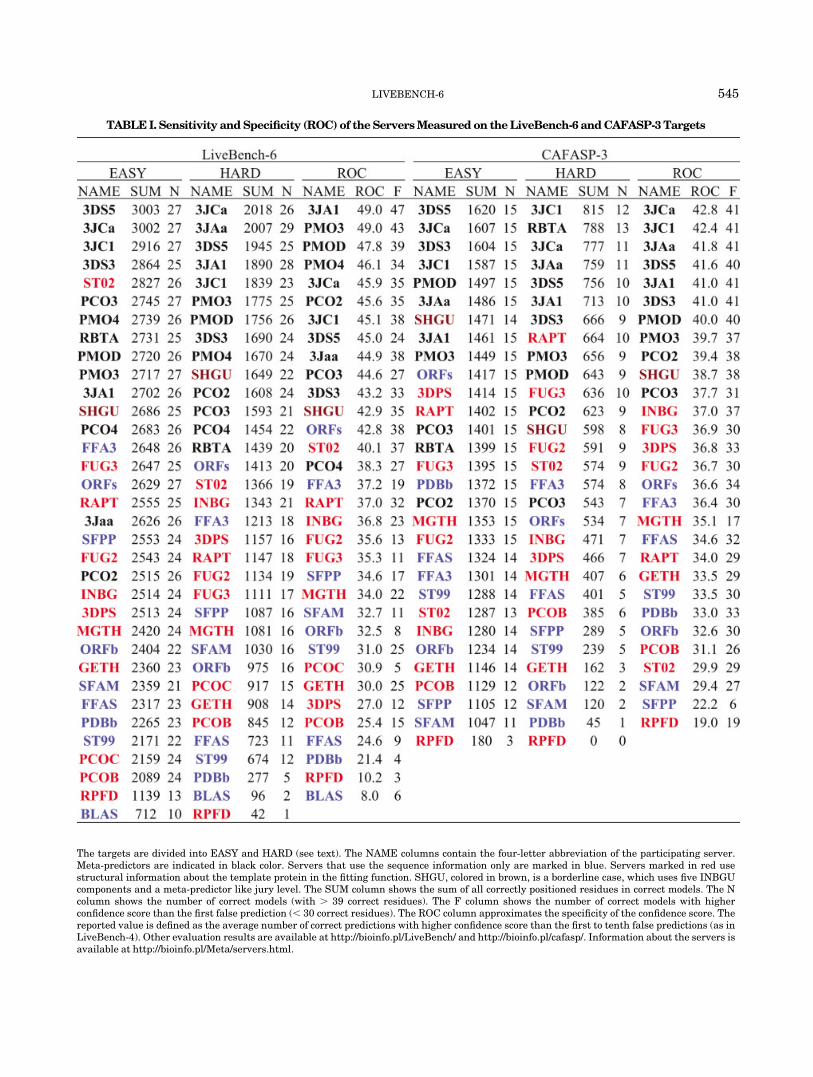
TABLE I. Sensitivity and Specificity (ROC) of the Servers Measured on the LiveBench-6 and CAFASP-3 Targets
The targets are divided into EASY and HARD (see text). The NAME columns contain the four-letter abbreviation of the participating server.Meta-predictors are indicated in black color. Servers that use the sequence information only are marked in blue. Servers marked in red usestructural information about the template protein in the fitting function. SHGU, colored in brown, is a borderline case, which uses five INBGUcomponents and a meta-predictor like jury level. The SUM column shows the sum of all correctly positioned residues in correct models. The Ncolumn shows the number of correct models (with � 39 correct residues). The F column shows the number of correct models with higherconfidence score than the first false prediction (� 30 correct residues). The ROC column approximates the specificity of the confidence score. Thereported value is defined as the average number of correct predictions with higher confidence score than the first to tenth false predictions (as inLiveBench-4). Other evaluation results are available at http://bioinfo.pl/LiveBench/ and http://bioinfo.pl/cafasp/. Information about the servers isavailable at http://bioinfo.pl/Meta/servers.html.
LIVEBENCH-6 545

(Table 1). Table 1 includes the ranking of servers, whichwould be obtained if the current LiveBench evaluationwould be conducted on the results collected for the CASP-5/CAFASP-3 targets. There are some differences betweenboth sets of targets. The CASP team divides the targetsinto domains and the classification into easy, hard andother categories is defined on the domain level. Theranking on the hard targets corresponds to the resultsobtained on domains classified in CASP in the fold recogni-tion category. The easy targets correspond to CASP com-parative modeling domains excluding those, which couldbe predicted by blast (blast E-value cutoff of 0.001 wasused as in regular LiveBench). The targets from the CASPnew fold category are also excluded. The specificity analy-sis is conducted on the results collected for full targetsproteins (not domains) because the reliability scores re-ported by servers relate to one single target and not toparts of it.
CONCLUSIONS AND DISCUSSION
As mentioned earlier Table 1 shows quite big variationsin the ranking of some methods. For example RAPTOR17
did not perform as well in the sensitivity analysis on theLiveBench set as it did on the CASP set, where it scored ashigh as some of the meta-servers in the fold recognitionsensitivity analysis. Figure 2 shows how the sensitivityranking on hard targets is affected by the choice of themodel evaluation methods. The data indicates that theranking is very flexible even if the performance is mea-sured on the same set of targets. Particular large variationcan be seen in the methods that use fragment basedapproaches, i.e. ShotGun and ROBETTA.18 Thus thebenchmarking experiments have more in common withOlympic games than with detailed investigations of theutility of prediction modules introduced in current foldrecognition strategies.
Nevertheless some conclusions can be drawn from theresults. An obvious conclusion is the confirmation thatmeta-predictors, even if being quite early in the develop-ment, provide more reliable access to structure predictionsthan autonomous servers. One of the reasons could be verytechnical. Many autonomous servers are likely to miss one
or two predictions because missing templates in their folddatabase or because of peculiarities of their scoring func-tion. Meta predictors will locate and ignore those resultfiles easily. However, it is clear from earlier studies(Lundstrom, et al 2000) and the improved performance ofShotgun-INBGU over INBGU that this is not the mainreason for the improvement. The main reason for theimproved specificity is due to the “consensus” analysisperformed by all the meta-server methods. The secondimportant conclusion is that there is progress in thedevelopment of autonomous servers despite the “parasitic”nature of the meta-predictors. This can be evaluated bestwhen comparing old and new version of servers from thesame family on the same set of targets (Table 2).
LiveBench clearly fails to declare winners and losers ofthe structure prediction server community and it is not ourintention to change this. The program operates more like aperiodic customer report watched mainly by the partici-pants, who use the data to trace procedural errors in theirprediction algorithms. One of the main conclusions of thefirst LiveBench cycles was that the completeness of thefold library is an important factor severely influencing theoutcome of the evaluation results. Nevertheless, it isunderstandable that not all algorithm developers spendtime with routine database updates, which cannot beregarded as scientifically challenging. This is especiallytrue now when such errors can be partially fixed bymeta-predictors, which diversify the sources of models.The future focus may shift from providing complete struc-ture prediction solution to specialized services. In additionto the popular meta-predictors, such services could includeloop modeling servers or model quality estimation servers,which would be clearly of benefit for the users. TheLiveBench program will continue providing useful train-ing data for such projects.
ACKNOWLEDGMENTS
This work is not supported by the Polish State Commit-tee for Scientific Research. AE was supported by grantsfrom the Swedish Strategic research foundation, the CarlTrygger foundation and the Swedish national researchcouncil. We would also like to thank all developers of
TABLE II. Progress in the Field of Automated Protein Structure Prediction Measured by the Difference Between thePerformance in LiveBench-6 of the Old (the OLD column) and the New (the NEW column) Versions of the Servers
OLD NEW
EASY HARD ROC
�SUM �N �SUM �N �ROC �F
ST99 ST02 656 4 692 7 9.1 12FFAS FFA3 331 3 490 7 12.6 10INBG SHGU 172 1 306 1 6.1 12SFAM SFPP 194 3 57 0 1.9 6PCOB PCOC 70 0 72 3 5.5 �10AVERAGE 285 2 323 4 7 6
Five pairs of servers are shown. The values are directly extracted from the values presented in Table I. �SUM shows the difference in the totalnumber of correctly positioned residues in correct models. �N shows the difference in the number of correct models. Columns �SUM and �N areseparated in EASY and HARD targets as in Table I. �ROC shows the difference in the specificity (ROC) score. �F shows the difference betweenthe numbers of correct models with higher confidence than the first false prediction. The average differences are shown in the bottom row(AVERAGE). Sam-T02 shows the biggest progress relative to its predecessor.
546 L. RYCHLEWSKI ET AL.

protein structure prediction servers who participate in theLiveBench program.
REFERENCES
1. Moult J, Fidelis K, Zemla A, Hubbard T. Critical assessment ofmethods of protein structure prediction (CASP): Round IV. Pro-teins 2001;45 Suppl 5:2–7.
2. Fischer D, Elofsson A, Rychlewski L, Pazos F, Valencia A, Rost B,Ortiz AR, Dunbrack RL, Jr. CAFASP2: The second critical assess-ment of fully automated structure prediction methods. Proteins2001;45 Suppl 5:171–183.
3. Eyrich VA, Marti-Renom MA, Przybylski D, Madhusudhan MS,Fiser A, Pazos F, Valencia A, Sali A, Rost B. EVA: continuousautomatic evaluation of protein structure prediction servers.Bioinformatics 2001;17:1242–1243.
4. Berman HM, Battistuz T, Bhat TN, Bluhm WF, Bourne PE,Burkhardt K, Feng Z, Gilliland GL, Iype L, Jain S, Fagan P,Marvin J, Padilla D, Ravichandran V, Schneider B, Thanki N,Weissig H, Westbrook JD, Zardecki C. The Protein Data Bank.Acta Crystallogr D Biol Crystallogr 2002;58:899–907.
5. Siew N, Elofsson A, Rychlewski L, Fischer D. MaxSub: anautomated measure for the assessment of protein structure predic-tion quality. Bioinformatics 2000;16:776–785.
6. Cristobal S, Zemla A, Fischer D, Rychlewski L, Elofsson A. A studyof quality measures for protein threading models. BMC Bioinfor-matics 2001;2:5.
7. Bujnicki JM, Elofsson A, Fischer D, Rychlewski L. LiveBench-2:Large-scale automated evaluation of protein structure predictionservers. Proteins 2001;45 Suppl 5:184–191.
8. LoConte L., Ailey B, Hubbard TJ, Brenner SE, Murzin AG,
Chothia C. SCOP: a structural classification of proteins database.Nucleic Acids Res 2000;28:257–259.
9. Karplus K, Karchin R, Barrett C, Tu S, Cline M, Diekhans M, GrateL, Casper J, Hughey R. What is the value added by human interven-tion in protein structure prediction? Proteins 2001;Suppl 5:86–91.
10. Fischer D. 3D-SHOTGUN: A Novel, Cooperative, Fold-Recogni-tion Meta-Predictor. Proteins 2003;51:434–441
11. Swets JA, Dawes RM, Monahan J. Better decisions throughscience. Sci Am 2000;283:82–87.
12. Fischer D. Hybrid fold recognition: combining sequence derivedproperties with evolutionary information. Pac Symp Biocomput2000;119–130.
13. Rychlewski L, Jaroszewski L, Li W, Godzik A. Comparison ofsequence profiles. Strategies for structural predictions usingsequence information. Protein Sci 2000;9:232–241.
14. Pas J, Wyrwicz LS, Grotthuss M, Bujnicki JM, Ginalski K,Rychlewski L. ORFeus: Detection of distant homology usingsequence profiles and predicted secondary structure. NucleicAcids Res 2003;
15. Lundstrom J, Rychlewski L, Bujnicki J, Elofsson A. Pcons: Aneural-network-based consensus predictor that improves foldrecognition. Protein Sci 2001;10:2354–2362.
16. Wallner B, Elofsson A. Can correct protein models be identified?Protein Science 2003; Forthcoming.
17. Xu J, Li M, Lin.G., Xu Y, Kim D. Protein Threading By LinearProgramming. Pac Symp Biocomput 2003;
18. Simons KT, Kooperberg C, Huang E, Baker D. Assembly of proteintertiary structures from fragments with similar local sequencesusing simulated annealing and Bayesian scoring functions. J MolBiol 1997;268:209–225.
LIVEBENCH-6 547