Live-ex FULL - Copy.1 - d17y2m6uappuyy.cloudfront.net 2014 - Introduction... · Unlike 2008, there...
12
SPRING 2015 Not for general circulation BORDEAUX 2014 A price guide for Liv-ex members
Transcript of Live-ex FULL - Copy.1 - d17y2m6uappuyy.cloudfront.net 2014 - Introduction... · Unlike 2008, there...
SPRING 2015
Not for general circulation
BORDEAUX 2014
A price guide for Liv-ex members

1
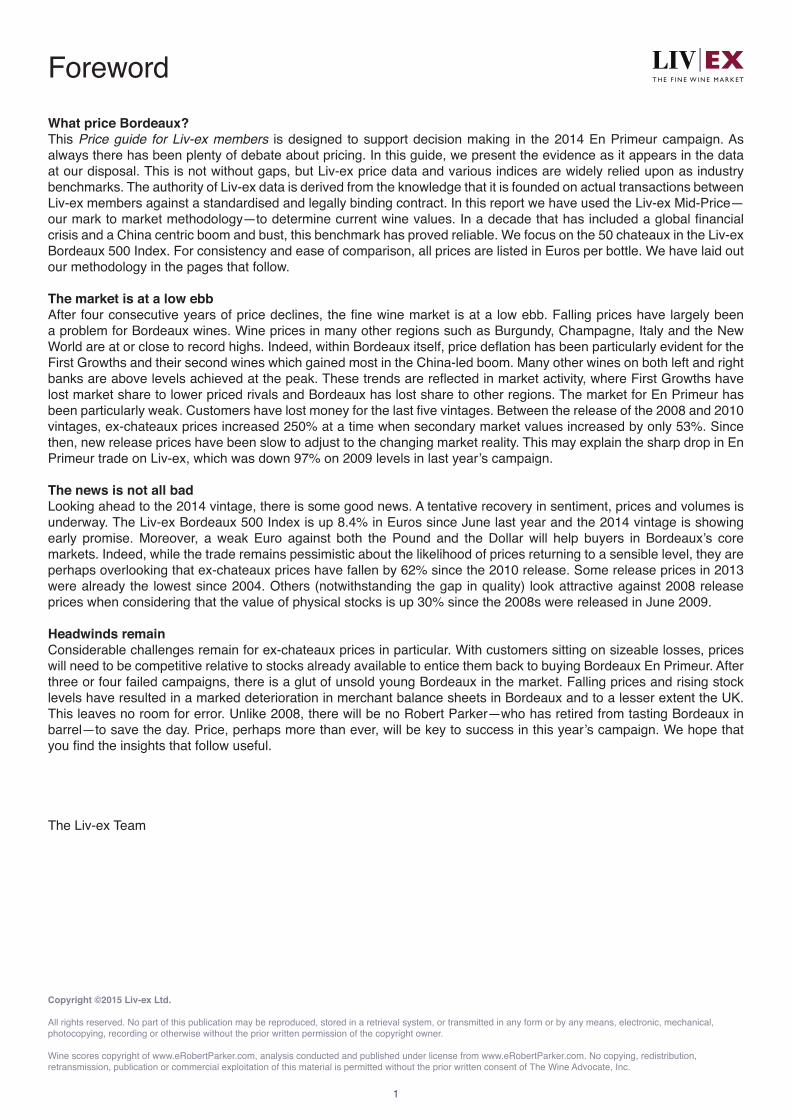
ForewordWhat price Bordeaux?This Price guide for Liv-ex members is designed to support decision making in the 2014 En Primeur campaign. As always there has been plenty of debate about pricing. In this guide, we present the evidence as it appears in the data at our disposal. This is not without gaps, but Liv-ex price data and various indices are widely relied upon as industry benchmarks. The authority of Liv-ex data is derived from the knowledge that it is founded on actual transactions between Liv-ex members against a standardised and legally binding contract. In this report we have used the Liv-ex Mid-Price—our mark to market methodology—to determine current wine values. In a decade that has included a global financial crisis and a China centric boom and bust, this benchmark has proved reliable. We focus on the 50 chateaux in the Liv-ex Bordeaux 500 Index. For consistency and ease of comparison, all prices are listed in Euros per bottle. We have laid out our methodology in the pages that follow.
The market is at a low ebbAfter four consecutive years of price declines, the fine wine market is at a low ebb. Falling prices have largely been a problem for Bordeaux wines. Wine prices in many other regions such as Burgundy, Champagne, Italy and the New World are at or close to record highs. Indeed, within Bordeaux itself, price deflation has been particularly evident for the First Growths and their second wines which gained most in the China-led boom. Many other wines on both left and right banks are above levels achieved at the peak. These trends are reflected in market activity, where First Growths have lost market share to lower priced rivals and Bordeaux has lost share to other regions. The market for En Primeur has been particularly weak. Customers have lost money for the last five vintages. Between the release of the 2008 and 2010 vintages, ex-chateaux prices increased 250% at a time when secondary market values increased by only 53%. Since then, new release prices have been slow to adjust to the changing market reality. This may explain the sharp drop in En Primeur trade on Liv-ex, which was down 97% on 2009 levels in last year’s campaign.
The news is not all badLooking ahead to the 2014 vintage, there is some good news. A tentative recovery in sentiment, prices and volumes is underway. The Liv-ex Bordeaux 500 Index is up 8.4% in Euros since June last year and the 2014 vintage is showing early promise. Moreover, a weak Euro against both the Pound and the Dollar will help buyers in Bordeaux’s core markets. Indeed, while the trade remains pessimistic about the likelihood of prices returning to a sensible level, they are perhaps overlooking that ex-chateaux prices have fallen by 62% since the 2010 release. Some release prices in 2013 were already the lowest since 2004. Others (notwithstanding the gap in quality) look attractive against 2008 release prices when considering that the value of physical stocks is up 30% since the 2008s were released in June 2009.
Headwinds remainConsiderable challenges remain for ex-chateaux prices in particular. With customers sitting on sizeable losses, prices will need to be competitive relative to stocks already available to entice them back to buying Bordeaux En Primeur. After three or four failed campaigns, there is a glut of unsold young Bordeaux in the market. Falling prices and rising stock levels have resulted in a marked deterioration in merchant balance sheets in Bordeaux and to a lesser extent the UK. This leaves no room for error. Unlike 2008, there will be no Robert Parker—who has retired from tasting Bordeaux in barrel—to save the day. Price, perhaps more than ever, will be key to success in this year’s campaign. We hope that you find the insights that follow useful.
The Liv-ex Team
Copyright ©2015 Liv-ex Ltd.
All rights reserved. No part of this publication may be reproduced, stored in a retrieval system, or transmitted in any form or by any means, electronic, mechanical, photocopying, recording or otherwise without the prior written permission of the copyright owner.
Wine scores copyright of www.eRobertParker.com, analysis conducted and published under license from www.eRobertParker.com. No copying, redistribution, retransmission, publication or commercial exploitation of this material is permitted without the prior written consent of The Wine Advocate, Inc.
2
Contents
Overview 3 - 10
Methodology 11 - 13
Individual wine pages 14 - 63
Château Angélus 14
Château Ausone 15
Château Beychevelle 16
Château Calon-Ségur 17
Carruades de Lafite 18
Château Cheval Blanc 19
Le Clarence de Haut-Brion 20
Château Climens 21
Château Clos Fourtet 22
Château La Conseillante 23
Château Cos d’Estournel 24
Château Coutet 25
Château Ducru-Beaucaillou 26
Château Duhart-Milon 27
Château L’Église-Clinet 28
Château L’Évangile 29
Château Figeac 30
Château La Fleur-Pétrus 31
Les Forts de Latour 32
Château Grand-Puy-Lacoste 33
Château Gruaud-Larose 34
Château Haut-Bailly 35
Château Haut-Brion 36
Château Lafite Rothschild 37
Château Lafleur 38
Château Lagrange Saint Julien 39
Château Latour 40
Château Léoville-Barton 41
Château Léoville-Las Cases 42
Château Léoville Poyferré 43
Château Lynch Bages 44
Château Margaux 45
Château La Mission Haut-Brion 46
Château Montrose 47
Château Mouton Rothschild 48
Château Palmer 49
Château Pavie 50
Pavillon Rouge 51
Le Petit Mouton 52
Château Pétrus 53
Château Pichon Lalande 54
Château Pichon Longueville Baron 55
Château Le Pin 56
Château Pontet-Canet 57
Château Rieussec 58
Château Suduiraut 59
Château Talbot 60
Château Troplong Mondot 61
Vieux Château Certan 62
Château Yquem 63
Appendix 64 - 68
50
100
150
200
250
300
350
Dec-03 Dec-04 Dec-05 Dec-06 Dec-07 Dec-08 Dec-09 Dec-10 Dec-11 Dec-12 Dec-13 Dec-14
Inde
x (re
base
d at
100
in D
ec 0
3)
1 2 3 4 5 6 7 98 10
50
100
150
200
250
300
Dec-03 Dec-04 Dec-05 Dec-06 Dec-07 Dec-08 Dec-09 Dec-10 Dec-11 Dec-12 Dec-13 Dec-14
Inde
x (re
base
d at
100
in D
ec 0
3)
Burgundy 150 Champagne 50 Rhone 100 Italy 100 Rest of the World 50 Bordeaux 500
20%
30%
40%
50%
60%
60%
70%
80%
90%
100%
2004 2005 2006 2007 2008 2009 2010 2011 2012 2013 2014
Firs
t Gro
wth
s' tra
de s
hare
Bord
eaux
's tra
de s
hare
Bordeaux First Growths (RHS)
50
100
150
200
250
300
350
Dec-03 Dec-04 Dec-05 Dec-06 Dec-07 Dec-08 Dec-09 Dec-10 Dec-11 Dec-12 Dec-13 Dec-14
Inde
x (re
base
d at
100
in D
ec 0
3)
1 2 3 4 5 6 7 98 10
50
100
150
200
250
300
Dec-03 Dec-04 Dec-05 Dec-06 Dec-07 Dec-08 Dec-09 Dec-10 Dec-11 Dec-12 Dec-13 Dec-14
Inde
x (re
base
d at
100
in D
ec 0
3)
Burgundy 150 Champagne 50 Rhone 100 Italy 100 Rest of the World 50 Bordeaux 500
20%
30%
40%
50%
60%
60%
70%
80%
90%
100%
2004 2005 2006 2007 2008 2009 2010 2011 2012 2013 2014
Firs
t Gro
wth
s' tra
de s
hare
Bord
eaux
's tra
de s
hare
Bordeaux First Growths (RHS)
3
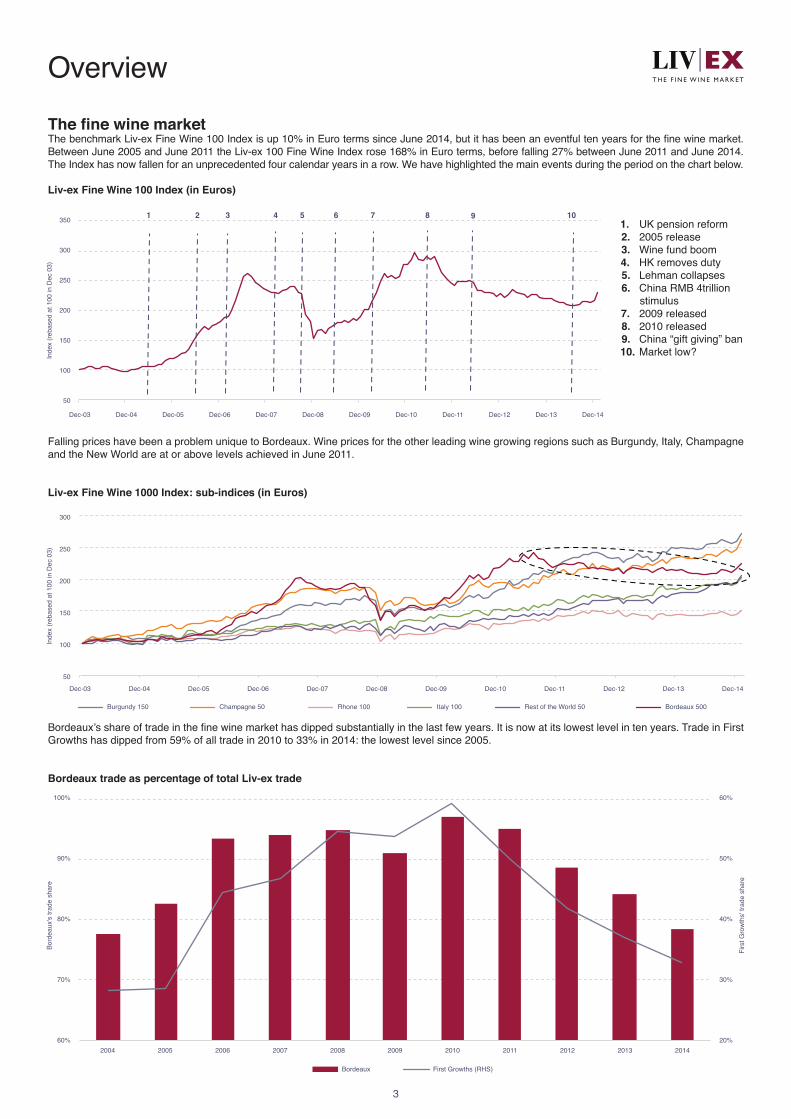
OverviewThe fine wine marketThe benchmark Liv-ex Fine Wine 100 Index is up 10% in Euro terms since June 2014, but it has been an eventful ten years for the fine wine market. Between June 2005 and June 2011 the Liv-ex 100 Fine Wine Index rose 168% in Euro terms, before falling 27% between June 2011 and June 2014. The Index has now fallen for an unprecedented four calendar years in a row. We have highlighted the main events during the period on the chart below.
Liv-ex Fine Wine 100 Index (in Euros)
Falling prices have been a problem unique to Bordeaux. Wine prices for the other leading wine growing regions such as Burgundy, Italy, Champagne and the New World are at or above levels achieved in June 2011.
Liv-ex Fine Wine 1000 Index: sub-indices (in Euros)
Bordeaux’s share of trade in the fine wine market has dipped substantially in the last few years. It is now at its lowest level in ten years. Trade in First Growths has dipped from 59% of all trade in 2010 to 33% in 2014: the lowest level since 2005.
Bordeaux trade as percentage of total Liv-ex trade
1. UK pension reform2. 2005 release3. Wine fund boom4. HK removes duty5. Lehman collapses6. China RMB 4trillion
stimulus7. 2009 released8. 2010 released9. China “gift giving” ban10. Market low?

0
100
200
300
400
500
600
Dec-03 Dec-04 Dec-05 Dec-06 Dec-07 Dec-08 Dec-09 Dec-10 Dec-11 Dec-12 Dec-13 Dec-14
Inde
x (re
base
d at
100
in D
ec 0
3)
Second Wine 50 Left Bank 200 Right Bank 50 Right Bank 100 Sauternes 50 Fine Wine 50
35%
40%
45%
50%
55%
60%
65%
0%
10%
20%
30%
40%
50%
60%
2004 2005 2006 2007 2008 2009 2010 2011 2012 2013 2014
Trad
e sh
are
Trad
e sh
are
Right Bank 100 Right Bank 50 Second Wine 50 Left Bank 200 Sauternes 50 Fine Wine 50 (RHS)
Performance of Liv-ex Bordeaux Indices in Euros
4
The First Growths (as represented by the Fine Wine 50 Index) and their second wines (the Second Wine 50 Index) have been most affected by the market downturn since mid-2011. Both indices are down 28%. However, some wines on the right bank such as Angelus, Clos Fourtet and Pavie are trading at higher prices today than they were at the peak of the market. Overall the Right Bank 50 Index (which includes Ausone, Cheval Blanc, Petrus and le Pin) is up 0.7% and the Right Bank 100 Index is up 23.9% since mid-2011. Sauternes has had a difficult decade and many wines are now trading at lower prices than they were ten years ago.
% change to end Jan 2015 since Jun 2014 1 year since Jul 2011 3 years 5 years 10 yearsBordeaux 500 Index* 8.4 4.3 -7.0 0.2 30.7 110.6Fine Wine 50 Index 9.1 2.3 -27.5 -12.6 18.7 150.0Left Bank 200 Index 11.9 7.9 -1.7 3.6 42.7 92.3Right Bank 50 Index 6.6 3.5 0.7 3.4 26.4 112.8Right Bank 100 Index 7.5 5.7 23.9 21.0 58.5 98.7Second Wine 50 Index 7.3 1.5 -27.8 -14.6 67.7 289.9Sauternes 50 Index 4.7 -0.3 -10.8 -12.9 -5.9 -4.2
* For index components, please see the methodology pages
Liv-ex Bordeaux 500 Index: sub-indices (in Euros)
These trends are reflected in market activity:
Share of Liv-ex trade within the Bordeaux 500 sub-indices
The First Growths and their second wines have lost market share to better value wines on the right and left bank alike. Between 2010 and 2014, for example, the Left Bank 200 Index has increased market share from 18% to 28% of trade, while the right bank indices have increased their share from 8% to 18%.
0%
2%
4%
6%
8%
10%
12%
14%
16%
2007 2008 2009 2010 2011 2012 2013
Shar
e of
tota
l tra
de
84
86
88
90
92
94
96
98
100
2004 2005 2006 2007 2008 2009 2010 2011 2012 2013
Aver
age
Park
er s
core
Left Bank 200 Fine Wine 50 Right Bank 100 Right Bank 50
Second Wines 50 Sauternes 50
*En Primeur Sales measured from start of campaign to end of March the following year
0%
2%
4%
6%
8%
10%
12%
14%
16%
2007 2008 2009 2010 2011 2012 2013
Shar
e of
tota
l tra
de
84
86
88
90
92
94
96
98
100
2004 2005 2006 2007 2008 2009 2010 2011 2012 2013
Aver
age
Park
er s
core
Left Bank 200 Fine Wine 50 Right Bank 100 Right Bank 50
Second Wines 50 Sauternes 50
Bordeaux 500 En Primeur: average returns and margin formation (Euros)
Vintage Ex chateau Ex negociant Merchant release Supply chain Price at delivery# Current price##
5
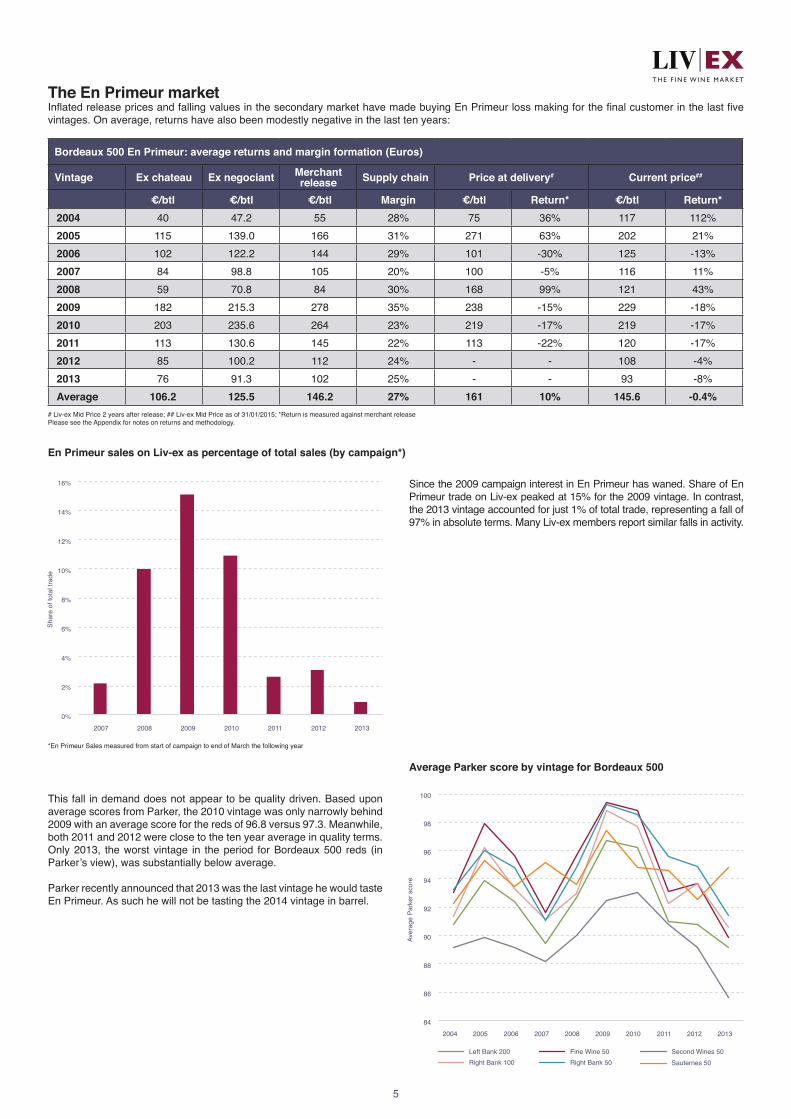
The En Primeur marketInflated release prices and falling values in the secondary market have made buying En Primeur loss making for the final customer in the last five vintages. On average, returns have also been modestly negative in the last ten years:
Since the 2009 campaign interest in En Primeur has waned. Share of En Primeur trade on Liv-ex peaked at 15% for the 2009 vintage. In contrast, the 2013 vintage accounted for just 1% of total trade, representing a fall of 97% in absolute terms. Many Liv-ex members report similar falls in activity.
This fall in demand does not appear to be quality driven. Based upon average scores from Parker, the 2010 vintage was only narrowly behind 2009 with an average score for the reds of 96.8 versus 97.3. Meanwhile, both 2011 and 2012 were close to the ten year average in quality terms. Only 2013, the worst vintage in the period for Bordeaux 500 reds (in Parker’s view), was substantially below average.
Parker recently announced that 2013 was the last vintage he would taste En Primeur. As such he will not be tasting the 2014 vintage in barrel.
€/btl €/btl €/btl Margin €/btl Return* €/btl Return*2004 40 47.2 55 28% 75 36% 117 112%2005 115 139.0 166 31% 271 63% 202 21%2006 102 122.2 144 29% 101 -30% 125 -13%2007 84 98.8 105 20% 100 -5% 116 11%2008 59 70.8 84 30% 168 99% 121 43%2009 182 215.3 278 35% 238 -15% 229 -18%2010 203 235.6 264 23% 219 -17% 219 -17%2011 113 130.6 145 22% 113 -22% 120 -17%2012 85 100.2 112 24% - - 108 -4%2013 76 91.3 102 25% - - 93 -8%Average 106.2 125.5 146.2 27% 161 10% 145.6 -0.4%
# Liv-ex Mid Price 2 years after release; ## Liv-ex Mid Price as of 31/01/2015; *Return is measured against merchant releasePlease see the Appendix for notes on returns and methodology.
En Primeur sales on Liv-ex as percentage of total sales (by campaign*)
Average Parker score by vintage for Bordeaux 500

0
100
200
300
400
500
600
Jun-05 Jun-06 Jun-07 Jun-08 Jun-09 Jun-10 Jun-11 Jun-12 Jun-13 Jun-14
Inde
x le
vel (
reba
sed
at 1
00 in
Jun
05)
Ex-chateaux index Bordeaux 500
2005
2013 2012 2011
2010
2009
2008
2007 2006
2004
-10
10
30
50
70
90
110
Fine Wine 50 Second Wines 50 Left Bank 200 Right Bank 100 Sauternes 50 Right Bank 50
Cha
nge
(%)
Change in ex-chateau release: 2013 vs 2008 vintages Change in physical stock prices between Jun 09-14 (%)
6
As the chart below shows, prices became divorced from secondary market values after the 2008 vintage. The excitement surrounding new demand from China and the quality of the 2009 vintage resulted in a 250% increase in ex-chateaux prices between the release of the 2008 and 2010 vintages. During the same period (June 2009 to June 2011) prices in the secondary market increased just 53%.
Ex-chateaux prices relative to the Liv-ex Bordeaux 500 Index
Release prices in 2013, however, were some 62% below the record levels set for the 2010. Indeed, by June 2014, the index of ex-chateaux prices had given up almost all of its gains against the Liv-ex Bordeaux 500 Index. Between June 2009 and June 2014 respectively (when the 2008 and 2013 vintages were released), the Liv-ex Bordeaux 500 Index was up 31.6% in Euro terms, while ex-chateaux prices were up a comparable 36.4%. Since the 2013 release secondary market values are up 8.4%, further eroding the gap between primary and secondary market prices. As such, on average 2013 ex-chateaux prices are now at (or close to) 2008 levels after adjusting for increases in secondary market prices between June 2009 (when the 2008 vintage was released) and the end of January 2015. Moreover, some wines in 2013 were released at below 2008 levels in absolute terms.
Change in ex-chateaux prices between 2008 and 2013 relative to change in secondary market values over same period
In the chart above, we have broken this down further to show the relative change between release prices and secondary market prices over the same period (June 2009 to June 2014) for each sub index. This shows that after taking into account price changes in the various sub-indices for physical stocks, 2013 ex-chateaux prices were – outside of the First Growths - starting to look comparable to 2008 levels after accounting for changes in secondary market prices. It is also worth noting that Cheval Blanc, Leoville Las Cases, Ausone, Coutet and Climens all released at or below their 2008 ex-chateaux release price in 2013.
Agency wines and wines not released in 2013 were excluded.

0
20
40
60
80
100
120
140
160
180
200
Apr May Jun Jul Aug Sep Oct
Rai
nfal
l (m
m)
2005 2006 2007 2008 2009 2010 2011 2012 2013 2014 Average
Total mm April - Oct 366 408 431 450 243 314 518 609 435348
100
105
110
115
120
125
0
100
200
300
400
500
600
700
96-00 (Avg) 01-05 (Avg) 2006 2007 2008 2009 2010 2011 2012 2013 06-13 (Avg)
Hec
tare
s (th
ousa
nds)
Litre
s (m
illion
s)
Yield - Millions of litres Vineyard area - Thousands of hectares (RHS)
75
80
85
90
95
100
105
75
80
85
90
95
100
105
Apr-1
4
May
-14
Jun-
14
Jul-1
4
Aug-
14
Sep-
14
Oct
-14
Nov
-14
Dec
-14
Jan-
15
Rat
e of
Eur
o ag
ains
t USD
Rat
e of
Eur
o ag
ains
t GBP
(reb
ased
at 1
00 in
Apr
14)
GBP USD (RHS)
2014 yields expected to return to average
0
20
40
60
80
100
120
140
160
180
200
Apr May Jun Jul Aug Sep Oct
Rai
nfal
l (m
m)
2005 2006 2007 2008 2009 2010 2011 2012 2013 2014 Average
Total mm April - Oct 366 408 431 450 243 314 518 609 435348
100
105
110
115
120
125
0
100
200
300
400
500
600
700
96-00 (Avg) 01-05 (Avg) 2006 2007 2008 2009 2010 2011 2012 2013 06-13 (Avg)
Hec
tare
s (th
ousa
nds)
Litre
s (m
illion
s)
Yield - Millions of litres Vineyard area - Thousands of hectares (RHS)
75
80
85
90
95
100
105
75
80
85
90
95
100
105
Apr-1
4
May
-14
Jun-
14
Jul-1
4
Aug-
14
Sep-
14
Oct
-14
Nov
-14
Dec
-14
Jan-
15
Rat
e of
Eur
o ag
ains
t USD
Rat
e of
Eur
o ag
ains
t GBP
(reb
ased
at 1
00 in
Apr
14)
GBP USD (RHS)
2014 yields expected to return to average
7
The outlook for 2014
This research was prepared before the UGC tastings, but early reports describe the 2014 vintage as “the best since 2010” and “a good rather than exceptional vintage” in both quality and quantity. Bordeaux wine producer and writer, Gavin Quinney, describes it as a “book-end” vintage on account of the uniformity of the flowering in June, the rather grey and cool weather that typified July and August and the warm and dry harvest months of September and October. The data seems to support this, with July and August being wetter than average and September and October both being drier than normal.
Bordeaux yields 2006-2013
Yields for Bordeaux as a whole in 2014 are estimated to be closer to the ten year average of 500 million litres and ahead of the 380 million litres produced in 2013. This points to a return to more normal yields for the wines in the Liv-ex Bordeaux 500 Index. There should be sufficient quantity of wine to sell En Primeur this spring.
Euro against GBP and USD
A weak Euro will also make prices relatively attractive in core markets like UK and US. The Euro has weakened 19% against the Dollar and 9% against the Pound since April 2014 (as of 31 January 2015).
Bordeaux rainfall (mm) comparison: 2005—2014
Source: CIVB/ Douane and @GavinQuinney
Source: @GavinQuinney
-50
0
50
100
150
200
200
250
300
350
400
450
2007 2008 2009 2010 2011 2012 2013 2014 2015 (YTD)
Year
on
year
cha
nge
(%)
Liv-
ex 5
0 (re
base
d at
100
in D
ec 0
3)
HK Wine Imports from UK (Chg %) - RHS
Fine Wine 50 (year end close)
0 20 40 60 80 100
To drink only
To invest only
To drink and invest
Percentage (%) Total Responses: 729
Survey conducted: October 2012
16% (116)
9% (63)
75% (550)
0.00
0.50
1.00
1.50
2.00
250
300
350
400
450
Mar
-10
Sep-
10
Mar
-11
Sep-
11
Mar
-12
Sep-
12
Mar
-13
Sep-
13
Mar
-14
Sep-
14
Bid:
Offe
r Rat
io
Liv-
ex F
ine
Win
e 50
(reb
ased
at 1
00 in
Dec
03)
Fine Wine 50 Index Bid:Offer ratio
HK Wine imports from UK rise in 2014
8
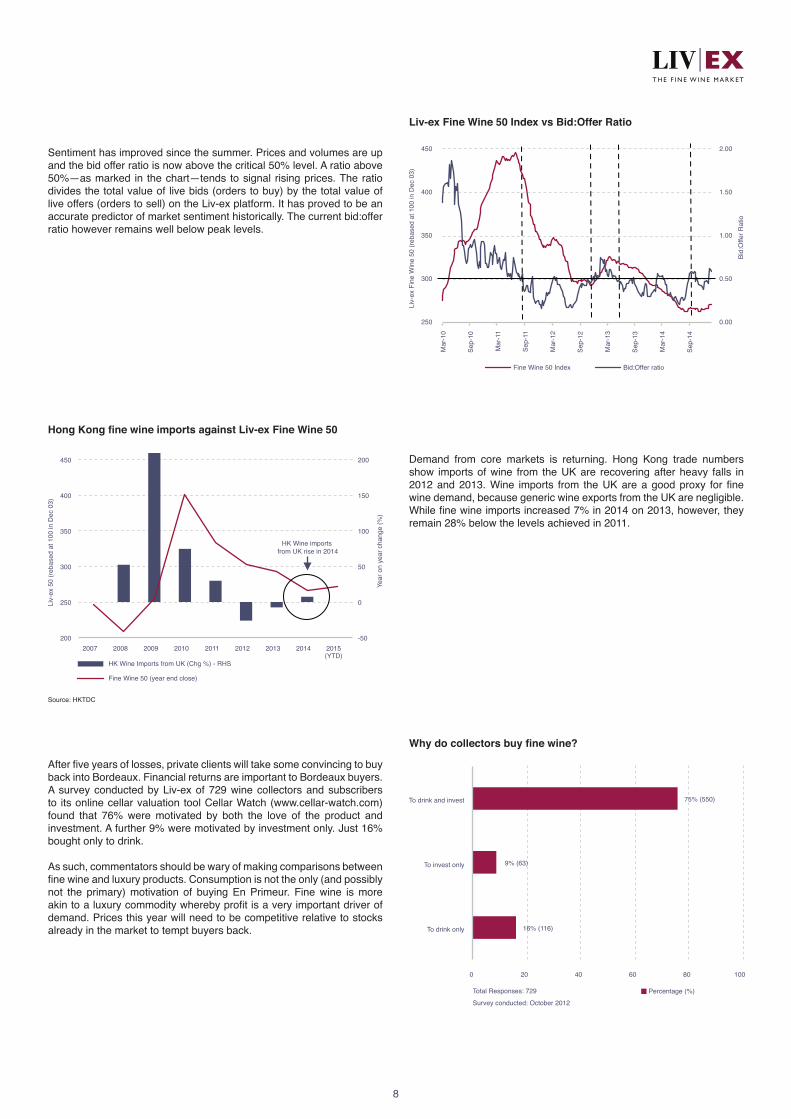
Sentiment has improved since the summer. Prices and volumes are up and the bid offer ratio is now above the critical 50% level. A ratio above 50%—as marked in the chart—tends to signal rising prices. The ratio divides the total value of live bids (orders to buy) by the total value of live offers (orders to sell) on the Liv-ex platform. It has proved to be an accurate predictor of market sentiment historically. The current bid:offer ratio however remains well below peak levels.
Demand from core markets is returning. Hong Kong trade numbers show imports of wine from the UK are recovering after heavy falls in 2012 and 2013. Wine imports from the UK are a good proxy for fine wine demand, because generic wine exports from the UK are negligible. While fine wine imports increased 7% in 2014 on 2013, however, they remain 28% below the levels achieved in 2011.
After five years of losses, private clients will take some convincing to buy back into Bordeaux. Financial returns are important to Bordeaux buyers. A survey conducted by Liv-ex of 729 wine collectors and subscribers to its online cellar valuation tool Cellar Watch (www.cellar-watch.com) found that 76% were motivated by both the love of the product and investment. A further 9% were motivated by investment only. Just 16% bought only to drink.
As such, commentators should be wary of making comparisons between fine wine and luxury products. Consumption is not the only (and possibly not the primary) motivation of buying En Primeur. Fine wine is more akin to a luxury commodity whereby profit is a very important driver of demand. Prices this year will need to be competitive relative to stocks already in the market to tempt buyers back.
Liv-ex Fine Wine 50 Index vs Bid:Offer Ratio
Hong Kong fine wine imports against Liv-ex Fine Wine 50
Why do collectors buy fine wine?
Source: HKTDC

-75%
-25%
25%
75%
125%
175%
2004 2005 2006 2007 2008 2009 2010 2011 2012 2013
Diff
eren
ce fr
om a
vera
ge
Left Bank 200 Liv-ex Fine Wine 50 Liv-ex Right Bank 100 Liv-ex Right Bank 50 Liv-ex Second Wines 50 Sauternes 50
2
3
4
5
6
7
90
95
100
105
110
115
2011 2012 2013
Ope
ratin
g m
argi
n (%
)
Sale
s in
dex
Sales Indexed at 100 in 2011 Operating Margin (RHS) %
40
45
50
55
60
65
70
190
200
210
220
230
240
250
2011 2012 2013
Net
deb
t to
equi
ty (%
)
Stoc
k da
ys
Stock days Net debt to equity % (RHS)
9
There is an oversupply of young Bordeaux. The failure of recent campaigns has resulted in a build-up of unsold stocks from 2010, 2011 and 2012 vintages in the supply chain. Moreover, while yields in 2013 were small, the level of stocks showing in the supply chain outside of the First Growths are much lower than one would expect. This suggests that most of this vintage is still lying at the chateaux because it is not yet being advertised on merchant lists. Prices for 2010, 2011, 2012 and 2013 are likely to remain under pressure until stocks have cleared.
Stock availability by vintage compared to average by sub-index (as of 31 January 2015)
Bordeaux negociant: sales and profit margins* Bordeaux negociant: balance sheet ratios*
Indeed, falling prices and rising stocks are exerting pressure on merchant balance sheets, particularly in Bordeaux. Negociants’ sales and margins are under pressure and balance sheets have deteriorated with both debt to equity and stock days rising in recent years. In 2013 operating margins fell from 6.1% to 4.4% and sales fell 11%. Stocks equated to more than 240 days of sales. Debt to equity increased to 68% from 53% on average. The numbers for 2013 include sales and profits from the 2010 vintage, suggesting reported numbers for 2014 will show further deterioration in key ratios. This is likely to limit the capacity for the Bordeaux market to absorb another poorly priced campaign.
Sourced from Liv-ex members based on stock declared as available for sale with a firm price.
*Aggregated accounts of leading Bordeaux negociants. Source: creditsafe.com

4
5
6
7
8
9
80
100
120
140
160
180
2009 2010 2011 2012 2013 O
pera
ting
Mar
gins
(%)
Mer
chat
sal
es in
dex
(reba
sed
at 1
00 in
200
9)
UK merchant sales indexed at 100 in 2009 Operating margins % (RHS)
-100
-80
-60
-40
-20
15
20
25
30
35
2009 2010 2011 2012 2013
Deb
t to
equi
ty (%
)
Stoc
k da
ys
Stock days Debt to equity % (RHS)
10
While the UK trade is in better shape, margins and sales are also under pressure:
The UK trade does not use bank debt to finance its businesses. Negative debt to equity ratios show that the UK trade have cash on their balance sheets. Stock days are also much lower than in Bordeaux at 32 days, but are rising.
There have been numerous closures and bankruptcies in the international fine wine trade in the last 3 years. This trend is likely to continue. Early indications suggest that reported sales in 2014 for the leading UK players will be down by 20-25% on 2013. This points to further deterioration in profitability and balance sheet ratios. The international trade will therefore be very price sensitive in the 2014 campaign and unlikely to buy more than they can sell.
SummaryFine wine prices have fallen for an unprecedented four calendar years in a row. There are some indications that prices, sentiment and demand have improved since last summer, but all three factors remain substantially below 2011 levels. Looking forward to the 2014 En Primeur campaign, there is some cause for optimism. Quality and quantity are likely to be closer to normal levels in 2014, after a very difficult vintage in 2013. Having fallen by more than 60% on average, ex-chateaux prices (for most wines) in 2013 are coming back into line with secondary market values. A weak Euro will make prices relatively attractive in Bordeaux’s core UK and US markets.
Nevertheless, considerable hurdles remain. After losing money for the last five vintages in a row, the final customer is going to be very reluctant to buy En Primeur unless prices are competitive. Prices will need to be attractive relative to wines already in the market. An oversupply of young Bordeaux and limited capacity amongst the trade to absorb additional stocks, suggest that ex-chateaux prices will remain under pressure in 2014.
UK trade: sales and profit margins UK trade: balance sheet ratios
Source: creditsafe.com