Livability Benchmarks for Montana Transportation Interim ...
60
Livability Benchmarks for Montana Transportation Interim Report Prepared by Patrick McGowen, Assistant Professor Jaydeep Chaudhari, Research Scientist Levi Ewan, Graduate Research Assistant Of the Western Transportation Institute College of Engineering Montana State University With support from Rebecca Gleason, Western Transportation Institute Lisa Aultman-Hall, University of Vermont, Transportation Research Center Prepared for the Montana Department of Transportation 2701 Prospect Ave. Helena, MT 59620 April 2011
Transcript of Livability Benchmarks for Montana Transportation Interim ...

Livability Benchmarks for Montana Transportation
Interim Report
Prepared by
Patrick McGowen, Assistant Professor
Jaydeep Chaudhari, Research Scientist
Levi Ewan, Graduate Research Assistant
Of the
Western Transportation Institute
College of Engineering
Montana State University
With support from
Rebecca Gleason, Western Transportation Institute
Lisa Aultman-Hall, University of Vermont, Transportation Research Center
Prepared for the
Montana Department of Transportation
2701 Prospect Ave.
Helena, MT 59620
April 2011

Livability Benchmarks Disclaimer
DISCLAIMER This document is disseminated under the sponsorship of the Montana Department of Transportation and the United States Department of Transportation in the interest of information exchange. The State of Montana and the United States Government assume no liability of its contents or use thereof.
The contents of this report reflect the views of the authors, who are responsible for the facts and accuracy of the data presented herein. The contents do not necessarily reflect the official policies of the Montana Department of Transportation or the United States Department of Transportation.
The State of Montana and the United States Government do not endorse products of manufacturers. Trademarks or manufacturers' names appear herein only because they are considered essential to the object of this document.
This report does not constitute a standard, specification, or regulation.
ALTERNATIVE FORMAT STATEMENT MDT attempts to provide accommodations for any known disability that may interfere with a person participating in any service, program, or activity of the Department. Alternative accessible formats of this information will be provided upon request. For further information, call (406) 444-7693, TTY (800) 335-7592, or Montana Relay at 711.

Livability Benchmarks Table of Contents
Western Transportation Institute Page iii
TABLE OF CONTENTS 1. Introduction ..............................................................................................................................1
2. Literature Review.....................................................................................................................3
2.1. Definition ......................................................................................................................... 3
2.2. Related Policies and Programs ......................................................................................... 5
2.2.1. National and Other State Policies and Programs ...................................................... 5
2.2.2. Montana Policies and Programs................................................................................ 9
2.3. Livability Project Examples ........................................................................................... 10
2.3.1. Incorporating Livability Principles in Local Policies ............................................. 11
2.3.2. Local Land Use Planning ........................................................................................ 11
2.3.3. Intercity Bus to Connect Rural Communities ......................................................... 11
2.3.4. Local Transit Service .............................................................................................. 11
2.3.5. Incorporating Local Community Values ................................................................ 11
2.3.6. Safe Routes to School ............................................................................................. 12
2.4. Measuring Livability Progress ....................................................................................... 12
3. Demographic Information ......................................................................................................13
3.1. General Population and Essential Services .................................................................... 13
3.1.1. Population ............................................................................................................... 13
3.1.2. Population Density .................................................................................................. 15
3.1.3. Montana Health Care Facilities .............................................................................. 20
3.2. Transportation Infrastructure .......................................................................................... 22
3.2.1. Transportation Infrastructure of Montana ............................................................... 22
3.2.2. Safety ...................................................................................................................... 24
3.2.3. Mobility................................................................................................................... 25
3.2.4. Transportation Energy ............................................................................................ 30
3.3. Alternate Modes of Transportation ................................................................................ 32
3.3.1. Public Transportation .............................................................................................. 32
3.3.2. Air Services ............................................................................................................. 33
3.4. Summary ........................................................................................................................ 34
4. TranPlan 21 Comments..........................................................................................................36
5. Interviews with Other States ..................................................................................................41
6. Conclusions ............................................................................................................................45
7. References ..............................................................................................................................46
8. Appendix A: Demographic Data ...........................................................................................50
9. Appendix B: TRB Research in Progress Database Search: Livability ..................................52
Livability Benchmarks List of Tables
Western Transportation Institute Page iv
LIST OF TABLES
Table 1: Top 10 Incorporated Place by Population (2009 Estimates) .......................................... 18
Table 2: Top 10 Counties by Population (2009 Estimates) .......................................................... 19
Table 3: Elderly Population and Transit Access for Counties with No Physicians ...................... 21
Table 4: TranPlan 21 Responses to Possible Improvements, Alternative Modes ........................ 36
Table 5: TranPlan 21 Responses to Possible Improvements, Top Five ........................................ 36
Table 6: TranPlan 21 Public Responses to Other Transportation-Related Issues ........................ 38
Table 7: TranPlan 21 Stakeholder Responses to Other Transportation-Related Issues ................ 39
Table 8: TranPlan 21 Public Responses to Suggestions to Improve Roadways ........................... 40
Table 9: How States Are Defining Livability ............................................................................... 41
Table 10: Transportation Needs .................................................................................................... 43
Table 11: Importance of Transportation Choices ......................................................................... 43
Table 12: Urbanized Areas (2009 Estimates) ............................................................................... 50
Table 13: Urban Areas (2009 Estimates) ...................................................................................... 50
Table 14: City/Town with Intercity Bus Services ......................................................................... 51

Livability Benchmarks List of Figures
Western Transportation Institute Page v
LIST OF FIGURES
Figure 1: Livability Roles ............................................................................................................... 6
Figure 2: TIGER-II Funding Awarded by Project Type in Rural Areas ........................................ 7
Figure 3: TIGER-II Funding Awarded by Project Type in Urban Areas ....................................... 8
Figure 4: Percent Growth from 2000 to 2009 ............................................................................... 13
Figure 5: Montana County Population Growth Rate .................................................................... 14
Figure 6: Montana County Population Growth Projections ......................................................... 14
Figure 7: Population Over 65 Years of Age ................................................................................. 15
Figure 8: Projected Population Over 65 Years of Age ................................................................. 15
Figure 9: Population Density ........................................................................................................ 16
Figure 10: Population Density ...................................................................................................... 16
Figure 11: Population Density at the Census Block Level ........................................................... 17
Figure 12: Proportion of Population and Area by Population Density Category. ........................ 18
Figure 13: Population by Community Size ................................................................................... 20
Figure 14: Major Medical Facilities ............................................................................................. 22
Figure 15: Road Condition Ratings by Percentage of Total Miles ............................................... 23
Figure 16: Air Travel Ports ........................................................................................................... 23
Figure 17: Annual Freight Shipments by State of Origination ..................................................... 24
Figure 18: Total Road Fatalities ................................................................................................... 25
Figure 19: Workers per Capita ...................................................................................................... 25
Figure 20: Commuting by Mode................................................................................................... 26
Figure 21: Mean Travel Time to Work ......................................................................................... 27
Figure 22: Registered Vehicles per Capita ................................................................................... 27
Figure 23: Licensed Drivers per Capita ........................................................................................ 28
Figure 24: Truck Registration ....................................................................................................... 28
Figure 25: Vehicle-Miles Traveled ............................................................................................... 29
Figure 26: Transit Systems ........................................................................................................... 29
Figure 27: Annual Government Transportation Expenditures ...................................................... 30
Figure 28: Transportation Energy Consumption .......................................................................... 31
Figure 29: Alternative Fueled Vehicles ........................................................................................ 31
Figure 30: Local Public Transportation ........................................................................................ 32
Figure 31: Intercity Bus and Rail Systems in Montana ................................................................ 33
Figure 32: Air Travel .................................................................................................................... 34

Livability Benchmarks List of Acronyms
Western Transportation Institute Page vi
LIST OF ACRONYMS
ADA Americans with Disabilities Act
AHEC Montana Area Health Education Center
BTU British Thermal Unit
CEIC Census and Economic Information Center
CNT Center For Neighborhood Technology
CSKT Confederated Salish Kootenai Tribes
CSS Context Sensitive Solutions
CTOD Center For Transit Oriented Development
EAS Essential Air Service
EPA U.S. Environmental Protection Agency
FHWA Federal Highway Administration
FTA Federal Transit Administration
GHG Greenhouse Gas
HUD U.S. Department Of Housing And Urban Development
MDT Montana Department Of Transportation
MPO Metropolitan Planning Organization
NAPA Montana Nutrition And Physical Activity
NCMT North Central Montana Transit
NGO Non-Government Organization
NRIS Natural Resource Information System
RITA Research And Innovative Technology Administration
SRTS Safe Routes To School
STOL Short Take-Off and Landing
TE Transit Enhancement
TERC Transportation And Environmental Resource Council
TIGER Transportation Investment Generating Economic Recovery
TOD Transit-Oriented Development
USDOT U.S. Department Of Transportation
VMT Vehicle-Miles Traveled
VTPI Victoria Transport Policy Institute
WSDOT Washington State Department Of Transportation
WTI Western Transportation Institute

Livability Benchmarks Introduction
Western Transportation Institute Page 1
1. INTRODUCTION
Discussion of the concept of livability has become prevalent nationally and it is gaining a prominent role in transportation planning and urban and rural development. It seems likely that livability will play a role in the next federal surface transportation bill passed by Congress. One action that has increased general discussion of livability is the creation at a national level of the interagency Partnership for Sustainable Communities between the U.S. Department of Housing and Urban Development (HUD), the U.S. Department of Transportation (USDOT) and the U.S. Environmental Protection Agency (EPA). This initiative has identified six principles of livability: (1) provide transportation choices; (2) promote equitable, affordable housing; (3) enhance economic competitiveness; (4) support existing communities; (5) coordinate policies and leverage investment; and (6) value communities and neighborhoods (US HUD, USDOT and US EPA, 2009).
Much of the national discussion on livability has revolved around light rail, transit-oriented design, high-density housing and other elements with a distinctly urban focus. Despite pressure by some groups to include rural issues in the livability discussion, it is the urban issues that get more attention. In a blog post titled “Livability Works for Rural Communities,” Transportation Secretary Ray LaHood provided a few examples of success stories of rural livability (USDOT, 2010a). Two examples he gave involved trolley systems, which are not a typical solution for rural areas with low population densities. One of his examples was from Dubuque, Iowa, which has a population of over 50,000 (defined as urbanized/metropolitan areas in federal transportation planning regulations and by the U.S. Census).
Many previous efforts and initiatives have had goals similar to the objectives of the livability concept. For example, context-sensitive solutions, new urbanism, sustainable transportation, transit-oriented design, complete streets and walkable communities are all initiatives that embody at least some of the ideas behind livability. Historically, livability principles were being promoted as far back as 1929 by New York-based social planner Clarence Perry, who introduced “neighborhood units” as a part of the 1929 Regional Plan of New York. His plan featured a walkable community with centrally located public amenities within a half-mile radius (Hoch et al., 2000). Some state departments of transportation have made efforts to explicitly incorporate livability into their programs. The Washington State Department of Transportation (WSDOT) has developed a policy statement on livability. The policy sets the broad departmental goal that “[t]ransportation plans and actions will support and encourage partnering with local communities to achieve our mutual interests in promoting livable communities” (WSDOT 2010). The policy also states that transportation projects will foster multimodal options (public transit, bicycle, pedestrian, road, rail and ferry), be sensitive to community values and coordinate funding to encourage livability.
The concept of livability is not new to Montana or the Montana Department of Transportation (MDT). Helping build great places in great environments has long been embedded in the departmental mission, and even the state constitution. In light of the current national dialogue on livability, the challenge facing MDT is to more formally define livability for Montana and its communities and understand how livability relates to Montana’s transportation needs. To help with this challenge, the Western Transportation Institute (WTI) is conducting a study for MDT to investigate livability in the Montana context. The purpose of this study is to understand what

Livability Benchmarks Introduction
Western Transportation Institute Page 2
livability means for rural areas and the role transportation can play in improving livability in rural communities. The objectives for this research project are:
Objective 1: Identify and understand Federal agency programs and practices related to or supporting livability.
Objective 2: Ascertain what peer states are doing to address livability.
Objective 3: Identify and understand Montana community-level definitions of livability. The definitions may vary according to the diversity of communities across Montana from urban to rural to extremely rural.
Objective 4: Identify practices and policies MDT and other state agencies have in place that address livability as identified in Objective 3.
Objective 5: Determine potential opportunities for MDT to address livability.
To achieve the study objectives, the following research tasks are being undertaken:
Scan literature and practices on livability. Summarize Montana demographic data that may relate to livability issues. Contact peer states to ascertain what they are doing to address livability. Review statewide and select local plans that could relate to livability (e.g., land
use plans, statewide obesity plan). Conduct interviews with Montana partner agencies to identify opportunities and
Montana definitions of livability. Conduct survey of Montana communities and stakeholders for livability definition
and what it means to them. Complete internal interviews with key MDT divisions/bureaus in regard to
livability in the rural context.
This interim report includes the following tasks: Literature Review (Chapter 2), Demographic Data Summary (Chapter 3), Review of Montana TranPlan 21 Public Comments (Chapter 4), and Interviews with Selected State Departments of Transportation (Chapter 5).

Livability Benchmarks Literature Review
Western Transportation Institute Page 3
2. LITERATURE REVIEW
Literature was reviewed in order to (1) provide examples of livability definitions currently in use, (2) identify current polices related to livability, (3) identify specific examples of projects and programs promoting potential livability objectives, and (4) identify any metrics used to measure the success of livability goals related to a specific project or region/state. This chapter discusses what was found during this review.
2.1. Definition
Livability is a broad term that has been applied to many areas of life, making a single, catch-all definition elusive. As it pertains to transportation, livability definitions share a set of central ideas that vary depending on the setting (e.g., rural vs. urban) and the focus (e.g., transportation, housing). A simple definition of livability might refer to the “environmental and social quality of an area as perceived by residents” (VTPI, 2010).
Federal Highway Administrator Victor Mendez endorses the following definition: “Livability is about tying the quality and location of transportation facilities to broader opportunities such as access to good jobs, affordable housing, quality schools and safe streets. This includes addressing safety and capacity issues on all roads through better planning and design, maximizing and expanding new technologies such as ITS and the use of quiet pavements, using Travel Demand Management approaches to system planning and operations, etc.” (USDOT FHWA, 2010).
USDOT Secretary Ray LaHood provided the following definition: “Livable communities are mixed-use neighborhoods with highly connected streets promoting mobility for all users, whether they are children walking or biking to school or commuters riding transit or driving motor vehicles. Benefits include improved traffic flow, shorter trip lengths, safer streets for pedestrians and cyclists, lower greenhouse gas emissions, reduced dependence on fossil fuels, increased trip-chaining and independence for those who prefer not to or are unable to drive. In addition, investing in a ‘complete street’ concept stimulates private-sector economic activity by increasing the viability of street-level retail small businesses and professional services, creating housing opportunities and extending the usefulness of school and transit facilities” (LaHood, 2009).
AARP defines a livable community as “one that has affordable and appropriate housing, supportive community features and services, and adequate mobility options, which together facilitate personal independence and the engagement of residents in civic and social life” (Kochera et al., 2005).
A more regional definition of livability was created by the Washington State Department of Transportation. According to WSDOT, livable communities “provide and promote civic engagement and a sense of place through safe, sustainable choices for a variety of elements that include housing, transportation, education, cultural diversity and enrichment, and recreation” (WSDOT, 2010).
HUD, USDOT and EPA defined six livability principles in their Partnership on Sustainable Communities Position Statement (US HUD, USDOT, US EPA, 2009):

Livability Benchmarks Literature Review
Western Transportation Institute Page 4
Provide more transportation choices. Develop safe, reliable, and economical transportation choices to decrease household transportation costs, reduce our nation’s dependence on foreign oil, improve air quality, reduce greenhouse gas emissions, and promote public health.
Promote equitable, affordable housing. Expand location- and energy-efficient housing choices for people of all ages, incomes, races, and ethnicities to increase mobility and lower the combined cost of housing and transportation.
Enhance economic competitiveness. Improve economic competitiveness through reliable and timely access to employment centers, educational opportunities, services, and other basic needs by workers as well as expanded business access to markets.
Support existing communities. Target federal funding toward existing communities—through such strategies as transit-oriented, mixed-use development, and land recycling—to increase community revitalization, improve the efficiency of public works investments, and safeguard rural landscapes.
Coordinate policies and leverage investment. Align federal policies and funding to remove barriers to collaboration, leverage funding and increase the accountability and effectiveness of all levels of government to plan for future growth, including making smart energy choices such as locally generated renewable energy.
Value communities and neighborhoods. Enhance the unique characteristics of all communities by investing in healthy, safe, and walkable neighborhoods—rural, urban, or suburban.
Many other documents provide aspects or goals of livability. The Victoria Transport Policy Institute (VTPI) has identified the following characteristics as important to livability: perception of public safety, attractive streetscapes, community character, friendliness, community cohesion, walkability, accessibility, clean air, recreation, affordability and quality of transportation options for elderly and special needs citizens (VTPI, 2010).
A universal, specific definition of livability is not practical due to the vast differences between communities. One potential theme of livability relates to the benefits of creating compact neighborhoods, but compactness is relative across the urban and rural scale. Communities can vary greatly in population, socioeconomic status and ideals. Different types of communities may need a different definition of what livability means for them. One way to classify communities by size is to use the Office of Management and Budget definitions of metropolitan (population exceeding 50,000), micropolitan (population between 10,000 and 50,000) and non-metropolitan/non-core (population less than 10,000). A coarser categorization would be rural and urban, using the 50,000 population break point to distinguish between the two. Even when focusing on rural communities, a National Cooperative Highway Research Program report (Twadell and Emerine, 2007) found different types of rural communities had unique challenges relating to livability according to their classification as exurban, destination, or production communities.
There are some common themes among the various definitions. Livability can be a broad term encompassing almost every aspect of a community; this definition goes well beyond the transportation system and could include the local economy, the surrounding environment, community values and land development. Livability needs, issues and solutions vary across

Livability Benchmarks Literature Review
Western Transportation Institute Page 5
community types; one size does not fit all. Lastly, there are several themes in the national discussion of livability related to transportation:
Transportation systems should include all modes (air, automobile, public transit, bicycle and pedestrian).
Land use and transportation clearly influence each other. Transportation plans and projects should result in a transportation system that integrates with and supports local land use plans, affordable housing projects and similar efforts that encourage a livable community structure.
Transportation systems should be highly connected. Cul-de-sacs and streets designed around specific land development limit connectivity. A well-designed grid system promotes connectivity.
Transportation projects should incorporate local values in the planning/design process. Such values may include aesthetically pleasing transportation corridors and pedestrian safety.
Safety and capacity for the automobile mode should not be ignored. Transportation systems should seek to reduce fossil fuel use and greenhouse gases. Transportation systems should provide access to jobs, education, health care and services. Transportation projects should be coordinated with other projects to leverage funding and
accomplish livability goals.
2.2. Related Policies and Programs
In recent years federal and state agencies have developed programs and policies that either specifically mention livability, or include ideas and issues that may relate to livability as it has been defined nationally. The policies and programs may or may not be appropriate for improving livability in Montana. This section provides a summary of plans and programs at the national level, in other states and within Montana that may have a link to livability.
2.2.1. National and Other State Policies and Programs
The HUD, USDOT and EPA partnership has identified many programs to support livability. These programs are outlined in Figure 1.

Livability
Western
The two TIGER-Iand stimlong-rangof livingUnited Sproject wThe propconvenieand redudisadvanresulted sustainabsustainabdependenendangersimilar pthe six liFederal R
y Benchmar
Transportati
phases of thII) grants pro
mulating the ge outcomes
g and workintates” (Offic
will be evaluposals were ent transportuced conge
ntaged popufrom a coo
bility criterioble a projectnce on forered species, roject selectivability prinRegister, 201
ks
ion Institute
Figure 1:
he Transportogram provideconomy, th
s. One of theng environmce of the Feduated, the Fequalitativelytation optionestion, imp
ulations, nonordinated traon, which mit had to impign oil) andimprove wi
tion criteria bnciples from10).
Livability R
tation Investded funding he project sese outcomesments and thderal Registederal Regist
y evaluated ons, improvedroved accen-drivers, seansportation ight be consprove energd protect thildlife habitbut added th
m the USDO
Roles (Sourc
tment Generfor transpor
selection crits was increa
he experiencer, 2009a). Inter states livon how the d transportaessibility foenior citizenand land u
sidered closey efficiency
he environmat connectivhat the projeOT-HUD-EP
ce: Mattice,
ating Econortation projeteria for TIGasing livabilice for peopln detailing h
vability is inhproject incre
ation choice or transit-dens and pers
use planningely related toy (reduce gr
ment (e.g., pvity). The seect would bePA partnersh
L
, 2010)
omic Recoveects. Aside frGER-I incluity by “impre in commuhow the livabherently diffeased mobilthrough mo
ependent posons with d
g process. To livability. Treenhouse gaprotect wetlaecond phase
e evaluated ohip agreeme
Literature Re
P
ery (TIGER-rom creatinguded five deroving the quunities acrosbility benefificult to meality through odal connecopulations disabilities),
There was aTo be considas emissionsands, not ime, TIGER-IIon how it furent (Office o
eview
age 6
-I and g jobs esired uality ss the it of a asure. more
ctivity (e.g.,
, and also a dered s and mpact I, had rthers of the

Livability Benchmarks Literature Review
Western Transportation Institute Page 7
Montana has been awarded two TIGER-I grants. The first, for $12 million, went to the Lake County Transportation Connectivity Project to upgrade city and county streets to help provide safe routes between and within communities for pedestrians and cyclists traveling to school and work along 30 miles of US Highway 93. The second was $3.5 million for the City of Whitefish to improve US Highway 93/2nd Street, including a new traffic signal system, additional turn lanes, Americans with Disabilities Act (ADA) improvements and upgraded water and sewer lines (USDOT, 2010b). Montana applied for but did not receive any Tiger-II grants.
Investigating where the TIGER-II funds were awarded may indicate the magnitude and nature of livability priorities nationally. Defining urban as populations greater than 50,000, TIGER-II grants were awarded as follows:
For capital grants o 17 States received grants worth $137,375, 265 for rural areas, and o 16 states received grants worth $419,202,326 for urban areas; and
For planning grants o 11 states received grants worth $1,279,850 for rural areas, and o 20 states received grants worth $8,073,079 for urban areas.
Twenty-five percent of the funds going to rural areas is relatively consistent with the population split nationally with about 20 percent of the U.S. population lives in rural areas. However, when further evaluated based on the type of project funded (Figure 2 and 3), clear differences are observed in the rural versus urban programs.
Figure 2: TIGER-II Funding Awarded by Project Type in Rural Areas
(Data Source: USDOT, 2010c)
A majority, over two-thirds, of the TIGER-II funding for rural areas went to freight projects (rail and port). Road reconstruction and improvement projects accounted for 20 percent of the
Freight Rail, 63%Roads, 20%
Ports, 9%
Complete Street, 4%
Passenger Rail, 1%Multimodal, 1% Other (Electric
Vehicle Corridor), 1%
Tiger‐II Grants (Capital) for Rural Areas

Livability Benchmarks Literature Review
Western Transportation Institute Page 8
funding. The remaining project types accounted for less than 10 percent of the funding. This is in contrast to the funding split for urban areas.
Figure 3: TIGER-II Funding Awarded by Project Type in Urban Areas
(Data Source: USDOT, 2010c)
The USDOT’s Federal Transit Administration (FTA) has identified several livability policies and provisions that form a part of its current programs, research and technical assistance (USDOT FTA, 2010). First, FTA encourages transit-oriented development (TOD), defined as “compact, mixed-use development near transit facilities with high-quality walking environments” (USDOT FTA, 2010). TOD is intended to provide housing options where individuals can walk, bike and take transit for most of their travel needs. Transit enhancement (TE) funding is available for improving transit facilities through landscaping, public art, bicycle access and storage, historic preservation and similar improvements. FTA policy on bicycle and pedestrian improvements is largely based on its policy statement by the Office of the Federal Register (2009b), which provides flexibility for FTA funding use for improving bicycle and pedestrian facilities, primarily in relation to how they connect to transit facilities. The Formula Grants for Other than Urbanized Areas (FTA 5311) program is intended to provide access to employment, health care, education and other human services in rural areas. The last livability provision discussed by FTA is its “art in transit” initiative, which allows for improved aesthetics for transit facilities.
Recently FTA offered three funding opportunities specifically identifying livability. In December 2009, it announced two grant opportunities using category 5309 discretionary funding to support livability initiatives—Bus and Bus Facilities grants and Urban Circulator Systems grants. Both included livability benefits as evaluation criteria for grant proposals. The livability evaluation criteria were nearly identical to the livability criteria in the TIGER-I grants. In May of 2010 a funding announcement went out for Alternatives Analysis from 5339 funds. The livability
Transit, 31%
Multimodal, 16%
Ports, 11%
Bridge Repair/Replacement,
11%
Freight Rail, 8%
Complete Street, 6%
Bike/Ped, 6%
Roads, 5%
Passenger Rail, 4% Other (Adaptive Signal System), 2%
Tiger‐II Grant (Capital) for Urban Areas

Livability Benchmarks Literature Review
Western Transportation Institute Page 9
evaluation criteria for this grant simply stated that priority be given to projects advancing the six livability outcomes in the USDOT-HUD-EPA partnership. The Missoula Urban Transportation District received a grant to improve its transfer facility. It is worth noting that although public transit funding may not specifically mention livability, it could be argued it is all livability-related (at least according to the national definitions) since the funding goes to improve public transit, which provides more transportation choices.
HUD manages several programs to fund affordable housing. Some reports indicate that, while housing costs in affordable housing developments are low, transportation costs can be much higher than average (Transportation for America, 2010a). HUD is working to incorporate transportation cost metrics into affordable housing projects. Additionally, HUD has offered Sustainable Communities Regional Planning Grants aimed at improving regional planning efforts that “integrate housing and transportation decisions, and increase state, regional, and local capacity to incorporate livability, sustainability, and social equity values into land use plans and zoning” (US HUD, 2010).
Montana did not receive any sustainable communities grants, but two communities in HUD’s Region 8 (Montana, Colorado, North Dakota, South Dakota, Utah and Wyoming) did. South Dakota’s Thunder Valley CDC/Oglala Sioux Tribe Consortium received nearly $1 million to develop a plan for sustainable communities within the Pine Ridge Indian Reservation. Utah also received a sustainable communities grant for Salt Lake County for $5 million to develop a regional housing plan.
An EPA program relating to livability is the Brownfields Program, which works to “prevent, assess, safely clean up, and sustainably reuse” contaminated sites or sites perceived to be contaminated (US EPA, 2010). The intent of this program is to encourage redevelopment of contaminated properties that have fallen into disuse. By studying the site and determining the extent of environmental damage and the cost of cleaning up the contamination, the risk can be removed and redevelopment of the property can move forward.
Other national policy and program efforts are mainly related to non-governmental organizations (NGOs) that provide guidance and support for livability. Two examples are the International City/County Management Association (Mishkovsky et al., 2010) and the Transportation for America organization (Transportation for America, 2010b).
Few states have implemented formal livability policies. Chapter 5 provides a summary of how six of the states surveyed are addressing livability in state programs. WSDOT is one of the few state DOTs with an official Livable Communities Policy. Its policy states WSDOT will make efforts to foster livable communities both in rural and urban settings by promoting multimodal transportation options with “a good mix of public transit, bicycle and pedestrian facilities, with adequate roadways, rail, and ferries” (WSDOT, 2010). Coordinating access to funding and developing collaborative transportation actions with community-specific values are ideals also included in the policy.
2.2.2. Montana Policies and Programs
There are several state and local plans and programs in Montana that may relate to livability, at least as it is currently being defined on the national scale. These plans are discussed briefly here. Because one of the underlying themes of the national livability definition includes coordinating
Livability Benchmarks Literature Review
Western Transportation Institute Page 10
across agencies and leveraging funding, awareness of livability-related projects at all levels is important.
MDT’s statewide transportation plan is called TranPlan 21. TranPlan 21 has six key policies, most of which have aspects that could be related to livability ideals. The policies include Access Management and Land Use Planning, Bicycle and Pedestrian Access, Economic Development, Public Transportation, Roadway System Performance and Traveler Safety (Cambridge Systematics, 2008).
Montana also has a Climate Change Action Plan, which makes 13 policy recommendations in the land use and transportation area (Montana Governor’s Climate Change Advisory Committee, 2007). Many of these recommendations relate to improving vehicle fuel efficiency and emission reduction. One of these recommendations, the growth and development bundle, includes elements that are included in the national discussion of livability. This bundle of recommendations includes:
Infill, densification and brownfield redevelopment; Mixed-use and transit-oriented development; Smart growth planning, modeling and tools; Targeted open space protection; Expanding transit infrastructure and service; and Expanding transportation choices.
The 2006–2010 Montana Nutrition and Physical Activity (NAPA) State Plan to Prevent Obesity and Other Chronic Diseases is another statewide plan that may relate to livability. The plan was funded by the Centers for Disease Control and Prevention through the Montana Department of Public Health and Human Services. Half of adult Montana residents are overweight or obese. In order to increase physical activity among Montanans, the plan recommends “[e]ncouraging developments with a more traditional neighborhood design, such as streets connected in a more grid-like style with sidewalks/bike lanes and trees and stores make walking and biking an easier, safer, more convenient and more enjoyable choice” (Montana NAPA, 2006).
Montana’s larger cities have thoroughly developed transportation and/or land use plans. Bozeman (City of Bozeman, 2009; Robert Peccia and Associates, 2007), Missoula (Wilbur Smith Associates, 2008) and Billings (Cambridge Systematics, 2010) are examples of cities with transportation plans that may address livability through transportation goals related to land use, housing and economic development, bike and pedestrian transportation and railroad planning.
The City of Great Falls is currently developing a Downtown Revitalization Plan. The plan aims to improve downtown livability, character, accessibility and vitality by “bringing people, events, and business back into the downtown area and positioning it as the city center for commerce, entertainment, and culture” (KRTV News, 2010).
2.3. Livability Project Examples
This section provides specific project or local policy examples typically associated with livability as defined in the national discussion. This is by no means an exhaustive list, but is intended to provide examples of various types of initiatives at the local or project level that could be related to livability.

Livability Benchmarks Literature Review
Western Transportation Institute Page 11
2.3.1. Incorporating Livability Principles in Local Policies
Context sensitive solutions (CSS) is a process for incorporating local community values into transportation projects. One example is the reconstruction of State Route 69 in Boulder, Montana, population 1,300. Route 69 includes Main Street in Boulder. The project incorporated landscaping, decorative gates, colored concrete, period lighting and ADA and pedestrian improvements.
2.3.2. Local Land Use Planning
Using scenario planning and holding more than 200 workshops with over 20,000 Utah residents, the Envision Utah project allowed members of the public to determine what was important to them in terms of livability. Changing development strategies to reduce sprawl and preserve rural landscapes was one way this process ensured the citizens of Utah planned the future of their communities in a way that aligned with their livability values (Toth, 2010).
As defined nationally, land use planning is important to creating livable communities. Land use planning is not a transportation activity, but this example is included because transportation and land use planning are often interrelated.
2.3.3. Intercity Bus to Connect Rural Communities
Frontier and rural communities in north central Montana needed reliable public transportation within small towns and from small towns to regional hubs to allow residents to pursue employment, educational opportunities, medical needs, recreational activities and other activities. Access to transportation services is a key to sustaining the livelihood and enhancing the quality of life in smaller communities in this region. In August 2009, with the help of MDT through the FTA 5311 fund, the North Central Montana Transit (NCMT) system initiated a transit service for communities in the region that connects Havre, the largest city, with a population of 9,656, to Harlem, Chinook and the Fort Belknap Indian Reservation in Blaine County, and to Box Elder and Laredo in Rocky Boy’s Native American Reservation. In addition, NCMT provides service from all of these communities to Great Falls, Montana, 114 miles from Havre. Great Falls is the only major urban center in the area, with larger medical, educational and commercial facilities (Kack, 2010).
2.3.4. Local Transit Service
An example of a local transit service that can improve livability for a community is the Valley County Transit service, which offers service in and around Glasgow Montana. The service was opened to the general public in 1980 and is funded by Valley County, FTA, donations, fares, and private funding. The service is available daily and boasts 24-hour service on holidays and by reservation year round. The buses are ADA accessible and medical trips to larger communities like Billings and Williston, North Dakota, are made once every few weeks. In 2010, Valley County Transit gave nearly 64,000 rides and averaged 175 rides per day (Valley County Transit, 2010).
2.3.5. Incorporating Local Community Values
The US Highway 93 Evaro to Polson project is a Montana project that relates to livability by incorporating community values in transportation project designs. This highway is largely
Livability Benchmarks Literature Review
Western Transportation Institute Page 12
located within the Flathead Indian Reservation. This tribe promotes the principle of considering the next seven generations of people who will use the land when making plans that impact the land (in this case, reconstruction of a highway). This led to the inclusion of several wildlife crossing structures, wildlife fencing, interpretive signing, aesthetic improvements and a smaller roadway footprint on the project (USDOT-FHWA, MDT and CSKT, 2000).
2.3.6. Safe Routes to School
Safe Routes to School (SRTS) is a federally funded transportation program aimed at making it safer and more convenient for K–8 students of all abilities to walk and bike to school. Montana’s SRTS program is a competitively awarded program administered by MDT. Eligible applicants for SRTS infrastructure funding include local and tribal governments and school districts. Eligible applicants for non-infrastructure funding include state, tribal, local and regional government agencies, school districts, private schools and nonprofit organizations.
Non-infrastructure activities educate students and encourage them to walk and bike to school. Programs such as mileage clubs, walking school buses and bike trains, as well as incentive programs encourage kids to choose active transportation as their way to school. Infrastructure projects focus on increasing safety by constructing crosswalks, sidewalks, pathways and bike racks. Frontier communities such as Shelby, Scobey, Sidney, Lewistown, Arlee, Ronan and Plevna have obtained funding for these efforts.
2.4. Measuring Livability Progress
Only a few metrics were found in the literature to measure livability from a transportation related perspective. WSDOT has posed the following question as a way to measure the effectiveness of its state’s livability policies: “What is the degree to which local governments are achieving the vision in their comprehensive plans, specifically the effect of allocation of land use and their achievement of density goals?” (WSDOT, 2010). WSDOT will survey twice a year to determine how satisfied the public is with the implementation of community-based designs.
The Housing plus Transportation Affordability Index was developed by the Center for Neighborhood Technology (CNT) and the Center for Transit-Oriented Development (CTOD). The index measures affordability not just of housing but of housing plus transportation costs. A typical housing affordability map would show locations in an area where housing costs are below 30 percent of the area’s median income. The index developed adds an estimated transportation cost based on the location (e.g. distance from the city center) and access to transit, but uses 45 percent of the median income as the threshold. The index has information from most urban areas around the country, including three Montana urban areas: Billings, Great Falls and Missoula. The index incorporates information on housing and transportation costs, automobiles per household, vehicle-miles traveled, transit ridership and commute times among other things (CNT, 2010).
Vemuri and Costanza (2006) developed a model predicting life satisfaction using two United Nations indices. One index, called “ecosystems services product,” is a measure of natural land cover. The other is the human development index, which is a combined measure of life expectancy, literacy and standard of living. These indices explained 72 percent of the variability in reported life satisfaction for 56 countries. Though the model does not include transportation infrastructure, it shows how quality of life could be estimated and tracked using some measurable data.

Livability Benchmarks Demographic Information
Western Transportation Institute Page 13
3. DEMOGRAPHIC INFORMATION
Understanding the unique character of Montana will help identify livability needs for the state. This chapter includes general demographic and infrastructure data to help quantify the potential measures of livability of Montana, particularly as they relate to transportation. When possible and pertinent, the same statistics are shown for the neighboring states (North Dakota, South Dakota, Wyoming and Idaho) and the nation for comparison.
The first section, general population and essential services, includes general population trends, geography and access to health care facilities. The transportation infrastructure section includes information about Montana’s roads, airports, freight, safety, vehicle registration data, commuting information and transportation energy information. The last section, alternative modes of transportation, includes public transportation and air and rail service information for the state of Montana.
3.1. General Population and Essential Services
Population statistics such as projections, age distribution and total population comprise the first section of demographic information analyzed. Also in this section are data on hospital and physician availability.
3.1.1. Population
According to 2009 estimates, Montana population totaled 974,989. Between 2000 and 2009, Montana population increased by 7.9 percent. This is comparable to the national population growth rate of 8.8 percent (Figure 4). According to the U.S. Census, Montana population is projected to be around 1,044,898 by 2030 (U.S. Census, 2010).
Figure 4: Percent Growth from 2000 to 2009 (Data Source: U.S. Census, 2010)
Although statewide population growth was positive, census estimates show 34 of Montana’s 56 counties had negative growth from 2000 to 2009 (Figure 5).
7.9
18.9
0.9
7.5
10.28.8
0
2
4
6
8
10
12
14
16
18
20
Montana Idaho N. Dakota S. Dakota Wyoming U.S.
Per
cen
tage
In
crea
se
Growth by State 2000-2009

Livability
Western
Fig
This genemountain
Figur
y Benchmar
Transportati
gure 5: Mon
eral growth n region incr
e 6: Montan
ks
ion Institute
ntana Coun
trend is expereasing while
na County P
nty Populati
ected to conte the eastern
Population G
on Growth
tinue for Mon region’s po
Growth Pro
Rate (Data
ontana with topulation dec
ojections (D
Demogra
a Source: CE
the populaticreases (Figu
Data Source:
aphic Inform
Pag
EIC, 2010)
on of the weure 6).
: CEIC, 201
mation
ge 14
estern
10)

Livability Benchmarks Demographic Information
Western Transportation Institute Page 15
In 2010, Montana’s population was 50 percent male and 50 percent female with a median age of 39 years. Children under 18 years of age accounted for 22.5 percent of the population and 14.6 percent of the population is over age 65 (Figure 7).
Figure 7: Population Over 65 Years of Age (Data Source: U.S. Census, 2010)
Montana is also aging. By 2030, the share of the population 65 and older is projected to be 25.8 percent (Figure 8), the third highest percentage in the nation after Wyoming and New Mexico.
Figure 8: Projected Population Over 65 Years of Age (Data Source: U.S. Census, 2010)
3.1.2. Population Density
Statewide population density in Montana is estimated to be 6.7 people per square mile in 2009, similar to neighboring states but much lower than the national average of 86.8 people per square mile (Figure 9).
14.6
12.0
15.314.6
14.013.0
0
2
4
6
8
10
12
14
16
18
Montana Idaho N. Dakota S. Dakota Wyoming U.S.
Per
cen
tage
Percent of Over 65 Population 2009 Estimate
25.8
18.3
25.123.1
26.5
19.7
0
5
10
15
20
25
30
Montana Idaho N. Dakota S. Dakota Wyoming U.S.
Per
cen
tage
Percent of Over 65 Population 2030 Estimate

Livability
Western
Populatiofewer peper squarmile, and10).
Peo
ple
per
sq
Mile
y Benchmar
Transportati
Figur
on density iople per squre mile. Six
d only five o
Figur
6.7
0
10
20
30
40
50
60
70
80
90
100
Mont
pp
q
ks
ion Institute
re 9: Popula
s not uniforuare mile andx of 56 counof 56 countie
e 10: Popul
7
18.7
ana Idah
ation Densit
rm across Md 22 of 56 cnties (11 peres (9 percent
lation Densi
7
9.4
ho N. Dak
Population D
ty (Data Sou
Montana; 23 ounties (39 rcent) had bt) had more t
ity (Data So
10.7
kota S. Dak
Density by Sta
urce: U.S. C
of 56 counpercent) had
between 6.1 than 20.1 pe
ource: U.S. C
75.6
kota Wyom
ate 2009
Demogra
Census, 2010
nties (41 perd between 2
and 20.0 people per squ
Census, 201
86.8
ming U.S.
aphic Inform
Pag
0)
rcent) had 2.1 and 6.0 p
people per square mile (F
10)
.
mation
ge 16
2.0 or eople quare
Figure
Livability
Western
Using a hcommun
Figu
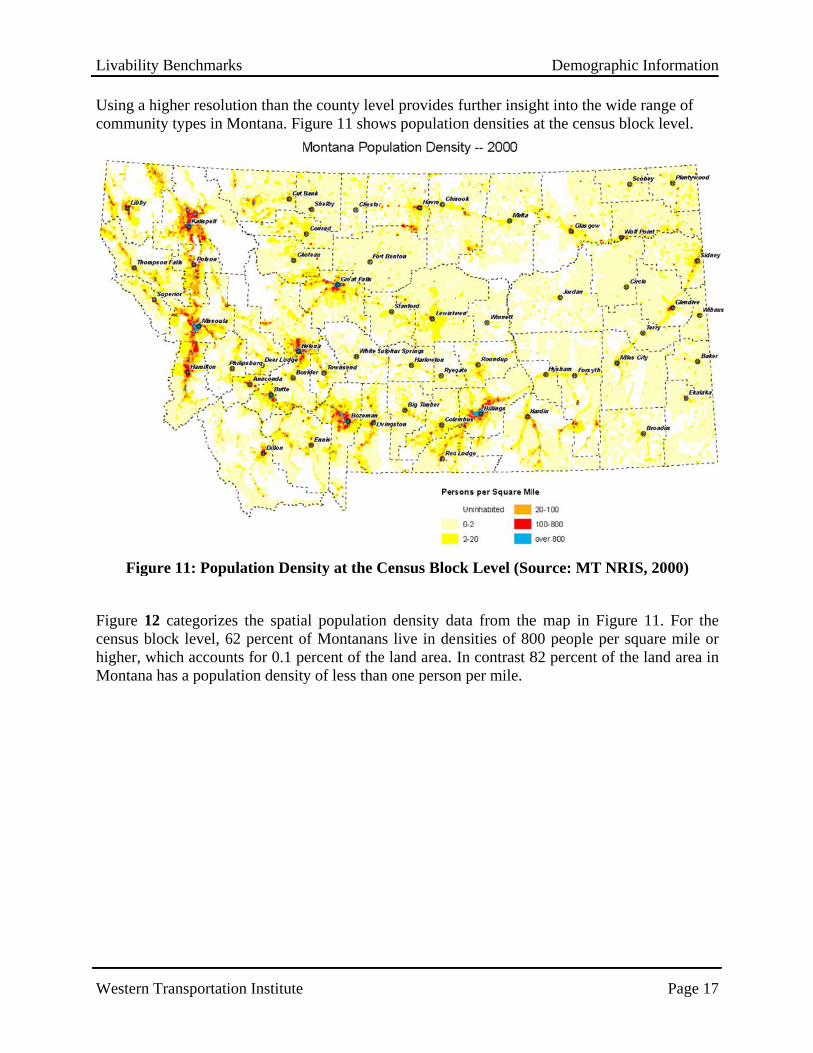
Figure 1census bhigher, wMontana
y Benchmar
Transportati
higher resoluity types in M
ure 11: Popu
2 categorizelock level, 6
which accouna has a popul
ks
ion Institute
ution than thMontana. Fi
ulation Den
es the spatia62 percent onts for 0.1 plation density
he county levgure 11 show
nsity at the C
al populationof Montananercent of they of less than
vel provides ws populatio
Census Bloc
n density dans live in dene land area. n one person
further insigon densities
ck Level (So
ata from thensities of 80In contrast 8n per mile.
Demogra
ght into the wat the censu
ource: MT N
e map in Fi00 people pe82 percent o
aphic Inform
Pag
wide range ous block leve
NRIS, 2000)
igure 11. Foer square mi
of the land ar
mation
ge 17
of el.
)
or the ile or rea in
Livability Benchmarks Demographic Information
Western Transportation Institute Page 18
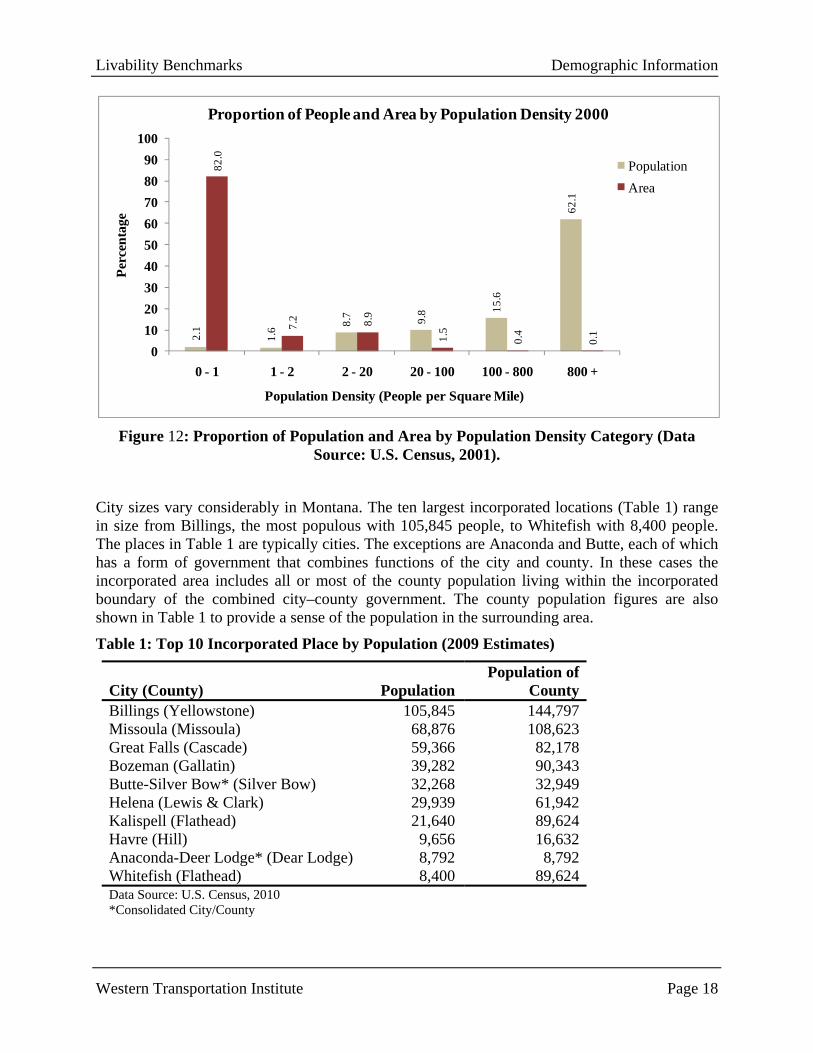
Figure 12: Proportion of Population and Area by Population Density Category (Data Source: U.S. Census, 2001).
City sizes vary considerably in Montana. The ten largest incorporated locations (Table 1) range in size from Billings, the most populous with 105,845 people, to Whitefish with 8,400 people. The places in Table 1 are typically cities. The exceptions are Anaconda and Butte, each of which has a form of government that combines functions of the city and county. In these cases the incorporated area includes all or most of the county population living within the incorporated boundary of the combined city–county government. The county population figures are also shown in Table 1 to provide a sense of the population in the surrounding area.
Table 1: Top 10 Incorporated Place by Population (2009 Estimates)
City (County) PopulationPopulation of
County Billings (Yellowstone) 105,845 144,797 Missoula (Missoula) 68,876 108,623 Great Falls (Cascade) 59,366 82,178 Bozeman (Gallatin) 39,282 90,343 Butte-Silver Bow* (Silver Bow) 32,268 32,949 Helena (Lewis & Clark) 29,939 61,942 Kalispell (Flathead) 21,640 89,624 Havre (Hill) 9,656 16,632 Anaconda-Deer Lodge* (Dear Lodge) 8,792 8,792 Whitefish (Flathead) 8,400 89,624 Data Source: U.S. Census, 2010 *Consolidated City/County
2.1
1.6
8.7 9.8 15
.6
62.1
82.0
7.2 8.9
1.5
0.4
0.1
0
10
20
30
40
50
60
70
80
90
100
0 - 1 1 - 2 2 - 20 20 - 100 100 - 800 800 +
Per
cen
tage
Population Density (People per Square Mile)
Proportion of People and Area by Population Density 2000
Population
Area

Livability Benchmarks Demographic Information
Western Transportation Institute Page 19
The largest counties show a similar population disparity. Yellowstone County population is estimated to be 144,797, making it the largest in the state (Table 2). Lincoln County is ranked 10th, with 18,717 people. The least populated of Montana’s 56 counties is Petroleum County with 440 people.
Table 2: Top 10 Counties by Population (2009 Estimates)
Counties PopulationYellowstone 144,797Missoula 108,623Gallatin 90,343Flathead 89,624Cascade 82,178Lewis & Clark 61,942Ravalli 40,431Silver Bow 32,949Lake 28,605Lincoln 18,717
Data Source: U.S. Census, 2010
To further categorize Montana residents by size of community, populations were distributed among communities designated by categories defined by Montana Code Annotated as urbanized (>50,000), small urban (5,000–50,000) and rural (<5,000). Populations of communities in the first two categories are listed in Appendix A.
Montana has three urbanized areas: Billings, Missoula, and Great Falls. These urbanized areas have populations greater than 50,000 (see Table 1).
Fourteen communities have a population of at least 5,000 people but fewer than 50,000. These communities are known as small urban areas. Note that by USDOT definitions these would be considered rural communities since they are under 50,000. Bozeman is the most populated small urban area, with 39,282 people, and Polson is the smallest, with 5,231 people.
There are 112 incorporated areas in Montana (towns, cities, or villages) categorized as rural areas (smaller than 5,000). Hamilton is the largest rural incorporated community, with 4,974 people, and Ismay is the smallest, with 25 residents. These rural incorporated areas combine with the unincorporated areas of the state to comprise 56 percent of the population.
The proportions of the population in Montana living in the three classifications described (urbanized areas, small urban areas, and rural areas) are shown in Figure 13.

Livability Benchmarks Demographic Information
Western Transportation Institute Page 20
Figure 13: Population by Community Size (Data Source: U.S. Census, 2010)
3.1.3. Montana Health Care Facilities
Access to quality health care for Montana citizens could be considered a measure of livability. Further, this could be related to transportation, particularly access to transit services. Local transit service may be important to provide access to nearby health care facilities. Intercity transit service may also be important since Montana’s rural nature means many residents need to travel long distances for health care services. The measure of a community’s health care is tied to the number of physicians and health care facilities serving the community. Family medicine practitioners (primary care physicians) play an important role in a rural state like Montana. Montana ranks 35th nationally in the number of family medicine physicians per capita, with 87 per 100,000 people. The national average is 120 per 100,000 people (Montana AHEC, 2010). Montana has nine counties with no physicians in active practice (Table 3). Moreover, five of the nine counties do not have any local public transportation system. More than 20 percent of the population of these counties is currently 65 years or older.
24 (
234,
087
Peo
ple)
20 (
196,
947
Peo
ple)
56 (
543,
955
Peo
ple)
0
10
20
30
40
50
60
Urbanized Areas (50,000+)
Small Urban Areas (5,000-49,999)
Rural Areas (<5,000)
Population By Category 2009P
erce
nta
ge

Livability Benchmarks Demographic Information
Western Transportation Institute Page 21
Table 3: Elderly Population and Transit Access for Counties with No Physicians
Counties Population
Estimates 2009
65 or Older Population
Estimates 2009
Public Transportation
System Hospital Carter 1,202 248 (20.6%) Yes Yes Garfield 1,173 212 (18.1%) Yes Yes Golden Valley 1,057 226 (21.4%) Yes No Judith Basin 2,051 429 (20.9%) No No McCone 1,624 354 (21.8%) No Yes Petroleum 440 94 (21.4%) No No Powder River 1,664 356 (21.4%) Yes No Treasure 612 139 (22.7%) No No Wibaux 897 218 (24.3%) No No
Data Source: Montana AHEC, 2010.
Six of the nine counties listed in Table 3 do not have a hospital located within the county. Jefferson County, not listed in the table, has no hospital, but does have a physician. Some specialized medical needs can only be handled in larger hospitals. Access to these specialized services can require long travel distances for some rural communities in Montana. The American College of Surgeons (2010) categorizes hospitals according to their capabilities related to trauma care, with level one being the highest level of care available. Although specific to trauma care, this categorization is used by the industry to provide a measure of general capabilities available at a hospital. There are no level-one trauma centers in Montana. Billings, Great Falls and Missoula each have a level-two trauma center. Bozeman, Butte and Kalispell have level-three trauma centers (Figure 14). The remaining 44 counties in Montana have some sort of hospital or clinic.

Livability
Western
Figure
3.2. T
This sectAlso coninformati
3.2.1. TA majoriAdministthe lowemeasure present s
y Benchmar
Transportati
e 14: Major
Transport
tion containnsidered withion and trans
Transportat
ity of roads itration (FHW
est number oof how smerviceability
ks
ion Institute
Medical Fa
tation Infr
ns informatiohin this sectisportation en
tion Infrast
in Montana WA) reportinof roads in ooth the pav
y.
acilities (Dat
rastructur
on about Mion is infrastnergy inform
tructure of
are rated in ng requiremmediocre o
vement surf
ta Source: A
re
Montana’s rotructure safe
mation.
f Montana
good or veryments. Compor poor condface is using
American C
oads, airportety, vehicle
y good condared to surrdition (Figug the intern
Demogra
College of Su
s, and freigregistration
dition under rounding stature 15). Roaational roug
aphic Inform
Pag
urgeons, 20
ght infrastrucdata, comm
Federal Hightes, Montanad conditionghness index
mation
ge 22
10)
cture. muting
hway na has n is a x and
Livability Benchmarks Demographic Information
Western Transportation Institute Page 23
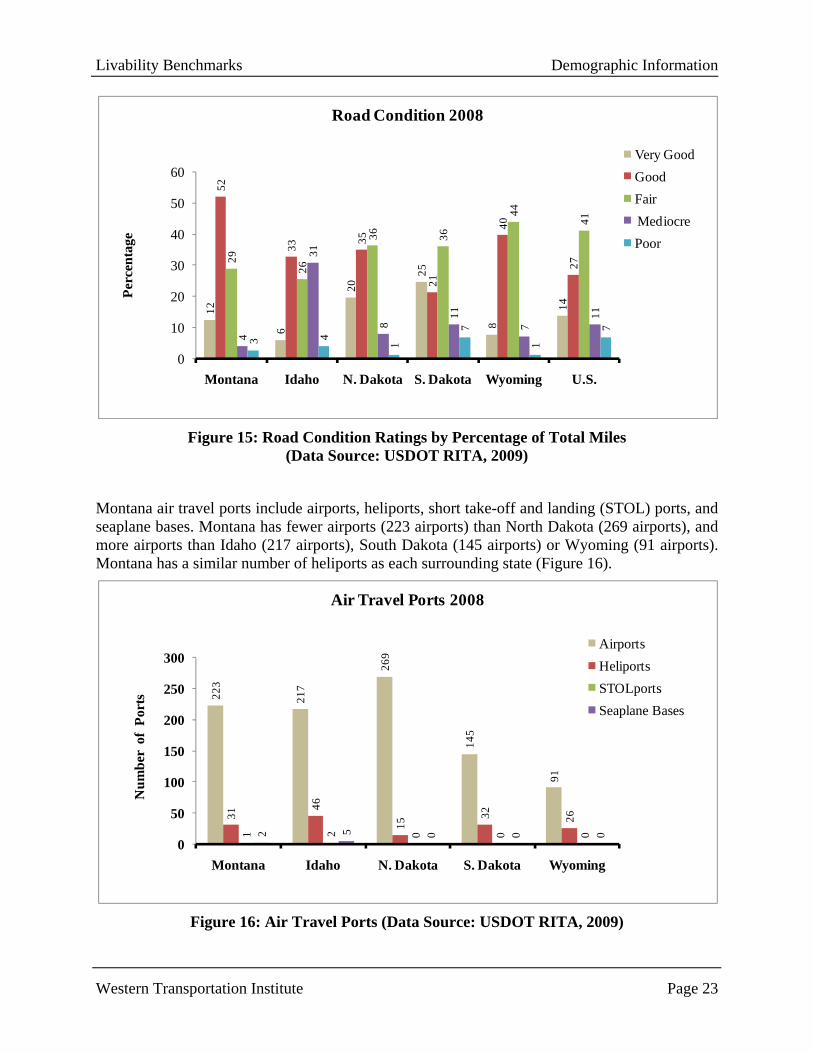
Figure 15: Road Condition Ratings by Percentage of Total Miles (Data Source: USDOT RITA, 2009)
Montana air travel ports include airports, heliports, short take-off and landing (STOL) ports, and seaplane bases. Montana has fewer airports (223 airports) than North Dakota (269 airports), and more airports than Idaho (217 airports), South Dakota (145 airports) or Wyoming (91 airports). Montana has a similar number of heliports as each surrounding state (Figure 16).
Figure 16: Air Travel Ports (Data Source: USDOT RITA, 2009)
12
6
20
25
8
14
52
33
35
21
40
2729
26
36 36
44
41
4
31
8
11
7
11
3 4
1
7
1
7
0
10
20
30
40
50
60
Montana Idaho N. Dakota S. Dakota Wyoming U.S.
Per
cen
tage
Road Condition 2008
Very Good
Good
Fair
Mediocre
Poor
223
217
269
145
91
31
46
15
32 26
1 2 0 0 02 5 0 0 0
0
50
100
150
200
250
300
Montana Idaho N. Dakota S. Dakota Wyoming
Air Travel Ports 2008
Airports
Heliports
STOLports
Seaplane Bases
Nu
mb
er o
f P
orts

Livability Benchmarks Demographic Information
Western Transportation Institute Page 24
Montana has the lowest number of freight shipments originating in the state in terms of dollar value compared to surrounding states, but it is third in tonnage and second in ton-miles (Figure 17).
Figure 17: Annual Freight Shipments by State of Origination (Data Source: USDOT RITA, 2009)
3.2.2. Safety
In 2008, Montana had 209 traffic fatalities. Total fatality figures from Montana and other states are shown in Figure 18. These figures may provide a benchmark but are not an adequate standard for comparing of the safety of Montana’s roads with other states due to differences in population and road mileage.
21,5
83
38,4
52
26,7
43
26,6
77
23,7
5385,2
44
46,5
84 95,6
71
52,0
93
550,
886
62,6
20
20,1
53
31,7
00
21,2
68
559,
160
0
100000
200000
300000
400000
500000
600000
Montana Idaho N. Dakota S. Dakota Wyoming
Freight Shipments 2007
Value ($ Millions)
Tons (Thousands)
Ton-Miles (Millions)

Livability Benchmarks Demographic Information
Western Transportation Institute Page 25
Figure 18: Total Road Fatalities (Data Source: USDOT RITA, 2009)
3.2.3. Mobility
Montana has more workers per capita than the national average but fewer than North Dakota, South Dakota, or Wyoming (Figure 19).
Figure 19: Workers per Capita (Data Source: USDOT RITA, 2009)
229 232
104119
159
0
50
100
150
200
250
Montana Idaho N. Dakota S. Dakota Wyoming
Fat
alit
ies
Fatalities 2008
0.490.47
0.54 0.52 0.52
0.47
0.00
0.10
0.20
0.30
0.40
0.50
0.60
Montana Idaho N. Dakota S. Dakota Wyoming U.S.
Wor
ker
s p
er C
apit
a
Workers per Capita by State 2008

Livability Benchmarks Demographic Information
Western Transportation Institute Page 26
Montana has the lowest percentage of people who report driving to work alone in a vehicle (72.8 percent) compared to surrounding states, and a slightly lower percentage than the national average (75.5 percent). Montana and the surrounding states all have a substantially smaller percentage of commuters using public transportation than the national average of five percent (Figure 20). In Montana, 11.4 percent of the people commute in a car, truck, or van pool, slightly higher than the national average (10.7 percent). Montana’s performance is higher than surrounding states and the nation as a whole for other transportation management strategies such as walking (5.5 percent) and working at home (6.5 percent). Nationally 2.8 percent walk to work and 4.1 percent report working from home.
Figure 20: Commuting by Mode (Data Source: USDOT RITA, 2009)
Montana and the surrounding states all have shorter average travel times to work than the national average by at least five minutes (Figure 21). Idaho’s commute time is five minutes less than the national average of 25.5 minutes, while Montana’s is 7.4 minutes less and North Dakota’s is nearly 10 minutes less.
72.8
74.1 77
.8
78.2
74.9
75.5
11.4
12.9
10.0
9.8 12
.7
10.7
1.1
1.0
0.6
0.5
1.3 5.
0
5.5
3.2
3.7
4.6
3.9
2.8
2.7
3.6
1.7
1.6
2.4
1.86.
5
5.3
6.1
5.2
5.0
4.1
0
10
20
30
40
50
60
70
80
90
Montana Idaho N. Dakota S. Dakota Wyoming U.S.
Per
cen
tage
Commuting by Mode 2008
Car, Truck or Van Drove Alone Car, Truck or Van Carpooled
Public Transportation (Excluding Taxicab) Walked
Taxi, Motorcycle, Bicycle, or Other Worked at Home

Livability Benchmarks Demographic Information
Western Transportation Institute Page 27
Figure 21: Mean Travel Time to Work (Data Source: USDOT RITA, 2009)
Montana, with 1.05 registered vehicles per capita, has a vehicle ownership rate higher than the national average of 0.83 vehicles per person. Per capita vehicle ownership is even greater in North Dakota (1.14 vehicles), South Dakota (1.18 vehicles) and Wyoming (1.26 vehicles). Idaho has slightly more registered vehicles per capita than the nation, with 0.89 vehicles (Figure 22).
Figure 22: Registered Vehicles per Capita (Data Source: USDOT RITA, 2009)
17.920.2
16.0 16.418.7
25.5
0
5
10
15
20
25
30
Montana Idaho N. Dakota S. Dakota Wyoming U.S.
Min
utes
Mean Travel Time to Work 2008
1.05
0.89
1.14 1.181.26
0.83
0.00
0.25
0.50
0.75
1.00
1.25
1.50
Montana Idaho N. Dakota S. Dakota Wyoming U.S.
Veh
icle
s
Registered Vehicles per Capita 2008

Livability Benchmarks Demographic Information
Western Transportation Institute Page 28
Montana has the most licensed drivers per capita (0.764 drivers) of all surrounding states, and substantially more than the national average (0.685 drivers) (Figure 23).
Figure 23: Licensed Drivers per Capita (Data Source: USDOT RITA, 2009)
Montana has similar numbers of registered semi-truck tractors, vans and SUVs as surrounding states. Montana has more pickup trucks than North Dakota and South Dakota but fewer than Idaho or Wyoming. Montana has many more “other light” registered vehicles (139,000) than all surrounding states, each of which has fewer than 40,000 (Figure 24).
Figure 24: Truck Registration (Data Source: USDOT RITA, 2009)
0.764
0.681
0.7370.743
0.759
0.685
0.640
0.660
0.680
0.700
0.720
0.740
0.760
0.780
Montana Idaho N. Dakota S. Dakota Wyoming U.S.
Dri
vers
Licensed Drivers per Capita 200820 16 9 19 5
262
394
168 18
4
278
50
77
47 57
41
138
217
84
107
153
139
4
40
2 6
0
100
200
300
400
Montana Idaho N. Dakota S. Dakota Wyoming
Veh
icle
s (T
hou
san
ds)
Truck Registration 2008
Truck TractorsPickupsVansSUVOther Light

Livability Benchmarks Demographic Information
Western Transportation Institute Page 29
In 2008, Montana reported a similar number of vehicle-miles traveled (VMT) per capita (11,176 miles) as all surrounding states except Wyoming (17,735). However, the national per capita VMT of 9,779 miles is less than each of these states (Figure 25).
Figure 25: Vehicle-Miles Traveled (Data Source: USDOT RITA, 2009)
Montana has more transit systems per capita than the national average, and the most among surrounding states (Figure 26). This is the sum of all transportation establishments including public transit, urban transit centers, chartered buses, school buses, interurban buses, and taxi services. Not included are scenic tour buses, sightseeing buses, and car pool services.
Figure 26: Transit Systems (Data Source: USDOT RITA, 2009)
11,8
61
10,4
84
11,8
04
11,1
25
18,4
57
9,96
1
11,1
76
10,0
08 12,1
91
11,1
74
17,7
35
9,77
9
0
10000
20000
Montana Idaho N. Dakota S. Dakota Wyoming U.S.
Veh
icle
Mile
s T
rave
led
Vehicle Miles Traveled per Capita 2003, 2008
2003
2008
108
62
9083
6860
0
20
40
60
80
100
120
Montana Idaho N. Dakota S. Dakota Wyoming U.S.Tra
nsi
t E
stab
lish
men
ts p
er M
illio
n
Peo
ple
Total Transit and Ground Transportation Establishments per Million People 2007

Livability Benchmarks Demographic Information
Western Transportation Institute Page 30
State and local governments in Montana spend $843 per person on transportation, a figure similar to what is spent in North Dakota and South Dakota. Idaho spends $572 per person. The national average is $718. Wyoming spends much more per capita on transportation than surrounding states or the national average. Spending on transit, however, is much lower per capita in Montana and surrounding states than the national average of $156 (Figure 27).
Figure 27: Annual Government Transportation Expenditures (Data Source: USDOT RITA, 2009)
3.2.4. Transportation Energy
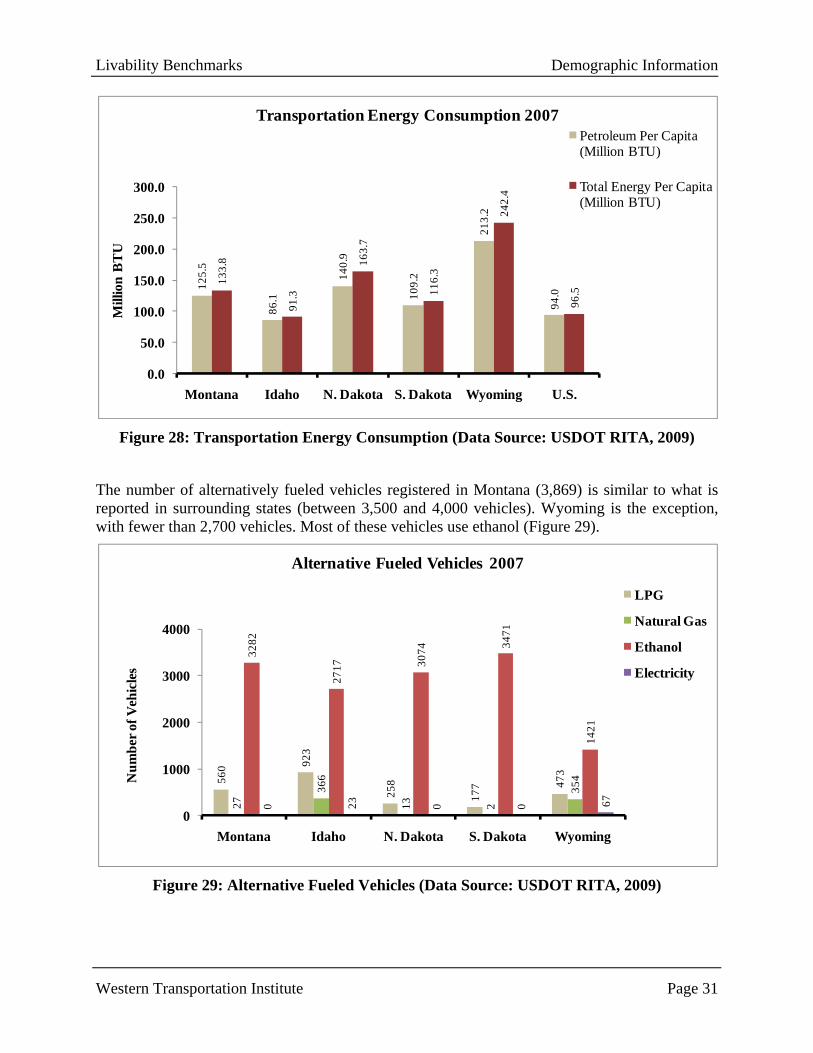
Montana consumes more transportation energy per capita (134 million BTU) than the national average (97 million BTU). However, this is only about only half as much as Wyoming (242 million BTU). Idaho uses slightly less than the national average of transportation energy per capita (91.3 million BTU) (Figure 28).
843
572
1038
974
1224
71876
4
528
937
919
1117
481
14 8 16 11 8
156
64 35
86 42
99 66
0
200
400
600
800
1000
1200
1400
Montana Idaho N. Dakota S. Dakota Wyoming U.S.
Dol
lars
Transportation Expenditures per Capita 2007
Total
Highway
Transit
Air
Livability Benchmarks Demographic Information
Western Transportation Institute Page 31
Figure 28: Transportation Energy Consumption (Data Source: USDOT RITA, 2009)
The number of alternatively fueled vehicles registered in Montana (3,869) is similar to what is reported in surrounding states (between 3,500 and 4,000 vehicles). Wyoming is the exception, with fewer than 2,700 vehicles. Most of these vehicles use ethanol (Figure 29).
Figure 29: Alternative Fueled Vehicles (Data Source: USDOT RITA, 2009)
125.
5
86.1
140.
9
109.
2
213.
2
94.0
133.
8
91.3
163.
7
116.
3
242.
4
96.5
0.0
50.0
100.0
150.0
200.0
250.0
300.0
Montana Idaho N. Dakota S. Dakota Wyoming U.S.
Mill
ion
BT
UTransportation Energy Consumption 2007
Petroleum Per Capita (Million BTU)
Total Energy Per Capita (Million BTU)
560 92
3
258
177 47
3
27
366
13 2
354
3282
2717 30
74
3471
1421
0 23 0 0 67
0
1000
2000
3000
4000
Montana Idaho N. Dakota S. Dakota Wyoming
Nu
mb
er o
f V
ehic
les
Alternative Fueled Vehicles 2007
LPG
Natural Gas
Ethanol
Electricity

Livability
Western
3.3. A
This sectinformatifound.
3.3.1. PTypicallymost coutransport
While ltransportcities/towbus stop bus stops(Greyhouare connconnectin
y Benchmar
Transportati
Alternate
tion describeion is also d
Public Tran
y the more punties offer station availab
ocal transittation optionwns with an is 436,799, s for the purund, Rimrocected to theng to the n
ks
ion Institute
Modes of
es public tradiscussed. Q
nsportation
populated arsome local buble (Figure 3
Figur
t services ns between c
intercity buwhich reprerpose of thisck Stages/Tre intercity bunearest inter
Transpor
ansportationQuality bicyc
n
reas in the stus transit ser30).
re 30: Loca
provide pucities are mous stop. The
sents about s report are drailways andus service thrcity bus st
rtation
n data for thecle and pede
tate have thervice. Twelv
l Public Tra
ublic transpostly limited total popula45 percent odefined as st
d Salt Lake Chrough a rouop. For exa
e state of Mestrian facili
e most publive counties r
ansportatio
portation wto intercity
ation of the cof the populatops listed bCity Expresute providedample North
Demogra
Montana. Airity informat
ic transportareport no for
on
within commbus service.cities/towns ation (Appenby the intercss). Many md by the loch Central M
aphic Inform
Pag
r and rail setion could n
ation optionsrm of local p
munities, p. Montana hwith an inte
ndix A). Intecity bus prov
more communcal transit seMontana Tr
mation
ge 32
ervice not be
s, but public
public has 34 ercity ercity viders nities
ervice ransit,
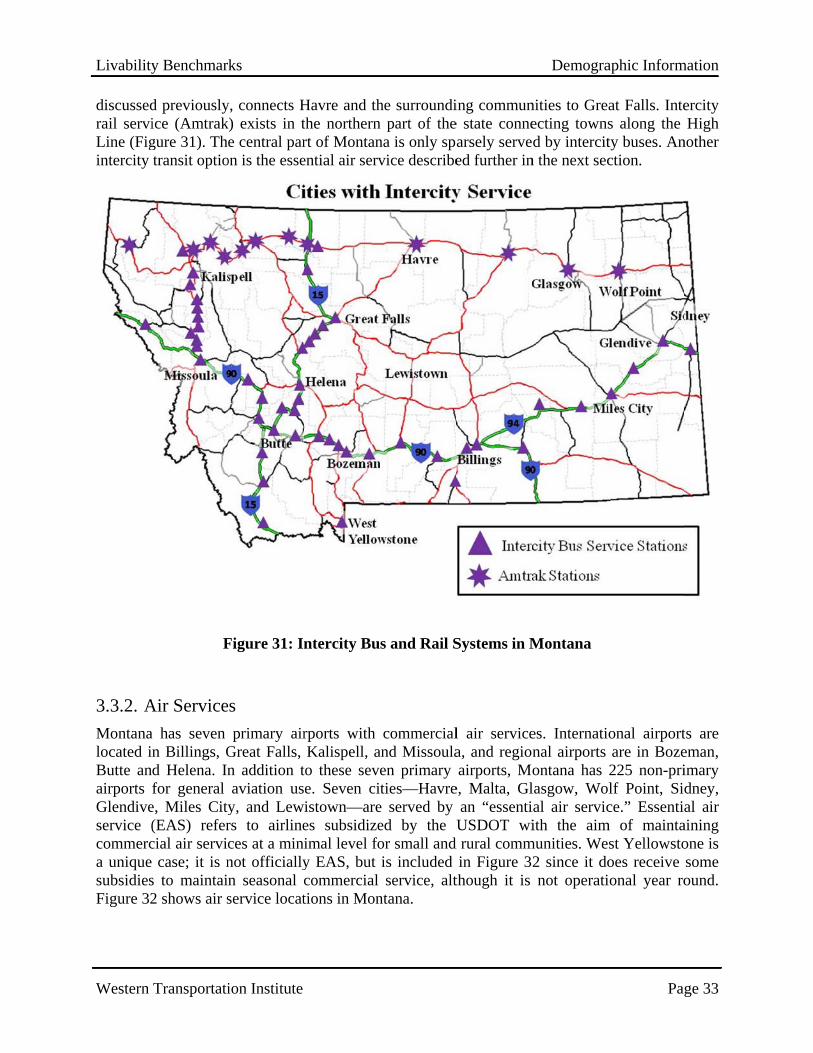
Livability
Western
discussedrail serviLine (Figintercity
3.3.2. AMontanalocated iButte anairports Glendiveservice (commerca unique subsidiesFigure 32
y Benchmar
Transportati
d previouslyice (Amtrakgure 31). Thtransit optio
F
Air Service
a has seven n Billings, Gd Helena. Infor general
e, Miles City(EAS) refercial air servic
case; it is ns to maintai2 shows air s
ks
ion Institute
y, connects Hk) exists in te central par
on is the esse
Figure 31: In
es
primary airGreat Falls, n addition taviation us
y, and Lewrs to airlineces at a mininot officiallyn seasonal cservice locat
Havre and ththe northernrt of Montanential air serv
ntercity Bu
rports with Kalispell, a
to these sevee. Seven ciistown—arees subsidizeimal level foy EAS, butcommercial tions in Mon
he surroundin part of thena is only spvice describe
s and Rail S
commercialand Missoulaen primary ties—Havre
e served by ed by the Uor small and is included service, alt
ntana.
ing commune state connearsely serveed further in
Systems in M
l air servicea, and regionairports, Mo
e, Malta, Glan “essentiUSDOT wi
d rural commin Figure 32
though it is
Demogra
nities to Greecting townsd by intercit
n the next sec
Montana
es. Internatinal airports ontana has lasgow, Woial air servicith the aim
munities. We2 since it donot operati
aphic Inform
Pag
at Falls. Intes along the ty buses. Anction.
onal airportare in Boze225 non-prilf Point, Sidce.” Essentia
m of maintast Yellowstooes receive ional year ro
mation
ge 33
ercity High
nother
ts are eman, imary dney, al air
aining one is some ound.

Livability
Western
Fi
3.4. S
MontanaThere is urbanizedfrom Bounincorp4,974, to
The rangTwenty-tlooking aone perso800 or m
From 20populatiogrew by 25.8 percresidents
y Benchmar
Transportati
igure 32: Ai
Summary
a has some ua wide ran
d areas, the zeman, withorated areas Ismay, whic
ge of commthree of the at the censuson per squar
more people p
00 to 2009, on change, T33.2 percen
cent of Mon of any state
ks
ion Institute
ir Travel (D
unique charange of comlargest of w
h 39,282 pes and small ch has just 2
munity types56 counties
s block levelre mile, whilper square m
36 of MontTreasure Cont. Montana’ntanans will e in the natio
Data Source:
acteristics thmmunity typewhich is Billeople, down incorporated
25 residents.
s can also bs in Montan, 82 percent le 62 percent
mile.
tana’s 56 coounty lost 28’s populationbe over 65;
on.
: USDOT O
hat may havees, both in lings, with 1
to Polson,d communitOver half th
be seen froma have two of the land a
t of Montana
unties repor8.9 percent n is aging. P; this will b
Office of Avi
e a bearing osize and g
105,845 peopwith 5,231
ties ranging he state’s pop
m a perspeor fewer pearea has a poa residents l
rted negativeof its popul
Projections ie the third h
Demogra
iation Analy
on its measugrowth rate. ple. Small upeople. Ruin size frompulation live
ctive of popeople per sqopulation deive in popul
e growth. Atlation while indicate thathighest prop
aphic Inform
Pag
ysis, 2010)
ures of livabThere are
urban areas rural areas inm Hamilton,es in rural ar
pulation denquare mile. Wensity of lesslation densiti
t the extremGallatin Co
t by 2030 arportion of el
mation
ge 34
bility. three range clude with
reas.
nsity. When s than ies of
mes of ounty round lderly

Livability Benchmarks Demographic Information
Western Transportation Institute Page 35
Some areas have limited access to health care. Montana has nine counties with no working physicians. Five of these nine counties have no public transportation and six of these counties have no hospitals.
Roads in Montana are in good condition compared to surrounding states. About 64.5 percent of the state’s roads are categorized by the FHWA reporting requirements as being in good or very good condition. Only 6.6 percent of the state’s roads are deemed in mediocre or poor condition, which is better than surrounding states, where the range is from 8.3 percent for Wyoming to 34.8 percent for Idaho (the national average is 16.9 percent).
When comparing Montana and the four neighboring states for freight shipments originating from the state, Montana ranks fifth, third and second in dollar value, tons and ton-miles, respectively.
Typical of rural states, Montanans tend to drive more than the national average as evidenced by higher reported VMT (11,176 per year vs. 9,779 nationally), transportation expenses ($843 per year vs. $718 nationally), and transportation petroleum energy used (126 million BTUs per year vs. 94 million BTUs nationally).
Specific to work trips, Montanans have a shorter (in time) commute, with an average of 17.9 minutes, compared to the national average of 25.5 minutes. Also, Montana has a lower percentage of people who drive to work alone (72.8 percent) than surrounding states or the national average (75.5 percent). This could be due to higher proportions of Montanans who walk to work (5.5 percent) and work at home (6.5 percent) than the national average (2.8 percent walking and 4.1 percent working at home). The shorter work travel times but higher VMT, transportation expenses and energy use could be the result of lower congestion resulting in longer distances travelled to work at faster speeds and/or less work travel combined with more non-work travel.
Montana has the most transit systems per capita (108) of all surrounding states and more than the national average (60). Yet Montana (1.1 percent) and the surrounding states all have a smaller percentage of commuters who use public transportation than the national average (5.0 percent). Montana has 34 cities/towns with intercity bus service. The total population of the cities/towns served by intercity buses is 436,799, which is about 45 percent of the population. No form of local public transportation exists in 12 counties in Montana.

Livability Benchmarks TranPlan 21 Comments
Western Transportation Institute Page 36
4. TRANPLAN 21 COMMENTS
The Montana Department of Transportation developed a statewide transportation plan in 1995 called TranPlan 21. This plan is used to develop and implement policies with input from the public, stakeholders, and others. TranPlan 21 is updated regularly with input from the public and other stakeholders through telephone surveys on perceptions of the transportation system in Montana (Bureau of Business and Economic Research, 2009). The two most recent surveys, completed in 2009 and 2007, are summarized in this chapter. The sample size of the public survey was 1,011 in 2007 and 1,222 in 2009. Responses to the TranPlan 21 survey could provide insight into the perception of Montana citizens and stakeholders on the importance of livability.
Much of the survey is composed of ordinal scale questions (e.g., rate your satisfaction with Montana’s transportation system from 1 to 10). Respondents were asked to prioritize ways to improve the transportation system, and were given 17 possible actions to choose from. Among the choices were actions to improve alternative modes of transportation, which are closely tied to the national definition of livability. “Supporting efforts to preserve existing passenger rail service” received the highest average score in 2009 and the second highest in 2007. This action and other alternative transportation mode choices are ranked in Table 4.
Table 4: TranPlan 21 Responses to Possible Improvements, Alternative Modes
Public Rank Stakeholder RankPossible Action 2007 2009 2007 2009 Support efforts to preserve existing passenger rail service 2nd 1st 5th 1st Promote use of local transit systems 6th 7th 7th 3rd Ensure adequate pedestrian facilities 9th 8th 9th 9th Increase scheduled airline service 10th 9th 8th 7th Ensure adequate bicycle facilities 15th 12th 16th 12th
The top five ranked possible improvements for 2009 are shown in Table 5. Aside from the previously mentioned top ranked improvement related to rail service, the following four improvements are related to safe, well maintained roads, which clearly affect the quality of life in Montana.
Table 5: TranPlan 21 Responses to Possible Improvements, Top Five
Public Rank Stakeholder RankPossible Action 2007 2009 2007 2009 Support efforts to preserve existing passenger rail service 2nd 1st 5th 1st Maintain road pavement condition 1st 2nd 1st 2nd Inform public about transportation issues 3rd 3rd 6th 6th Improve condition of other roads (not interstate/highway) 5th 4th 4th 4th Improve transportation safety 4th 5th 3rd 5th
The survey did not include questions specific to livability such as asking about how transportation affects affordable housing and community values. The survey did provide

Livability Benchmarks TranPlan 21 Comments
Western Transportation Institute Page 37
opportunity for comments. The following open-ended question was asked on both the public and stakeholder surveys:
Are there any other transportation-related issues you think need to be addressed by the Montana Department of Transportation?
Another question allowing an open-ended response was only asked on the public survey. This question was:
Do you have any other suggestions for ways MDT can improve the function of Montana’s roadways?
The comments provided for these questions in 2007 and 2009 were reviewed and categorized by type in order to identify potential livability needs. The following is a summary of the types of comments received.
Public responses to transportation-related issues are summarized in Table 6. These are ordered by the most common response in 2009. Caution should be used in considering the order since some categories could be combined (e.g., “safety and road design” and “wildlife vehicle collisions”), which would affect their ranking. The most common themes seen in the comments were:
improve alternative modes such as rail, bus and air travel, and bike; maintain or improve existing road condition by creating smoother surfaces and removing
potholes; improve roadways through additional lanes, wider roads (increased lane widths and
shoulder widths), bridge repairs, and more rest area access; and improve safety.
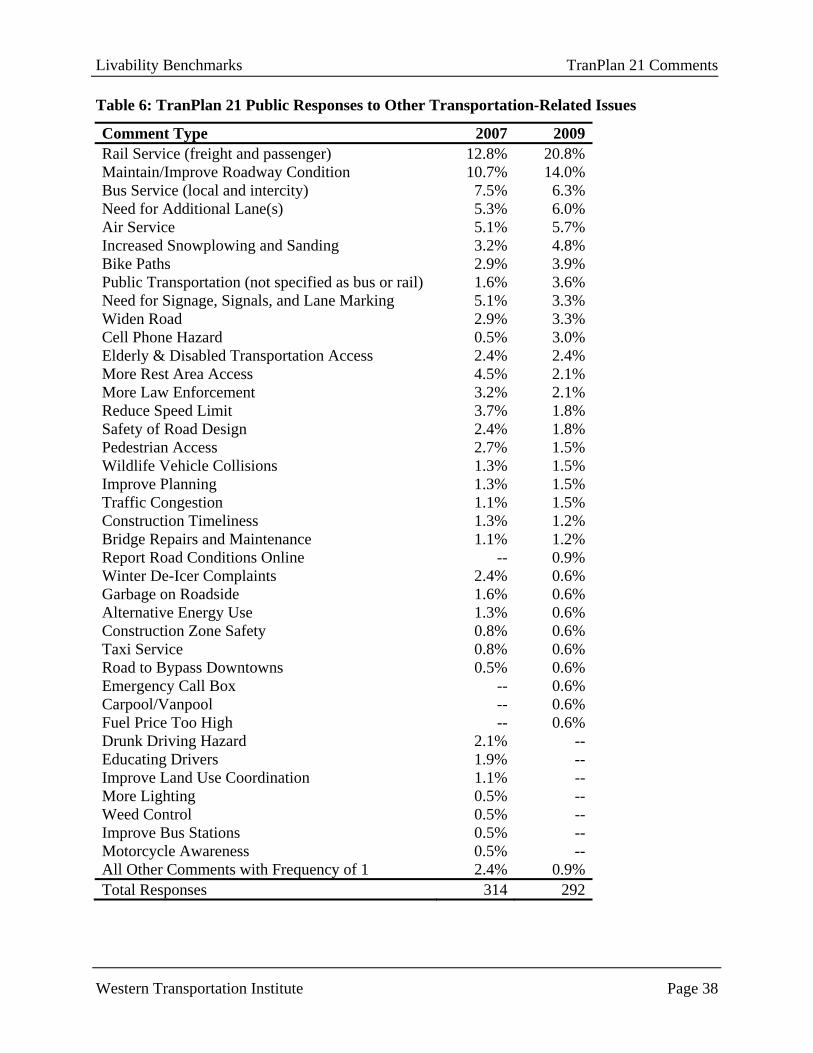
Livability Benchmarks TranPlan 21 Comments
Western Transportation Institute Page 38
Table 6: TranPlan 21 Public Responses to Other Transportation-Related Issues
Comment Type 2007 2009 Rail Service (freight and passenger) 12.8% 20.8% Maintain/Improve Roadway Condition 10.7% 14.0% Bus Service (local and intercity) 7.5% 6.3% Need for Additional Lane(s) 5.3% 6.0% Air Service 5.1% 5.7% Increased Snowplowing and Sanding 3.2% 4.8% Bike Paths 2.9% 3.9% Public Transportation (not specified as bus or rail) 1.6% 3.6% Need for Signage, Signals, and Lane Marking 5.1% 3.3% Widen Road 2.9% 3.3% Cell Phone Hazard 0.5% 3.0% Elderly & Disabled Transportation Access 2.4% 2.4% More Rest Area Access 4.5% 2.1% More Law Enforcement 3.2% 2.1% Reduce Speed Limit 3.7% 1.8% Safety of Road Design 2.4% 1.8% Pedestrian Access 2.7% 1.5% Wildlife Vehicle Collisions 1.3% 1.5% Improve Planning 1.3% 1.5% Traffic Congestion 1.1% 1.5% Construction Timeliness 1.3% 1.2% Bridge Repairs and Maintenance 1.1% 1.2% Report Road Conditions Online -- 0.9% Winter De-Icer Complaints 2.4% 0.6% Garbage on Roadside 1.6% 0.6% Alternative Energy Use 1.3% 0.6% Construction Zone Safety 0.8% 0.6% Taxi Service 0.8% 0.6% Road to Bypass Downtowns 0.5% 0.6% Emergency Call Box -- 0.6% Carpool/Vanpool -- 0.6% Fuel Price Too High -- 0.6% Drunk Driving Hazard 2.1% -- Educating Drivers 1.9% -- Improve Land Use Coordination 1.1% -- More Lighting 0.5% -- Weed Control 0.5% -- Improve Bus Stations 0.5% -- Motorcycle Awareness 0.5% -- All Other Comments with Frequency of 1 2.4% 0.9% Total Responses 314 292

Livability Benchmarks TranPlan 21 Comments
Western Transportation Institute Page 39
The stakeholder surveys conducted in 2007 and 2009 had the same open-ended question as the public surveys relating to other transportation-related issues. The types of comments were similar to the public survey and are summarized in Table 7.
Table 7: TranPlan 21 Stakeholder Responses to Other Transportation-Related Issues
Comment Type 2007 2009Widen Road 17.3 14.5Bike Paths 19.7 14.0Maintain/Improve Roadway Condition 16.5 13.5Need for Additional Lane(s) 19.7 10.9Need for Signage, Signals, and Lane Marking 10.2 9.8More Law Enforcement 5.5 4.7Increased Snowplowing and Sanding 4.7 4.1Wildlife Vehicle Collisions 5.5 3.6More Rest Area Access 3.1 2.6Bus Service (local and intercity) 2.4 2.1Public Transportation (not specified as bus or rail) 2.4 2.1Rail Service (freight and passenger) 4.7 1.6Improve Planning -- 1.6Bridge Repairs and Maintenance 1.6 1.6Winter De-Icer Complaints 1.6 1.6Reduce Speed Limit 5.5 1.0Safety of Road Design 2.4 1.0Pedestrian Access 1.6 1.0Construction Timeliness 3.1 1.0Educating Drivers 1.6 1.0Don't Allow Bikes on Roadway 3.9 --More Rumble Strips 3.1 --More Lighting 2.4 --Drunk Driving Hazard 1.6 --Traffic Congestion 1.6 --All Other Comments with Frequency of 1 11.8 6.7Total Responses 282 102

Livability Benchmarks TranPlan 21 Comments
Western Transportation Institute Page 40
The second open-ended question on the public survey relating to ways to improve roadways received comment types shown in Table 8.
Table 8: TranPlan 21 Public Responses to Suggestions to Improve Roadways
Comment Type 2007 2009Bike Paths 9.3 14.4Need for Additional Lane(s) 14.0 12.4Widen Road 6.0 10.3Maintain/Improve Roadway Condition 19.3 8.2Need for Signage, Signals, and Lane Marking 2.0 7.2Wildlife Vehicle Collisions 5.3 6.2Use Roundabouts -- 6.2Public Transportation (not specified as bus or rail) 12.0 5.2Don’t Use Rumble Strips -- 4.1Reduce Speed Limit 1.3 4.1Rail Service (freight and passenger) 20.7 2.1Pedestrian Access 4.0 2.1More Snowplowing and Sanding -- 2.1Bridge Repairs and Maintenance 2.7 2.1More Lighting -- 2.1Educating Drivers 2.0 2.1Air Service 12.7 --Elderly & Disabled Transportation Access 10.7 --More Rest Area Access 6.0 --Bus Service (local and intercity) 4.0 --Safety of Road Design 2.7 --Improve Planning 2.7 --Traffic Congestion 2.7 --Smart Growth 2.7 --Carpool/Vanpool 2.7 --Weed Control 2.0 --More Law Enforcement 1.3 --Beautification 1.3 --All Other Comments with Frequency of 1 6.0 9.3Total Responses 151 186

Livability Benchmarks Interviews with Other States
Western Transportation Institute Page 41
5. INTERVIEWS WITH OTHER STATES
This chapter covers interviews with selected DOT officials from other states conducted to determine what actions and ideas about livability are underway in those states. State officials from planning offices within the departments of transportation of Colorado, Idaho, North Dakota, Oklahoma, South Dakota and Wyoming responded to a survey developed by the research team. States that have not responded include Arizona, Utah, and Washington. Ten livability-related questions were asked covering livability definitions, rural vs. urban livability, actions and projects, and expectations for the future.
Livability Definition: None of the states responding to the survey have a formal definition of livability, but some are working on the task. Idaho, North Dakota, and South Dakota have made no attempts to define livability as it pertains to their DOTs. Colorado, Oklahoma, and Wyoming have all begun processes aimed at defining livability. At this point Oklahoma is generally following the FHWA definition.
Washington State did not respond to this survey, but as noted in Chapter 2 it defines livable communities as providing and promoting “civic engagement and sense of place though safe, sustainable choices for a variety of elements that include housing, transportation, education, cultural diversity and enrichment, and recreation” (WSDOT, 2010).
Livability—a New Concept or Just a New Label: When asked if they felt livability was a new and different concept to their DOTs or just a new label for many things their DOTs already do, Oklahoma and Idaho officials said it was a new and different concept. Colorado, North Dakota, South Dakota and Wyoming officials all said livability was just a new label given to tasks their state DOTs were already planning and performing (Table 9).
Table 9: How States Are Defining Livability
State Formal Definition New Concept New Label Colorado In Progress Idaho North Dakota Oklahoma In Progress South Dakota Wyoming In Progress
Documents Concerning Livability: Livability-specific documents have not been developed in the responding states. Colorado has a study currently underway on integrating land use and transportation planning. Several states indicated they have incorporated (or plan to incorporate) livability into various planning documents.
All states except North Dakota indicated livability will be incorporated, either explicitly or implicitly, in their next statewide transportation plan update. Livability was explicitly identified in Wyoming’s 2010 Long Range Transportation Plan as an emerging issue among stakeholders it surveyed. North Dakota said it has taken no actions in regard to livability and transportation. Wyoming officials mentioned they continue to work with local communities to incorporate livability principles into local transportation plans.
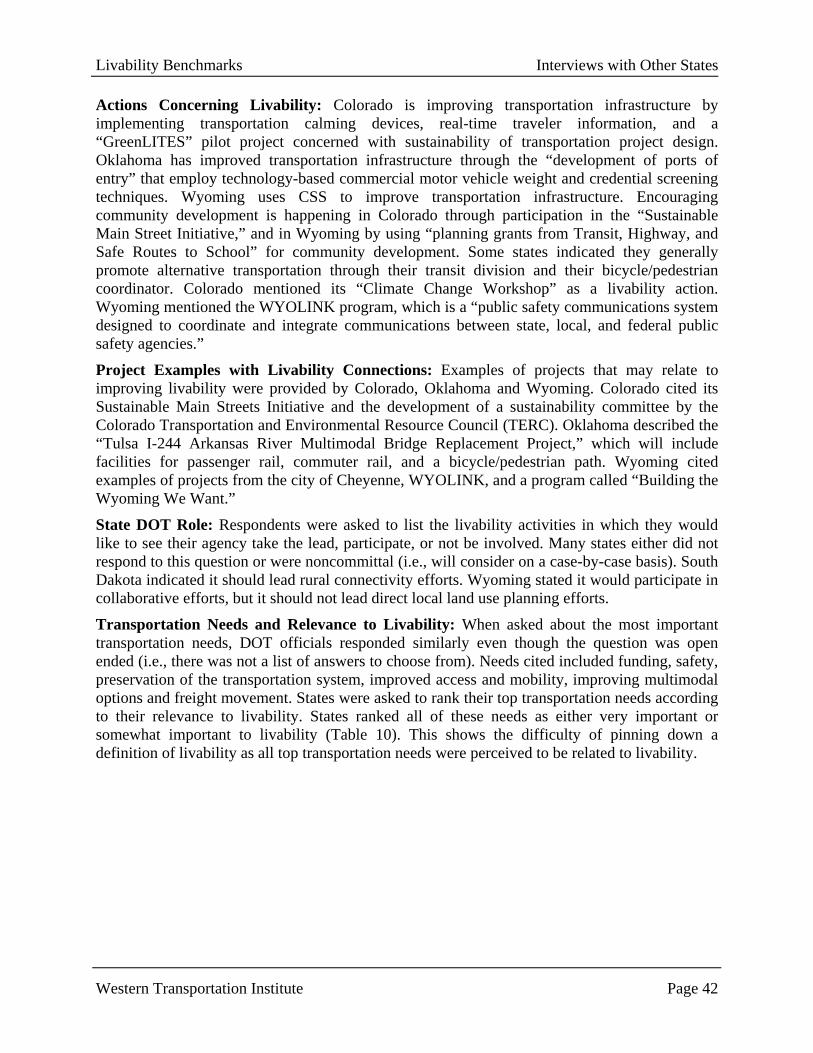
Livability Benchmarks Interviews with Other States
Western Transportation Institute Page 42
Actions Concerning Livability: Colorado is improving transportation infrastructure by implementing transportation calming devices, real-time traveler information, and a “GreenLITES” pilot project concerned with sustainability of transportation project design. Oklahoma has improved transportation infrastructure through the “development of ports of entry” that employ technology-based commercial motor vehicle weight and credential screening techniques. Wyoming uses CSS to improve transportation infrastructure. Encouraging community development is happening in Colorado through participation in the “Sustainable Main Street Initiative,” and in Wyoming by using “planning grants from Transit, Highway, and Safe Routes to School” for community development. Some states indicated they generally promote alternative transportation through their transit division and their bicycle/pedestrian coordinator. Colorado mentioned its “Climate Change Workshop” as a livability action. Wyoming mentioned the WYOLINK program, which is a “public safety communications system designed to coordinate and integrate communications between state, local, and federal public safety agencies.”
Project Examples with Livability Connections: Examples of projects that may relate to improving livability were provided by Colorado, Oklahoma and Wyoming. Colorado cited its Sustainable Main Streets Initiative and the development of a sustainability committee by the Colorado Transportation and Environmental Resource Council (TERC). Oklahoma described the “Tulsa I-244 Arkansas River Multimodal Bridge Replacement Project,” which will include facilities for passenger rail, commuter rail, and a bicycle/pedestrian path. Wyoming cited examples of projects from the city of Cheyenne, WYOLINK, and a program called “Building the Wyoming We Want.”
State DOT Role: Respondents were asked to list the livability activities in which they would like to see their agency take the lead, participate, or not be involved. Many states either did not respond to this question or were noncommittal (i.e., will consider on a case-by-case basis). South Dakota indicated it should lead rural connectivity efforts. Wyoming stated it would participate in collaborative efforts, but it should not lead direct local land use planning efforts.
Transportation Needs and Relevance to Livability: When asked about the most important transportation needs, DOT officials responded similarly even though the question was open ended (i.e., there was not a list of answers to choose from). Needs cited included funding, safety, preservation of the transportation system, improved access and mobility, improving multimodal options and freight movement. States were asked to rank their top transportation needs according to their relevance to livability. States ranked all of these needs as either very important or somewhat important to livability (Table 10). This shows the difficulty of pinning down a definition of livability as all top transportation needs were perceived to be related to livability.
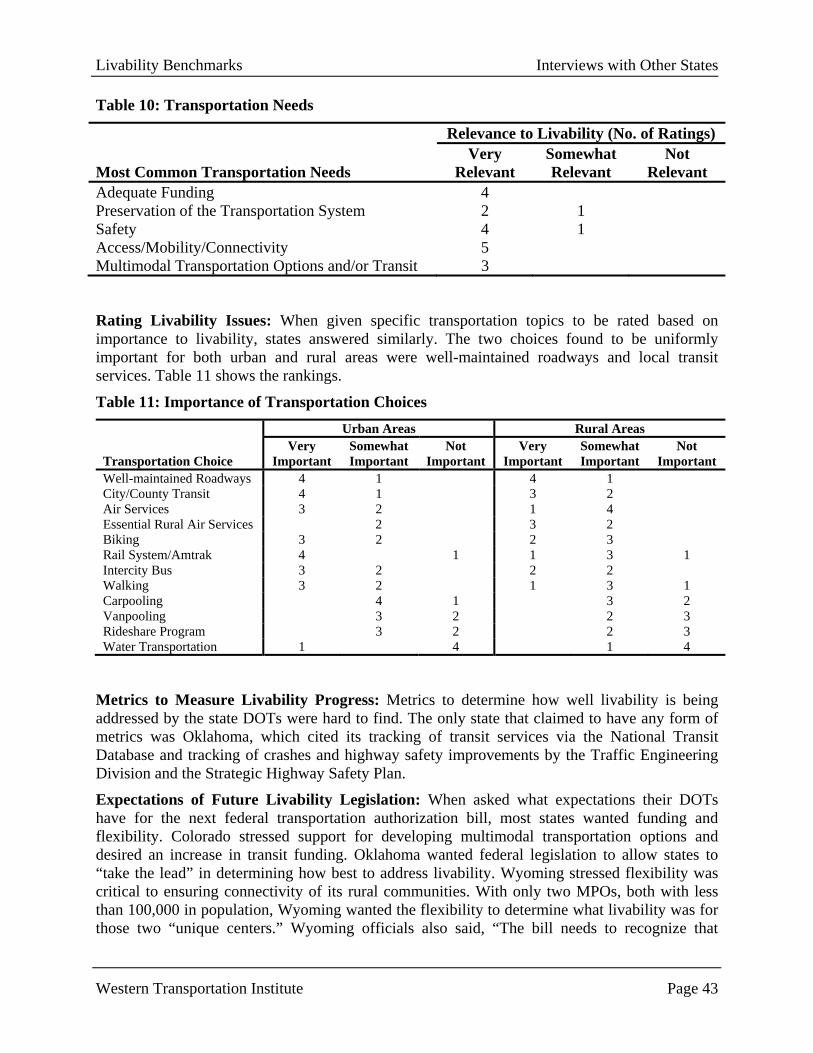
Livability Benchmarks Interviews with Other States
Western Transportation Institute Page 43
Table 10: Transportation Needs
Relevance to Livability (No. of Ratings)
Most Common Transportation Needs Very
Relevant Somewhat Relevant
Not Relevant
Adequate Funding 4 Preservation of the Transportation System 2 1 Safety 4 1 Access/Mobility/Connectivity 5 Multimodal Transportation Options and/or Transit 3
Rating Livability Issues: When given specific transportation topics to be rated based on importance to livability, states answered similarly. The two choices found to be uniformly important for both urban and rural areas were well-maintained roadways and local transit services. Table 11 shows the rankings.
Table 11: Importance of Transportation Choices
Transportation Choice
Urban Areas Rural Areas Very
Important Somewhat Important
Not Important
Very Important
Somewhat Important
Not Important
Well-maintained Roadways 4 1 4 1 City/County Transit 4 1 3 2 Air Services 3 2 1 4 Essential Rural Air Services 2 3 2 Biking 3 2 2 3 Rail System/Amtrak 4 1 1 3 1 Intercity Bus 3 2 2 2 Walking 3 2 1 3 1 Carpooling 4 1 3 2 Vanpooling 3 2 2 3 Rideshare Program 3 2 2 3 Water Transportation 1 4 1 4
Metrics to Measure Livability Progress: Metrics to determine how well livability is being addressed by the state DOTs were hard to find. The only state that claimed to have any form of metrics was Oklahoma, which cited its tracking of transit services via the National Transit Database and tracking of crashes and highway safety improvements by the Traffic Engineering Division and the Strategic Highway Safety Plan.
Expectations of Future Livability Legislation: When asked what expectations their DOTs have for the next federal transportation authorization bill, most states wanted funding and flexibility. Colorado stressed support for developing multimodal transportation options and desired an increase in transit funding. Oklahoma wanted federal legislation to allow states to “take the lead” in determining how best to address livability. Wyoming stressed flexibility was critical to ensuring connectivity of its rural communities. With only two MPOs, both with less than 100,000 in population, Wyoming wanted the flexibility to determine what livability was for those two “unique centers.” Wyoming officials also said, “The bill needs to recognize that

Livability Benchmarks Interviews with Other States
Western Transportation Institute Page 44
Wyoming’s definition of livability includes the desire for access to wide open spaces and recreational opportunities that can only be maintained by vehicle travel.”
Other Livability Concerns: When given the opportunity to voice all other concerns with livability in rural areas, Colorado officials said livability was a difficult concept because the state is approximately 80 percent rural and 20 percent of its population lives in rural areas. North Dakota’s concerns were: “Will the incorporation of livability into the transportation planning process result in another unfunded mandate? Will livability be defined allowing some degree of flexibility (New York vs. North Dakota—concern about one size fits all) in its application to transportation planning?” Wyoming also stressed the impossibility of a “one-size-fits-all” policy across or even within states.
From these responses it is clear some states have begun efforts to define what livability means to them; however no state has a formal definition and there are concerns over what it means for rural areas. Some states have begun incorporating livability ideas into their long-range transportation plans, but a clear way to do so seems elusive. Project examples with livability ideals are plentiful but calling them “livability projects” may not be warranted. Concerning the next transportation bill, all states expressed the concern that funding and flexibility with funding are crucial to livability progress. No metrics dealing solely with livability progress have been developed.

Livability Benchmarks Conclusions
Western Transportation Institute Page 45
6. CONCLUSIONS
Through a review of literature, demographic data analysis, review of TranPlan21 survey information, and interviews with other states, this report provides supporting information for defining what livability, in relation to transportation, could mean for Montana. While this information may provide a framework for developing such a definition, it needs to be filled in through the public survey and other forthcoming tasks for this project.
According to national definitions, livability is a broad term with a wide range of potential implications for transportation. Themes present in the national livability discussion as it relates to transportation include (1) improving opportunities for use of modes such as biking, walking, and riding transit; (2) coordinating transportation planning with land-use planning; (3) incorporating context-sensitive processes when planning and designing transportation facilities (i.e., involve the public and other stakeholders, leverage funding, incorporate community values, and consider aesthetics); (4) considering environmental impacts, particularly fossil fuel use and greenhouse gases, in transportation system design; and (5) not sacrificing capacity and safety needs for the sake of improving livability.
There are numerous national and local efforts that incorporate the term livability, or contain elements related to livability as it is defined nationally. Clearly there is momentum behind this initiative within the transportation industry and in other sectors (e.g., housing and health).
There are no uniform metrics for measuring community livability. There is currently a research project underway to identify livability metrics for transit funded by the Oregon Department of Transportation (Appendix B). A similar research project will start soon following a recent request for proposal from the Federal Transit Agency to identify appropriate livability measures for public transit. The need for improving livability metrics was also a common theme at the recent Transportation Systems for Livable Communities Conference in Washington, DC.
From the state DOT interviews and Montana demographic data, it is clear that a livability template, “one-size-fits-all” approach is not appropriate. Montana differs from the nation as a whole in several ways. Montana has a lower average population density (although there is a wide range of population densities and community types within the state), an aging population, and many communities with limited access to health care. Travel habits in Montana also differ from those in other states. While the average Montanan’s total auto travel is higher, work trips are shorter and fewer Montanans drive alone to work compared to the national average.
The information in this report provides a basic understanding of the national definition of livability and what transportation issues may be important to Montana. This information provides a foundation to be built upon in the remainder of the research project, which will include a survey of the public, stakeholder input, and internal meetings with MDT staff.
Livability Benchmarks References
Western Transportation Institute Page 46
7. REFERENCES
American College of Surgeons. (2010). Verified Trauma Centers. [Web Document] Updated October 18, 2010. Available on the Internet at http://www.facs.org/trauma/verified.html. Last accessed October 2010. Bureau of Business and Economic Research, University of Montana–Missoula. (2009). TranPlan 21 2009 Public Telephone Survey. Prepared for the Montana Department of Transportation. Cambridge Systematics, Inc. (2008). TranPlan 21 2007 Amendment Summary Report. Prepared for Montana Department of Transportation. February 2008. Cambridge Systematics, Inc. (2010). Billings Urban Area Long-Range Transportation Plan. May 2010. Prepared for the City of Billings/Yellowstone County Planning Department. Census & Economic Information Center. (CEIC 2010). Montana Department of Commerce. [Web Document]. Available on the Internet at http://ceic.mt.gov/Demographics.asp. Last accessed September 2010. Center for Neighborhood Technology. (CNT 2010). Housing + Transportation Affordability Index [Web Document]. Available on the Internet at http://htaindex.cnt.org/. Last accessed October 2010. City of Bozeman. (2009). Bozeman Community Plan. June 2009. Hoch, C., Dalton, L. and So, F. Eds. (2000). The Practice of Local Government Planning. Washington D.C.: The International City/County Management Association. Kack, D. (2010). Get on the Bus—Connecting Small Communities. TR NEWS 270 September–October 2010, pp. 38–39. Washington DC: Transportation Research Board. Kochera, A., Straight, A. and Guterbock, T. (2005). Beyond 50.05 A Report to the Nation on Livable Communities: Creating Environments for Successful Aging. Prepared for AARP. 2005. KRTV News. (2010). Great Falls Launches Downtown Revitalization Project [Web News Story] August 13, 2010. Available on the Internet at http://www.kxlh.com/news/great-falls-launches-downtown-revitalization-project/. Last accessed October 2010. LaHood, R. (2009). Secretary of Transportation, Statement before the Committee on Banking, Housing, and Urban Affairs, U.S. Senate Hearing on Greener Communities, Greater Opportunities: New Ideas for Sustainable Development and Economic Growth (June 16, 2009). Mattice, K. (2010). Federal Transit Administration’s Livability Research Initiatives. [Presentation] TRB Transportation Systems for Livable Communities Conference. October 18-19, 2010. Washington D.C.

Livability Benchmarks References
Western Transportation Institute Page 47
Mishkovsky, N., Dalbey, M., Bertaina, S., Read, A., and McGalliard, T. (2010). Putting Smart Growth to Work in Rural Communities. Prepared for IMCA. 2010. Montana AHEC and Office of Rural Health. (2010). Montana Physicians in Active Practice 2008—MMA Directory Data. [Web Document] Available on the Internet at: http://healthinfo.montana.edu/Montana%20Physicians.html. Last accessed October 2010. Montana Governor’s Climate Change Advisory Committee. (2007). Montana Climate Change Action Plan. November 2007. Montana Natural Resource Information System. (MT NRIS 2000). Population Density 2000. Available on the Internet at http://nris.mt.gov/. Last accessed April 8, 2011. Montana Nutrition and Physical Activity. (Montana NAPA 2006). State Plan to Prevent Obesity and Other Chronic diseases 2006–2010. Office of the Federal Register. (2009a). Federal Register: Department of Transportation [Docket No. OST-2009-0115] Notice of Funding Availability for Supplemental Discretionary Grants for Capital Investments in Surface Transportation Infrastructure Under the American Recovery and Reinvestment Act. Vol. 74, No. 115. June 17, 2009. Office of the Federal Register. (2009b). Federal Register: Federal Transit Administration [Docket No. FTA-2009-0052] Proposed Policy Statement on the Eligibility of Pedestrian and Bicycle Improvements Under Federal Transit Law. Vol. 74, No. 218. November 13, 2009. Office of the Federal Register. (2010). Federal Register: Department of Transportation [Docket No. DOT–OST–2010–0076] Notice of Funding Availability for the Department of Transportation’s National Infrastructure Investments Under the Transportation, Housing and Urban Development, and Related Agencies Appropriations Act for 2010. Vol. 75, No. 104. June 1, 2010. Robert Peccia and Associates. (2007). Greater Bozeman Area Transportation Plan 2007 Update. Prepared for Bozeman Transportation Coordination Committee. Toth, G. (2010). Putting the Livability Agenda Back in Place. Project for Public Spaces. [Web Document] Project for Public Spaces, Placemaking Blog. June 8, 2010. Available on the Internet at: http://www.pps.org/putting-the-livability-agenda-back-in-place/. Last accessed October 2010. Transportation for America. (2010a). Transportation + Social Equity: Opportunity Follows Mobility. [Webinar]. Available at: http://t4america.org/policybriefs/t4_policybrief_equity.pdf. Last accessed October 2010. Transportation for America. (2010b). Transportation, Small Towns + Rural Communities. [Webinar]. Available at: http://t4america.org/policybriefs/t4_policybrief_rural.pdf. Last accessed October 2010.

Livability Benchmarks References
Western Transportation Institute Page 48
Twadell, H. and Emerine, D. (2007). NCHRP Report 582: Best Practices to Enhance the Transportation–Land Use Connection in the Rural United States. Prepared for the National Cooperative Highway Research Program. U.S. Census Bureau. (2001). 2000 Census Data Summary File 1. [Database] Available on the Internet at: http://www.census.gov/census2000/sumfile1.html. Last Accessed February 2011. U.S. Census Bureau. (2010). Population Estimates. [Web Document] Available on the Internet at: http://www.census.gov/popest/estimates.html. Last Accessed October 2010. U.S. Department of Housing and Urban Development (US HUD 2010). Sustainable Communities Regional Planning Grants. [Web Document] November 3, 2010. Available on the Internet at http://portal.hud.gov/portal/page/portal/HUD/program_offices/sustainable_housing_communities/Sustainable%20Communities%20Regional%20Planning%20Grants. Last accessed October 2010. U.S. Department of Housing and Urban Development, U.S. Department of Transportation, and U.S. Environmental Protection Agency. (US HUD, USDOT, US EPA 2009). Partnership: Sustainable Communities Position Statement. [Web Document] June 16, 2009. Available on the Internet at: http://www.epa.gov/smartgrowth/pdf/dot-hud-epa-partnership-agreement.pdf. Last accessed October 2010. U.S. Department of Transportation. (USDOT 2010a). Livability Works for Rural Communities. [Web Document] May 6, 2010. Fast Lane: The official blog of the U.S. Secretary of Transportation. Available on the Internet at: http://fastlane.dot.gov/2010/05/livability-works-for-rural-communities.html. Last accessed October 2010. U.S. Department of Transportation. (USDOT 2010b). Transportation Investment Generating Economic Recovery (TIGER) Grants. [Web Document] February 2010. Available on the Internet at http://www.dot.gov/documents/finaltigergrantinfo.pdf. Last Accessed October 2010. U.S. Department of Transportation. (USDOT 2010c). DOT Information Related to the TIGER II Discretionary Grant Program. [Web Document] October 2010. Available on the internet at: http://www.dot.gov/recovery/ost/tigerii/. Last Accessed February 2011. U.S. Department of Transportation, Federal Highway Administration. (USDOT FHWA 2010). Livability Initiative: A Few Words from Victor Mendez, Federal Highway Administrator. [Web Document] August 2010. Available on the Internet at: http://www.fhwa.dot.gov/livability/ Last accessed October 2010. U.S. Department of Transportation Federal Transit Administration. (USDOT FTA 2010). Livability Policies and Provisions. [Web Document] Available on the Internet at: http://www.fta.dot.gov/publications/publications_10964.html. Last accessed October 2010.

Livability Benchmarks References
Western Transportation Institute Page 49
U.S. Department of Transportation, Federal Highway Administration, Montana Department of Transportation, and the Confederated Salish Kootenai Tribes. (USDOT FHWA, MDT and CSKT 2000). Memorandum of Agreement for US Highway 93 Evaro to Polson. December 20, 2000. U.S. Department of Transportation – Office of Aviation Analysis. (2010). Essential Air Service Program. [Web Document] Available on the Internet at: http://ostpxweb.dot.gov/aviation/X-50%20Role_files/essentialairservice.htm. Last accessed October 2010. U.S. Department of Transportation – Research and Innovative Technology Administration. (USDOT RITA 2009). State Transportation Statistics 2009. U.S. Environmental Protection Agency. (US EPA 2010). The EPA Brownfields Program Produces Widespread Environmental and Economic Benefit. [Web Document] Updated September 2010. Available at: http://www.epa.gov/brownfields/overview/brownfields_benefits_postcard.pdf. Last accessed October 2010. Valley County Transit (2010). Available on the Internet at: http://www.valleycountytransit.com/ index.php. Last accessed April 11, 2011. Vemuri, A. and Costanza, R. (2006). The role of human, social, built, and natural capital in explaining life satisfaction at the country level: Toward a National Well-Being Index (NWI). Ecological Economics. Vol. 58, pp. 119-133. Victoria Transportation Policy Institute. (VTPI 2010). Travel Demand Management Encyclopedia. [Web Document] Updated February 2010. Available on the Internet at: http://www.vtpi.org/tdm/tdm12.htm. Last accessed October 19, 2010. Washington Department of Transportation. (WSDOT 2010). Livable Communities Policy. [Web Document]. Available at: http://www.wsdot.wa.gov/biz/csd/pdf/LivableCommunities.pdf. Last accessed October, 2010. Wilbur Smith Associates. 2008 Long Range Transportation Plan: Missoula. Prepared for Missoula Office of Planning and Grants. December 2008.

Livability Benchmarks Appendix A
Western Transportation Institute Page 50
8. APPENDIX A: DEMOGRAPHIC DATA
Select raw data summarized in Chapter 3 is provided in this appendix. Montana’s incorporated communities are listed in Table 12 and Table 13. Communities with city transit are listed in Table 14
Table 12: Urbanized Areas (2009 Estimates)
No. City Population1 Billings 105,8452 Missoula 68,8763 Great Falls 59,366
Table 13: Urban Areas (2009 Estimates)
No. City Population1 Bozeman city 39,2822 Butte-Silver Bow county 32,2683 Helena city 29,9394 Kalispell city 21,6405 Havre city 9,6566 Anaconda-Deer Lodge county 8,7927 Whitefish city 8,4008 Belgrade city 8,1929 Miles City city 8,12310 Livingston city 7,38011 Laurel city 6,75012 Lewistown city 5,93313 Columbia Falls city 5,36114 Polson city 5,231Source: U.S. Census Bureau, Population Estimates - Released June 10. 2010

Livability Benchmarks Appendix A
Western Transportation Institute Page 51
Table 14: City/Town with Intercity Bus Services
No. City/Town 2009 Population
Estimate 1 Billings 105,845 2 Missoula 68,876 3 Great Falls 59,366 4 Bozeman 39,282 5 Butte-Silver Bow 32,268 6 Helena 29,939 7 Kalispell 21,640 8 Whitefish 8,400 9 Belgrade 8,192 10 Miles City 8,123 11 Livingston 7,380 12 Laurel 6,750 13 Polson 5,231 14 Glendive 4,628 15 Dillon 4,226 16 Hardin 3,532 17 Shelby 3,523 18 Deer Lodge 3,517 19 Conrad 2,488 20 Columbus 2,039 21 Ronan 1,999 22 Three Forks 1,970 23 Forsyth 1,865 24 Pablo 1,781 25 Big Timber 1,740 26 Manhattan 1,677 27 West Yellowstone 1,502 28 Boulder 1,475 29 Lakeside 1,415 30 Whitehall 1,191 31 St. Ignatius 807 32 Ulm 798 33 Wolf Creek 794 34 Cascade 770 35 Bridger 736 36 Terry 567 37 Arlee 501 38 Wibaux 480 39 Jefferson City 409 40 Craig 338 41 Drummond 322 42 Evaro 300 43 Basin 233 44 Hysham 233 45 Lima 231 46 St. Regis 220 47 Melrose 175 48 Ravalli 67 49 Warm Springs 25
Total Population w/service 449,866
Source: U.S. Census Bureau, Population Division (SUB-EST2009-04-30); Release Date: June 2010
Livability Benchmarks Appendix B
Western Transportation Institute Page 52
9. APPENDIX B: TRB RESEARCH IN PROGRESS DATABASE SEARCH: LIVABILITY
This section lists current research projects related to transportation and livability.
1. Integrated Multimodal Transportation, Air Quality, and Livability Corridor Study: Measuring, Understanding, and Modeling the Interactions Between Traffic, Transit, Pedestrians, Traffic Signals, Emission Start date: 2010/10/1 End date: 2011/9/30 Source Organization: Oregon Transportation Research and Education Consortium
2. Linking Traffic Safety to Emerging Livability Initiatives Start date: 2010/9/1 End date: 2011/8/31 Source Organization: Texas A&M University, College Station
3. Livability Performance Metrics for Transit Start date: 2010/10/1 End date: 2011/9/30 Source Organization: Oregon Transportation Research and Education Consortium
4. Livability, Mobility and Seasonality Start date: 2010/7/1 End date: 2011/6/30 Source Organization: University of Vermont, Burlington
5. Mobility and Livability: Season and Built Environmental Impacts: Bicycle Travel Start date: 2010/7/1 End date: 2011/6/30 Source Organization: University of Vermont, Burlington
6. Marginal Cost Pricing and Subsidy of Transit in Small Urbanized Areas Start date: 2010/7/1 End date: 2011/6/30 Source Organization: North Dakota State University, Fargo
7. Transit Ridership and the Built Environment Start date: 2010/7/1 End date: 2011/6/30 Source Organization: North Dakota State University, Fargo
8. Increasing Bicycling for Transportation: The Role of Cyclist Type and Infrastructure Start date: 2010/10/1 End date: 2011/9/30 Source Organization: Oregon Transportation Research and Education Consortium
9. Bicycle and Pedestrian Engineering Design Curriculum Expansion

Livability Benchmarks Appendix B
Western Transportation Institute Page 53
Start date: 2010/10/1 End date: 2011/9/30 Source Organization: Oregon Transportation Research and Education Consortium
10. Transit Agency Strategies that Encourage Mixed Uses Around Stations Start date: 2010/9/1 End date: 2011/8/31 Source Organization: Texas A&M University, College Station
11. Evaluating the Effect of Street Network Connectivity on First/Last Mile Transit Performance Start date: 2010/9/1 End date: 2011/8/31 Source Organization: Texas A&M University, College Station
12. Evaluation of Equity for Vehicle Miles Traveled Fee Scenarios in Texas Start date: 2010/9/1 End date: 2011/8/31 Source Organization: Texas A&M University, College Station
13. Economic Benefits of Cycling Start date: 2010/10/1 End date: 2011/9/30 Source Organization: Oregon Transportation Research and Education Consortium
14. Sustainable Cities Initiative (SCI) Start date: 2010/10/1 End date: 2011/9/30 Source Organization: Oregon Transportation Research and Education Consortium
15. Effect of Low-Impact Sustainable Transportation Design as a Strategy for Alleviating Stormwater Runoff and Reducing GHG Emissions Start date: 2010/8/22 End date: 2011/8/21 Source Organization: University of Connecticut, Storrs
16. Transportation System Sustainability and Adaptation Using Physarum Polycephalum Start date: 2010/8/22 End date: 2011/8/21 Source Organization: University of Connecticut, Storrs
17. Evaluating Emissions Reductions and Tradeoffs in Urban Pickup and Delivery Systems Start date: 2009/7/1 End date: 2010/12/31 Source Organization: University of Washington, Seattle
18. Transportation and Environmental Justice Best Practices Guidebook Start date: 2009/9/22 End date: 2010/3/21 Source Organization: Federal Highway Administration

Livability Benchmarks Appendix B
Western Transportation Institute Page 54
19. Healthy Communities and Urban Design: A Multi-Disciplinary National Analysis of Travel Behavior, Residential Preference, and Urban Design Start date: 2008/10/1 End date: 2009/9/30 Source Organization: Oregon Transportation Research and Education Consortium
20. Freeway Deconstruction and Urban Renewal: Land Market and Transportation Impacts Start date: 2005/8/1 End date: 2008/7/31 Source Organization: University of California, Berkeley
21. A New Process for Determining TCRP New Paradigms Research Topics Start date: 2008/3/31 End date: NA Source Organization: Transportation Research Board
22. Long Term Evaluation of Individualized Marketing Programs for Travel Demand Management Start date: 2007/10/1 End date: 2008/9/30 Source Organization: Oregon Transportation Research and Education Consortium
23. Historic Preservation of Intermodal Transit Centers: Integration Versus Isolation Start date: 2001/6 End date: 2002/12 Source Organization: Federal Transit Administration
24. New York City Harlem 110th Street Station Security Enhancements Start date: 1995/5 Source Organization: Federal Transit Administration Notes: Livable Communities Initiative Demonstration Project