Liu, Hao (2014) Modified thermal reduction of graphene...
222
Liu, Hao (2014) Modified thermal reduction of graphene oxide. PhD thesis, University of Nottingham. Access from the University of Nottingham repository: http://eprints.nottingham.ac.uk/14024/2/Thesis_of_GO_and_its_application-- Hao_Liu_4102368.pdf Copyright and reuse: The Nottingham ePrints service makes this work by researchers of the University of Nottingham available open access under the following conditions. This article is made available under the University of Nottingham End User licence and may be reused according to the conditions of the licence. For more details see: http://eprints.nottingham.ac.uk/end_user_agreement.pdf For more information, please contact [email protected]
Transcript of Liu, Hao (2014) Modified thermal reduction of graphene...

Liu, Hao (2014) Modified thermal reduction of graphene oxide. PhD thesis, University of Nottingham.
Access from the University of Nottingham repository: http://eprints.nottingham.ac.uk/14024/2/Thesis_of_GO_and_its_application--Hao_Liu_4102368.pdf
Copyright and reuse:
The Nottingham ePrints service makes this work by researchers of the University of Nottingham available open access under the following conditions.
This article is made available under the University of Nottingham End User licence and may be reused according to the conditions of the licence. For more details see: http://eprints.nottingham.ac.uk/end_user_agreement.pdf
For more information, please contact [email protected]

MODIFIED THERMAL REDUCTION
OF GRAPHENE OXIDE
HAO LIU
Thesis submitted to the University of Nottingham for the degree
of Doctor of Philosophy
January 2014

Abstract
As a strictly two-dimensional carbon material, graphene has attracted great interest in
recent years due to its unique mechanical, electrical and optical properties. Currently,
the principal methods for mass production of graphene are focused on the
solution-based chemical redox reaction. The oxidation of graphite introduces a large
amount of oxygen functional groups attached onto its basal plane or edges, which
makes graphene oxide (GO) sheets hydrophilic to form stable aqueous colloids.
However, the raw material graphite gradually becomes an insulator during the
oxidation process as part of planar sp2-hybridized geometry transformed to distorted
sp3-hybridized geometry, which loses its excellent electronic properties. As a result,
reduction of GO is definitely necessary to recover its “lost” electrical conductivity for
practical applications. In addition, the hydrophilic property of GO sheets allows metal
oxide (MO) nanoparticles (NPs) anchoring on reduced graphene oxide (rGO) plane to
fabricate MO/rGO composites with excellent electrochemical performance. However,
the current preparation methods for the electrical conductive MO/rGO composites are
very complicated which might have negative effects on the properties and hinder mass
production. The objective of this project is to synthesize aluminium oxide (Al2O3)/rGO
nanocomposites via oxygen annealing without using an Al2O3 precursor. This method
establishes a very simple and efficient way to yield Al2O3 NPs on rGO plane by
filtering GO dispersion through an Anodisc membrane filter with oxygen annealing,
which is named oxygenally reduced graphene oxide (OrGO). The characterizations
reveal that the Al2O3 NPs are formed exclusively on the edges of defective regions with

uniform particle size less than 10 nm. As for the electronic properties, OrGO has a
higher electrical conductivity at 7250 S m−1 with a narrower range of the electrical
conductivity mostly between 6500 and 7250 S m−1, which can be due to the increase of
the sp2/sp3 carbon ratio caused by the formation of Al2O3 NPs at the edges of defective
regions in OrGO plane. Moreover, the formation of Al2O3 NPs maintains OrGO sheets
with good hydrophilic property with a contact angle around 71.5°. The electrochemical
performance of OrGO paper fabricated as electrode materials for lithium-ion batteries
(LIBs) is also investigated. OrGO electrodes exhibit a high specific charge and
discharge capacity at 1328 and 1364 mAh g−1. The cyclic voltammograms (CV)
performance reveal that the insertion of Li+ ions begins at a very low potential around
0 V vs. Li+/Li while the extraction process begins in the range of 0.2–0.3 V. In
addition, the OrGO electrode has excellent rate capability and cycling performance.
The average coulombic efficiency (CE) was measured at 99.608% for 30 cycles,
indicating a superior reversibility of the Li+ ion insertion/extraction process.

Publications
Journal paper:
H. Liu, K.-L. Choy, and M. Roe, Enhanced conductivity of reduced graphene oxide
decorated with aluminium oxide nanoparticles by oxygen annealing. Nanoscale, 2013.
5(13): p. 5725-5731.
Conference paper:
H. Liu, and K.-L. Choy, Synthesis of aluminium oxide/graphene nanocomposites and
application as an anode material for lithium-ion batteries. MRS Spring Meeting, San
Francisco, CA, Apr. 2013.
Presentation:
Poster presentation; H. Liu, K.-L. Choy, and H. Morvan, Large-scale novel graphene
based conducting nanocomposites. Engineering Faculty Postgraduate Research event,
the University of Nottingham, Nottingham, May, 2013.

Abbreviations
2D Two-dimensional
α Fine-structure constant
π Pi
Ω Ohm
ADF Annular dark field
AFM Atomic force microscopy
Al(OH)3 Aluminium hydroxide
Al2O3 Aluminium oxide
Ar Argon
ATR Attenuated total reflection
AuCl4 Gold(III) chloride
BSE Back-scattered electrons
C Carbon
C60 Fullerene
CC/CV Constant current / constant voltage
CCD Charge-coupled device
CDG Chemically derived graphene

CE Coulombic efficiency
CL Cathodoluminescence
ClO2 Chlorine dioxide
cm Centimetre
CNT Carbon nanotube
CO Carbon monoxide
CO2 Carbon dioxide
Cu Copper
CV Cyclic voltammograms
CVD Chemical vapor deposition
DCE 1, 2-dichloroethane
DI Deionized
DMF N,N-dimethylformamide
DMSO Dimethyl sulfoxide
DXR Doxorubicin hydrochloride
EDX Energy dispersive X-ray spectroscopy
EPD Electrophoretic deposition

ESEM Environmental SEM
ET Electron transfer
FEG Field emission gun
FTIR Fourier transform infrared spectroscopy
FWHM Full width at half maximum
g Gram
GO Graphene oxide
h Hour
H Hydrogen
H2SO4 Sulfuric acid
H3PO4 Phosphoric acid
HNO3 Nitric acid
HOPG Highly oriented pyrolytic graphite
HRTEM High-resolution transmission electron microscopy
ITO Indium tin oxide
K2S2O8 Potassium persulfate
KClO3 Potassium chlorate

KMnO4 Potassium permanganate
KOH Potassium hydroxide
Li Lithium
LIB Lithium-ion battery
LiPF6 Lithium hexafluorophosphate
m Mol
mA Milliampere
min Minute
MO Metal oxide
mPa Megapascal
N Nitrogen
N2O4 Dinitrogen tetroxide
NaBH4 Sodium borohydride
NaNO3 Sodium nitrate
Ni Nickel
NIR Near-infrared
nm Nanometre

NMR Nuclear magnetic resonance
NO2 Nitrogen dioxide
NP Nanoparticle
O Oxygen
OLED Organic light-emitting diode
OrGO Oxygenally reduced graphene oxide
P2O5 Phosphorus pentoxide
Pa Pascal
PL Photoluminescence
PMT Photomultiplier tube
PSD Position sensitive detector
Pt Platinum
PVP Poly-4-vinylphenol
QD Quantum dot
rGO Reduced graphene oxide
rpm Revolutions per minute
Rs Sheet resistance

Ru Ruthenium
SAED Selected area electron diffraction
SE Secondary electrons
SEI Solid electrolyte interface
SEM Scanning electron microscopy
SiC Silicon carbide
SiO2 Silicon dioxide
SnO2 Tin dioxide
SOCl2 Thionyl chloride
sq Square
STEM Scanning transmission electron microscope
STM Scanning tunneling microscopy
TEM Transmission electron microscopy
THF Tetrahydrofuran
TiO2 Titanium dioxide
TrGO Thermally reduced graphene oxide
UHV Ultra-high vacuum

UV Ultraviolet
UV-Vis Ultra-High Vacuum
V Volt
vis Visible
W Watt
XPS X-ray photoelectron spectroscopy
XRD X-ray diffraction
ZnO Zinc oxide

Acknowledgements
With great pleasure and respect, I express my heartfelt gratitude to my supervisor
Professor Kwang-Leong Choy for her continued support, motivation, patience and
guidance during my PhD studies. I would also like to thank the China Scholarship
Council (CSC) for funding my PhD for 4 years.
Professor Kwang-Leong Choy, thank you for giving me the opportunity to do a PhD and
for being a calm head during the hectic times. You always had a solution! I have learnt
so much from you.
I would like to thank the technical staff that helped me throughout the PhD process with
my laboratory work. The supports from Vladimir Astachov and Michael Fay on AFM
and HRTEM measurements, respectively, are gratefully acknowledged.
I am very grateful for the friendship and help from the current and past group members
especially Dr. Xianghui Hou, Dr. Jungpeng Liu, Chyi Shen Tho, Marcus Jahn, and
many others. I express my sincere thanks to my friends for helping me through the
difficult times and for all their emotional support.
Finally, I would like to thank my family and girlfriend for being patient and
understanding throughout the demanding PhD years. My parents Xiaoming Tang and
Yongguo Liu as well as my girlfriend Lin Qiu, have always been my rock and I could
not have done this without their moral and financial support.

Table of contents
Abstract II
Publications IV
Abbreviations V
Acknowledgements XII
Chapter 1 Introduction 1
1.1 Graphene 1
1.2 How to make graphene 2
1.3 Graphene oxide and mass production 5
1.4 The Achilles' heel of GO 6
1.5 Motivation 7
1.5.1 TrGO: the way to improve the electrical conductivity 7
1.5.2 NPs: boosts rGO potential 8
1.5.3 OrGO: an innovation behind fabrication of GO sheets 9
1.6 The aims of this research project 11
Chapter 2 Literature Review 12
2.1 Introduction 12
2.2 Limits of graphene and GO 14

2.3 Structure of GO and rGO based material 15
2.4 Structural modelling of GO 20
2.5 Properties of GO and rGO based material 22
2.5.1 Electronic Properties 24
2.5.2 Electrochemical Properties 27
2.5.3 Chemical activity 29
2.5.4 Wettability of graphene 31
2.6 Synthesis of GO and rGO based material 33
2.6.1 Chemical oxidation process 33
2.6.1.1 Brodie Method and Staudenmaier Method 33
2.6.1.2 Hummers Method and modified Hummers Method 34
2.6.2 Reduction strategies of GO 36
2.6.2.1 Thermal Annealing for Reduction 36
2.6.2.2 Low temperature thermal annealing for reduction 38
2.6.2.3 Chemical reduction 40
2.6.3 Functionalization with NPs 41
2.6.4 Size effect of quantum dots and nanoparticles 44
2.7 Functionalization and Application for rGO based material 46

2.7.1 Introduction 46
2.7.2 RGO based electrodes for LIBs 48
2.7.3 MOs based electrodes for LIB 52
2.7.4 MO/rGO based electrodes for LIBs 53
2.8 Summary 67
Chapter 3 Methodology 68
3.1 Introduction 68
3.2 Preparation of GO dispersion 68
3.2.1 Pretreatment of graphite powder 68
3.2.2 Modified Hummer’s Method for oxidation of graphite 69
3.2.3 Formation of GO dispersion 70
3.3 Preparation of free-standing GO paper 70
3.3.1 Filtration of GO dispersion 70
3.3.2 Types of membrane filter 71
3.3.3 GO paper peeling off from the membrane filter 72
3.3.3.1 Mixed cellulose ester membranes 72
3.3.3.2 Aluminum oxide membranes 73
3.3.4 Samples preparation for characterizations 73

3.4 Preparation of single-layer GO sheets on the substrates 73
3.4.1 Preparation of diluted GO dispersion 73
3.4.2 Fabrication of Al2O3/GO monolayer structure 74
3.4.3 Substrates 75
3.5 Fabrication of TrGO by thermal annealing 76
3.6 Fabrication of OrGO by oxygen annealing 77
3.7 Characterization methods 78
3.7.1 Atomic Force Microscopy 78
3.7.2 Scanning Electron Microscopy 80
3.7.3 Transmission electron microscopy 82
3.7.4 Raman spectroscopy 84
3.7.5 X-Ray Photoelectron Spectroscopy 85
3.7.6 Fourier transform infrared spectroscopy 87
3.7.7 Sheet resistivity measurement 88
3.7.8 Contact angle measurement 90
3.7.9 Lithium-ion battery test cells assembly and performance
evaluation 92
3.7.10 Electrochemical measurement 92

3.7.11 Ultraviolet–visible spectroscopy 93
3.7.12 Photoluminescence spectroscopy 95
3.7.13 X-Ray Diffraction 96
Chapter 4 Characterization of individual
monolayer OrGO sheets 99
4.1 Introduction 99
4.2 Results and discussion 100
4.2.1 Optical microscopy of OrGO layers 100
4.2.2 TEM analysis of OrGO 109
4.2.3 AFM analysis of OrGO 116
4.3 Summary 120
Chapter 5 Characterization of OrGO paper 123
5.1 Introduction 123
5.2 Results and discussion 124
5.2.1 SEM images of OrGO paper 124
5.2.2 XPS analysis of OrGO paper 130
5.2.3 Raman spectroscopy analysis 135
5.2.4 FTIR analysis 138

5.3 Summary 142
Chapter 6 Properties of OrGO paper 144
6.1 Introduction 144
6.2 Results and discussion 146
6.2.1 Electrical conductivity of OrGO 146
6.2.1.1 Electrical conductivity recovered by oxygen annealing
146
6.2.1.2 Short duration reduction for GO paper 149
6.2.2 Wettability of OrGO 153
6.3 Summary 156
Chapter 7 Application of OrGO paper for LIBs
159
7.1 Introduction 159
7.2 Results and discussion 161
7.2.1 Charge and discharge performance of OrGO electrodes 161
7.2.2 Cycling performance of OrGO electrode 166
7.3 Summary 167
Chapter 8 Conclusion 170

Chapter 9 Future work 176
Appendix 178
References 183

1
Chapter 1 Introduction
1.1 Graphene
Figure 1.1 A graphene flake under bright field on top of an oxidized Si wafer[1]
In 2004, Geim and co-workers reported a strictly two-dimensional carbon material
named graphene (Figure 1.1)[1]. It is a single layer of graphite with only one atom thick
having unique mechanical, electrical and optical properties [2-4]. For example, the
spring constant of graphene is in the range of 1-5 N/m and a Young's modulus of 0.5
Tpa, indicating a breaking strength 200 times greater than steel. These high values make
graphene one of the strongest materials ever tested[2]. Graphene also has a very low
electrical resistivity at room temperature of 10−6 Ω·cm, less than that of silver[3].

2
Moreover, its unique electronic structure makes graphene absorb a significant (πα
=2.3%, α is the fine-structure constant) part of incident white light, which makes
graphene an excellent candidate for terahertz applications [4]. Since graphene is a
gapless semiconductor, its charge carriers can continuously cross the Dirac point from
electrons to holes under an external electric field. The mobility of these charge carriers
in graphene can exceed 105 cm2V −1s −1 at low temperature, and is not influenced by the
doping process as in conventional semiconductors [5]. For the thermal properties,
graphene exhibits a strong heat conductivity measured between (4.84±0.44) ×103 to
(5.30±0.48) ×103 Wm−1K−1. According to the literature, the thermal characteristics are
proved to be significantly improved by embedding multiple layers of graphene into
silicon chips. This result suggests that a lower temperature can be achieved by
graphene, which promises chips with a higher processing speeds [6].
1.2 How to make graphene
Normally, graphene sheets can be made in three principal ways. The first method,
micromechanical cleavage, was originally reported by Geim and other researchers in
2004[1].This method involves two steps, repeatedly splitting graphite crystals by
Scotch tape and dissolving the resulted pieces in acetone. After depositing the
dispersion onto a piece of silicon wafer, the sheets consisting of single layers of
graphene were found under scanning electron microscopy (SEM) (Figure 1.2).

3
Figure 1.2 Micromechanical cleavage of graphite to obtain graphene using Scotch tape [7].
Although this method can produce the pristine graphene used for theoretical research,
its complicated process and small size of graphene sheets obtained make the procedure
difficult for practical applications.
The second route is growing epitaxially graphitic layers on top of silicon carbide at high
temperature over 1100 °C [8]. The substrate is then removed by chemical etching to
obtain free-standing graphene layers (Figure 1.3). However, it is not practical to use
expensive Silicon carbide (SiC) substrate for industrial applications even though the
epitaxial graphene expresses high quality.

4
Figure 1.3 a, The starting material of SiC surface with a staircase of flat terraces. b, Fabrication process of
vacuum-graphitized SiC. c, Morphology graphene obtained from the surface in high-pressure argon[8].
The third method used to obtain uniform and large-scale graphene films is chemical
vapor deposition (CVD)[9].This method requires an operating temperature as high as
1,000°C along with a hydrocarbon gas flow as precursor and pure hydrogen as a
carrier gas, which limits the application range.

5
Figure 1.4 Graphene films synthesized by CVD method and transferred onto a silicon dioxide (SiO2)/Si
wafer [9]
1.3 Graphene oxide and mass production
The methods mentioned in 1.2 are inefficient and high-cost for the production of small
quantities of graphene sheets, and cannot meet mass production requirements. The
solution-based route, namely Hummers method, is considered able to produce
graphene sheets in large amounts [10, 11]. In this technique, graphite is initially
oxidized to synthesize strongly hydrophilic graphite oxide due to the large amounts of
oxygen functional groups attached onto the basal or edge plane of graphite. These
functional groups make graphite oxide easily exfoliated in solvent to form stable GO
dispersion. GO can be partially reduced to form graphene-like materials by removing
the oxygen functionalities from the basal plane and recovering the conjugated
structure. The rGO sheets are normally grouped as the chemically derived

6
graphene[12]. Therefore, it seems advisable that the most intensive effort to reduce
GO should be focused on producing graphene-like sheets with their structures and
properties similar to the individual layers of graphite, the pristine graphene. For a
more accurate expression, we will substitute “rGO” for “graphene” to describe the
chemically derived graphene after the reduction process.
1.4 The Achilles' heel of GO
There are two important advantages enabling the mass production of GO. First of all,
the chemical process uses inexpensive graphite as a raw material to produce GO
sheets. On the other hand, the as-obtained highly hydrophilic GO sheets can easily
form stable aqueous colloids, which facilitates a simple and feasible solution process
for mass production of rGO.
However, graphite gradually becomes an insulator during the oxidation process as part
of planar sp2-hybridized geometry transformed to distorted sp3-hybridized geometry,
which loses the excellent electronic properties of graphite[13]. GO has to be reduced
to restore the aromatic graphene networks so that the electrical conductivity can be
recovered, in which case, most of the oxygen-containing functionalities have to be
removed. However, a gradual decrease in hydrophilic character happens during the
GO reduction process, which often results in irreversible agglomeration and
precipitation.

7
1.5 Motivation
1.5.1 TrGO: the way to improve the electrical conductivity
Reduction of GO is definitely necessary to recover its “lost” electrical conductivity for
practical applications. A variety of reduction processes have been applied to produce
electrical conductive rGO with different properties. The reduction methods for GO
sheets mainly include two strategies: chemical reagent reduction and thermal
annealing.
Stankovich et al. first reported the chemical reduction method using hydrazine to
obtain rGO sheets [11, 14]. Although hydrazine successfully reduced GO, the
large-scale implementation of this highly toxic reagent for rGO mass production is not
desirable. Moreover, extra nitrogen functional groups were introduced on rGO plane
by hydrazine during the chemical reduction [15], which restricts the applications in
gas sensor[16]. Sodium borohydride (NaBH4) was accepted as a reducing reagent due
to a more effective reduction capability than hydrazine. However, NaBH4 can be
slowly hydrolyzed in water so that it should be used freshly as a reductant.
Furthermore, NaBH4 is not highly effective in reducing epoxy groups and carboxylic
acids although it can efficiently reduce C=O species, resulting in alcohol groups
remaining on rGO plane after reduction [17].
GO also can be reduced by thermal annealing to achieve rGO, hence named
“thermally reduced graphene oxide” (TrGO). The initial thermal annealing, rapid
heating over 2000 °C/min, was used to exfoliate graphite oxide to produce graphene

8
sheets [13, 18, 19]. During the process, the oxygen functional groups rapidly
decomposed to form gases to increasing the pressure between the stacked layers of
graphite oxide. Li et al. decreased the annealing temperature to 800 OC with
high-quality GO sheets. After the oxidation process by Hummer’s method, GO
dispersion was repeatedly centrifuged at high rotation speed and resuspended in fresh
1, 2-dichloroethane (DCE)[20]. Further decrease of annealing temperature was
achieved by a step thermal annealing process. GO sheets fabricated by Hummer’s
method was partially reduced by heating in Ar flow at 200 OC for 1 hour, the sample
resistance went down to ∼ 750 kΩ. The following thermal treatment at 300 °C
increased the device electrical conductivity by 10 times due to more oxygen functional
groups being removed from GO sheets plane[21].
1.5.2 NPs: boosts rGO potential
The uniform GO colloidal dispersion has been attracting great interest for its
fascinating hydrophilic properties, which allows GO sheets anchoring NPs to form
composites [22-27]. Reduction of as-formed nanocomposites boots their potential for
use in optical, electronic, thermal, mechanical, and catalytic applications.[28-30]
Moreover, the flexible and electrical conductive rGO sheets supporting the
nanocomposites result in an enhanced electrochemical performance, which allows
NP/rGO hybrids to be fabricated in electronic devices such as LIBs, electrochemical
capacitors, field effect transistors and photodetectors [31-36]. For example, catalyst
particles were distributed onto rGO sheets to fabricate selective catalytic composites

9
and sensors [37]. The large-band-gap MOs such as TiO2 and ZnO can interact with
carboxylic acid functional groups of GO to form rGO based semiconductor
composites, which are photocatalytically active under ultraviolet (UV) irradiation[24,
38]. For the application of energy storage, lithium-ion batteries employing graphene as
anodes were researched by many groups. In order to enhance the cycling performance,
MO/rGO composites were assembled. For example, SnO2/rGO anode material exhibits
a reversible capacity of 810 mA h g-1 as well as 570 mA h g-1 after 30 cycles[31].
1.5.3 OrGO: an innovation behind fabrication of GO sheets
The NP/rGO composites are often made via two steps. Firstly, NPs distributes on GO
sheets in aqueous dispersion prepared by Hummer’s method forming the homogeneous
composites. Secondly, reducing the composites is achieved by a variety of reduction
processes such as chemical reduction and thermal annealing. For example, Gold(III)
chloride (AuCl4-) reduced by NaBH4 in a GO dispersion to form gold NP/rGO is a
typical route for rGO based composites fabrication. NaBH4 solution is mixed with GO
dispersion in tetrahydrofuran (THF) followed by adding AuCl4- to the mixture.
Subsequently, excess NaBH4 is added to the GO dispersion facilitating the reduction
process of AuCl4- and unfunctionalized oxygen functional groups. The as-formed GO
dispersion is then measured and filtered through a membrane filter to fabricate
custom-sized GO film, its size depending on the diameter of the filter. Followed by
air-drying and peeling from the filter, the obtained rGO paper or rGO based composite
paper can be used in many applications.

10
However, there is an innovation behind the filtration stage, which allows a very simple
and efficient way to yield NP/rGO composites allowing the annealing process to
fabricate rGO based nanocomposites without extra NPs, reductant and any kind of
organic solvent. This innovation is an Anodisc membrane filter (aluminium oxide
membrane, 47 mm in diameter, 0.2 µm pore size; Whatman), which is widely used in
filtering GO dispersions to form GO papers due to its physical properties of
hydrophilicity and porosity. Anodisc membrane filters are highly porous (about max.
50–65% at the surface), and the pores are disttributed in a hexagonal array. The
manufacturers data indicate that the thickness of the membrane is about 60 μm and
the pore density is about 1010 cm−2. During the vacuum filtration, a small amount of
Al2O3 NPs coming from the membrane filter is dissolved in DI water and then
distributed on the GO plane owing to the liquid removed through the membrane pores
under a directional flow by vacuum suction. The GO dispersion prepared by Hummer’s
method is subjected to vacuum filtration through the Anodisc membrane filter to
produce GO paper. The vacuum filtration of a GO dispersion produces GO paper with
an Anodisc membrane filter, resulting layers therefore becoming flexible in a
paper-like structures which can be stretched and folded. This free-standing GO paper
can be considered for applications such as flexible film batteries, hydrogen storage or
electric membranes. Different from the conventional heat treatment for reducing GO
paper by other groups, we modify the thermal annealing process by introducing
oxygen gas flow to fabricate Al2O3 NP/rGO composites, named “oxygenally reduced
graphene oxide” (OrGO). The oxygen gas flow used in the thermal treatment process

11
enables the removal of oxygen functional groups and recovery of defective regions.
Herein, we present a simple approach for the preparation of large-area, free-standing,
electrical conductive and hydrophilic OrGO paper and its potential application in
LIBs.
1.6 The aims of this research project
The overall aim of this research is to unveil an innovative oxygen annealing method
for the fabrication of Al2O3 NP/rGO composites and investigate the mechanism of
Al2O3 NPs’ distribution and aggregation on the GO plane. We also determine the
electrical conductivity and wettability of OrGO paper followed by applying it in LIB.
The key objectives of this research are shown as follows:
(i) To use modified Hummer’s Method for synthesis of GO.
(ii) To fabricate GO paper by vacuum filtration through an Anodisc membrane filter.
(iii) To characterize the formation mechanism, and properties of OrGO sheets.
(iv) To study the electrochemical performance of OrGO paper as the electrode
material in LIBs.

12
Chapter 2 Literature Review
2.1 Introduction
Graphene, a two-dimensional monolayer of graphite, has attracted intense research
interest due to its unique mechanical, electrical and optical properties [2-4]. For its
mass production, the strongly hydrophilic GO sheets synthesized by Hummer’s
method can be reduced for large-scale preparation of chemically derived graphene
(CDG) sheets. GO is basically a wrinkled two-dimensional carbon material covered by
oxygen functional groups on its basal plane and edges. Removing the oxygen
functional groups by either chemical or thermal reduction processes enables GO to be
a precursor for CDG fabrication. However, the oxygen functional groups on the GO
plane can strongly affect the electronic, mechanical, and electrochemical properties,
therefore resulting in the property differences between GO and pristine graphene [39].
The structural defects in GO produced by the chemical oxidation process limit its
direct application especially in electronic devices due to the oxygen functional groups
reducing the electrical conductivity of GO sheets [40]. However, the oxygen
functionalization makes GO sheets strongly hydrophilic, which promises GO sheets an
excellent dispersibility in many solvents(Figure 2.1)[41], particularly in water for
further functionalization and derivatization.[42]. As a result, GO can form stable
aqueous colloids to promote the mass production of rGO, which is important for
industrial applications.

13
Figure 2.1 GO dispersed in DI water and other thirteen organic solvents by ultrasonication for 1 hour. Top:
as-prepared dispersions after sonication. Bottom: dispersions settled aside for 3 weeks after sonication.
[41]
Due to sp2 bonding networks disrupted by chemical oxidation process, GO is
electrically insulating. Thus, the reduction process is important to recover electrical
conductivity by restoring the p-network. The reduction methods can be described as
chemical, thermal, or electrochemical processes. Some of these methods can reduce
the GO to a condition very closely resembling pristine graphene in terms of the
electrical, thermal, and mechanical properties. The most commonly accepted reagent
used for chemical reduction is hydrazine, which is not a strong reductant reacting with
water [11]. The conductivity is usually enhanced by several orders of magnitude
during the reduction processes. However, compared to mechanically cleaved graphene,
the as-obtained rGO are much poorer in crystallinity and carrier mobility [43].
Moreover, the defects and vacancies within the sp2 carbon lattice, caused by the
chemical oxidation process in GO synthesis, are actually almost impossible to recover
by subsequent chemical reduction treatments[44]. Chemical reduction is a common
but certainly not the only method for the preparation of rGO. Instead of using a

14
chemical reduction route, directly heating GO in a furnace can also remove the oxide
functionalities from the GO sheets surface. Results of the thermal exfoliation and
reduction of GO have been reported [13, 19]. However, high temperature thermal
annealing easily gives rise to structural damage as CO2 released during the heating
process[45], and a pressure of 130 MPa is generated at 1000 OC. As a result, holes and
topological defects are left throughout the rGO sheets surface, which cause an
approximately 30% mass loss of GO.
The excellent electrical conductivity along with thermal conductivity, high surface
area (theoretically 2630 m2/g for single-layer graphene) and strong mechanical
strength [26] make the rGO useful in many applications, including electronics
[46],solar cells [47],fuel cells [29, 48] as well as energy storage and conversion
devices, such as supercapacitors [49, 50] and batteries[51-57]. Different from the
brittle graphite, rGO sheets are flexible, which is an advantage for fabrication of
flexible electronic and energy storage devices. Compared with the electrodes made
from graphite, electrochemically active sites of graphene electrodes represent a more
uniform distribution.
2.2 Limits of graphene and GO
The pristine graphene was first produced by micromechanical cleavage[1]. This
method involves two steps, repeatedly splitting graphite crystals by Scotch tape and
dissolving the resulted pieces in acetone. Although this method can produce the
pristine graphene used for theoretical research, its complicated process and small size

15
of graphene sheets obtained make the procedure difficult for practical applications.
The monolayer graphene also can be synthesized by CVD method at a high
temperature under vacuum. However, this method requires an operating temperature
as high as 1,000°C along with a hydrocarbon gas flow as precursor and pure hydrogen
as a carrier gas, which limits the application range. In the pristine graphene, the charge
carriers in this two-dimensional structural channel can change between the electrons
and holes with the application of an electrostatic gate, with a minimum density (or
Dirac) point characterizing the transition. The zero bandgap of graphene limits
achievable on–off current ratios[58].
GO is an insulator after the oxidation process of graphite as part of planar
sp2-hybridized geometry transformed to distorted sp3-hybridized geometry, which
loses the excellent electronic properties of graphite[13]. Therefore, GO has to be
reduced to restore the aromatic graphene networks so that the electrical conductivity
can be recovered, in which case, most of the oxygen-containing functionalities have to
be removed.
2.3 Structure of GO and rGO based material
Understanding the structure and properties of GO is important for discovering the
potential applications. Different from the perfect structure of pristine graphene sheets
solely consisting of sp2 carbon atoms in a honeycomb crystal lattice[59], GO has both
sp2- and sp3-hybridized carbon atoms in the hexagonal ring-based carbon networks
where oxygen functional groups produced by Hummer’s method are attached [60].

16
Unfortunately, until now, the structure of GO is still not quite clear because of its
partial amorphous character. Structural models of GO proposed in several early
researches[61] consisted of a regular lattice composed of discrete repeat units. The
widely accepted model, reported by Lerf and Klinowski, was a nonstoichiometric
structure (Figure 2.2) in which the carbon plane is decorated with hydroxyl and epoxy
(1,2-ether) functional groups[62, 63]. Carbonyl groups are decorated in the GO sheet
plane while the carboxylic acids are located at the sheet edge. More details have been
revealed by nuclear magnetic resonance (NMR) spectroscopy, which enriches our
knowledge of GO structure [64, 65]. Although the presence of epoxy and alcohol
groups on the sheet planes are still dominant, the groups of 5- and 6-membered lactols
have also been detected on the edges of graphitic platelets. In addition, the tertiary
alcohols and esters were found on the sheet surface.
Figure 2.2 The nonstoichiometric structure of carbon plane decorated with hydroxyl and epoxy (1,2-ether)
functional groups[62, 63].

17
Briefly, in the structure of GO, oxidized regions are the disrupted sp2 conjugated areas
where the sp3 hybridized carbons are covalently bonded with oxygen functional groups,
such as hydroxyl, epoxy, and carboxy(Figure 2.3). In another words, the original sp2
conjugated honeycomb-lattice structure can be interpreted as the unoxidized regions
while the sp3 hybridized carbon clusters are uniformly but randomly displaced on both
sides of the graphene plane[13].
Figure 2.3 (a) An epoxy group. The oxygen atom (in red) decorated on the top of carbon grid with 0.19nm.
(b) A hydroxyl group. The top hydrogen atom is 0.22 nm above the carbon grid. (c) Side view of a graphene
sheet decorated by functional groups including epoxy and hydroxyl on both sides. The oxygen atom (in red)
is 0.19 nm above the carbon grid. The top hydrogen atom (in grey) of the hydroxyl group is 0.22 nm above
the carbon grid. (d) The top view of (c). The thickness of GO is 0.78 nm[13].
For an in-depth investigation of GO structure, various detection methods have been
employed. Mkhoyan et al. used high-resolution annular dark field (ADF) under a
scanning transmission electron microscope (STEM) to exam the oxygen distribution on
a GO monolayer (Figure 2.4)[40]. According to the analysis of the results, the average
roughness of the GO sheet surface is 0.6nm and its distortions from sp3 hybridized
bonds cause the amorphous structure. Atomic force microscopy (AFM) is used to

18
directly measure the thickness of the single-layer GO as well as the number of
layers[66].
Figure 2.4 schematic of oxygen atoms (in red) attached onto carbon lattice. images of graphene with
attached to the surface. (a−d) Simulated STEM-ADF images represent possible cases of oxygen atom
bonded to the carbon lattice of graphene. (e) Oxygen atoms randomly attached to both sides of
graphene[40].
Scanning tunneling microscopy (STM), another atomic level imaging technique, has
been used to observe highly defective and intact regions [66, 67]. The results show that
oxygen functional groups introduced by the chemical oxidation process generate the

19
disordered structure of GO sheets. Therefore, the structure of GO consists both of
randomly distributed defective regions and non-oxidized intact areas. By calculating
the ratio of defective and intact regions, the degree of functionalization can be
estimated. Gómez-Navarro et al. reported other possible atomic structures using
aberration-corrected high-resolution transmission electron microscopy (HRTEM) [39].
They found disordered regions, including clustered pentagons and heptagons, and
in-plane distortions as well as the strain in the surrounding lattice. HRTEM images also
exhibit the GO structure with holes, graphitic regions, and disordered regions at the
atomic scale [39, 68]. The researchers demonstrated that the holes in GO are formed by
the release of carbon monoxide (CO) or carbon dioxide (CO2) molecules during the
oxidation process while some of the honeycomb graphitic structure is preserved due to
incomplete oxidation. In addition, the disordered regions consist of oxygen functional
groups, such as hydroxyls, (1,2) epoxies, and carbonyls (Figure 2.5)[13].

20
Figure 2.5 The replicated cells with various groups and defective regions. (a) Graphene attached by
individual epoxy groups (OX1). (b) Graphene attached by two epoxy groups arranged in a pre-unzipping
pattern (OX2). (c) After hydrolysis, graphene attached by 1,2-hydroxyl pair per epoxy group (OH1). (d)
Graphene attached by two 1,4-hydroxyl pairs (OH2), forming an isolated double bond (colored green). (e)
Graphene with the 5−7−7−5 defect (SW). (f) Graphene with a C2 vacancy (relaxed 5−8−5 defect structure).
[13]
2.4 Structural modelling of GO
The properties of graphene and GO are greatly dependent on the distribution and type of
functional groups and defects. Therefore, understanding the inside structure of them
arouses great interest. Structural modeling is broadly used to predict the structural
evolution during the oxidation and reduction of GO which allows controlling the
properties of the obtained graphene.[69]

21
Although the structure of GO is still unclear today due to its nonstoichiometry property,
the researchers reported several models proposed via computer modeling (Figure 2.6).
The atomic configuration of GO was first presented by Hofmann[41] with randomly
distributed epoxies. Ruess[41] suggested that hydroxyls are also common in GO,
moreover, he proposed that O atoms of epoxies connected with the 1,3 site C atoms
(1,3-ether) also exist. The skeleton of C atoms is strongly distorted into three
dimensional structure of GO by hydroxyls and these 1,3-ethers. In Scholz and Boehm’s
model[41], ribbons of conjugated carbon backbone and regular quinoidal species were
coexisted instead of epoxies. However, Nakajima–Matso’s[70] model put the oxygen
atoms in epoxies link adjacent layers. Zsabo and Dekeny's[61] model is the integration
of Sholz–Boehm and Ruess' models. Lerf-Klinowski’s[62] model is commonly used by
researchers, in which randomly distributed epoxy (1,2-ether) and hydroxyl are the
major functional groups across the carbon layer, and carboxyls, lactones, and carbonyls
are mainly distributed at the edge.

22
Figure 2.6 proposed models of grapheme oxide[41]
2.5 Properties of GO and rGO based material
GO has a variety of excellent properties including electronic, electrochemical thermal,
optical, mechanical properties as well as the chemical reactivity due to the oxygen
functional groups attached to its 2D structure surface. The electronic and
electrochemical properties will be briefly introduced in this section.

23
Table 2-1The properties of graphene and other carbon materials[71-75]
Part 1
Carbon allotropes Hybridized form Crystal
system Dimension
Experimental specific
surface area (m2 g−1) Density (g cm−3) Optical properties
Graphite sp2 Hexagonal Three ∼10–20 2.09–2.23 Uniaxial
Diamond sp3 Octahedral Three 20–160 3.5–3.53 Isotropic
Fullerene (C60) Mainly sp2 Tetragonal Zero 80–90 1.72 Non-linear optical
response
Carbon nanotube Mainly sp2 Icosahedral One ∼1300 >1 Structure-dependent
properties
Graphene sp2 Hexagonal Two ∼1500 >1 97.7% of optical
transmittance
Part 2
Carbon allotropes Thermal conductivity (W m−1 K−1) Hardness Tenacity Electronic
properties
Electrical conductivity
(S cm−1)
Graphite 1500–2000, 5–10 High Flexible non-elastic Electrical conductor Anisotropic, 2–3×10⁴, 6
Diamond 900–2320 Ultrahigh – Insulator, semi- –
Fullerene (C60) 0.4 High Elastic Insulator 10−10
Carbon nanotube 3500 High Flexible elastic Metallic and
semiconducting Structure-dependent
Graphene 4840–5300 Highest (single
layer) Flexible elastic
Semimetal, zero-gap
semiconductor 2000

24
2.5.1 Electronic Properties
In general, the chemical oxidation process introduces high density electronegative
oxygen atoms on the GO basal plane, which gives rise to an energy gap in the electron
density of states[76] (Figure 2.7), making GO non-conductive with a sheet resistance
(Rs) values of about 1012 Ω sq–1 or higher[77]. The intrinsic insulating nature of GO is
strongly correlated to the amount of sp3 C–O bonding, resulting in the transport barriers.
These defects disrupt the classical carrier transportation among the sp2 carbon
clusters[78]. As a result, Rs can be decreased by several orders of magnitude with the
reduction of GO using a variety of chemical and thermal treatments, which transforms
the material into a semiconductor or a graphene-like semimetal[79-81]. GO is an
electronically hybrid material consisting of both electrically conductive π-states from
sp2 carbon sites and a large energy gap (carrier transport gap) σ-states from sp3-bonded
carbons. The sp2 and sp3 fractions ratio changed by reduction chemistry is a powerful
way to tune the bandgap and therefore controllably transform GO from an insulator to a
semiconductor and to a graphene-like semi-metal[82]. This suggests a great potential
for tuning the energy gap by controlling the reduction processes.

25
Figure 2.7 Dependence of carbon−carbon bond length (a), chemisorption energy (b), and electron energy
gap (c) on oxygen functional groups coverage. The energy gap in c) opens 1.8 eV with 75% coverage and
then grows up to 2.9 eV while the coverage increase.
As discussed in section 1.5 and 2.3, the electrical conductivity can be recovered by
chemical or thermal reduction methods. Hydrazine was mostly used to reduce the
aqueous graphene oxide suspension and gained a paper-like material after filtration
which exhibits moderate electrical conductivity at 200 S m−1[11, 15, 83-88]. In order

26
to enhance the electrical conductivity of hydrazine reduced GO sheets, potassium
hydroxide (KOH) solution was added to GO dispersion to functionalize carboxylate
anions with K+ ions at the edges of GO sheets. The electrical conductivity of this KOH
modified rGO material achieved ~690 S m−1[89].
The electrical conductivity produced by hydrazine reduction can be further
dramatically improved by controlling the pH conditions of the GO dispersion. Li et al.
reported an rGO paper reduced by hydrazine under the condition of pH 10 showed an
excellent electrical conductivity of ~7,200 S m−1[10]. The reduction of a GO
dispersion by hydrazine easily results in the aggregation of rGO nanosheets. Therefore,
the reduction process was carried out under pH 10 conditions so that the neutral
carboxylic groups can be negatively charged to form carboxylate groups, which avoids
the agglomeration during the hydrazine reduction process.
On the other hand, although barely studied until recent years, rGO can be achieved by
thermal treatment with rapid heating (>2,000 °C min−1) up to 1,050 °C [13, 18, 19].
During the process, exfoliation of GO can be simultaneously carried out with its
reduction, rapid heating instantly generating a high pressure as much as 130 MPa at
the interlayers (Figure 2.8). The as-obtained TrGO sheets have a good electrical
conductivity in the range of (1–2.3) × 103 S m−1. Moreover, GO sheets oxidized by
Hummer’s method were reported as resulting in partial reduction by a step heat
treatment at 200 °C for 1 h, followed by increasing the temperature to 300 °C in an Ar

27
flow. After the thermal annealing, the sample resistance went down to ∼ 750 kΩ from
insulating [21].
Figure 2.8 X-ray Diffraction (XRD) patterns of graphite, GO, TrGO by slow heating (1 °C/min), and
functionalized single graphene sheet (FGS). The slow heat treatment for GO maintains the initial graphite
spacing due to the gas evolution is insufficient to yield a high pressure overcoming the van der Waals
force between the layers[19].
2.5.2 Electrochemical Properties
Recently, GO has been is employed as an electrode surface material due to its
excellent electrocatalytic properties [90, 91] which have been applied in
electrochemical reduction [92-94]. Ramesha et al. reported that the reduction of GO
occurred at −0.6 V and completed in only one scan. This electrochemically
irreversible process was carried out by cyclic voltammetric scanning from 0 to −1 V in
a 0.1 M KNO3 solution[94]. Zhou et al. found the participation of H+ ions in the
reduction process under low pH conditions, indicating controlling the pH value of the

28
buffer solution can improve the potential of the reduction process. The electrical
conductivity of as-obtained rGO film was approximately 8500 S m-1 and the C/O ratio
achieved a high value of 23.9[95]. An et al. reduced GO sheets on the anode surface
by electrophoretic deposition (EPD) (Figure 2.9) [93]. The as-deposited rGO film has
an improved electrical conductivity of 1.43×10⁴ S m-1 which is higher than that of the
filtration method[93]. GO-based materials can be deposited onto well-defined surfaces
through solution processing, which allows sensitive or electroactive species
incorporating into an electrochemical system.
Figure 2.9(a)schematic diagram of the EPD process and (b) cross-sectional SEM image of EPD-GO
film[93].

29
GO can accommodate the active species and facilitate their electron transfer (ET) at
electrode surfaces due to its advantageous electron mobility and unique surface
properties, such as high specific surface area and one-atom thickness[84, 92].
Moreover, GO has potential application in energy storage devices due to its high
electrochemical capacitance with prominent cycle performance[96]. It has been
reported that rGO presents much higher electrochemical capacitance and cycling
durability than carbon nanotubes (CNTs)[91]. The specific capacitance was found to
be ~165 for rGO while CNTs achieved ~86 F g-1. Compared with conventional
electrodes, the manufacturing costs for electrochemical applications can be reduced
due to the larger surface area-to-volume ratio of GO which decreases the usage of
materials in the fabrication of electrode films. Scientists therefore have switched their
interest toward GO and rGO applications particularly in electrochemical applications
due to their facile synthesis, high dispersibility in a range of solvents and capability of
anchoring electroactive species onto the surface.
2.5.3 Chemical activity
GO exhibits a unique chemical activity owing to the oxygen functional groups
attached onto its basal plane. These chemically reactive functional groups allow GO
chemical functionalization with other groups by covalent or non-covalent binding. The
covalent functionalization is typically approached by amidation or esterification of
selected small molecules with the carboxyls or hydroxyls on GO sheets [97-99]. The
carboxyls can be activated through coupling reactions to make GO soluble in organic

30
solvents. For functionalizing GO sheets, the materials decorated by carboxyl
functional groups react with thionyl chloride (SOCl2) and then coupled with
octadecylamine[97]. The epoxy group is another candidate for the covalent
functionalization via ring-opening reaction, the amine acting as a nucleophile to attack
α-carbon [100, 101]. Wang et al. fabricated surface-functionalized GO sheets by
attaching octadecylamine with the epoxy groups via a ring-opening reaction [100].
These high-quality GO based nanocomposites can dispersed in organic solvents to
form uniform suspension at single layer level. Yang et al. reported another
modification process of GO by a ring-opening reaction with the epoxy groups[101].
Different from Wang’s procedure, the ionic liquid
(1-(3-aminopropyl)-3-methylimidazolium bromide; R-NH2) reacted with the epoxy
groups promises an excellent dispersion of resulted GO nanocomposites in DI water,
N,N-dimethylformamide (DMF), and dimethyl sulfoxide (DMSO) due to their high
polarity.
For non-covalent functionalization of GO, its unoxidized sp2 networks are used for
non-covalent binding including π–π stacking, cation−π and van der Waals interactions.
Yang et al. synthesized a hybrid material of doxorubicin hydrochloride (DXR) and
GO by non-covalent interactions. The quinone functionality attached on DXR and the
sp2 carbons of GO were dominantly π–π stacked together as well as hydrophobic
interactions. Moreover, the results also indicated the existence of strong hydrogen

31
bonding in both DXR and GO,–OH and –NH2 groups in DXR as well as –OH and
–COOH groups of GO (Figure 2.10 and Figure 2.11)[102].
Figure 2.10 Synthesis schematic diagram of Graphene-TPP[102].
Figure 2.11 Synthesis schematic diagram of Graphene-C60[102].
2.5.4 Wettability of graphene
According to the description of graphene, GO and rGO structures in section 2.3, the
hydrophilic GO sheets can be converted to hydrophobic rGO sheets by a chemical
reduction process. As a result, the tunable wettability allows rGO great potential in
applications such as energy storage, surface coating [103-106], nanopores
sequencing[107] and filtration[108] due to its water wettability playing an important
role in the fabrication of devices. In addition, the water wettability of rGO affects
other properties such as carrier mobility[109], adhesion[110] and charge doping[111]

32
due to the surface property essentially determining the compatibility of rGO in device
fabrication. As a result, the surface of rGO material, which has a hydrophobic property,
needs to be modified to prepare hybrid materials[112], electrode coatings[47] or
biological applications[113]. Goncalves et al. modified the GO surface with oxygen
functionalities to obtain reactive sites for growing gold NPs in aqueous
suspension[112]. This growth depends on the oxidation degree of the rGO surface as
no gold NPs can be obtained on the completely reduced GO surface. Wang et al.
fabricated solid-state dye-sensitized solar cells with thermally reduced GO as
electrodes [47]. After the heat treatment of GO film at 400 °C, the surface wettability
of the resultant rGO film can be tunable from 66.5−69° to 2.2−8.6° by treating with
argon plasma for 30 s. Wang et al. synthesized rGO electrodes by the Hummers and
Offeman Method for selective determination of dopamine[113]. They found a
promotional performance of rGO that π–π interaction between two rGO surfaces and
dopamine enhance the electron transfer and weakens the oxidation process of ascorbic
acid.
The wettability of graphene samples produced by epitaxial growth has recently
revealed that most graphene is hydrophobic, indicating a similar wettability to graphite.
Shin et al. reported that the water contact angle of graphene, which was epitaxially
grown on a SiC substrate, was measured at 92° and its wettability could not be
affected by sample thickness[111]. Kim et al. measured the contact angle of graphene
prepared by the CVD method [104]. The multilayer graphene grown on nickel (Ni)

33
and the monolayer graphene grown on copper (Cu) have slightly different contact
angles at 90.4° and 93.8°, respectively. However, the wettability of monolayer
graphene deposited on different substrates such as copper, glass and SiO2 leads to a
variety of contact angle at 86°[114], 48.1°[114] and 40°[115], respectively. As a result,
compared to free-standing rGO paper, the wettability of monolayer graphene has been
affected by the substrate and its quality.
2.6 Synthesis of GO and rGO based material
2.6.1 Chemical oxidation process
2.6.1.1 Brodie Method and Staudenmaier Method
Graphite oxide was first prepared by Brodie when he was researching graphite in
1859[116]. The graphite was oxidized by adding potassium chlorate (KClO3) in a
graphite/nitric acid (HNO3) mixture. The resulting graphite oxide contained carbon,
oxygen and hydrogen. After repeatedly washing, drying and re-oxidation, the graphite
oxide was light yellow and stable in additional oxidation treatment. Staudenmaier
developed Brodie’s work by increasing the acidity of the graphite/HNO3 mixture and
slowly adding potassium chlorate solution to the mixture. These two variations
improved the quality of the highly oxidized GO and simplified the synthesis process.
However, this method required a long time for the addition of potassium chlorate and
the as-formed chlorine dioxide gas was hazardous. The mixture of potassium chlorate
and nitric acid was previously used in the synthesis of nanotubes [117] and
fullerenes[118]. However, the oxidation reagent introduced too many oxygen

34
functional groups such as carboxyls, lactones, ketones, and released toxic gases of
nitrogen dioxide (NO2) and dinitrogen tetroxide (N2O4). Therefore, the oxidation
process of graphite still needed to be improved.
2.6.1.2 Hummers Method and modified Hummers Method
Hummer and his colleagues developed the oxidation process for preparation of GO
now named Hummer’s Method [119]. In this method, a water-free mixture of
concentrated sulfuric acid, sodium nitrate and potassium permanganate was mixed and
maintained below 45 °C for two hours. The final product had a higher oxidation
degree than that of the Staudenmaier Method.
However, it was found that the products made by Hummer’s Method usually have an
incompletely oxidized graphite core with GO shells. As a result, pretreatment was
needed for an excellent oxidation with Hummer’s Method. Kovtyukhova first
introduced a pretreatment for Hummer’s Method by adding graphite to the mixture of
concentrated sulfuric acid (H2SO4), potassium persulfate (K2S2O8), and phosphorus
pentoxide (P2O5) at 80 °C for several hours (Figure 2.12)[120]. The pre-oxidized
graphite was then washed by repeated filtration and washing with DI water followed
by air drying.

35
Figure 2.12 A Schematic diagram of GO preparation by modified Hummer’s method [120].
Another modified Hummer’s Method was reported by Marcano et al. in 2010[121].
They added phosphoric acid instead of sodium nitrate as well as increasing the amount
of potassium permanganate. In this method, graphite reacted with six equivalents of
potassium permanganate (KMnO4) in a 9:1 mixture of H2SO4/phosphoric acid (H3PO4).
This method reduces the toxic hazard due to the absence of sodium nitrate (NaNO3) in
the process avoiding the NO2, N2O4 or chlorine dioxide (ClO2) emission.
In summary, the above mentioned four recipes for graphite oxidation yield the
potential for large-scale production of graphite oxide. Today, GO sheets produced by
modified Hummer’s Method can achieve the ultra-thin thickness of 1 nm, indicating a
single layer material. Furthermore, these GO sheets can be fabricated under vacuum
filtration as a paper-like material named GO paper.

36
2.6.2 Reduction strategies of GO
2.6.2.1 Thermal Annealing for Reduction
GO can be reduced by heat treatment without any extra reductant regent, the process
being named “thermal annealing reduction”. High temperature heating significantly
affects the efficiency of the reduction process in the initial stages [13, 15, 77, 122].
During the high temperature reduction process, CO or CO2 gases is rapidly evolved at
the graphene interlayers due to the oxygen functional groups attached on GO plane
formed as gases. Therefore, exfoliation of GO can be simultaneously carried out with
its reduction due to rapid heating instantly generating a high pressure as much as 130
MPa at the interlayers, which is enough to isolate GO sheets[19]. The as-obtained
TrGO sheets have a good electrical conductivity in the range of (1–2.3)×103 S m−1.
Wu et al. reported an arc-discharge treatment in the preparation of rGO sheets which,
due to the high temperature produced by this method, can exfoliat graphite oxide to
GO and reduce it to rGO in a short time[122]. The elemental analysis of the resulted
rGO shows a high C/O ratio between 15to18 and a sheet electrical conductivity of
about 2×10⁵ S m-1. Schniepp et al. analyzed the reduction level at different
temperatures. The C/O ratio was measured at less than 7 when the temperature was
under 500 °C while the ratio could be increased to over 13 at 750 °C. [13]. Wang et al.
reported that the electrical conductivity of rGO sheets prepared by thermal reduction
at 500 °C was only 50 S/cm. However, the electrical conductivities could be increased

37
to 10,000 S m-1 at 700 °C and 550 S cm-1 at 1100 °C. The electrical conductivity of
TrGO sheets fabricated at different temperatures is shown in Figure 2.13[47].
Figure 2.13 The electrical conductivity of rGO sheets produced by thermal annealing increases from 49, 93,
383 to 550 S/cm at the annealing temperature of 550 OC, 700 OC, 900 OC and 1100 OC, respectively[47].
Annealing atmosphere is another crucial factor for the thermal annealing reduction of
GO. Normally, the thermal reduction process is carried out under vacuum[77] or a
protection gas[47] in order to cut off the oxygen gas rapidly generated during the high
temperature heating process [18, 47, 123, 124]. Becerril et al. suggested thermally
reducing GO sheets at 1000 °C under high vacuum(<10−5 Torr) as the fresh rGO easily
reacts with the residual oxygen functional groups[77]. The resulted TrGO has a low
sheet resistance about 102 −103 Ω sq-1 and a high transmittance of 80% under 550 nm
light.
An inert gas can also facilitate the reduction process. For example, the reducing gas of
H2 introduced to the thermal reduction process can lower the heating temperature due

38
to its excellent reducibility. Wu et al. introduced a gas mixture of Ar/H2 (1:1) in the
thermal process to reduce GO sheets at 450 °C for 2 h. The as-prepared rGO sheets
has a high electrical conductivity of ∼1×10⁵ S m-1 with a C/O ratio of 14.9. Li et al.
reported that the thermal treatment under a low-pressure ammonia atmosphere (2 Torr
NH3/Ar (10% NH3)) simultaneously reduced GO and doped nitrogen on as-formed
rGO sheet plane[124]. The highest doping level of ∼5% N was recorded at 500 °C by
thermal annealing GO in NH3. Moreover, rGO sheets clearly exhibited n-type electron
doping behavior, which could be beneficial for electronic device fabrication. Recently,
Lopez et al. pointed out that vacancies in the rGO plane could be partially “repaired”
by exposing rGO sheets to a carbon source such as ethylene at a high temperature
(800 °C), a similar condition used for CVD growth of single-walled nanotubes
SWCNTs[125]. The sheet resistance of repaired rGO sheets can be decreased to 28.6
kΩ sq-1 (or 35,000 S m-1) [126]. Su et al. reported a similar defect-healing process by
functionalization of rGO sheets with aromatic molecules during heat treatment. The
resultant modified rGO has denser graphitic regions and good electrical conductivity
at 1.31×10⁵ S m-1 [127].
2.6.2.2 Low temperature thermal annealing for reduction
Recent experimental research shows that many oxygen functional groups are not
difficult to remove at low temperatures. Actually, the deoxygenation processes of GO
can even be approached at 200 OC.

39
Figure 2.14 FTIR spectra of GO and rGO annealed for 6 hours and 10 hours, respectively, in the (a) range
of 800-4000 cm-1 (b) range of 900-2000 cm-1. The W, H, E, and CX represent FTIR peaks of water,
hydroxyl, epoxide, and carboxyl, respectively. Peaks C=C and C–O represent the bond stretching
vibrations [128].
Jeong et al. demonstrated that most oxygen functionalities can be removed by low
temperature thermal annealing at 200 °C in a low-pressure argon atmosphere (550
mTorr) [128]. Fourier transform infrared spectroscopy (FTIR) was used to investigate
the as-formed rGO material which had been annealed for 6 h, as shown in Figure 2.14.

40
The peaks of epoxy and carboxyl groups are found to apparently decrease while the
hydroxyl peak completely disappears. After low temperature annealing for 10 h, the
epoxy and carboxyl peaks decrease dramatically and a C/O ratio of around 10 is
achieved.
2.6.2.3 Chemical reduction
GO can also be reduced by chemical reagents through chemical methods. Normally,
the reduction is carried out at room temperature followed by a low temperature
annealing, which is different from thermal annealing reduction. Chemical reduction is
therefore another procedure for the mass production of rGO sheets.
The reduction of GO using hydrazine which was first reported by Stankovich et al. [11]
and[14] is the method mostly used today [14, 22, 43, 67, 117, 118, 129-137].
Hydrazine reduction is started by adding the reducing reagent to a GO dispersion
which is usually prepared by Hummer’s Method. During the reduction process, partly
reduced GO sheets are aggregated due to the increase of hydrophobility.
Fernandez-Merino et al. reported a high electrical conductive rGO fabricated by
hydrazine reduction with a C/O ratio of 12.5[130]. In order to facilitate the
applications of hydrophobic rGO material, the surfactants including soluble
polymers[14] or ammonia[129] are added to the dispersion to maintain its colloidal
state. The resultant colloidal dispersion of rGO sheet based composites can be filtered
to form rGO based composite films[129].

41
Apart from the above introduced reduction methods for rGO, Table 2-2 lists some
other reduction process and the resultant properties of rGO.
Table 2-2 Comparison of the different reduction methods of GO.
Reduction method Electrical
conductivity(S/m) C/O ratio Ref. no.
Hydrazine hydrate 200 10.3 [11]
Hydrazine reduction in colloid state 7200 NAb [129]
150 mM NaBH4 solution, 2 h 4.5 8.6 [138]
Hydrazine vapor NG ~8.8 [15]
Thermal annealing at 900℃, UHVa NG ~14.1
Thermal annealing at 1100℃, UHV ~105 NA [77]
Thermal annealing at 1100℃ in Ar/H2 72700 NA [47]
Multi-step treatment:
(I) NaBH4 solution
(II) Concentrated H2SO4 180℃, 12 h
(III) Thermal annealing at 1100℃ in
Ar/H2
(I) 82.3
(II) 1660
(III) 20200
(I) 4.78
(II) 8.57
(III) >246
[65]
Vitamin C
Hydrazine monohydrate
Pyrogallol
KOH
7700
9960
480
0.1910
12.5
12.5
NA
NA
[130]
55% HI reduction 29800 >14.9 [139]
a UHV: ultra high vacuum.
b NA: not available.
2.6.3 Functionalization with NPs
Because of the unique structures and excellent properties of GO-based
nanocomposites, the numerous promising applications in the field of electrochemistry
are apparent and research into these remarkable and intriguing materials has become
very popular nowadays. The unique properties of GO nanosheets make GO-based
nanocomposites extremely useful as the NP support due to their high surface area,

42
which is essential for the dispersion of the NPs as well as the electrochemical
activities. The GO-supporting materials maximize the capability of the nano-scale
surface area for electron transfer and provide for better mass transport of the
electroactive sites on the electrode surface. Additionally, the collecting and
transferring of the electrons to the collecting electrode surface are promoted by the
conductive GO support. Also, nanoscale composite electrodes could be realized by the
functionalization of GO with NPs. The improved performance of GO-based
nanocomposite-modified electrodes, such as excellent catalytic activity, enhanced
mass transport, high effective surface area, and control over the electrode
microenvironment, shows superior properties over macroelectrodes in electrochemical
applications. Moreover, in some functional electrochemical applications, the
combination of GO with NPs present the capability of providing additional properties.
Earlier researches were focused on the preparation of functional GO/inorganic
nanocomposites derived from the GO sheets decorated with inorganic NPs, such as
metal NPs and MO NPs, which are used in electrochemical sensing, catalysis, and fuel
cells. There are different physical and chemical approaches to preparing these
functional metal or MO/GO nanocomposites. In situ chemical reduction process [23,
48], electrochemical synthetic processes[135, 140], impregnation processes[37], a
self-assembly approach[141] and ultrasonic spray pyrolysis[49] are typical physical
attachment approaches. Among these methods, MO NPs dissolved in GO dispersion

43
for preparation of GO-based nanocomposites is widely used due to the hydrophilic
property of GO.
Figure 2.15 A general solution strategy for fabrication of MO/ rGO composites [142].
For instance, Dong et al. used ethylene glycol reduction to deposit platinum (Pt) and
platinum–ruthenium (Pt–Ru) NPs onto surfaces of GO nanosheets[143]. Their results
demonstrated that for both methanol and ethanol oxidation used in fuel cell
applications, GO acts as a catalyst support on the electrocatalytic activity of Pt and
Pt–Ru NPs. As a catalyst support, GO showed efficient enhancement of the
electrocatalytic activity of Pt and Pt–Ru NPs for the oxidation of methanol and ethanol
into CO2 comparing to carbon black. To improve the cyclic performance and lithium
storage capacity, Paek et al. prepared SnO2/GO nanoporous electrodes with

44
three-dimensionally delaminated flexible structures by using an
exfoliation-reassembly method[144]. Their experimental results suggest that the
dispersed GO nanosheets were reassembled and homogeneously distributed in the
ethylene glycol solution among the loosely packed SnO2 NPs. The volume expansion
could be controlled by the insertion of lithium in the SnO2/GO nanoporous electrodes
which resulted in excellent cyclic performances.
In order to establish another platform for electrochemical applications, quantum dots
(QDs) have also been used to functionalize GO [145-147] as well as NPs such as
Prussian blue [148], metal hydroxides[149], and polyoxometalates[150]. By
introducing the in situ growth of QDs on noncovalently functionalized rGO,
QD-sensitized rGO nanocomposites can afterwards be used as an efficient platform in
photoelectrochemical applications. Moreover, to functionalize the GO-based
electrodes for electrochemical applications, others, for instance, Chen et al. fabricated
rGO–Co(OH)2 nanocomposites in a water–isopropanol system which showed
significantly improved electrochemical performance of Co(OH)2 after deposition on
rGO sheets[151].
2.6.4 Size effect of quantum dots and nanoparticles
Quantum dots (QDs) have smaller radii than the bulk exciton Bohr radius constituting
a class of materials between molecular and bulk forms of matter. Quantum
confinement between the electron and hole in the material leads to an increase in the
effective bandgap with decreasing crystallite size. Therefore, their optical absorption

45
and emission blue shift to the higher energies wavelength as the size of the dots gets
smaller (Figure 2.16). The structural studies indicate that the bulk crystal structure and
lattice parameter can be retained although the nanocrystallites are not completed in the
bulk materials.
Figure 2.16 Size dependent fluorescence spectrum of QDs[152]
The light also can irradiate the small spherical metallic nanoparticles to produce the
conduction electrons in the oscillating electric field[153]. Figure XX shows that the
electron cloud distributed to the nuclei oscillates relative to the nuclear framework
with a restoring force arises from Coulomb attraction between electrons and nuclei.
The resulted oscillation frequency is affected by four electron properties: the density
of electrons, the effective electron mass, and the size and the shape of the charge
distribution.

46
Figure 2.17 Schematic of oscillation for a sphere nanoparticle, showing the displacement of the conduction
electron charge cloud relative to the nuclei[153].
2.7 Functionalization and Application for rGO based material
2.7.1 Introduction
As with graphene, recent researches indicate that GO based materials have great
potential for various applications such as gas- or bio-sensors [72], nanogenerators
[154], field emission devices [155], chemical sensors [87], catalysts [156],
dye-sensitized solar cells [47], organic solar cells [157], photocatalysts [158], and
hydrogen storage [159], etc.(Figure 2.18).

47
Figure 2.18 The potential applications for graphene and its complex materials[160].
Among these applications, GO-based electrodes fabricated for electrochemical
applications by reliable and low-cost methods have attracted great interest due to their
excellent properties as discussed in section 2.5. For example, Large-area rGO sheets
have the potential to replace indium tin oxide (ITO) in display applications, such as
touch screens or organic light-emitting diodes (OLED), if mass production can be
achieved due to its transparency and electrical conductivity [161, 162]. Moreover,
compared to the frangible and rigid indium tin oxide (ITO), rGO is competitive in
flexibility and processability for fabrication of electronic devices. RGO based
nanocomposites fabricated by encapsulating metal or MO particles as well as
polymers have performed efficiently in multifunctional materials to enhance the
volume expansion of pure metal or polymer electrodes[163-165].

48
RGO material has already been accepted as an alternative anode material in lithium
ion storage with large capacities of lithium[166]. In addition, the high electrical
conductivity as well as electron and lithium ions mobility of rGO sheets are quite
compatible for diffusion of lithium ions in electrodes. In addition, C-C bonds of sp2
region in rGO sheet plane allow a metastable nanostructure during the electrochemical
process between the electrodes. As a result, we will briefly introduce the development
of rGO based electrodes in LIBs as well as its functionalization with MO NPs and the
performance of resultant hybrid materials.
2.7.2 RGO based electrodes for LIBs
RGO is a new promising anode material in LIBs because of its unique physical and
chemical properties including:
(i) Excellent electrical conductivity to graphitic carbon;
(ii) A broad electrochemical window. This is a crucial element in enhancing energy
density which is proportional to the square of the window voltage;
(iii) The possibility to manufacture flexible electrodes due to the flexibility of the
structure;
(iv) The thermal and chemical stability allow it to be used in harsh environments;
(v) High surface area. The specific surface area of monolayer pristine graphene is
around 2620 m2 g−1 theoretically;
(vi) The ultrathin thickness distinctly shortens the diffusion distance of ions;

49
(vii) The high surface-to-volume ratio offers more active sites for electrochemical
reactions and/or ion adsorption;
(viii) Abundant surface functional groups make it hydrophilic in aqueous
electrolytes, but also provide binding sites with other atoms or functional groups
which is important for electrode fabrication of LIBs;
(ix) Cost effective. Mass production of rGO prepared from graphite through chemical
oxidation and exfoliation in DI water or polar solvents followed by chemical
reduction of GO is relatively low cost, which is crucial for practical applications.
As a commercially used anode material, graphite suffers from its theoretical capacity
of 372 mAh g−1, which limits its application in high energy capacity LIBs[167]. In
order to increase the energy capacity, efforts have been put into developing other
high-capacity carbonaceous materials, such as CNTs [168], carbon nanofibers[169],
and hierarchically porous carbons[55]. Yoo et al. first reported the specific capacity of
rGO sheets could reach 540 mA h g−1which is much higher than that of graphite[166].
They also pointed out that lithium storage properties could be affected by the layer
spacing between the rGO individual sheets. By embedding CNTs or fullerene
macromolecules into rGO layers, the resultant hybrid materials have higher capacities
of 730 and 784 mAh g−1 due to the additional sites and the increased interlayer
distance provided by embedded carbon materials for lithium ion storage [166]. Wang
et al. demonstrated a preparation method for flower-like rGO which can improve
lithium storage capacity to 650 mAh g−1 and cyclic stability of 460 mAh g−1 after 100
50
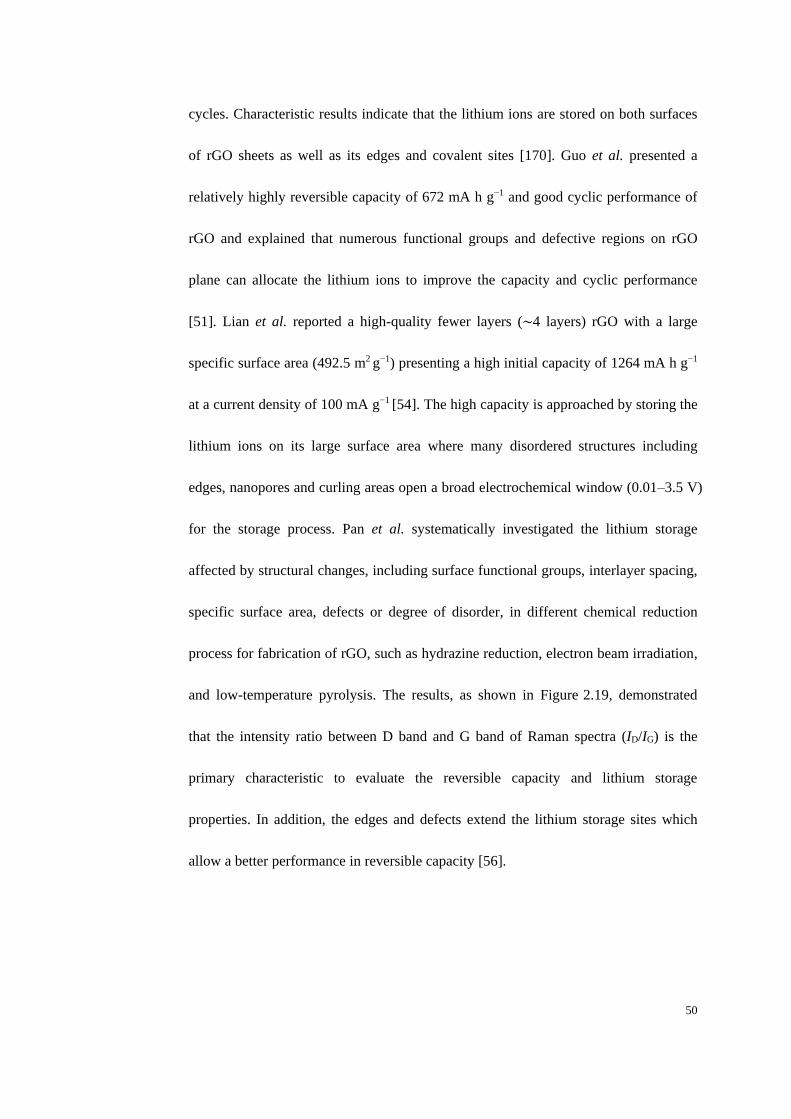
cycles. Characteristic results indicate that the lithium ions are stored on both surfaces
of rGO sheets as well as its edges and covalent sites [170]. Guo et al. presented a
relatively highly reversible capacity of 672 mA h g−1 and good cyclic performance of
rGO and explained that numerous functional groups and defective regions on rGO
plane can allocate the lithium ions to improve the capacity and cyclic performance
[51]. Lian et al. reported a high-quality fewer layers (∼4 layers) rGO with a large
specific surface area (492.5 m2 g−1) presenting a high initial capacity of 1264 mA h g−1
at a current density of 100 mA g−1 [54]. The high capacity is approached by storing the
lithium ions on its large surface area where many disordered structures including
edges, nanopores and curling areas open a broad electrochemical window (0.01–3.5 V)
for the storage process. Pan et al. systematically investigated the lithium storage
affected by structural changes, including surface functional groups, interlayer spacing,
specific surface area, defects or degree of disorder, in different chemical reduction
process for fabrication of rGO, such as hydrazine reduction, electron beam irradiation,
and low-temperature pyrolysis. The results, as shown in Figure 2.19, demonstrated
that the intensity ratio between D band and G band of Raman spectra (ID/IG) is the
primary characteristic to evaluate the reversible capacity and lithium storage
properties. In addition, the edges and defects extend the lithium storage sites which
allow a better performance in reversible capacity [56].
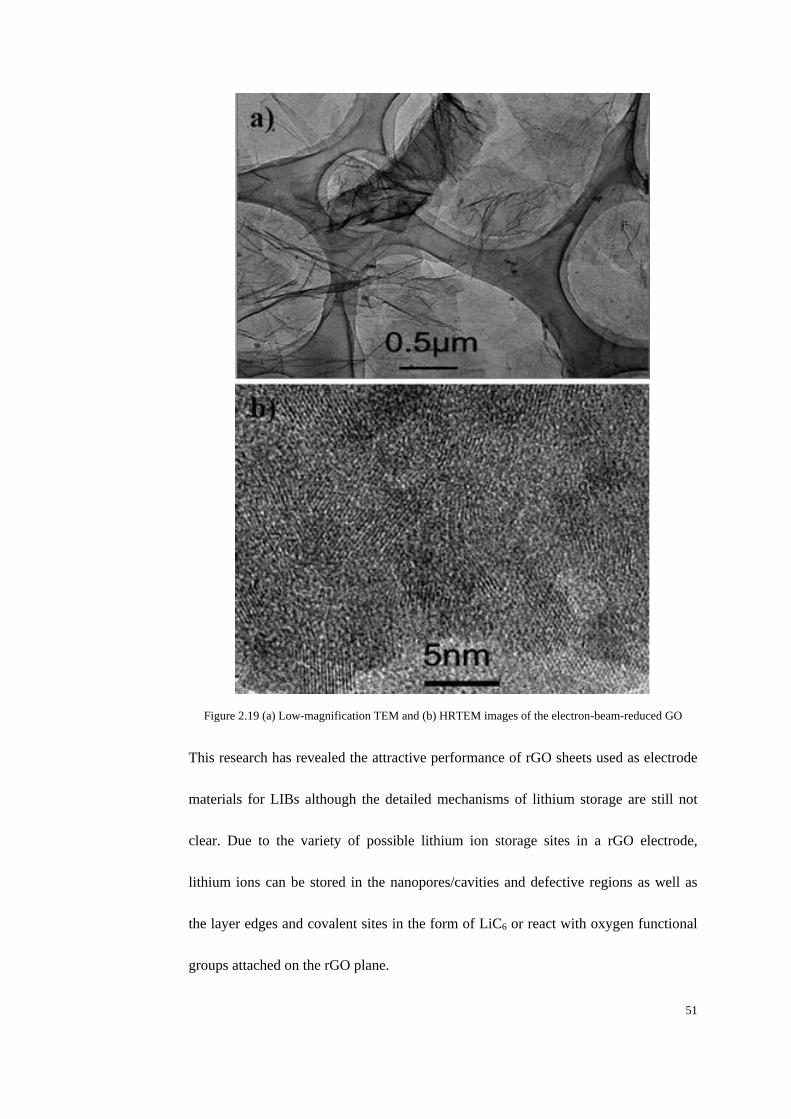
51
Figure 2.19 (a) Low-magnification TEM and (b) HRTEM images of the electron-beam-reduced GO
This research has revealed the attractive performance of rGO sheets used as electrode
materials for LIBs although the detailed mechanisms of lithium storage are still not
clear. Due to the variety of possible lithium ion storage sites in a rGO electrode,
lithium ions can be stored in the nanopores/cavities and defective regions as well as
the layer edges and covalent sites in the form of LiC6 or react with oxygen functional
groups attached on the rGO plane.

52
2.7.3 MOs based electrodes for LIB
Due to having more than twice the capacity of graphite, MOs have been accepted as
the electrode materials for LIBs. [57, 171]. The electrode reaction mechanism of MOs
can be divided into three groups: conversion reaction(1), Li-alloy reaction(2), and Li
insertion/extraction reaction(3). The mechanism of the conversion reaction is:
0
2M O 2 2 Li M Li Ox y y e y x y (1)
Where M is a metal, such as Sn, Fe, Cu, Co, Ni, and Mn. Homogeneous distribution of
metal NPs are embedded in a Li2O matrix in the final product. Nevertheless, the poor
cyclic performance caused by huge volume expansion and severe aggregation of MOs
during charge/discharge significantly hinder this approach in practical application of
LIBs. Moreover, large voltage hysteresis is needed between charge and discharge and
poor energy efficiency is displayed. The reaction(2) mechanism of Li-alloy is:
M Li Li Mzz e z (2)
For instance, Li2O and metallic tin is formed after the conversion reaction mentioned
above of a tin-based oxide, then lithium ions can be stored and released by the in-situ
formed tin distributed in Li2O due to Li–Sn alloying/de-alloying reactions up to the
theoretical limit of Li4.4Sn corresponding to a theoretical reversible capacity of 782
mAh g−1 based on the mass of SnO2 [57]. However, due to large volume changes (up
to 300%) during charge/discharge process, it has poor cyclic performance which leads
to mechanical disintegration and the loss of electrical connection of the active material

53
from current collectors. The insertion and extraction process of Li+ from the MO
lattice structure can be described as follows(3):
MO Li Li MOx y xy e y (3)
For example, following a typical Li intercalation process, TiO2 is a common anode
MO with a volume change smaller than 4% in the reaction(4):
+ -
2 2TiO Li e 4Li TiO 0 1xx x x (4)
Small lattice change during the lithium intercalation and extraction process guarantees
the structural stability and cycling life. The intercalation potential of lithium is about
1.5 V, in that case, the avoidance of electrochemical Li deposition intrinsically
maintains the safety of the electrode. However, the slow ionic and electronic diffusion
of bulk TiO2 leads to low specific capacity, poor lithium ionic and electronic
conductivity as well as high polarization. Nevertheless, the capacity of lithium ions
can be enhanced by reacting with metallic/semi-metallic elements and metal alloys,
such as Si, Ge, Bi, Sn, Cu–Sn, and Ni–Sn.
2.7.4 MO/rGO based electrodes for LIBs
According to the research described in sections 2.7.2 and 2.7.3, the use of MO/rGO
composites is expected to be an efficient and practical approach to improving the
electrochemical performance of LIBs (Figure 2.20).

54
Figure 2.20 Schematic of the preparation of MO/graphene composites with synergistic effects between
these two components [142].
RGO sheets are proved to be successfully anchoring MO NPs on its plane edges and
surfaces to form MO/rGO nanocomposites. However, the uncontrolled agglomeration
and growth of large particles during the preparation cause poor properties of resultant
composites. In order to improve the properties of MO/rGO, it is necessary to
synthesize MO nanostructures with controlled size, uniform morphology, good
crystallinity and high dispersion. As a result, MO/rGO composites are normally
prepared by dissolving MO NPs into a GO dispersion. This solution strategy results in
a uniform distribution of MO NPs on rGO sheets with controllable size, shape and
crystallinity, which is preferred in LIBs.

55
Table 2-3 lists the research on a variety of MO/rGO composites and their structural
and electrochemical properties.

56
Table 2-3 The electrochemical properties of MO/rGO composites for LIBs [172].
G/MO Performance improvements
Ref.
no.
G/SnO2
A specific capacity of 810 mA h g−1, 70% capacity retention after 30 cycles [31]
A specific capacity of 765 mA h g−1 in the first cycle, maintained a capacity of 520 mA h g−1after 100 cycles [173]
A reversible capacity of 862 mA h g−1, maintained 665 mA h g−1 after 50 cycles [174]
An initial reversible capacity of 786 mA h g−1, 71% capacity retention after 50 cycles [175]
A reversible capacity of 634 mA h g–1 with a coulombic efficiency of 98% after 50 cycles [52]
The capacities were 673, 424, 295, 190 and 120 mA h g−1 at 130, 450, 1400, 6000 and 8000 mA g−1, respectively [160]
600 mA h g−1 after 50 cycles and 550 mA h g−1 after 100 cycles, 550 mA h g−1at the 2 C rate, and 460 mA h g−1 at as high rate as
5 C rate
[176]
A reversible capacity of 838 mA h g−1, the charge capacity of the hybrid electrode remains at 510 mA h g−1 after 20 cycles [177]
A reversible specific capacity of 1304 mA h g−1 at 100 mA g−1 and the reversible capacity was still as high as 748 mA h g−1 at [178]

57
1000 mA g−1
A charge capacity of 840 mA h g−1 (with capacity retention of 86%) after 30 cycles at 67 mA g−1, and it could retain a charge
capacity of about 590 mA h g−1 at 400 mA g−1and 270 mA h g−1 at 1000 mA g−1 after 50 cycles
[179]
A reversible capacity of 518 mA h g−1 after 50 cycles at 400 mA g−1 [180]
A capacity of 2140 mA h g−1 and 1080 mA h g−1 for the first discharge and charge at a current density of 50 mA h g−1, and good
capacity retention with a capacity of 649 mA h g−1 after 30 cycles
[181]
A stable capacity of 775.3 mA h g−1 after 50 cycles at 100 mA g−1 [182]
G-CNT/ SnO2 The capacities of 345 and 635 mA h g−1 can be obtained at 1.5 and 0.25 A g−1 and the flexible SnO2–G–CNT papers present a
stable capacity of 387 mA h g−1 at 0.1 A g−1 after 50 cycles
[183]
G/Co3O4
Large reversible capacity (935 mA h g−1 after 30 cycles), excellent cyclic performance, good rate capability [184]
A high capacity of 931 mA h g−1 was obtained at 4450 mA g−1 [185]
Reversible capacity after 100 cycles is 975 mA h g−1 with the irreversible capacity loss less than 3% [186]
>800 mA h g−1 reversibly at 200 mA g−1, >550 mA h g–1 at 1000 mA g−1 [53]

58
941 mA h g−1 in the initial cycle at a current density of 200 mA g−1 and an excellent cyclic performance of 740 mA h g−1 after 60
cycles
[187]
A capacity of 732 mA h g−1 can be obtained after 100 cycles at 150 mA g−1 [188]
An initial reversible lithium storage capacity of 722 mA h g−1 in LIBs and a specific capacitance of 478 F g−1 in 2 M KOH [189]
High reversible capacity of 1100 mA h g−1 in the first 10 cycles, over 1000 mA h g−1 after 130 cycles, with excellent cycle
performance
[190]
A first reversible capacity of 915 mA h g−1 at C/5, and 84% capacity retention after 30 cycles [191]
G/Fe2O3
The first discharge and charge capacities are 1693 and 1227 mA h g−1 at 100 mA g−1 and retain a reversible capacity of 1027 mA
h g−1 after 50 cycles
[192]
The initial discharge capacity is 1338 mA h g−1 and 58% of the reversible capacity can be maintained over 100 cycles at 200 mA
g−1
[193]
A high discharge capacity of 660 mA h g−1 during up to 100 cycles at the current density of 160 mA g−1 and capacities of 702,
512, 463 and 322 mA h g−1 at 400, 800, 1600 and 2400 mA g−1, respectively
[194]
G/Mn3O4 A high specific capacity up to 900 mA h g−1, good rate capability and cycling stability [195]

59
G/MnO A reversible capacity of 635 mA h g−1 at 0.2 C and the rate capacity retention 5 C/0.2 C>70% [196]
G/Fe3O4
A large reversible specific capacity of 1048 mA h g−1at the 90th cycle, enhanced cycling performances (about 650 mA h g−1 after
50 cycles) and high rate capabilities (350 mA h g−1 at 5 C)
[197]
A specific capacity of 1280 mA h g−1 at 0.1 C cycling and 860 mA h g−1 at 4 C rate with exceptional stability [198]
A reversible capacity of 474 mA h g−1 at a current density of 1600 mA g−1; a capacity of 637 mA h g−1 at 200 mA g−1 was retained
after 60 cycles
[199]
The capacity keeps at 796 mA h g−1 after 200 cycles without any fading, and the reversible capacity attains ∼550 mA h g−1 and
97% of initial capacity is maintained after 300 cycles at 1 A g−1
[200]
A high reversible capacity is about two and a half times higher than that of graphite-based anodes at a 0.05 C rate, and an
enhanced reversible capacity of about 200 mA h g−1 even at a high rate of 10 C (9260 mA g−1)
[201]
The reversible capacity is 538.7 mA h g−1 after 50 cycles [202]
A specific discharge capacity of 952.0 mA h g−1 in the initial cycle and 842.7 mA h g−1 after 100 cycles [203]
A high reversible specific capacity approaching 1026 mA h g−1 after 30 cycles at 35 mA g−1 and 580 mA h g−1 after 100 cycles at
700 mA g−1 as well as improved cyclic stability and excellent rate capability
[204]

60
A stable capacity of 650 mA h g−1 with no noticeable fading for 100 cycles [205]
A stable high specific reversible capacity of around 900 mA h g−1 which was nearly unvarying over 50 cycles [206]
G/NiO
A capacity of 450 mA h g−1 after 100 cycles at 1 C (1 C=300 mA g−1) and a discharge capacity of 185 mA h g−1 at 20 C [207]
A large initial charge capacity of 1056 mA h g−1 at 0.1 C and retained 1031 mA h g−1 after 40 cycles; the charge capacities of 872,
657, and 492 mA h g−1 were obtained at 718, 1436 and 3590 mA g−1, respectively
[208]
G/TiO2
87 mA h g−1 at a rate of 30 C (2 min of charging or discharging) [209]
Negligible fade after 700 cycles at 1 C rate with columbic efficiency reaching 100% over the entire cycling test except for the
initial few cycles
[210]
A reversible capacity of 161 mA h g−1 can be retained at 1 C after 120 charge–discharge cycles and delivered a capacity of 125
mA h g−1 and 107 mA h g−1 at 5 C and 20 C, respectively
[211]
A reversible capacity of 90 mA h g−1 can be delivered at a current rate of 10 C with good cyclic retention up to 180 cycles [212]
A first discharge capacity of 269 mA h g−1 is achieved at 0.2 C and a capacity of 202 mA h g−1 in the charging process, the
reversible capacities are retained at 162 and 123 mA h g−1 at 1 C and 10 C
[213]
Specific capacity at the rate of 50 C is as high as 97 mA h g−1 [214]

61
G/CuO
Reversible capacity of 600 mA h g−1 at 65 mA g−1 after100 discharge–charge cycles [215]
A reversible capacity of 583.5 mA h g−1 with 75.5% retention of the reversible capacity after 50 cycles [216]
The reversible capacity attains 640 mA h g−1 at 50 mA g−1 and the capacity retention is ca. 96%. At 1 A g−1, the reversible
capacity reaches 485 mA h g−1 and remains at 281 mA h g−1 after 500 cycles
[217]
G/Cu2O 1100 mA h g−1 in the first cycle [218]
G/CeO2 A specific capacity of 605 mA h g−1 at the 100th cycle at 50 mA g−1 and the capacities of 414, 320, 222 and 146 mA h g−1 could
be obtained at 100, 200, 400 and 800 mA g−1, respectively
[219]
G/MoO2 The initial discharge and charge capacities are 468.2 and 342.0 mA h g−1 and the capacity reaches 407.7 mA h g−1 after 70 cycles
at 2000 mA g−1
[220]
G/V2O5 An initial specific discharge capacity of 412 mA h g−1 at 50 mA g−1 and a capacity of 316 mA h g−1 at the current density of 1600
mA g−1
[221]
G/SnO2; G/NiO;
G/MnO2
Specific capacity of 625, 550, 225 mA h g−1 are obtained at 0.01, 0.02 and 0.08 A g−1 for SnO2–graphene; the capacity of the
NiO–graphene composite is stable upon lithiation/delithiation over 100 cycles
[141]
G/TiO2 at The specific capacity was 175, 166, 150 and 130 mA h g−1 at a rate of C/3, 1 C, 3 C and 12 C, respectively [214]

62
TiOxNy/TiN
G/MnO2
A reversible specific capacity of 495 mA h g−1 at 100 mA g−1 after 40 cycles and reached a capacity of 208 mA h g−1 at1600 mA
g−1
[194]
A discharge capacity of 1105 mA h g−1 was observed on the second cycle, remaining 948 mA h g−1 after 15 cycles; a reversible
capacity of 930, 836, and 698 mA h g−1 at 100, 200, and 400 mA g−1, respectively
[206]
G/Li4Ti5O12
Specific capacities were 164 mA h g−1 at 0.2 C and 137 mA h g−1 at 8 C [191]
A specific capacity of 122 mA h g−1 even at a very high charge/discharge rate of 30 C [213]
G/LiFePO4 A discharge capacity of 160.3 mA h g−1 at 0.1 C and 81.5 mA h g−1 at 10 C [222]
G/Li3V2(PO4)3 The specific capacities are 118 mA h g−1 and 109 mA h g−1 at 5 C and 20 C discharge rates, and 82 mA h g−1 at a higher current
rate of 50 C, reaching 64% of the initial charge capacity at 0.1 C
[208]
G: Graphene; MO: MOs; NPs: NPs.
63
The Li-storage mechanism of MOs is based on the lithium conversion reaction or
lithium ion intercalation reaction. Therefore, the cycling performance of MOs can be
improved by restraining its volume change and enhancing the electrical conductivity
in the electrochemical process. Due to its intrinsically excellent electrical conductivity
and mechanical flexibility, rGO is considered for anchoring MO NPs on its carbon
network to improve the cyclability of the composites. For example, Kim et al.
decorated echinoid-like SnO2 NPs uniformly on rGO sheets through electrostatic
attraction between the carbon networks and NPs by controlling the surface charge[52].
The resultant SnO2/rGO composites have a reversible capacity of 634 mAh g−1 with a
coulombic efficiency of 98% after 50 cycles, which is much higher than that of
commercial SnO2. In order to achieve high-performance LIBs, a chemical in-situ
deposition strategy used to directly synthesize NP/rGO composites as the anode
material for LIBs was reported by Wu et al. [184]. The Co3O4 NPs with particle size
10−30 nm are homogeneously distributed on rGO sheets, which separate the
individual rGO layers by increasing the interlayer distance. The first discharge and
charge capacities of Co3O4/rGO composite electrodes has been detected at 1097 and
∼753 mAh g−1, which are lower than that of both Co3O4 (1105 mAh g−1 and 817 mAh
g−1) and graphene (2179 and 955 mAh g−1). However, the reversible capacity of the
composite electrodes is 900 mAh g−1 after 20 cycles, which is much higher than that of
Co3O4 (650 mAh g−1) and graphene (245 mAh g−1). For the fabrication of
high-performance LIBs, Co3O4/rGO has been recognized as a potential candidate due

64
to its great electrical conductivity and mechanical stability caused by interlayer
separation of rGO sheets in the composite structure[186].
Moreover, electrical conductivity of rGO is essential for improving the capacity of the
electrode materials, especially those high rate anode materials such as Li4Ti5O12 [223],
TiO2 [209], as well as cathode materials such as LiFePO4 [224]. GO sheets are usually
used as an additive by spray-drying and thermal annealing to enhance the electrical
conductivity of nano-structured LiFePO4/rGO composites. The resultant composites
can deliver a higher specific capacity of 148 mAh g−1 at the rate of 0.1C and 70 mAh
g−1 at 60C while the pure LiFePO4 electrode has a lower capacity of 113 mAh g−1 at
0.1C[224]. In addition, the capacity of the composites is maintained at about 70% of
the initial capacity after 1000 cycles.
The in-situ reduction process was also reported to produce a Co3O4/rGO hybrid
material, rGO sheets uniformly covered by Co3O4 particles with the size at 5 nm [53].
Its unique nanostructure leads to superior electrochemical performance in lithium ion
capacity as high as 800 mAh g−1 at a current rate of 200 mA g−1 and over 550 mA h
g−1 at a high current rate of 1000 mA g−1.
In summary, electrochemical performance of MO/rGO composites as the electrodes in
LIBs is beneficial due to the elastic, flexible framework of 3D rGO-based structures.
The cycling performance of MOs is also improved by binding small-sized particles
with rGO, which significantly inhibits the volume change and shortens the transport

65
distance of lithium ions and electrons. Table 2-4 lists the advantages and
disadvantages of rGO and MO as well as MO/rGO for LIBs [142].

66
Table 2-4 The pros and cons of rGO, MOs, and MO/rGO composites for LIBs [142].
Advantage of rGO Disadvantage of rGO Advantage of
MO
Disadvantage of MO Advantage of MO/rGO composites
Superior electrical conductivity Serious agglomeration Very large
capacity/capacitance
Poor electrical conductivity Synergistic effects
Abundant surface functional groups Re-stacking High packing density Large volume change Suppressing the volume change of MO
Thermal and Chemical stability Large Irreversible capacity High energy Density Severe
aggregation/agglomeration
Suppressing agglomeration of MO and
re-stacking of graphene
Large surface area Low initial coulombic efficiency Rich resources Large irreversible capacity Uniform dispersion of MO
High surface-to-volume ratio Fast capacity fading Low initial coulombic efficiency Highly conducting and flexible network
Ultrathin thickness No clear lithium storage mechanism Poor rate capability High capacity/capacitance, good rate capability
Structural flexibility No obvious voltage plateau Poor cycling stability Improved cycling stability
Broad electrochemical window Large voltage hysteresis Improved energy/power densities
MO: Metal oxides.

67
2.8 Summary
This literature review provides an overview of the properties, synthesis and
functionalization of GO and rGO. GO and rGO is shown to be a unique
two-dimensional structure with attached oxygen functional groups which can be
removed to improve the properties in electrical conductivity, electrochemical
performance, chemical activity and wettability. The review on these properties enables
us to further understand the structural changes between GO and rGO sheets. In
addition, the description on the synthesis methods is useful in understanding the
formation and removal process of functional groups on the GO plane. Furthermore, the
recent progress in the functionalization of rGO sheets to fabricate MO NP/rGO
composites for energy storage applications is also reviewed. The advantages of
chemical oxidation, thermal reduction and MO NPs functionalization of GO have been
presented. However, there is a large distance to go before the fabrication of rGO sheets
can meet the requirements of industrial applications. Therefore, this study will focus on
the synthesis of functionalized rGO sheets and its application.

68
Chapter 3 Methodology
3.1 Introduction
The experimental details and characterization techniques used for the synthesis and
analysis of rGO are described in this chapter. The synthesis methods for GO
dispersion, single-layer GO sheets and GO paper are discussed, respectively. The
process of thermal annealing and oxygen annealing to produce TrGO and OrGO are
presented as are the fabrication details of TrGO and OrGO based LIBs. In order to
analyze the properties of rGO, the characterization methods such as AFM, contact
angle, Photoluminescence (PL), FTIR, Hall measurements, HRTEM, Raman
spectroscopy, SEM, TEM, UV-Vis, X-ray Photoelectron Spectroscopy (XPS), XRD
and Electrochemical measurements, along with their background knowledge and
associated specimen preparations are all included.
3.2 Preparation of GO dispersion
3.2.1 Pretreatment of graphite powder
In order to oxidize the raw materials completely, the pretreatment step was performed
according to the method published by Kaner et.al [88]. K2S2O8 (10 g) and P2O5 (10 g)
were added to a hot concentrated H2SO4 (90°C, 50 ml) solution. The mixture was then
allowed to cool to 80°C followed by adding graphite powder (325 mesh, 12 g) to the
solution and stirring at 80°C for 4.5 hours to dissolve all the components.
Subsequently, the mixture was diluted into DI water (2L). The next day the mixture
was filtered through a cellulose ester membrane filter and washed using DI water to

69
remove all traces of acid. The resultant solid was dried overnight under ambient
conditions.
3.2.2 Modified Hummer’s Method for oxidation of graphite
Figure 3.1 Schematic diagram to produce GO sheets by Hummer’s Method [225]
The modified Hummer’s method was used to synthesize graphite oxide from
pretreated graphite powder. As illustrated in Figure 3.1, H2SO4 (23 ml) was poured
into a 250 ml round bottom flask and then chilled to 0 °C in an ice bath. Afterwards,
the pretreated graphite powder (1.0 g) and NaNO3 (0.5 g) were added sequentially to
the flask followed by mixing KMnO4 (5.0 g) in droplets to keep the temperature below
10 °C. After stirring at 35 °C for 2 hours, DI water (46 ml) was cautiously added to
the mixture in small portions to keep the temperature below 50 °C. Another 140 ml of
DI water and 10 ml of 30% H2O2 were added to the flask to end the oxidation process
after 2 hours stirring. The mixture was settled for at least 24 hours to obtain a clear
supernatant. The deposited solid mixtures were collected and repeatedly purified with
500 ml of 10% HCl solution and 500 ml of DI water to remove the acid. The resulting
solid was dried at room temperature in a vacuum chamber.

70
3.2.3 Formation of GO dispersion
GO dispersion (2 mg ml-1) was prepared by dissolving air-dried GO sheets in DI water
using an ultrasonic bath cleaner (output power 20 W) for 1 hour, followed by
centrifugation (10000 rpm, 10 min) to remove impurities precipitated on the centrifuge
tube wall. In order to exfoliate GO sheets completely in the dispersion, a probe
ultrasonicator (output power 100 W) was immersed in the resultant transparent
light-yellow dispersion for 30 minutes. The resultant dispersion was then left aside for
at least one week to obtain a final GO dispersion with a concentration of 2 mg ml-1.
3.3 Preparation of free-standing GO paper
3.3.1 Filtration of GO dispersion
Figure 3.2 Schematic diagram for the fabrication of GO paper by vacuum filtration of GO dispersion
through a membrane filter.
Paper-like GO bulk material was prepared simply by a vacuum filtration process. GO
dispersion (150 ml) was added to a Buchner funnel which was connected to a vacuum
source and then filtered through a membrane filter. During the vacuum filtration, GO

71
sheets were laid down on the membrane filter plane while the liquid was passing
through the pores under a directional flow caused by vacuum suction. GO sheets were
interlocked/tiled on top of each other in a nearly parallel manner, as shown in Figure
3.2.
3.3.2 Types of membrane filter
According to the introduction in section 1.5.3, membrane filters are essential to the
fabrication of OrGO (Al2O3/rGO) paper. In order to confirm the source of Al2O3
nanoparticles is the Anodisc membrane filter, two types of membrane filter were used
in the preparation of GO paper by vacuum filtration:
i. Mixed cellulose ester membranes (SEM image, Figure 3.3)
Figure 3.3 SEM image of mixed cellulose ester membrane filters. The pore size is 0.2µm[226].
ii. Anodisc aluminum oxide membranes (SEM image, Figure 3.4)

72
Figure 3.4 SEM image of Anodisc aluminum oxide membrane. The pore size is 0.02µm[227].
Table 3-1shows the specifications of these two membrane filters.
Table 3-1 Specifications of membrane filters.
Membrane
type
Material Pore
size
(µm)
Diameter
(mm)
Rectangular Brand
name
Cellulose
based
Mixed
Cellulose
Ester
0.2 47 300×600
mm
Anopore Aluminum
Oxide
0.02 47 300×600
mm
Anodisc
3.3.3 GO paper peeling off from the membrane filter
3.3.3.1 Mixed cellulose ester membranes
After air-drying overnight at room temperature, GO paper deposited onto mixed
cellulose ester membrane was peeled off by immersing the mixture in acetone baths to
dissolve the cellulose ester membrane and transferring to DI water baths to wash
peeled GO paper, leaving the transparent GO paper floating on DI water. The resultant

73
GO paper was then transferred onto substrates for air-drying at room temperature to
obtain GO film.
3.3.3.2 Aluminum oxide membranes
Unlike the process using mixed cellulose ester membranes, GO paper fabricated by
filtering GO dispersion through the aluminum oxide membrane can be peeled off
actively during air-drying at room temperature to form transparent free-standing GO
paper without using any solvent.
3.3.4 Samples preparation for characterizations
Free-standing GO paper can be directly characterized by measurements such as FTIR,
Raman spectroscopy, XPS, and Electrochemical testing. For the characterizations
including contact angle, PL, Hall measurements, UV-Vis and XRD, GO paper should
be stuck on pretreated quartz plates (pretreatment step described in 3.4.3).
3.4 Preparation of single-layer GO sheets on the substrates
3.4.1 Preparation of diluted GO dispersion
Initially the as-formed GO dispersion prepared in 3.2.3 was diluted in DI water to a
concentration of 10 ppm. Afterwards, the probe ultrasonicator was used for further
separation of GO sheets, followed by ultrasonication using an ultrasonic bath cleaner
for 3 hours. Finally, high speed centrifugation (15,000 rpm, 10 minutes per cycle) was
performed for exfoliation of GO sheets and deposition of multi-layer GO.

74
3.4.2 Fabrication of Al2O3/GO monolayer structure
In order to characterize the properties of OrGO, individual piece of Al2O3/GO sheet
containing a monolayer GO structure was fabricated using the same vacuum filtration
system described in section 3.3.1. Before the filtration system was connected to the
vacuum pump, the substrate (1×1 cm for cuttable materials) was placed onto a
membrane filter, placed in the bottom of a Buchner funnel, and immersed in the
diluted GO dispersion (10 ml) added to the funnel for several minutes. Afterwards, a
few of the monolayer GO sheets were deposited onto the substrates during vacuum
filtration process (Figure 3.5). The deposited GO sheets can be considered as
individual sheets of GO paper for characterization.
Figure 3.5 The schematic diagram of monolayer of GO sheets deposited on the substrate via a filtration
process. The substrate (1×1 cm for cuttable materials) was placed onto a membrane filter and immersed
in the diluted GO dispersion (10 ml) added to the funnel for several minutes.

75
3.4.3 Substrates
The substrates selection was carried out according to the requirements of the
characterizations. The substrates used for the deposition process are given below:
i. Holey carbon TEM grids (300 mesh, TEM image Figure 3.6)
Figure 3.6 TEM image of holey carbon films[228]. The diameter of the holes is around 5 μm in average.
ii. SiO2 layer (300 nm) coated silicon wafers (optical image, Figure 3.7)

76
Figure 3.7 Optical image of SiO2/Si wafer[229]
The SiO2/Si wafers were cleaned with a piranha solution, a mixture of H2SO4 and
H2O2 used to remove organic residues on the substrates (H2SO4: 30 wt. % H2O2 = 3:1,
v/v). The holey carbon TEM grids were used for the testing of TEM and HRTEM. The
SiO2/Si wafers were used for the characterizations of AFM and SEM.
3.5 Fabrication of TrGO by thermal annealing
Thermal annealing is a conventional method for the reduction of GO to enhance its
electrical conductivity. This annealing was carried out in a single zone horizontal tube
furnace using a mechanical vacuum pump and a two-channel gas flow system. GO
paper or GO sheets deposited on the substrates were placed in an alumina sample
holder and loaded in the middle of the furnace. Once the tube had been sealed with
stainless steel flanges, a vacuum pump was used to keep the annealing chamber under

77
vacuum conditions at 15 torr. In order to protect the sample against the air and
impurities, Argon gas was utilized as a carrier gas to remove chemical waste out of the
chamber during the annealing process. Before thermal annealing was initiated, the GO
sample was dried overnight at room temperature under Argon gas flow. The furnace
was then heated to 400 oC with a ramping rate of 2 oC /min for thermal reduction.
When the furnace reached the desired temperature, annealing was performed for 30
min before cooling down to room temperature at the rate of 20 oC /min. The annealed
samples were taken out when the temperature of the tube was below 50 oC, which
avoided any sample damage when exposing to the air at high temperature. The thermal
annealing conditions for GO sample reduction are shown in Table 3-2.
Table 3-2: The thermal annealing conditions for GO paper reduction.
Process parameter Process condition
Dwelling temperature (oC) 400
Ramp rate (oC/min) 2
Duration (min) 30
Ending temperature (oC) Below 50
Pressure (Torr) 15
Size of sample (cm×cm) 1×1
Ar flow rate (sccm) 95
3.6 Fabrication of OrGO by oxygen annealing
Oxygen annealing was carried out in the same tube furnace as thermal annealing, as
shown in Figure 3.8. GO samples were placed in an alumina sample holder and loaded
in the middle of the furnace, which was sealed with stainless steel flanges. A vacuum
pump was used to keep the annealing chamber under vacuum conditions at 15 torr. In
order to dry and clean the surface of samples, Argon was utilized as a carrier gas

78
before the annealing process. Before operation of the heat treatment, the GO sample
was dried at room temperature under Argon gas flow overnight. The furnace was then
heated to 400 oC with a ramping rate of 2 oC /min. When the furnace reached the
desired temperature, oxygen gas was introduced into the chamber at a flow rate of 10
sccm to synthesize Al2O3 NPs on the rGO plane. After 30 min heat treatment, the
cooling rate was 20 oC /min. GO samples for oxygen annealing included GO paper
and single-layer GO sheets deposited onto the substrates. The operating conditions
were described in section 3.5.
Figure 3.8 The schematic diagram of the fabrication process of TrGO and OrGO papers and individual
layer.
3.7 Characterization methods
3.7.1 Atomic Force Microscopy
AFM was used to quantitatively characterize the morphology and roughness of single-
or few-layer GO surfaces. Figure 3.9 shows the basic principles of AFM [95]. The tip

79
is precisely situated on a flexible silicone cantilever which is mounted to a
piezoelectric driver for scanning. When the voltage is applied, the tip is brought to a
chosen point over the sample surface where the force can repel or attract atoms from
the tip leading to a deflection of the cantilever. The degree of cantilever deflection,
which is caused by the surface topography, is usually measured using a laser light
from a solid state diode reflected from the surface of the cantilever into a position
sensitive detector (PSD). In this way, it is possible to map out the roughness of the
material surface point by point without any direct contact. AFM promises scanning in
the x/y or x/y/z directions to reconstruct the surface image from different viewpoints.
Moreover, there is no extra surface treatment, such as metal or carbon coating,
required for AFM measurement[230].
Figure 3.9 The basic principles of atomic force microscopy (AFM) [95]

80
The surface morphology of GO was characterized using an AFM (Veeco
CPII-Research Scanning Probe Microscope) in contact mode at a 512 x 512 scanning
resolution. Scan areas ranged from 600 nm x 600 nm to 10 µm x 10 µm. In the contact
mode, the tip makes a soft physical contact with the sample surface and scans at a
constant small height above the surface where the overall force is repulsive. The force
between the tip and the GO sheets is fixed during scanning by maintaining a constant
deflection.
3.7.2 Scanning Electron Microscopy
SEM is a microscope that uses electrons instead of light to form an image. In
comparison to traditional microscopes, SEM has many advantages such as large depth
of field, higher resolution and more control in the degree of magnification[231], which
allows it to be used in fracture characterization, microstructure studies, thin film
evaluation, surface contamination examination and failure analysis of materials.
Generally, a high-energy electron beam is produced from the electron gun in an
evacuated column above the sample surface. When the electron beam focuses onto the
target surface, the low-angle backscattered electrons interact with the surface atoms and
generate a variety of electronic signals. Figure 3.10 shows a schematic diagram of
SEM. The types of signals generated secondary electrons (SE), back-scattered
electrons (BSE), characteristic X-rays, light cathodoluminescence (CL), specimen
current and transmitted electrons as are shown in Figure 3.10[100].

81
Figure 3.10 Schematic diagram of SEM[100].
For conventional imaging in the SEM, the specimens’ surface must be electrically
conductive. However, environmental SEM (ESEM) can be used to image uncoated
nonconducting specimens by placing the sample in a high-pressure chamber where the
working distance between the electron gun and the specimens is short[232].
The SEM samples were fabricated by attaching GO samples to an aluminum stub
using a sticky carbon tab. In this study, a secondary electron detector was used. The
prepared samples were placed in the vacuum chamber of the microscope. The SEM was

82
operated with a working energy of 7 k eV, a beam size at a value of 3 and a working
distance of 10 mm. Images at a variety of magnifications were collected.
3.7.3 Transmission electron microscopy
TEM is a microscopy technique utilizing a beam of electrons transmitted through an
ultra-thin specimen where the electrons are converted to light and form an image. The
image is magnified and focused onto an imaging device, such as a fluorescent screen,
on a layer of photographic film, or to be detected by a sensor such as a charge-coupled
device (CCD) camera.
In this study, two types of TEM were used to characterize GO samples. A lower
magnification inspection on GO samples was carried out by a JEOL FX II microscope
while an advanced JEOL 2100F model was used to obtain higher resolution TEM
(HRTEM) images by the addition of a field emission gun (FEG). This equipment can
provide a high brightness and high stability electron source.
The basic components of TEM equipment are illustrated in Figure 3.11[233]. TEM
images are produced by inserting photographic film into the back focal plane of the
objective lens, which allows selected electrons to diffract in a specific direction.
During transmission, the speed of electrons directly correlates to electron wavelength:
the faster electrons move, the shorter wavelength and the greater the quality and detail
of the image. Bright areas of the image represent places where more electrons have
passed through the specimen while dark areas represent the dense areas of the object.
In addition, NPs structure can be investigated by HRTEM at an atomic scale[234].

83
Because of its high resolution, it is a valuable tool for the study of the positions of
atoms in TEM images due to differences in the phase of electron waves scattered by a
thin sample. The GO samples were prepared according to 3.4.2 and then placed onto a
sample holder and inserted into a vacuum chamber in the TEM system. The samples
were inspected at various magnifications.
Figure 3.11 The schematic diagram of TEM[233]

84
3.7.4 Raman spectroscopy
Raman spectroscopy is used to investigate the elementary excitation in GO samples.
In this technique, a monochromatic laser is shone onto the sample surface as shown in
Figure 3.12[97]. The monochromatic laser with frequency v0 excites the molecules
within the specimen from the ground state to a virtual energy state. When the excited
molecules reverts back, they emit light and return to a different rotational or
vibrational state. The change in energy between the original state and resulting state
leads to three different frequencies when:
1. A molecule is excited by absorbing a photon with frequency v0 and then returned
back to the same basic vibrational state. This elastic scattering of the photon is
called Rayleigh scattering.
2. If the vibrational energy of the molecule is increased after absorbing a photon
with frequency v0, the energy of the scattered photons is decreased as part of the
photon’s energy is transferred to the Raman-active mode with a down-shifted
frequency (longer wavelength). This inelastic scattering is called Stokes
scattering.
3. If the vibrational energy of the molecule is decreased after absorbing a photon
with frequency v0, the energy of the scattered photons is increased as excessive
energy of the excited Raman-active mode is released with an up-shifted
frequency (shorter wavelength). This inelastic scattering is called anti-Stokes

85
scattering. This only happens when the molecule is an excited vibrational state
before absorbing a photon.
Figure 3.12 Mechanism of Raman scattering[97].
3.7.5 X-Ray Photoelectron Spectroscopy
XPS is a widely used spectroscopic technique for surface elemental composition
analysis, empirical formulas, chemical states and the electronic state of the elements
which exist within a material[99, 235]. The specimens are illuminated with a
monochromatic X-ray source, resulting in the emission of core shell photoelectrons.
The electrons can be removed from their orbits at characteristic binding energy values
which is unique to the element and particular atomic orbits. As a result, a plot of the
number of electrons detected versus the binding energy of the electrons detected is
used to identify the elements present and their quality. The characteristic XPS peaks,
corresponding to the electron configuration of the electrons within the atoms, e.g., 1s,
2s, 2p, 3s, etc., is used to directly identify the amount of element within the area
irradiated. The XPS must be performed under Ultra-High Vacuum (UHV) conditions
[236-238]. Figure 3.13 shows the schematic diagram of XPS systems[100].

86
Figure 3.13 The schematic diagram of a monochromatic XPS system[100].
In this study, XPS measurements were performed with a VG Scientific ESCALab Mark
II X-ray photoelectron spectrometer using a monochromatic Al Kα x-ray source (hν =
1486.6 eV). Survey spectra were collected covering the full binding energy range
0-1200 eV using a step size of 1 eV and pass energy of 50 eV, whereas the high
resolution spectra of C1s, Al 2p and Al KLL were collected using a step size of 0.2 eV
and pass energies of 20 eV. To compensate for surface charging, all binding energies
were corrected with reference to the C1s peak at 284.5 eV. Peak fitting and
deconvolution of the high resolution spectra were achieved using CasaXPS software
and were fitted according to mixed Gaussian–Lorentzian components and a non-linear
Shirley background.

87
3.7.6 Fourier transform infrared spectroscopy
FTIR is a technique used to detect the vibration characteristics of chemical functional
groups in the materials by obtaining an infrared spectrum of absorption, emission,
photoconductivity or Raman scattering of samples. An FTIR spectrometer
simultaneously collects spectral data in a wide spectral range which can be categorized
as far infrared (4 ~ 400 cm-1), mid infrared (400 ~ 4,000 cm-1) and near infrared (4,000
~ 14,000 cm-1). When an infrared light interacts with the sample, chemical bonds will
stretch, contract and bend. As a result, a molecular fingerprint of the sample can be
produced as the chemical functional group tends to absorb infrared radiation in a
specific wavenumber range regardless of the structure of the rest of the molecule,
which makes infrared spectroscopy useful for several types of analysis.
FTIR spectrometry was developed in order to overcome the limitations encountered
with early-stage IR instruments, which use a prism or a grating monochromator and
which results in a slow scanning process. FTIR spectrometer employs a very simple
optical device called an interferometer to collect an interferogram of a sample signal,
which has all of the infrared frequencies “encoded” into it. In order to make an
identification, the measured interferogram signal should be interpreted by decoding
the individual frequencies. This can be accomplished via a well-known mathematical
technique called Fourier transformation[239]. Figure 3.14 shows the principle of
FTIR[240].

88
Figure 3.14 Schematic diagram of FTIR[240]
In this study, FTIR spectra of GO samples were measured with a Perkin-Elmer
Spectrum One spectrometer. The scanning wavelength ranged from 540cm-1 to
4000cm-1 using a single reflection horizontal attenuated total reflection accessory
which enables samples to be examined directly in the solid or liquid state without
further preparation[241].
3.7.7 Sheet resistivity measurement
Sheet resistance is a measure used to determine the resistance of thin films which are
nominally uniform in thickness. A four-terminal sensing measurement (also known as
a four-point probe measurement) is widely used to measure sheet resistance, which
can avoid contact resistance, according to the Van der Pauw method. This method is
only used when the conditions below are satisfied:

89
1. The sample must be flat with a uniform thickness
2. The sample must not have any isolated holes
3. The sample must be homogeneous and isotropic
4. All four contacts must be located at the corners of the sample
5. The area of any individual contact must be at least an order of magnitude smaller
than that of the entire sample.
A schematic of a rectangular Van der Pauw configuration is shown in Figure 3.15[242,
243].
Figure 3.15 Rectangular Van der Pauw configuration[242, 243]
In order to obtain the two characteristic resistances, a direct current (I) is applied to
contact corner 1 and 2 while the voltage (V43) from contact corner 4 and 3 is measured.

90
Next, a current is applied to contact corner 2 and 3 while measuring the voltage (V14)
from contact corner 1 to 4. RA and RB are calculated by means of the following
expressions (5) and (6):
43
12
A
VR
I (5)
14
23
B
VR
I (6)
RA and RB are related to the sheet resistance RS through the Van der Pauw equation
(7):
1A B
S S
R R
R Re e
(7)
which can be solved numerically for RS. The bulk electrical resistivity ρ can be
calculated using (8):
SR d (8)
3.7.8 Contact angle measurement
This is the angle measured through a liquid at which the liquid/vapour interfaces with a
solid surface. The contact angle is the result of the surface free energies between the
liquid, solid and surrounding vapour. Most of the liquid wets the solid surface and
shows a contact angle in a static system which can be represented by a small liquid
droplet resting on a flat horizontal solid surface. The contact angles are measured by
fitting a mathematical expression to the shape of the dropped liquid and then calculating
the slope of the tangent to the drop at the liquid-solid-vapour interface line [244, 245].

91
The contact angle is commonly used in membrane material science to describe the
relative hydrophobicity/hydrophilicity of a membrane surface.
Figure 3.16 The schematic diagram of contact angle measurement[246].
The contact angle of GO was measured with a dynamic contact angle system, as shown
in Figure 3.16[246]. This equipment can be used to measure the surface tension,
adhesion characteristics, and surface energy as well. This equipment uses drop shape
analysis to measure contact angles and thereby determine surface energy. The image of
the drop shape was captured by an equipped camera. The shape and size of the droplets
were analyzed using FTA 32V 2.0 software. The contact angle was measured 5 times
for individual samples and then the average value was calculated. Wettability is
divided into three classes: absolute wetting for θ = 0°, partial wetting for θ < 90°, and
non-wetting for θ > 90° [247]. The water droplet was observed spontaneously spreading
along the dry surface until an equilibrium angle was established.

92
3.7.9 Lithium-ion battery test cells assembly and performance evaluation
To evaluate the electrochemical performance of GO samples, split-able test cells
(EQ-STC, MTI Corporation) were fabricated. The cells were assembled in an
argon-filled dry box by pressing GO paper onto a stainless steel substrate as the
working electrode without any binder or conductive additives. Celgard 2400
polypropylene membrane was used as a separator and lithium foil (Alfa Aesar) as the
counter electrode. The electrolyte was a 1M lithium hexafluorophosphate (LiPF6)
solution in a mixture of ethylene carbonate, dimethyl carbonate and ethylene methyl
carbonate (1:1:1 by weight).
3.7.10 Electrochemical measurement
In this study, cycle performance tests were used in a constant current / constant
voltage (CC/CV) charging mode, which is an effective way to charge lithium batteries.
When a LIB is nearly empty, the charging process is conducted under constant current.
During the process, the charging current should be lower than the maximum charging
current that the battery can accept. With constant charging, the voltage of the battery
slowly rises until the battery voltage reaches the maximum charging voltage, at which
point the charger, fixed at a "constant voltage" reduces the charging current until the
battery is fully charged. In CC/CV mode, for each cycle, the test cells were charged
with a constant current and then with constant voltage at 3.0V till the charge current
declined to 10mA. After that, the batteries were discharged at 10 mV at a constant
current. Cyclic voltammograms were characterized using an electrochemical cell with

93
a three-electrode configuration. Metallic lithium was used as a counter and reference
electrodes. The experiment was carried out using a Maccor series 4300 Battery and
Cell Test system.
3.7.11 Ultraviolet–visible spectroscopy
UV-Vis, an absorption or reflectance spectroscopy in the ultraviolet-visible spectral
region, is used to analysize the quantity of different analytes, such as transition metal
ions, highly conjugated organic compounds, and biological macromolecules. The
analysis of the absorption and/or transmission uses light in the visible and adjacent
(near-UV and near-infrared) ranges, the changes of the light intensity causing a variety
of polarization of the reflected or transmitted beams. A typical UV-Vis spectroscopic
analysis consists of measuring the wavelength dependence of the light transmitted
through the sample Figure 3.17[248, 249]. When the light passes through or is reflected
from the sample, the amount of light absorbed is the difference between the incident and
the transmitted radiation.

94
Figure 3.17 Schematic diagram of UV-Vis spectroscopy[248, 249].
A classical semiconductor exhibits minimal optical absorption or high absorption for
photons when energies are smaller or greater than the bandgap. As a result, there is a
sharp increase in absorption at energies close to the bandgap resulting in an absorption
edge /reflection threshold in the UV-Vis absorbance spectrum.
For direct bandgap semiconductors (9):
( )gh E
hh
(9)
where α is the absorption coefficient, hν is the energy of incident photons and Eg is the
electronic bandgap of the semiconductor. Eg is the intercept of the straight line
obtained by plotting (αhν) 2 vs. hν.
For indirect bandgap semiconductors (10):

95
2( )( )
gh Eh
h
(10)
Eg is the intercept of the straight line obtained by plotting the square root of (αhν) 1/2 vs.
hν.
The optical transmittance and absorbance of GO sample were measured by a UV-Vis
spectrometer (Biochrom Libra S22, Biochrom Ltd. Cambridge, England). This
equipment incorporates on-board application software which enables the production of
wavelength scans, substrate concentrations, and standard curves. The transmittance
and absorbance scanning wavelength ranged from 200 nm to 900 nm. The results were
directly transferred to Excel for calculating the band gap using the absorption
coefficient from the transmittance data.
3.7.12 Photoluminescence spectroscopy
PL describes the phenomenon of light emission from materials after the absorption of
photons (electromagnetic radiation). PL spectroscopy is a non-destructive analysis
technique requiring minimal sample preparation. A typical PL system includes the two
stages of photon absorption and re-radiation, as shown in Figure 3.18[250]. To carry
out PL measurement, the excitation laser and photomultiplier tube are turned on
followed by the installation of the sample onto a sample holder. The position of the
excitation beam should be adjusted to guarantee the alignment of the sample,
condenser and monochromator slit. The PL signal of the sample can be enhanced to
increase the signal-to-noise ratio by increasing the size of the monochromator slit. In
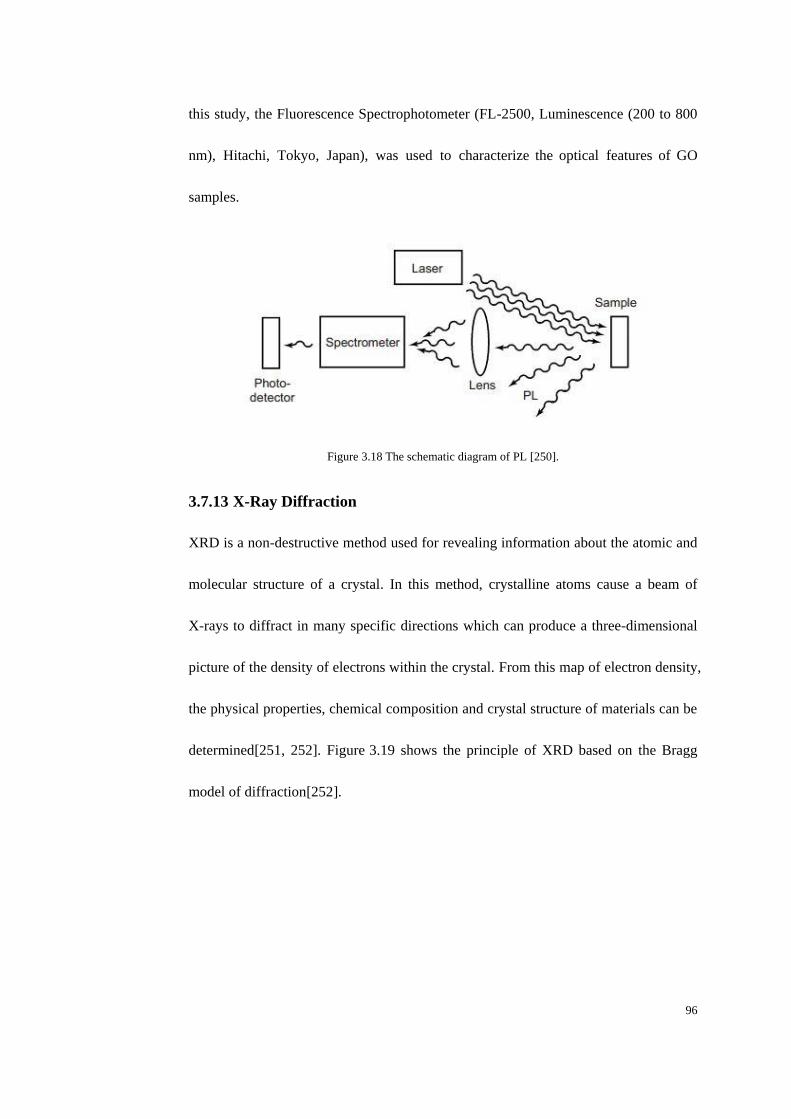
96
this study, the Fluorescence Spectrophotometer (FL-2500, Luminescence (200 to 800
nm), Hitachi, Tokyo, Japan), was used to characterize the optical features of GO
samples.
Figure 3.18 The schematic diagram of PL [250].
3.7.13 X-Ray Diffraction
XRD is a non-destructive method used for revealing information about the atomic and
molecular structure of a crystal. In this method, crystalline atoms cause a beam of
X-rays to diffract in many specific directions which can produce a three-dimensional
picture of the density of electrons within the crystal. From this map of electron density,
the physical properties, chemical composition and crystal structure of materials can be
determined[251, 252]. Figure 3.19 shows the principle of XRD based on the Bragg
model of diffraction[252].

97
Figure 3.19 Basic features of a typical XRD [252].
In this model, Bragg's Law refers to the simple equation (11).
2 sinn d (11)
where the variable d is the distance between atomic layers in a crystal, and the variable
λ is the wavelength of the incident X-ray beam while n is an integer, and θ is the
incident Bragg angle.
The XRD was operated at 40 K and 25 mA using Cu Kα radiation with a wavelength
of 1.5406 Å. Data was collected with step intervals of 0.05˚over 2θ in the range 10-90˚
for each GO sample with an acquisition time of 2s. Before XRD analysis, the samples
were placed onto the sample holder followed by loading onto the sample plate in the
XRD chamber. The crystal size of GO samples can be calculated by the Scherrer
equation (12) using the full width at half maximum (FWHM) of XRD peaks.

98
cos
K
(12)
where τ is the mean size of the ordered (crystalline) domains, which may be smaller or
equal to the grain size, K is a dimensionless shape factor, λ is the X-ray wavelength, β
is the FWHM in radians, and θ is the Bragg angle.

99
Chapter 4 Characterization of individual
monolayer OrGO sheets
4.1 Introduction
A modified Hummer’s method is the most commonly used procedure for the synthesis
of GO. The modification is a pre-treatment step using phosphorus pentoxide and
potassium peroxydisulfate in sulphuric acid to the pre-oxidize graphite. After the
preparation of the pre-oxidized graphite by the strong acids and oxidants, hydrophilic
GO sheets which can be well-dispersed in DI water are produced by Hummer’s
method. This uniform GO dispersion is then filtered through a membrane filter under
vacuum to deposit GO sheets on the substrates or form GO paper. Although a variety
of membrane filters have been used in vacuum filtration [14, 253, 254], Anodisc
membrane filter is the most widely used by many of research groups [10, 50,
255-257].
The Anodisc membrane filter is an extremely precise membrane composed of a high
purity alumina matrix that is manufactured electrochemically with high pore density
and narrow pore size distribution. As a result, we used this alumina membrane filter to
fabricate Al2O3/rGO composites by oxygen annealing without introducing any extra
Al2O3 precursor. In other words, GO sheets are capable of growing Al2O3 NPs on their
carbon basal plane by oxygen annealing after filtering through the Anodisc membrane
filter. In order to understand the structure of monolayer TrGO and OrGO, optical
microscopy, SEM, AFM, TEM and HRTEM were used for characterizations.

100
4.2 Results and discussion
4.2.1 Optical microscopy of OrGO layers
In order to image single layers, bi-layers or several layers of GO/rGO, various
measurements are made using procedures such as optical microscopy, AFM, SEM and
TEM. Normally, different layers of GO/rGO should be imaged by combining two or
more of the above techniques. The optical microscope is primarily used to characterize
GO/rGO samples as it is a low cost and non-destructive method in laboratories. Being
a transparent material with the thickness in the nano-scale, it is necessary to mount GO
on a SiO2 substrate before annealing and carrying out optical imaging. Based on the
research into substrate design to enhance the visibility of deposited thin films
[258-260], the mechanism behind the contrast between rGO and substrate is explained
in terms of the Michelson contrast (C) relation[261]:
material dielectric
material dielectric
R RC
R R
(5)
where Rmaterial is the reflected intensity from the material and Rdielectric is the intensity
without the material. If C=0, the material is “invisible” under the optical microscope;
if 0<C<1, the material is brighter than the substrate, and if -1<C<0, the material is
darker than the substrate.
SiO2 is the most widely used coating material on silicon to enhance the distinguishing
of graphene monolayers. Another governing factor that modulates contrast is the
wavelength of the incident light. Blake et al. demonstrated that graphene layers can be

101
visualized on top of a SiO2/Si wafer of with any thickness by using filters[262]. For
ready viewing by naked eye, thicknesses of the SiO2 coating of 90 and 280 nm are
most appropriate when using green filters as well as white light. Consequently, the
thickness of SiO2 coating was 300 nm in our study.
The optical image of GO on SiO2/Si substrate shows the diameter of sheets ranging
from a few hundred nanometers up to 20 μm, as shown in Figure 4.1. The drop-casting
process deposited GO sheets onto the substrate with a large coverage density
consisting of independent sheets.
Figure 4.1 Optical microscopy image of GO at low magnification.

102
Investing an individual piece of GO sheet under the optical microscope however, we
found residual water produced ring/wrinkle at the edge of the film although the
samples had been dried in a glove box for 24 hours (Figure 4.2).
Figure 4.2 Optical microscopy image of GO at high magnification.

103
These amorphous wrinkles could be further dried by annealing under vacuum to form
flat layers with small and narrow wrinkles, as shown in Figure 4.3.
Figure 4.3 Optical microscopy images of OrGO at low magnification. Most of areas were coated by
monolayer OrGO layers.

104
In order to detect the numbers of GO layers reduced by the physical exfoliation
process, one sample was exfoliated with a conventional technique while another
sample was treated with high speed centrifugation and probe ultrasonication at a very
diluted concentration of 10 ppm. Figure 4.4 shows that normal peeled TrGO sheets
were found to contain part of a single-layer GO and a multi-layer structure, indicating
the traditional exfoliation process is capable of fabricating monolayer GO although it
is difficult to reduce most multi-layer samples to single-layer structures.
Figure 4.4 Optical microscopy image of TrGO at high magnification. The monolayer (1L) and multilayer
(Multi-L) TrGO have different contrast to the substrate.

105
Although wrinkles were still found in the monolayer OrGO under optical
measurement (Figure 4.5), a new exfoliation process is a useful method to produce a
single-layer GO contained dispersion which provides the opportunity for
characterizing GO/rGO properties with a variety of measurements.
Figure 4.5 Optical microscopy image of OrGO at high magnification. The size of this monolayer OrGO sheet
is around 10 μm.
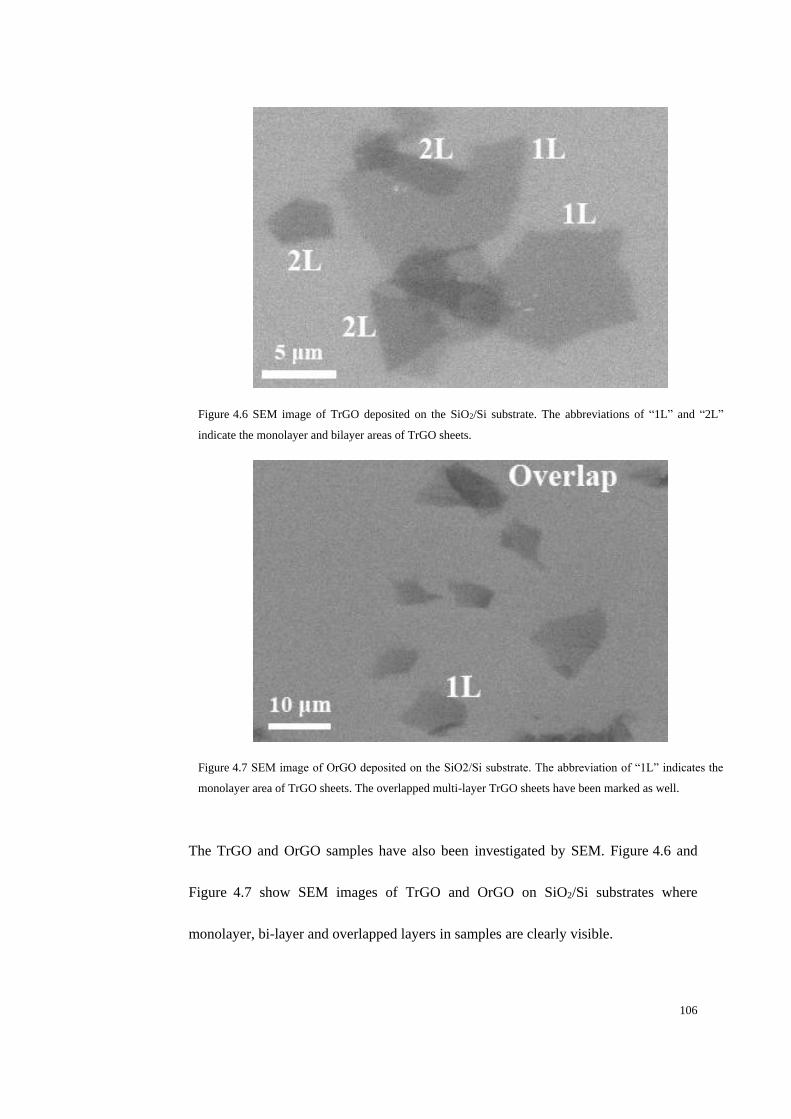
106
The TrGO and OrGO samples have also been investigated by SEM. Figure 4.6 and
Figure 4.7 show SEM images of TrGO and OrGO on SiO2/Si substrates where
monolayer, bi-layer and overlapped layers in samples are clearly visible.
Figure 4.6 SEM image of TrGO deposited on the SiO2/Si substrate. The abbreviations of “1L” and “2L”
indicate the monolayer and bilayer areas of TrGO sheets.
Figure 4.7 SEM image of OrGO deposited on the SiO2/Si substrate. The abbreviation of “1L” indicates the
monolayer area of TrGO sheets. The overlapped multi-layer TrGO sheets have been marked as well.

107
These SEM images show the two types of GO sheets are present: independent flat GO
sheet with “wrinkles” and overlapped forms which are similar to the images under the
optical microscope, as shown in Figure 4.8. The folding and overlapping areas of a
single layer are less transparent under SEM. According to the above report, the
wrinkles were produced by the thermal expansion coefficient difference between
substrate and graphene sheets during the annealing process[9].
Figure 4.8 SEM image of TrGO deposited on the SiO2/Si substrate. The wrinkles in monolayer sheet of
TrGO are marked.

108
Further SEM analysis indicates the detailed information on individual TrGO flake
about layer numbers and layer edge arrangement of the “dark” graphene flakes. Figure
4.9 presents some typical multi-layered graphene flakes attached to TrGO planes. The
number of layers can be confirmed by the distinct contrast obtained in SEM images.
However, a smaller distance between graphene edge structures limits the ability to
identify the flakes of more than 3 layers. All grey flakes of the isolated TrGO on the
SiO2/Si substrate surface show single layer characteristics of graphene[263], while the
darker areas indicate multi-layer GO features. These results suggest that most isolated
GO sheets were single layer, which can be further confirmed by TEM and AFM
height analysis.
Figure 4.9 SEM image of TrGO deposited on the SiO2/Si substrate. The multi-layer structure of dark area in
monolayer sheet of TrGO is detected.

109
4.2.2 TEM analysis of OrGO
One of the key innovations in this study was the fabrication of TEM samples by
vacuum filtering an ultra-diluted GO dispersion through an alumina membrane filter,
which allows suspended GO sheets to be deposited onto a holey TEM grid in a similar
way to producing GO paper. This “simulation” process provides the opportunity to
understand the structure and distribution of Al2O3 NPs on individual monolayers of
OrGO planes. Moreover, fabrication of TEM samples by vacuum filtration enables a
gentle transfer of GO sheets onto the TEM grid without using polymer support and
their further removal with liquid solvents or thermal annealing [264].

110
Figure 4.10 TEM characterization of TrGO. The inset shows the related SAED pattern. The number of
graphene layers in a sheet can be easily determined based on related SAED pattern of the TEM.
Figure 4.11 TEM characterization of GO. The inset shows the related SAED pattern.

111
Figure 4.10 shows an optical micrograph of a monolayer of TrGO sheet on the TEM
grid with the coverage visible as grayish patches. Diffraction analysis was carried out
to exhibit a hexagonal pattern, indicating a long-range orientational hexagonal order in
the single layer of TrGO. Recent studies of graphene electron diffraction pattern [265,
266] have reported that the intensity of the diffraction spots could be interpreted as
indicating the number of layers of a graphene sheet. The single-layer structure of
graphene has the equivalent relative intensities between the inner and outer hexagons
diffraction spots.
It is observed that the sheets are folded in some locations, and the number of graphene
layers in a sheet can be easily determined based on the clear TEM signature provided
by these regions. Folded regions are locally parallel to an electron beam, and
single-layer TrGO has been found to exhibit one dark line, similar to TEM images of
single-walled carbon nanotubes[267]. Compared with TEM analysis of TrGO, the
SAED pattern of GO samples show diffraction rings and less resolved diffraction dots,
indicating that the crystallinity of the graphene sheet has been significantly diminished
before thermal annealing although both of these two samples have similar TEM
images, as shown in Figure 4.11.

112
HRTEM was performed to determine the structure and distribution of Al2O3 NPs on
OrGO sheets. Figure 4.12 shows a piece of monolayer OrGO partially covering the
hole of a TEM grid. As in the optical images of TrGO, we have found dark area and
wrinkles in the OrGO plane confirming the layered structure and shape of rGO are
introduced by the exfoliation process and subsequent annealing process under vacuum.
Therefore, oxygen gas used to produce OrGO has no influence on the layered structure
and wrinkles of rGO.
Figure 4.12 HRTEM image of OrGO deposited on the holey TEM grid. The abbreviation of “1L” indicates the
monolayer area of OrGO sheet.

113
Further evidence of the monolayer structure of OrGO was provided by analyzing the
edges of single-layer and folded area, as shown in Figure 4.13. Folded monolayer
(bilayer) sheets have been found to exhibit uniform multiple/thicker dark lines in
folded regions, as in the case of multi-walled nanotubes[268] while the monolayer
graphene sheets synthesized in our experiments have a single dark line. Figure 4.14
Figure 4.13 HRTEM image of folded bilayer area in OrGO at high magnification. The dark area and wrinkles
confirm the layered structure of the OrGO.
Figure 4.14 HRTEM image of monolayer in OrGO with wrinkles at high magnification.

114
shows the same single dark line at the edges of unfolded monolayer structures where
the wrinkles have a variety of width. Thus these two HRTEM images illustrate the
different structure of edges, wrinkles and folded areas.
Figure 4.15 HRTEM image of OrGO showing the distribution of aluminium oxide NPs. The inset is the fast
Fourier transform pattern of the selected region in OrGO plane.
Figure 4.16 HRTEM image of Al2O3 NPs located at the edges of holes in OrGO plane. The particle sizes
are less than 10 nm.

115
Figure 4.17 The EDX mapping of the NPs showing the components of NPs.
Figure 4.15 shows a homogeneous distribution of Al2O3 NPs on the OrGO plane. The
inset is the corresponding selected area electron diffraction (SAED) pattern. More than
95% of the black spherical NPs, surrounded by flexible OrGO sheets, have an average
particle size of less than 10nm. Higher magnification of this composite presents three
major features: holes, graphitic regions and NPs (Figure 4.16). Holes or vacancies
were possibly created by widely distributed carbon loss throughout the sheet where
CO, CO2, and water was formed and released during thermal annealing [16, 269, 270].
On the contrary, chemical reduction using hydrazine can partially recover the aromatic
double-bonded structure of carbon by removal of oxygen functional groups without
removing carbon [11, 77]. However, these defects may serve as adsorption sites to
bind alumina molecules along the edges of the holes. Energy dispersive X-ray
spectroscopy (EDX) mapping demonstrates a clear distribution of each element and
that the black spots were rich in Al and O (Figure 4.17).

116
4.2.3 AFM analysis of OrGO
Figure 4.18 AFM image of OrGO sheets on 300 nm SiO2 coated Si wafer. The average thickness of OrGO
sheets is 0.7-0.8 nm, matching well with the reported apparent thickness of the as-exfoliated graphene.
Figure 4.19 The corresponding height profile obtained from the line in Figure 4.18, indicating a single
OrGO sheet.

117
Figure 4.18 shows an AFM image of alumina NPs decorated OrGO sheets deposited on
SiO2 substrate which are well dispersed with a lateral extent of a few hundred
nanometers. The thickness of the individual OrGO sheets and the dispersion of the NPs
can be visualized by the AFM operating in the tapping mode. The average thickness of
OrGO sheets is 0.7-0.8 nm, matching well with the reported apparent thickness of the
as-exfoliated graphene (Figure 4.19) [1, 10]. A great amount of AFM analysis
confirmed that most of the flakes observed are single sheets.
Figure 4.20 AFM image of Al2O3 NPs on OrGO sheet plane. The alumina NPs decorated OrGO sheets
deposited on SiO2 substrate which are well dispersed with a lateral extent of a few hundred nanometers.

118
Figure 4.21 The corresponding height profile obtained from the line in Figure 4.20, indicating the height of
Al2O3 NPs is less than 2 nm.
The AFM analysis further confirms the uniform distribution of Al2O3 NPs anchored on
the OrGO plane (Figure 4.20). Besides the diameter being determined by HRTEM
images, the height of NPs, as seen in height profile from line scan, is about 2 nm (Figure
4.21). Therefore, HRTEM and AFM analysis clearly elucidate the 3D architecture of
OrGO. It is also demonstrated that the NPs are isolated from each other on single- or
bi-layer rGO sheets with a typical high interparticle distance of between 60-80 nm,
whereas the layer-to-layer distance is approximately 3.4 Å that is equal to the interlayer
separation in graphite. Therefore, it can be concluded that our innovative exfoliation
process can produce single-layer graphene. There are two reasons that the histogram
(Figure 4.19) shows the average height of OrGO sheets is higher than graphene. First
of all, as the AFM probe (~20nm) is larger than some of the scales, the tip is prevented
from reaching the lowest point, resulting in an overestimate of the sheet thickness. On
the other hand, the value of graphene is determined from layered bulk material.
However, the van der Waals force is reduced for a single functionalized graphene
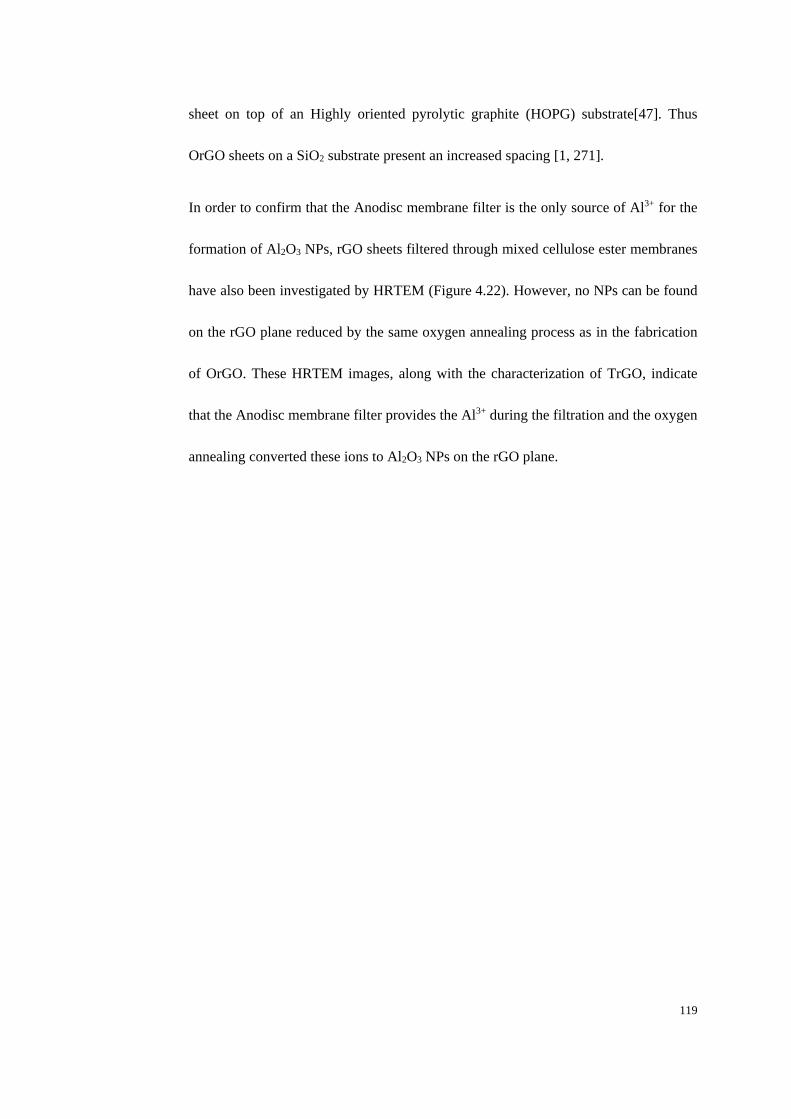
119
sheet on top of an Highly oriented pyrolytic graphite (HOPG) substrate[47]. Thus
OrGO sheets on a SiO2 substrate present an increased spacing [1, 271].
In order to confirm that the Anodisc membrane filter is the only source of Al3+ for the
formation of Al2O3 NPs, rGO sheets filtered through mixed cellulose ester membranes
have also been investigated by HRTEM (Figure 4.22). However, no NPs can be found
on the rGO plane reduced by the same oxygen annealing process as in the fabrication
of OrGO. These HRTEM images, along with the characterization of TrGO, indicate
that the Anodisc membrane filter provides the Al3+ during the filtration and the oxygen
annealing converted these ions to Al2O3 NPs on the rGO plane.

120
Figure 4.22 HRTEM images of rGO sheet filtered through mixed cellulose ester membranes and reduced
by oxygen annealing. No any Al2O3 nanoparticle can be found on rGO plane.
4.3 Summary
GO allows rich chemical reactions both within the intersheet and along the sheet edges
due to its layered structure and to the fact that it allows the attachment of a great
number of oxygen functionalities such as epoxide and hydroxyl groups on the basal
plane and carbonyl and carboxyl groups along the edges. Thus the structure can
synthesize many graphene-based materials. The innovative exfoliation process using

121
high speed centrifugation and probe ultrasonication to reduce the number of GO layers
has successfully produced monolayer GO sheets. TEM samples fabrication, by
vacuum filtering ultra-diluted GO dispersion through an alumina membrane filter,
easily deposited suspended GO sheets onto a holey TEM grid. The similarity between
this process and that for preparing GO paper, provides the opportunity to determine
the structure and distribution of Al2O3 NPs on an individual single layer of the OrGO
plane.
A better understanding has been achieved by imaging GO, TrGO and OrGO samples
with a variety of characterization methods such as optical microscopy, SEM, TEM,
HRTEM and AFM.
(i) The monolayer structure of GO/rGO produced by the exfoliation process has
been confirmed with the above mentioned measurements. The “grey” flakes of
the individual TrGO samples shows a single-layer structure in SEM images while
the darker areas indicates multi-layer features. The SAED pattern of TEM images
shows the very obvious 12 diffraction spots with equivalent relative intensities
between the inner and outer hexagons indicating the single-layer structure. The
uniform single dark line at the edges of unfolded monolayer of OrGO HRTEM
images further confirms the single-layer structure. Moreover, the height profile of
AFM images provides further evidence of the single-layer structure of OrGO
sheets.

122
(ii) The structure and formation of wrinkles in GO, TrGO and OrGO planes has also
been analyzed. The wrinkles were introduced due to the difference of thermal
expansion coefficient between substrate and graphene sheets during the annealing
process. Unlike the uniform thickness of wrinkles at the edges of folded bilayer
structure, the winkles in a monolayer GO/rGO sample varies in width.
(iii) The monolayer structure along with bilayer and overlapping multi-layer structure
have been investigated in detail to establish a simple system for distinguishing the
single-layer sheets.
(iv) The distribution and structure of Al2O3 NPs synthesized in OrGO have been
characterized with HRTEM and AFM. The diameter of NPs is less than 10 nm
with a typical high interparticle distance between 60-80 nm. The NPs are located
at the edges of holes produced during the annealing process. Furthermore, height
profiles of AFM images determined the height of NPs is less than 2 nm.
Morphology analysis established a fundamental understanding of the monolayer
structure of GO, TrGO and OrGO samples which are the basic units in GO paper. The
method we used for producing a single-layer GO dispersion provided a better process
for the production of GO paper.

123
Chapter 5 Characterization of OrGO paper
5.1 Introduction
Although its good electronic, thermal, and mechanical properties allow for a range of
possible applications[1, 72, 164, 272], graphene originally fabricated by the
mechanical cleavage method lacks the ability to produce large quantities of the
material, making it unrealistic for practical applications. Therefore, large-scale
production of high quality graphene sheets is one of the difficulties to be overcome.
Although a variety of methods to scale up graphene output have been investigated [20,
272, 273], the modified Hummer’s method used by Ruoff and co-workers seems to
provide an efficient way to fabricate large quantities of graphene. In this method,
colloidal suspensions of individual graphene oxide sheets can be achieved by
exfoliating in water, the graphite oxide which can be obtained in bulk quantities by
oxidizing graphite [11, 14]. Furthermore, these GO sheets can be chemically
functionalized, doped with NPs, and combined with polymer in GO dispersion to yield
novel composites[164].
GO allows chemical reactions both in the inter-sheet and the sheet edges[274, 275]
due to its layered structure containing a great number of oxygen functional groups
such as epoxide and hydroxyl on the basal plane as well as carbonyl and carboxyl
along the edges[62, 64]. These active functional groups provide places to synthesize
many graphene-based materials. Additionally, individual GO sheets, which are
prepared from GO, can be reassembled into thin films [276]or free-standing and

124
foil-like GO paper through flow-directed filtration of an electrostatically stabilized
aqueous GO dispersion[163]. The resulting GO paper keeps all the functional groups
and their native chemistry in the GO planes.
Even if GO paper could be obtained by an easy chemical method, its electrical
conductivity could not be enhanced without thermal annealing which is considered to
convert it into TrGO paper[132]. In order to produce functionalized graphene paper
from graphene oxide sheets with enhanced electrical conductivity and to investigate
the related properties, we envisioned two strategies to fabricate reduced GO paper
based materials including thermal annealing and oxygen annealing. The
characterizations consisting of SEM, TEM, XPS Raman spectroscopy and FTIR were
used to reveal the mechanism in the formation of Al2O3 NPs on the rGO plane.
5.2 Results and discussion
5.2.1 SEM images of OrGO paper
GO paper was fabricated by filtering a GO dispersion containing separated monolayer
GO sheets through an alumina membrane filter. After vacuum filtration, the resulting
bulk material contained restacked GO layers with a different structure from graphite.
In order to understand the morphology of GO/rGO paper, the raw material, individual
pieces of HOPG were characterized by SEM. The graphene flakes were prepared
using scotch-tape to repeatedly peel HOPG which were then deposited onto the
SiO2/Si substrate. The samples were then released in acetone followed by washing
with an ample amount of DI water and propanol. After air drying, the substrates were

125
subjected to further cleaning in an ultrasound cleaner bath of propanol, removing most
of the thick flakes captured on the wafer’s surface. The remaining thin flakes were
found to be attached strongly to the surface of the SiO2/Si wafer, presumably due to
van der Waals and/or capillary forces.
Figure 5.1 shows an individual piece of graphite flake with a stacked layer structure.
The sample consisted of multiple-layered films (marked by the circles), which were
uniformly oriented into lamella forms (marked by the arrows).
Figure 5.1 SEM image of graphite. The highly oriented lamella forms indicate the stacked layer structure of
graphite flakes.

126
Figure 5.2 Top view of SEM image of GO.
Figure 5.3 Top view of SEM image of TrGO. Vacuum filtration of GO dispersion produces a paper-like
material with an interwoven structure in a nearly parallel manner.

127
The oriented stacked layers of graphite are easy to separate into small pieces due to
their delicate structure, unlike the interwoven structure of GO paper where layers
interweave with one another on a larger scale (Figure 5.2 and 5.3). As a result, GO
paper is stronger than graphite foil and bucky paper made from carbon nanotubes[163].
Vacuum suction of a GO dispersion produces GO paper with an interwoven structure
where individual layers shift over each other in a nearly parallel manner, the resulting
layers therefore becoming flexible. In its solid form, GO sheets tend to form thin and
extremely stable paper-like structures which can be stretched and folded, indicating
that free-standing GO paper can be considered for applications such as flexible film
batteries, hydrogen storage or electric membranes.

128
Figure 5.4 Cross-sectional view of SEM image of GO.
Figure 5.5 Cross-sectional view of SEM image of TrGO. TrGO paper has an apparently uniform and smooth
surface with a well-packed layered structure due to removal of oxygen-containing functionalities.

129
When GO paper is reduced by thermal annealing, the resulting TrGO paper has an
apparently uniform and smooth surface with a well-packed layered structure which
allows the formation of a tighter package of sheets due to removal of
oxygen-containing functionalities. Moreover, both sides of the as-prepared TrGO paper
show a shiny metallic lustre (Figure 5.3) with a smooth surface under SEM, suggesting
this material has a highly ordered macroscopic structure.
According to the above topography characterizations, the raw material graphite has a
highly oriented layer structure while the individual layers of graphene stack in a nearly
parallel manner. This flexible paper-like structures can be stretched and folded. Figure
5.6 shows the schematic of graphite and graphene layers decorated with Al2O3 NPs.
However the mechanism behind the interlayer effects of NPs embedded graphene still
remains unknown and further research is necessary.
Figure 5.6 The schematic of graphite and graphene decorated with Al2O3 NPs. The paper-like graphene
composite embedded with NPs are flexible and stretched.

130
5.2.2 XPS analysis of OrGO paper
Figure 5.7 C1s XPS spectra of GO.
The chemical state of elements in the GO, TrGO and OrGO were extensively
characterized by XPS. Figure 5.7 shows the two types of C1s band shapes which are
usually mentioned in the literature concerning GO XPS data. The first one is a
markedly asymmetric wide C1s band on the high-binding-energy side [11, 277]. The
second C 1s band has two clear maxima in a relatively narrow band [253, 278]. In
principle, the different proportions of chemical functionalities shown here may result
from the different methods used to convert graphite oxide into graphene sheets.
Moreover, the difficulty in electrically insulating samples in XPS measurement cause
a surface charging effect on the graphite oxide resulting in a shift to higher binding
energies in the XPS bands and this could be another reason for the differences.
Additionally, graphite oxide is electrically heterogeneous on a local scale resulting in

131
differential charging. Above all, an artificially widened XPS band is introduced by the
individual components of a given band in different compounds shifting to different
extents.
Figure 5.8 C1s XPS spectra of TrGO.

132
Figure 5.9 C1s XPS spectra of OrGO.
The binding energy of the C–C is assigned at 284.5 eV, Figure 5.7, and the binding
energy at 286.5 eV, 287.6 eV and 289.6 eV are typically assigned for the C–OH, C=O,
and O=C–OH functional groups, respectively [15, 279]. The peaks of oxygen functional
groups are apparently decreased after the thermal annealing (Figure 5.8) and oxygen
annealing process (Figure 5.9), the content of oxygenated carbon decreasing from
58.34% to 32.27% and 28.63%. The C-C peak corresponds to the number of sp2 carbon
components, while the oxygen functional groups corresponding to the amount of
sp3-hybridized carbon. The reduction efficiency can therefore be illustrated by the
variation of the sp2/sp3 hybridization ratio [13, 67, 76, 280]. The sp2/sp3 ratios are 0.7,
2.1 and 2.5 for GO, TrGO and OrGO, respectively, indicating more oxygen functional
groups have been removed during oxygen annealing. This result indicates that OrGO
has a higher reduction efficiency than that of TrGO.

133
The shift of sp2-carbon peaks in the XPS indicates a major modification of the electronic
structures of graphene sheets due to the charge transfer between the graphene sheets and
NP molecules [127, 281, 282]. It has been reported that the Fermi level of rGO,
represented by the main sp2-peak position in C1s XPS peak, should shift upward when
the charge transfers from the NPs to rGO sheets due to covalent interaction. As a result,
the C1s binding energy of the nanocomposite is increased [26, 282]. However, the
OrGO XPS shows the C-C bond is very stable without any shift, indicating noncovalent
interaction of Al2O3 NPs with the OrGO plane [24, 283].
Figure 5.10 Al 2p XPS spectra of GO, TrGO and OrGO, respectively.
Figure 5.10 shows the High-resolution Al 2p XPS spectra of GO, TrGO and OrGO.
After filtering the GO dispersion through an alumina membrane filter, the Al 2p scans
of GO paper show an Al 2p peak at 74.5 eV that is nearly coincident with that of TrGO

134
(74.3 eV) and OrGO (74.5 eV). Thus it was extremely difficult to distinguish clearly
between these three species using the primary aluminium photoelectron line.
Figure 5.11 Al KLL XPS spectra of GO, TrGO and OrGO, respectively.
As a result, we collected high resolution spectra of the Al KLL Auger peak to further
understand the element states of GO, TrGO and OrGO [284, 285]. The Al KLL Auger
peaks were measured at a kinetic energy of 1386.8 eV (GO), 1387.8 eV (TrGO) and
1387.6 eV (OrGO) (Figure 5.11). The Al 2p and Al KLL energies indicate that
aluminium incorporated in GO sheets is aluminium hydroxide (Al(OH)3) which is
then oxidized to form Al2O3 by thermal and oxygen annealing, respectively [286].
However, we could no visible NPs of Al2O3 in TrGO, indicating that oxidation of
Al(OH)3 occurred at a molecular level with no further aggregation of these molecules to
form NPs by thermal annealing.

135
5.2.3 Raman spectroscopy analysis
Raman spectra is a non-destructive tool to characterize the structure of mono- and few
layer GO such as thickness, defects and the degree of orderliness. In order to
determine the structural changes in GO paper and reduced GO paper including
TrGO and OrGO after thermal annealing and oxygen annealing, respectively, Raman
spectroscopy was carried out to interpret the change in D, G, and 2D peaks around
1350 cm−1, 1580 cm−1 and 2700 cm−1, as shown in Figure 5.12.
Figure 5.12 Raman spectrum of graphite shows the D, G, and 2D peaks around 1350 cm−1, 1580 cm−1 and
2700 cm−1
The G-band of graphite materials is associated with the doubly degenerate phonon
mode (E2g symmetry) at the Brillouin zone center[287], whereas the D-band is due to
the in plane vibration of the sp2 carbon atoms[288]. The D band, which indicates the
defect density of the graphite material, appears to be due to the presence of atom

136
disorder in planes or edges as well as charge puddles and ripples. The 2D band, which
is normally at double the frequency of the D band, represents the second order Raman
scattering process. Compared with the graphite samples, the Raman spectrum of GO
paper shown in Figure 5.13 represents a D peak with a higher relative intensity than
the G peak, confirming the existence of defects after the chemical oxidation process.
Figure 5.13 Raman spectra of graphite and GO show an obvious D band after chemical oxidation of
graphite.
The intensity ratio ID/IG in Raman spectroscopy can be used to reveal the structural
evolution whereby the sp2 ring clusters contain sp3 and sp2 bonded carbon. The ID/IG
values of graphite samples were lower than those for GO paper obtained by the
modified Hummer’s method, indicating that, by this method, part of the sp2 carbon
areas were oxidized to form sp3 carbon. In addition, both G and D bands in the GO

137
Raman spectrum are broadened, indicating a disordered network of carbon atoms due to
fractions of sp3 carbons forming in oxidized graphite samples.
Figure 5.14 Raman spectra of TrGO and OrGO.
After reduction of GO paper by thermal and oxygen annealing, the degree of
orderliness in the resulting TrGO and OrGO was characterized with the 2D-band shift
and ID/IG ratio. Figure 5.14shows the 2D-band peak of OrGO has slightly shifted from
2692 cm−1 to 2697 cm−1. Furthermore, the slightly higher ID/IG intensity ratio of TrGO
indicates a possible smaller average size of the sp2 domains. Compared with the
G-band, the lower relative intensity of the D-band and its broader width indicates the
higher orderliness of TrGO and OrGO papers. These phenomena suggest that
traditional thermal annealing can remove oxygen functional groups from the GO basal
plane during the thermal reduction process. However, the new graphitic domains have

138
smaller size but greater number than those of OrGO due to a slight decreasing in the
ID/IG intensity ratio after our innovative oxygen annealing process. In another words,
Al2O3 NPs growth under this oxygen annealing further removed oxygen
functionalities in GO sheets. Table 5-1represents the ratio of sp2 to sp3 carbon areas in
graphite, GO, TrGO and OrGO samples [287].
Table 5-1 sp3/sp2 carbon ratio by calculating ID/IG ratio
Graphite material sp3/sp2 ratio
Graphite
OrGO
0.101
0.896
TrGO 1.116
GO 1.879
Distinct blue peak shifts for the D-band and the G-band were observed after the heat
and oxygen treatment, which is usually attributed to the presence of isolated double
bonds resonating at higher frequencies.
5.2.4 FTIR analysis
The structural changes of GO, TrGO and OrGO papers were also characterized by
FTIR spectra analysis. Furthermore, this measurement provided information on Al2O3
NPs growth under oxygen annealing. For oxygen functional groups attached onto the
GO sheet planes, the FTIR spectrum, shown in Figure 5.15 [278, 289, 290]. , illustrates
the characteristic absorption bands corresponding to the C−O stretching at 1053 cm-1,
the C−OH stretching at 1231 cm-1, the C−H stretching at 1389 cm-1 and the C=O
carbonyl stretching from carbonyl and carboxylic groups at 1720 cm-1.

139
Figure 5.15 FTIR spectrum of GO
The GO spectrum also shows a C=C peak at 1616 cm-1 and this may be due to skeletal
vibrations of unoxidized graphitic domains. After treating GO paper by thermal and
oxygen annealing, FTIR peaks at 1053 cm-1, 1231 cm-1, and 1720 cm-1 of the resulting
TrGO and OrGO papers are severely attenuated as to be almost undetectable,
implying the removal of epoxide and the hydroxyl groups that were attached to the GO
basal plane (Figure 5.16 and Figure 5.17).

140
Figure 5.16 FTIR spectrum of TrGO
Figure 5.17 FTIR spectrum of OrGO
Moreover, the FTIR spectrum of OrGO reveals the process of Al2O3 NPs growth on the
OrGO plane as shown by the absence of a broad absorbance between 2368 cm-1 and
3667 cm-1 resulting from AlO-H stretching vibrations. Concurrently, there is an

141
enhanced infrared absorbance centered around 1645 cm-1 [291] resulting from
aluminium ions (Al3+) and a broad absorption band at 1036 cm-1 [292] corresponding to
the bulk phonon modes of y-Al2O3. It thus seems reasonable to assume that the AlO-H
stretching vibrations are attributed to the molecules of Al(OH)3 probably produced
through the dissolution of Al2O3 in water[293, 294]. The heat treatment removed –OH
along with some of the oxygen functional groups and the exposed active Al3+ reacted
with oxygen molecules under oxygen gas flow to aggregate as visible NPs on the edges
of holes in the OrGO plane due to the dangling bonds or oxygen functional groups
located at the edges of the graphite lattice structure which energetically captured Al3+
ions to afford aluminum oxide growth[295, 296]. In other words, under oxygen gas
flow, Al3+ ions are most likely to anchor at the highly reactive areas of structural defect
edges promoting oxidation to form Al2O3 NPs. Unlike the aqueous chemical reduction
of AuCl4- ions used for gold particle/GO[297] or palladium acetate used for palladium
NP/GO (/rGO)[298], which deposits the NPs mostly anchored on the functional groups
of GO or the rGO plane, the oxygen annealing of Al3+/GO in a vacuum chamber
synthesizes the NPs at the edges of defects in OrGO sheets. According to the above
analysis of XPS and Raman spectra, Al(OH)3 molecules, formed by filtering the GO
dispersion through an alumina membrane filter, reacted with the active dangling bonds
sited at the edge of lattice structure defects to remove oxygen functional groups. The
oxygen annealing which followed oxidized the Al(OH)3 molecules and the resulting
Al2O3 molecules aggregated to form visible NPs at the edge of holes. The aggregation
of Al2O3 molecules enables more of the sp3 carbon domain to be restored to sp2 carbon

142
during the oxygen annealing process. Therefore, because of the use of a low
temperature treatment during which no extra oxygen functionalities were introduced
by oxygen gas flow, this oxygen annealing method increased the sp2/sp3 carbon ratio
instead of oxidizing the carbon lattice structure.
5.3 Summary
A GO dispersion prepared from graphite by Hummer’s Method, was reassembled into
free-standing paper-like material through flow-directed filtration under vacuum. The
resultant GO paper keeps all the functional groups and their native chemistry in its
layered structure. Although GO paper can be obtained by an easy chemical method, it is
still electrically insulating without thermal reduction. In addition, the structural
integrity of the TrGO paper obtained in this way is affected by the thermal treatment so
that holes in the lattice structure can be found in the TrGO sheet plane. As a result, we
improved the traditional thermal annealing method by introducing an oxygen gas flow
in the thermal reduction process to fabricate OrGO sheets in which the defective
regions were recovered. In this method, colloidal suspensions of individual GO sheets
can be produced by exfoliating the graphite oxide in DI water, namely Hummer’s
Method, resulting in GO sheets doped with NPs which are then formed into novel bulk
paper-like composites via vacuum filtration through an Anodisc membrane filter.
A better understanding of these processes has been achieved by imaging GO, TrGO
and OrGO samples with a variety of characterization methods such as SEM, XPS,
Raman and FTIR:

143
(i) The results presented here demonstrate a convenient method for synthesizing
Al2O3 NPs on rGO sheets with uniform particle size.
(ii) Upon the introduction of Al3+ as seeds anchored on the GO plane by vacuum
filtration through an alumina Anodisc membrane filter, the Al2O3 molecules
aggregated to form NPs and grew on the edges of holes or vacancies during thermal
annealing.
(iii) XPS spectra confirm the reduction efficiency of TrGO and OrGO as well as the
element states of aluminium in GO or rGO plane.
(iv) The Raman and FTIR results reveal dangling bonds or oxygen functional groups of
GO binding to the Al3+ to allow aluminium oxide aggregates and growth which
lead to a further reduction.

144
Chapter 6 Properties of OrGO paper
6.1 Introduction
The study of the electronic properties of OrGO paper promises to open new
opportunities for the manufacture of industrial electronic devices. We have shown that
GO-based paper-like material can be synthesized by chemical exfoliation of graphite
using an oxidizing agent and then dispersion in DI water, down to single sheets
through ultrasonication and centrifugation followed by filtration. It may be possible to
implement this process on an industrial scale. The challenge of GO paper
implementation is restoring electrical conductivity which is dramatically lowered to
insulation after oxidation of graphite.
Previous electrical conductivity research of graphene has been intensively carried out
on individual sheets. These experimental measurements [299-301] enable us to
understand the electrical conductivity properties of two-dimensional graphene based
materials. In order to achieve large-scale production of electrically conductive
graphene based materials to meet industrial requirements, more attention has recently
focused on highly disordered GO papers [67, 77, 131, 253].
As a non-stoichiometric compound, GO sheets consist of both sp2-hybridized and
sp3-hybridized carbon atoms, such as hydroxyl and epoxide functional groups on
either side of the basal plane, and carboxyl and carbonyl groups at the edges. The
properties of GO are attributed to the conditions of synthesis and following treatments.
The missing carbon atoms (holes or vacancies) in the hexagonal ring-based carbon

145
network and the corrugation of sheets are formed by local chemical structure where
the saturated sp3 bonds and their bonded electronegative oxygen atoms as well as other
“defects” enhance the energy gap in the electron density [302], resulting in GO
becoming non-conducting. Therefore, in order to modify these structural and
electronic properties, the recent focus has been on attempting to enhance the electrical
conductivity of chemically oxidized GO sheets by a variety of chemical and thermal
processes[67, 77, 131, 253].
In this section, we explore the electrical conductivity of TrGO and OrGO papers,
respectively, to understand how the reduction process affects the electronic properties.
We designed short-time annealing experiments to investigate the efficiency of heat
treatment on GO paper. The results of these experiments provide more details on the
improvement of electrical conductivity of TrGO and OrGO papers by this method
rather than the use of a long-term reduction process to achieve the highest electrical
conductivity value.
Water wettability of various graphitic surfaces, for instance, graphite and carbon
nanotubes ae currently intensely studied. The wettability of graphite is commonly
accepted to be between 84–86° which is also used to calibrate the force field for
water–graphite interaction [303-306]. The wettability of the outside surface of
carbon nanotubes obtained from the wetting force measured of an individual carbon
nanotube was 80.1°[307]. Additionally, water molecules can be transported into a

146
single-walled carbon nanotube at high speed, indicating that carbon nanotubes have a
hydrophilic interior surface with small-diameter [308-310].
The environmental compatibility of the surface of these materials is normally
determined by formation of hybrid materials, coating and composites which affect the
surface charge and wettability[132]. Even though the surface properties play a key
role in practical applications, limited research has been done on rGO surface
properties. Herein, the wettability of TrGO and OrGO papers is investigated by
measuring the water contact angle to understand more about Al2O3/rGO structure.
6.2 Results and discussion
6.2.1 Electrical conductivity of OrGO
6.2.1.1 Electrical conductivity recovered by oxygen annealing
GO paper is nonconductive and its resistance values were beyond the measuring range
of our electrical conductivity equipment. The electrical conductivity of TrGO and
OrGO was measured in five places for one sample, five samples being taken for each
material. The results show that OrGO has a higher electrical conductivity at 7250 S
m−1 than that of TrGO at 5900 S m−1 (Table 6-1). In addition, the measured values of
TrGO paper are mostly in the range of 4500-5500 S m−1 while OrGO samples have a
narrower range of electrical conductivity - mostly between 6500 and 7250 S m−1,
indicating a more uniform structure and a better reduction level of OrGO produced by
oxygen annealing (Figure 6.1).

147
Figure 6.1Percentage of the electrical conductivity in the different ranges for OrGO and TrGO.
Table 6-1 Electrical conductivity (S m-1) of TrGO and OrGO produced with low temperature ramp rate at
2 OC/min under vacuum.
Samples No. TrGO (S m-1) OrGO (S m-1)
1
5480 6690
4830 6270
4320 6480
4750 7190
5900 6180
2
4340 7080
4960 6810
4570 7250
5650 7090
5190 6970
3
4950 6740
5330 6850
4480 6980
5120 7150
4880 6570
4
4820 7050
5260 6820
4920 6790
4480 6680
5390 7210
5
5350 6740
5270 6890
4930 6830
5090 7160
4780 6650

148
GO containing both sp2 and sp3 carbon networks can be considered as possessing a
quasi-two-dimensional structure where the amorphous sp3 regions functionalizing GO
sheets with hydroxyl−hydroxyl and hydroxyl−epoxide hydrogen bonding
interactions[311]. Paci et al. simulated the molecular dynamics of hydrogen bonding
and revealed that the high tunnel barriers between the sp2 carbon networks were
formed by disordered sp3 bonded structures [312]. Therefore, heat treatment forces
more individual sp2 regions to be connected by removing functional groups to form a
two-dimensional graphene plane. According to the analysis of TrGO and OrGO sheets
in Chapter 5, the significant increase in the electrical conductivity of OrGO can be
presumably attributed to more of the graphitic network of sp2 bonds being restored by
oxygen annealing reduction. The better electrical conductivity results for OrGO paper
are likely associated with the higher sp2/sp3 carbon ratio caused by Al2O3 NPs
aggregated at the edges of defective regions in the OrGO plane during oxygen
annealing.
When paper GO is reduced by thermal annealing, the removal of oxygen
functionalities allows a tighterpacked structure for TrGO sheets. Evolving gas such as
CO and CO2 molecules would disturb this packed structure and prevent TrGO sheets
from forming a well-ordered structure, as seen in SEM images of TrGO paper (section
5.2.1). However, the formation of Al2O3 NPs can alleviate this issue. The NPs present
in the interlayer maintain a larger intersheet spacing and allow the emission of evolved

149
gas molecules out of the stacked OrGO sheets with a minimal disturbance of the initial
sheet packing order.
As a result, the values and ranges of electrical conductivity of OrGO reveal that the
formation of Al2O3 NPs on OrGO sheet planes produce a uniform restacking structure
of rGO sheets with a higher sp2/sp3 carbon ratio.
6.2.1.2 Short duration reduction for GO paper
Although electrically insulating GO paper can be reduced by thermal or oxygen
annealing at 400 OC for 30 minutes to fabricate electrically conductive TrGO or OrGO,
the details of this conversion from insulating to conducting during the 30 minutes
annealing are still not clear. As a result, we designed short-duration annealing
experiments to fabricate TrGO and OrGO to investigate the reduction mechanism in
this process. Unlike the process described in section 3.5 and 3.6, the short-duration
annealing was carried out for only 30 minutes without vacuum. In addition, for extra
control and detail, the samples were put in the furnace at the desired temperature and
taken out and examined every 5 minutes.

150
Figure 6.2 The electrical conductivity of TrGO and OrGO for a short-time annealing process.
Figure 6.2 shows the results of the electrical conductivity for TrGO and OrGO
samples. The electrical conductivities of OrGO samples were in the range of
3040~5170 S m−1 and are apparently higher than that of TrGO papers. During thermal
annealing process to fabricate TrGO samples, electrical conductivity was not detected
until 15 minutes had elapsed, indicating that the heat treatment could not reduce GO
paper to obtain electrical conductive TrGO paper in a very short time. On the other
hand, the conversion of OrGO from insulating to conducting are carried out within the
first 5 minutes, although only 2 out of 5 samples could be successfully measured.
However, the electrical conductivity of one sample was measured as high as 3820 S
m−1. Moreover, the average values of electrical conductivity of OrGO increase
dramatically to 4830 S m−1 in the next 15 minutes. Surprisingly, the highest value of
electrical conductivity detected was at 5170 S m−1, which is close to that of TrGO

151
papers prepared by traditional thermal annealing. Compared with OrGO papers, the
electrical conductivity of TrGO papers are gradually improved from 550 to 1230 S
m−1 in last 15 minutes of thermal annealing. However, the electrical conductivity of
TrGO paper is still lower than that of OrGO samples, although the electronic
properties of OrGO show a small fluctuation in the last 10 minutes. Consequently, the
higher electrical conductivity of OrGO can be attributed to the oxygen gas flow which
is introduced during thermal annealing to efficiently reduce GO paper leading to the
recovery of the electronic property. In another words, the growth of Al2O3 NPs
exclusively at the edges of defective regions in the OrGO plane has increased the
sp2/sp3 ratio to obtain a better electrical conductivity, which is proved by the
characterizations in Chapter 6.
Due to numerous oxygen functional groups attached onto the GO plane as well as the
structural defects, the electrical conductivity of GO paper is severely decreased to
insulating, the oxygen functional groups attached to the plane mainly influencing the
electrical conductivity. Hence, the reduction of GO can be performed by removing the
oxygen functionalities and healing the structural defects of the basal plane. Kim et al.
calculated the binding energy between graphene planes and attached oxygen
functional groups by density functional theory [313]. They found that hydroxyl groups
have a lower binding energy at 15.4 kcal/mol and epoxy groups have a higher
binding energy at 62 kcal/mol. Gao et al. further reported that hydroxyl groups
attached to the interior basal plane have a lower binding energy than hydroxyl groups

152
located at the edge [314]. Based on their calculations, the hydroxyl groups attached to
the edges can be fully dissociated from the GO plane above 650 °C. However, the
characterizations of OrGO demonstrate that the further deoxygenation of GO can be
successfully approached through chemical reaction between Al(OH)3 molecules and
oxygen functional groups located at the edges, resulting in a higher electrical
conductivity of OrGO. As a result, the aggregation of Al2O3 NPs on the OrGO plane
by oxygen annealing has dramatically improved the electronic properties of rGO
material without extra thermal energy consumption.
Experimental work on thermal reduction reveal that the oxygen functional groups can
be eliminated at a lower temperature than the calculated temperature used in a
long-term annealing process. Jeong et al. reported a low temperature thermal
annealing at 200 °C can remove most oxygen functionalities from the GO plane under
low-pressure argon conditions.(550 mTorr) [128]. FTIR results show that epoxy and
carboxyl groups apparently decrease while hydroxyl groups completely disappear
after thermal annealing for 6 h. Furthermore, the remaining epoxy and carboxyl
groups can be dramatically eliminated by low temperature thermal annealing up to 10
h with a C/O ratio of around 10. Therefore, long-duration thermal annealing of GO
paper can increase its electrical conductivity by removal of most of the oxygen
functional groups. However, the electrical conductivity of short-duration annealed
OrGO (Figure 6.2) is close to that of TrGO (Figure 6.1) produced by traditional

153
thermal reduction, indicating that the formation of Al2O3 NPs by short time oxygen
annealing approaches a reduction level similar to thermal annealing.
The electrical conductivity of short-duration annealed TrGO and OrGO confirm that
oxygen functional groups attached on the GO plane can be removed at 400 °C without
vacuum in 30 minutes. Although many of the functional groups are
thermodynamically stable, the aggregation of Al2O3 NPs has the capability to facilitate
the dissociation of these functionalities from the GO plane by reacting with functional
groups at the edges under an oxygen condition. The removal of oxygen functionalities
is more likely to occur in the first 5 minutes while no electrical conductivity can be
detected for TrGO samples. Therefore, the reduction pathway for oxygen annealing
includes two categories: a. heat treatment in traditional thermal reduction and
chemical reaction between Al(OH)3 and functional groups to remove more
functionalities resulting in the increase of sp2/sp3 ratio. Oxygen annealing has opened
a simple and efficient way to improve the reduction level of GO material based on
traditional thermal annealing without introducing extra MO precursors to prepare
MO/rGO composites.
6.2.2 Wettability of OrGO
GO, TrGO and OrGO were subjected to wettability measurements by testing their
static contact angle with water. According to the analysis of their structures, the
hydrophilic GO sheets can be converted to hydrophobic rGO sheets by elimination of
oxygen functional groups with thermal reduction. Figure 6.3 shows that the contact

154
angle of GO paper is 43.8°, indicating a hydrophilic property of GO paper produced
by Hummer’s Method.
Figure 6.3 Water contact-angle measurements on GO
TrGO paper prepared from thermally reduced GO paper had a contact angle of 88.3°.
Also indicating its hydrophobic properties. (Figure 6.4).
Figure 6.4 Water contact-angle measurements on TrGO

155
OrGO paper has a different surface wettability from GO and TrGO. The image shown
in Figure 6.5, shows a contact angle of around 71.5°, much less than 90°, indicating
good hydrophilic properties.
Figure 6.5 Water contact-angle measurements on OrGO
It is interesting to note that the contact angle of OrGO paper is smaller than that of
TrGO paper while its electrical conductivity is higher than TrGO. According to
structural analysis, the polar oxygen functional groups attached onto the GO plane
change the surface wettability from hydrophobic to hydrophilic and decrease the
electrical conductivity from conductive to insulating. The elimination of these polar
groups by thermal reduction can recover the electronic properties and restore the
surface wettability from hydrophilic to hydrophobic. However, the hydrophilic
properties as well as the good electrical conductivity provides the material with a
better environmental compatibility for the fabrication of electrodes. Therefore,

156
hydrophilic and electrically conductive OrGO paper fabricated by oxygen annealing
may provide a suitable medium for wide application in electronic devices.
It is well known that Al2O3 is hydrophilic by nature due to its numerous hydroxyl
(OH−) groups [315]. During oxygen annealing, GO is coated with as-formed Al2O3
NPs by electrostatic attraction. The heterocoagulation of GO sheets and Al2O3 NPs
improve the hydrophilic property of the composites[316]. Although the elimination of
oxygen functional groups by heat treatment and aggregation of Al2O3 NPs on the GO
plane weaken the hydrophilic property, the Al2O3/rGO composites still exhibit the
hydrophilic property with a contact angle of around 71.5°. Tadanaga et al. prepared a
superhydrophilic Al2O3 film based composite by thermal annealing at 500 °C [317].
The water contact angle of the films was smaller than 5°, indicating the natural
hydrophilic property of Al2O3 cannot be converted to hydrophobic by heat treatment.
Bang et al. reported a similar wettability conversion process on poly-4-vinylphenol
(PVP) and PVP/Al2O3 dielectrics [315]. PVP has a strong hydrophilic property due to
its structure consisting of many hydroxyl groups. However, these functional groups
can be removed by a condensation process to enlarge the water contact angle of the
PVP film to 70° while the PVP/Al2O3 composite has a water contact angle at 29°.
6.3 Summary
OrGO has a higher electrical conductivity at 7250 S m−1 with a narrower range of the
electrical conductivity mostly between 6500 and 7250 S m−1, which can be attributed
to a more uniform structure and a better reduction level caused by oxygen annealing.

157
The formation of Al2O3 NPs on the rGO plane can form a well-ordered stacked
structure of OrGO paper due to the NPs enlarging the intersheet space which, in turn,
facilitates the emission of evolved gas molecules during heat treatment. Short-duration
annealing was investigated to elucidate the reduction mechanism. Similar to the
electrical conductivity results of TrGO and OrGO, short-duration annealed OrGO still
has a higher electrical conductivity at 5170 S m−1, which is close to that of TrGO
papers prepared by traditional thermal annealing. The analysis of the annealing
mechanism indicates that the increase in the sp2/sp3 carbon ratio caused by the
formation of Al2O3 NPs at the edges of defective regions in OrGO plane creates its
excellent electrical conductivity. In summary, oxygen annealing has two functions:
heat treatment for tradition thermal reduction and chemical reaction between Al(OH)3
and functional groups to remove more functionalities resulting in the increase of
sp2/sp3 ratio.
The wettability measurements revealed that thermal annealing and oxygen annealing
methods can be used to fabricate rGO with a tunable wettability, which gives rGO
based materials great potential in practical applications. The contact angle of GO paper
was measured at 43.8°, indicating a hydrophilic property. After thermal reduction, the
resultant TrGO paper has a hydrophobic property with a contact angle of 88.3° due to
the elimination of oxygen functional groups during the heat treatment. However, OrGO
paper has a different surface wettability from TrGO due to its unique Al2O3 NP/rGO
structure. The contact angle of OrGO sheets is measured around 71.5°, much less than

158
90°, indicating a good hydrophilic property. The analysis further reveals that
hydrophilic Al2O3 NP decorated on rGO planes improve the hydrophilic property of
rGO paper while its electronic property changes from insulating to conducting.

159
Chapter 7 Application of OrGO paper for LIBs
7.1 Introduction
LIBs have been in high demand for mobile electronic devices and pure or hybrid
electric vehicles for many years [318-320]. Anode and cathode materials have a great
influence on the energy density and electrochemical performance of LIBs due to their
chemical and physical properties[113, 321, 322].Consequently, a lot of effort has
been made over the years to improve the properties of electrode materials [316-320,
323]. As a carbonaceous allotrope, rGO sheets are superior for energy storage
applications due to their chemical activity, high surface area, broad electrochemical
window and extreme electrical conductivity [324-326]. These excellent properties
allow rGO sheets a better reversible charge and discharge performance with higher
specific capacity than that of current electrode materials such as graphite and LiCoO2.
The carbon atoms in a graphene plane can capture Li+ ions in a LiC6 formation to
achieve a theoretical energy capacity of 372 mA h g−1 for one-side absorption and 744
mA h g−1 for both-side absorption[170, 322, 327]. However, graphene nanosheets are
easily aggregated to form paper-like materials due to their large surface area and
interlayer adhesion by Van der Waals force, which decreases the cross-plane
diffusivity of Li+ ions although the in-plane diffusivity is high [166, 319]. This
diffusivity mechanism limits the electrochemical performance especially at high
current density [319, 324, 325, 328-330].

160
MOs such as SnO2 [331]and Co3O4 [171]are used for LIBs as anode materials due to
their high theoretical capacity. However, the pulverization and capacity decay of these
MO electrodes caused by dramatic changes in specific volume during the cycling
processes have affected their electrochemical performance. Therefore, MO/rGO
composites with high electrical conductivity and flexibility, such as SnO2/rGO [31,
176], TiO2/rGO [209] and Co3O4/rGO [332] have been accepted as electrode materials
to improve the cycle performance and specific energy capacity. Compared with other
carbonaceous materials including graphite [333, 334] and carbon nanotubes [335],
rGO sheets are able to effectively restrict the volume change of MOs and maintain the
overall high electrical conductivity during the charge and discharge cycles.
Unfortunately, due to a weak connection between rGO sheets and MOs, the active
NPs still tend to aggregate during the cycling process[31, 85, 176, 204, 336, 337],
which decreases their reversible capacity by 20–50 % after 30 cycles[31, 176, 337]. As
a result, the preparation of rGO based composites having both high electrical
conductivity and good electrochemical performance is still a great challenge today.
Herein we report the lithium storage capability of OrGO based nanocomposite as well
as traditionally prepared TrGO. The cycle performance and capability of OrGO
indicate that oxygen annealing not only recovers the electrical conductivity of GO but
also improves the energy storage capability by fabrication of Al2O3 attached hybrid
materials. In this research, higher lithium ion storage capacity was proved to be
possible by controlling layered structures of TrGO paper.

161
7.2 Results and discussion
7.2.1 Charge and discharge performance of OrGO electrodes
Figure 7.1 shows the first four charge and discharge profiles of TrGO versus Li+/Li
at a current density of 10 mA g−1 between 3.0 and 0.01 V . The first discharge process
of TrGO differs from the second in showing a capacity of around 0.6 V, indicating a
solid electrolyte interface (SEI) layer formed on the TrGO electrode surface and the
reaction of Li+ ions with the attached oxygen functionalities [334, 335, 338] . The first
charge and discharge capacities of TrGO electrode were measured at 952 and 1137
mAh g−1, respectively, which are higher than that of graphite and graphene sheet
electrodes [170, 322, 327]. The high reversible capacity of TrGO can be probably
attributed to its large surface area and stacked sheets providing numerous active sites
including edges and nanopores anchoring Li+ ions [339]. Furthermore, as a highly
disordered carbon material, TrGO electrodes exhibit a broad electrochemical window
(0.01–3.0 V) which allows higher Li+ ion capacity values than that of graphite
[340-343] and greater hysteresis between charge and discharge voltage. The specific
capacity of the TrGO electrode has been reduced to 867 mAh g−1 in the fourth cycle,
indicating a stable cyclic performance due to an SEI layer formed in the first cycle.

162
Figure 7.1 First four charge and discharge profiles of TrGO electrode at the current density of 10 mA g−1.
The reversible insertion and extraction of Li+ ions in the OrGO electrode through the
surface was measured to compare the electrochemical performance of rGO paper with
and without Al2O3 NPs. Figure 7.2 shows the first four charge and discharge profiles
of OrGO versus Li+/Li at a current density of 10 mA g−1 between 3.0 and 0.01 V.
Unlike the behaviour of graphene-based anode materials or TrGO , the voltage plateau
of the first discharge curve around 0.6-0.9 V is not observed [170, 328, 344], indicating
that the formation of Al2O3 NPs probably suppresses the SEI layer [345]. However,
the potential of the four discharge curves decreases dramatically and then forms a
plateau around 1.2–1.3 V, which can be attributed to the Li+ ions reacting with the
Al2O3 NPs. The first charge and discharge capacities of OrGO electrodes were
measured at 1328 and 1364 mAh g−1, respectively, which are higher than that of TrGO.
The higher reversible and stable capacity of OrGO can be probably attributed to the

163
ion conductive Al2O3 NPs facilitating Li+ ion diffusion. Furthermore, the lower degree
of hysteresis between charge and discharge voltage of OrGO electrodes represents
higher electrical conductivity and a less disordered structure than that of TrGO
electrodes [345].
Figure 7.2 First four charge and discharge profiles of OrGO electrode at the current density of 10 mA g−1.
The cyclic voltammograms (CV) of OrGO sheets are shown in Figure 7.3. The results
of the CV curves match well with the charge and discharge profiles of OrGO
electrodes, exhibiting the reversible insertion and extraction of Li+ ions. Compared to
Li+/Li, the insertion process begins at a very low potential around 0 V, while the
extraction process begins in the range of 0.2–0.3 V. Comparing these four cycles, the
reduction current of the first cycle is close to the subsequent cycles without an obvious

164
irreversible cathodic peak, which can be attributed to the formation of Al2O3 NPs
probably suppressing the SEI layer and the Li+ ions reacting with the Al2O3 NPs.
Figure 7.3 Cyclic voltammograms (CV) of OrGO paper.
The rate capability results shown in Figure 7.4 and Figure 7.5 indicate that OrGO
paper is an excellent electrode material for LIBs. The reversible specific capacity of
OrGO electrode measured at the current density of 10, 20, 40 and 80 mA g−1 are 1319,
939, 789 and 762 mAh g−1, respectively, while the reversible specific capacity of
TrGO electrodes are 952, 761, 559 and 448 mAh g−1, respectively. Furthermore, the
OrGO electrodes still had a higher reversible specific capacity of 909 mAh g−1 than
that of the TrGO electrodes even for the last 5 cycles with a current density back to 10
mA g−1. The reversible capacity of OrGO electrodes is also dramatically higher than
that of formerly reported graphene sheets [337, 346]. As discussed above, the better

165
rate capability performance of OrGO electrodes can be attributed to their large surface
area and less disordered structure as well as the formation of ion conductive Al2O3
NPs which probably suppresses the SEI layer. This in turn facilitates Li+ ion diffusion,
shortens the electronic and ionic transport distance and improves the charge and
discharge performance at high current density.
Figure 7.4 Rate capability and cycling performance of OrGO and TrGO electrodes at current densities
from 10 to 80 mA g−1.
Figure 7.5 Galvanostatic charge and discharge profiles of OrGO at the different current density from 10 to
80 mA g-1.

166
7.2.2 Cycling performance of OrGO electrode
The cycling performance of OrGO and TrGO electrodes was then investigated. Figure
7.6 shows the cycling performance of these electrodes and their coulombic efficiency
(CE) at a current density of 80 mA g−1 for 30 cycles. The cycling performance results
of OrGO electrodes exhibit a specific capacity of 797 mAh g−1 after 30 cycles, which
is higher than that of TrGO electrodes as well as the formerly reported graphene sheets
[166, 346]. Although the TrGO electrodes also had a stable cycling performance with
a specific capacity maintained at 766 mAh g−1 after 30 cycles, its CE was slightly
lower than that of OrGO electrodes. The average CE of OrGO electrodes for 30 cycles
was 99.608%, indicating a superior reversibility of the Li+ ion insertion/extraction
process. The higher CE probably can be attributed to the surface modification by
Al2O3 NPs and electrolyte.
Figure 7.6 Cycling performance and CE of OrGO and TrGO electrodes at a current density of 80 mA g−1 for
30 cycles.
The high stability of the charge and discharge cycles can be attributed to the ultrathin
nature of OrGO and TrGO sheets. Wu et al. reported that double-walled silicon

167
nanotubes (DWSiNTs) have lower cycling stability owing to the elimination of the
constraining effect caused by the thicker tube side walls [347]. Moreover, the ultrathin
DWSiNTs as well as being thin and stable SEI also allow an excellent high power rate
capability due to the Li+ ions being rapidly inserted into/extracted from the electrode
surface through the thin SEI layer.
7.3 Summary
The electrochemical performance of OrGO and TrGO papers fabricated as electrode
materials for LIBs was investigated in this chapter.
(i) Charge and discharge performance.
OrGO electrodes exhibit a high specific charge and discharge capacity at 1328 and
1364 mAh g−1, which are higher values than that of TrGO electrodes at 952 and
1137 mAh g−1, respectively. While an SEI layer was formed on TrGO electrodes at
a potential around 0.6 V, the discharge curves for four cycles of OrGO electrodes
show a potential plateau around 1.2–1.3 V, which can be attributed to the
formation of Al2O3 NPs that probably suppress the SEI layer and the Li+ ions
reacting with the Al2O3 NPs. Furthermore, the higher electrical conductivity and
less disordered structure of OrGO electrodes make the hysteresis voltage between
charge and discharge curves lower than that of TrGO electrodes.
(ii) Cyclic voltammograms
The investigation of CV performance for OrGO electrodes vs. Li+/Li reveal that
the insertion of Li+ ions begins at a very low potential of around 0 V while the

168
extraction process begins in the range of 0.2–0.3 V. The closed CV curves without
an obvious irreversible cathodic peak indicate that the formation of an SEI layer
on the electrode surface is suppressed by Al2O3 NPs.
(iii) Rate capability
OrGO electrode has an excellent rate capability at a current density of 10, 20, 40,
80 and mA g−1. The reversible capacities of OrGO electrodes (1319, 939, 789 and
762 mAh g−1 at 10, 20, 40 and 80 mA g−1, respectively) are dramatically higher
than that of TrGO electrodes as well as the formerly reported graphene sheets,
This can be attributed to the ion conductive Al2O3 NPs facilitating Li+ ion
diffusion.
(iv) Cycling performance
OrGO and TrGO electrodes were then measured for cycling performance and
relative CE at a current density of 80 mA g−1 for 30 cycles. OrGO electrodes
exhibited the high and stable specific capacities of around 800 mA h g−1 for 30
cycles. Moreover, the average CE of OrGO electrodes at 99.608% for 30 cycles I
was higher than that of TrGO electrodes, indicating a superior reversibility of the
Li+ ion insertion/extraction process. Similar research on DWSiNTs illustrates that
the high stability of the charge and discharge cycles is probably related to the
ultrathin nature of OrGO and TrGO sheets.

169
In conclusion, the ion conductive Al2O3 NPs formed on OrGO plane improve the
charge and discharge performance, rate capability and cycling performance of OrGO
electrodes in LIBs.

170
Chapter 8 Conclusion
This thesis describes an innovative oxygen annealing method for the fabrication of
Al2O3 NP/rGO composites and investigates the mechanism of Al2O3 NPs’ distribution
and aggregation on the GO plane. The electrical conductivity and wettability of OrGO
paper have also been investigated, which is very pertinent to the fabrication of OrGO
electrodes in LIBs.
The literature review provides a guide to current research into the properties, synthesis
and functionalization of GO and rGO. The research on the structure of GO and rGO
reveals that they exhibit a unique two-dimensional structure with attached oxygen
functional groups which can be removed to improve electrical conductivity,
electrochemical performance, chemical activity and wettability. Investigations into the
properties of GO and rGO enable us to understand the structural difference between
GO and rGO sheets, which is useful in understanding the formation and removal of
oxygen functional groups attached on the GO plane. Furthermore, the recent progress
in the functionalization of rGO sheets such as MO NP/rGO composites for energy
storage applications is also reviewed, focusing on the chemical oxidation, thermal
reduction and MO NPs functionalization. However, there is a long way to go before
the fabrication of rGO sheets can meet the requirements of industrial applications. In
furtherance of this goal, we present our research work on an innovative OrGO material
with excellent electronic properties for energy storage application.

171
Firstly, the innovative exfoliation process using high speed centrifugation and probe
ultrasonication to reduce the number of GO layers has successfully produced
monolayer GO sheets, which provides the opportunity to determine the structure and
distribution of Al2O3 NPs on individual single layers of the OrGO plane.
Secondly, a better understanding has been achieved by imaging GO, TrGO and OrGO
samples with a variety of characterization methods such as optical microscopy, SEM,
TEM, HRTEM and AFM. The monolayer structure of GO produced by the innovative
exfoliation process has been confirmed. The “grey” flakes of the individual TrGO
samples show a single-layer structure in SEM images while the darker areas indicate
multi-layer features. The SAED pattern of TEM images shows the very obvious 12
diffraction spots with equivalent relative intensities between the inner and outer
hexagons indicating the single-layer structure. In HRTEM images, the uniform single
dark line at the edges of unfolded monolayers of OrGO further confirms the
single-layer structure. Moreover, the height profile of AFM images provides evidence
of the single-layer structure of OrGO sheets. The structure and formation of wrinkles
in GO, TrGO and OrGO planes has also been analyzed. The wrinkles were introduced
due to the thermal expansion coefficient difference between substrate and graphene
sheets during the annealing process. Unlike the uniform thickness of wrinkles at the
edges of folded bilayer structures, the wrinkles in a monolayer rGO sample vary in
width. Additionally, the monolayer, bilayer and overlapped multi-layer structure have
been investigated in detail to establish a simple system for distinguishing single-layer

172
sheets. Moreover, the distribution and structure of Al2O3 NPs synthesized in OrGO
have been characterized with HRTEM and AFM. The diameter of NPs is less than 10
nm with a typical high interparticle distance of between 60-80 nm, which is confirmed
by HRTEM. The NPs are located at the edges of holes produced during the annealing
process. Furthermore, from height profiles of AFM images we have determined that
the height of NPs is less than 2 nm. Morphology analysis has established a
fundamental understanding of the monolayer structure of GO, TrGO and OrGO
samples which are the basic units in GO paper. Our innovative method for producing a
single-layer GO dispersion allows a better formation process of GO paper.
Thirdly, we have improved the traditional thermal annealing method by introducing
oxygen gas flow in the thermal reduction process to fabricate OrGO sheets, enabling
the removal of oxygen functional groups and recovery of defective regions. With this
method, colloidal suspensions consisting of individual GO sheets can yield Al2O3 NPs
decorated rGO paper by vacuum filtration through an Anodisc membrane filter. Upon
the introduction of Al3+ as seeds anchoring on the GO plane by a vacuum filtration
through an alumina Anodisc membrane filter, the Al2O3 molecules aggregated to form
NPs and grew on the edges of holes or vacancies during thermal annealing. XPS
spectra confirm the reduction efficiency of TrGO and OrGO as well as the element
states of aluminium in GO or rGO planes. The Raman and FTIR results reveal
dangling bonds or oxygen functional groups of GO binding to the Al3+ promoting
aluminium oxide aggregates and growth which leads to further reduction.

173
Fourthly, as regards electronic properties, OrGO has a higher electrical conductivity at
7250 S m−1 with a narrower range of electrical conductivity mostly between 6500 and
7250 S m−1, which can be attributed to a more uniform structure and a better reduction
level caused by oxygen annealing. The formation of Al2O3 NPs on the rGO plane can
form a well-ordered stacked structure of OrGO paper due to the NPs enlarging the
intersheet space which facilitates the emission of evolved gas molecules during heat
treatment. A short-duration annealing procedure was designed to elucidate the
reduction mechanism of oxygen annealing. Similar to previous electrical conductivity
results for TrGO and OrGO, short-duration annealed OrGO still had a higher electrical
conductivity at 5170 Sm−1, which is close to that of TrGO papers prepared by
traditional thermal annealing. Analysis of the annealing mechanism indicated that the
increase of the sp2/sp3 carbon ratio caused by the formation of Al2O3 NPs at the edges
of defective regions in the OrGO plane allows its excellent electrical conductivity.
Therefore, oxygen annealing has two functions: heat treatment for traditional thermal
reduction and chemical reaction between Al(OH)3 and functional groups to remove
more functionalities resulting in an increase of the sp2/sp3 ratio.
Fifthly, wettability measurements revealed that appropriate thermal and oxygen
annealing methods can be used to fabricate rGO with a tunable wettability. This
allows rGO based materials great potential in practical applications. The contact angle
of GO paper was measured at 43.8°, indicating a hydrophilic property. After thermal
reduction, the resultant TrGO paper had a hydrophobic property with a contact angle

174
of 88.3° due to the elimination of oxygen functional groups during the heat treatment.
However, OrGO paper had a different surface wettability from TrGO due to its unique
Al2O3 NP/rGO structure. The contact angle of OrGO sheets was measured at around
71.5°, much less than 90°, indicating a good hydrophilic property. Analysis of the
production mechanism revealed that hydrophilic Al2O3 NP decorated on rGO plane
improve the hydrophilic property of rGO paper while its electronic properties change
from insulating to conducting.
Lastly, the electrochemical performance of OrGO and TrGO papers fabricated as
electrode materials for LIBs was investigated. In the charge and discharge phases,
OrGO electrodes exhibited a high specific charge and discharge capacity at 1328 and
1364 mAh g−1, which were higher than that of TrGO electrodes at 952 and 1137 mAh
g−1, respectively. Whereas for TrGO electrodes an SEI layer formed at a potential
around 0.6 V, the discharge curves for four cycles using OrGO electrodes show a
potential plateau around 1.2–1.3 V, which can be attributed to the formation of Al2O3
NPs which probably suppressed the SEI layer and the Li+ ions reacting with the Al2O3
NPs. Furthermore, the higher electrical conductivity and less disordered structure of
OrGO electrodes make its hysteresis voltage between charge and discharge curves
lower than that of TrGO electrodes. Also, according to cyclic voltammograms,
investigation of CV performance of OrGO electrodes revealed that the insertion of Li+
ions begins at a very low potential around 0 V vs. Li+/Li while the extraction process
begins in the range of 0.2–0.3 V. The closed CV curves are without an obvious

175
irreversible cathodic peak indicating that the formation of the SEI layer on the
electrode surface is suppressed by Al2O3 NPs. Regarding rate capability, OrGO
electrodes had an excellent rate capability at a current density of 10, 20, 40, 80 and
mA g−1. The reversible capacities of OrGO electrodes (1319, 939, 789 and 762 mAh
g−1 at 10, 20, 40 and 80 mA g−1, respectively) were dramatically higher than that of
TrGO electrodes as well as formerly reported graphene sheets. This can be attributed
to the ion conductive Al2O3 NPs facilitating Li+ ion diffusion. OrGO and TrGO
electrodes were then measured for cycling performance and relative CE at a current
density of 80 mA g−1 for 30 cycles. OrGO electrode exhibited high and stable specific
capacities at around 800 mAh g−1 for 30 cycles. Moreover, the average CE of OrGO
electrodes at 99.608% for 30 cycles was higher than that of TrGO electrodes,
indicating a superior reversibility of the Li+ ion insertion/extraction process. The high
stability of the charge and discharge cycles is probably related to the ultrathin nature
of OrGO and TrGO sheets. As a result, the ion conductive Al2O3 NPs formed on
OrGO planes improves the charge and discharge performance, rate capability and
cycling performance of OrGO electrodes in LIBs.

176
Chapter 9 Future work
The reduction of GO for mass production and application has been discussed in the
thesis. However, complete reduction is still difficult to achieve due to the limited
understanding of the chemistry and structure of GO and rGO. Therefore, future
research on the preparation of rGO should focus on the further investigation of the
reduction mechanism and controllable functionalization of rGO for specific
applications. A well-designed reduction method is needed to remove most of the
oxygen functional groups and recover the defective regions. For the functionalization
of rGO, other specific filter membranes can be used for rGO based nanocomposites.
The excellent electrochemical performance of OrGO has been frequently noted but,
more work in the future is required for a better understanding of OrGO electrodes for
full application in LIBs. Therefore, the next step is to find a cathode material to
fabricate full LIBs. Energy storage is in high demand and amongst the possible
options, Li-ion batteries have been the dominating energy storage device for
light-weight applications in terms of energy density but lacks power density and cycle
life. The future project is to investigate and develop improved materials to address the
above limitations of Li-ion batteries. LiFePO4 is a promising positive electrode owing
to its safe and low cost raw materials and high energy density. Various annealing
temperatures have been examined with LiFePO4 prepared using a classical sol-gel wet
chemical method. The development of a safer electrolyte using a polymer based on

177
polyvinylidene fluoride co-polymer is also being investigated as a replacement for
current liquid electrolyte.
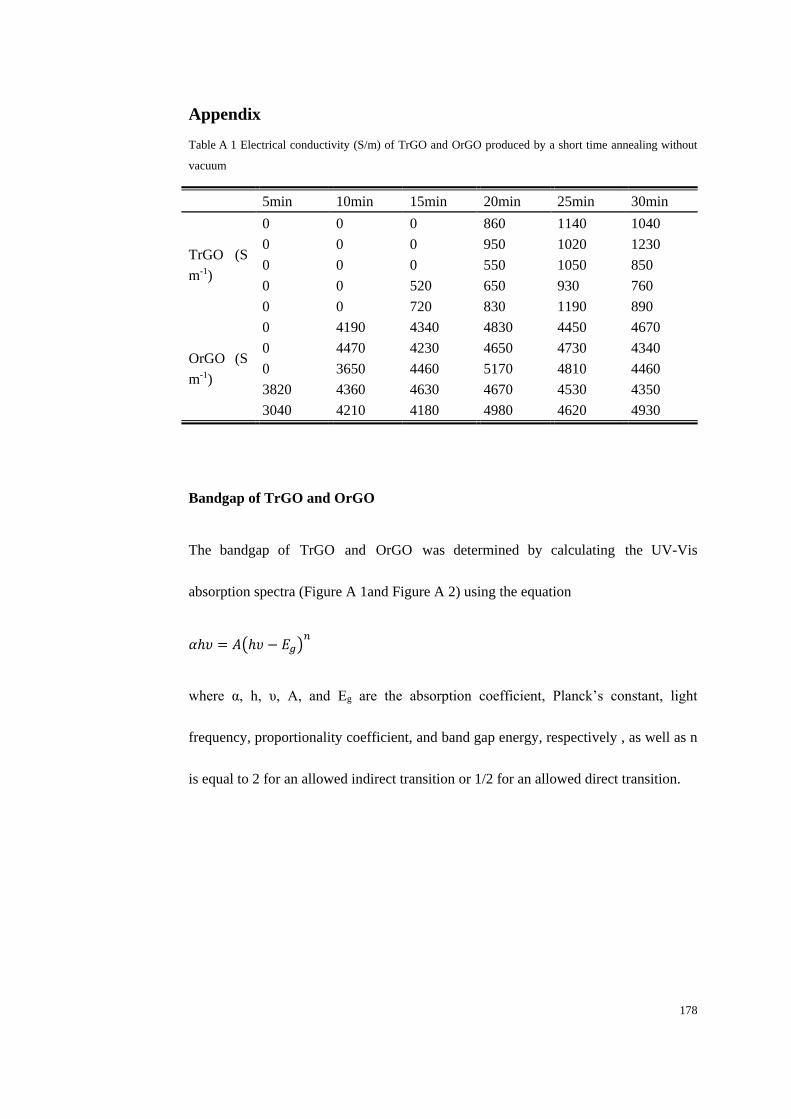
178
Appendix
Table A 1 Electrical conductivity (S/m) of TrGO and OrGO produced by a short time annealing without
vacuum
5min 10min 15min 20min 25min 30min
TrGO (S
m-1)
0 0 0 860 1140 1040
0 0 0 950 1020 1230
0 0 0 550 1050 850
0 0 520 650 930 760
0 0 720 830 1190 890
OrGO (S
m-1)
0 4190 4340 4830 4450 4670
0 4470 4230 4650 4730 4340
0 3650 4460 5170 4810 4460
3820 4360 4630 4670 4530 4350
3040 4210 4180 4980 4620 4930
Bandgap of TrGO and OrGO
The bandgap of TrGO and OrGO was determined by calculating the UV-Vis
absorption spectra (Figure A 1and Figure A 2) using the equation
𝛼ℎ𝜐 = 𝐴(ℎ𝜐 − 𝐸𝑔)𝑛
where α, h, υ, A, and Eg are the absorption coefficient, Planck’s constant, light
frequency, proportionality coefficient, and band gap energy, respectively , as well as n
is equal to 2 for an allowed indirect transition or 1/2 for an allowed direct transition.

179
Figure A 1 UV–Vis absorption spectra of TrGO. Inset, the plots of (αhν)1/2 versus hν show the indirect band
gap of 1.91 eV (TrGO).
Figure A 2 UV–Vis absorption spectra of OrGO (b). Inset, the plots of (αhν)1/2 versus hν show the indirect
band gap of 1.68 eV (OrGO),respectively.
UV–Vis results indicate that the TrGO has a bigger indirect band gap of 1.91 eV (Figure
A 1) which is 0.23 eV higher than that of OrGO (1.68 eV, Figure A 2). These results
suggest that the heat treatment can open the bandgap of GO. Moreover, the growth of
Al2O3 NPs on rGO plane by oxygen annealing leads to a reduced bandgap of OrGO,
which can be attributed to the increased sp2 carbon networks in OrGO plane[280].
Joung et al. shows a bandgap variation of rGO, which is prepared by ammonia and

180
hydrazine hydrate reduction, from 1.43 eV to 0.21 eV with sp2 fraction increased from
55 to 80%.
PL of TrGO and OrGO
Figure A 3 Photoluminescence emission spectrum of the luminescent rGO (excitation at 400 nm) exhibiting
hypersensitive red emission at 599 nm (TrGO) and 603 nm (OrGO).
Another interesting finding is the PL behavior of OrGO. Figure A 3 shows that OrGO
sample excited with 400 nm xenon light has a broad and strong PL peak centered at 603
nm and TrGO sample exhibits a weak emission at 599 nm. This slight redshift of the PL
peak position probably due to the variations of oxidation density [348]. The PL
intensity of OrGO is dramatically higher than that of TrGO, indicating the oxygen
annealing facilitating the emission process comparing to the traditional thermal
annealing [78, 349].
XRD spectra of TrGO and OrGO

181
Figure A 4 XRD pattern of GO, TrGO and OrGO papers. The characterization was carried out in a Siemens
D500 powder X-ray diffractometer at 40 k eV and 25 mA with Cu Kα line as the excitation source radiation
(λ=1.5406 Å).
The distinct peaks at 13.0° in the XRD spectra of the GO papers corresponding to the
layer-to-layer distance (d-spacing) of approximately 3.4 Å that is equal to the interlayer
separation in graphite. The numbers of perpendicularly stacked GO and reduced GO
sheets in the paper material were calculated by using the classical Debye−Scherrer
equation
𝜏 =Kλ
β cos 𝜃
𝑛 =𝜏
𝑑
where K is the shape factor, λ is the x-ray wavelength, β is the full width at half
maximum (FWHM), θ is the Bragg angle, τ is the thickness, and d is the interlayer

182
spacing. The thickness was found to be 6.8 Å which corresponds to 2 stacked graphene
oxide sheets.

183
References
1. Novoselov, K.S., et al., Electric field effect in atomically thin carbon films. Science,
2004. 306(5296): p. 666-669.
2. Lee, C., et al., Measurement of the elastic properties and intrinsic strength of
monolayer graphene. Science, 2008. 321(5887): p. 385-388.
3. Chen, J.H., et al., Intrinsic and extrinsic performance limits of graphene devices on
SiO2. Nature Nanotechnology, 2008. 3(4): p. 206-209.
4. Kuzmenko, A.B., et al., Universal optical conductance of graphite. Physical Review
Letters, 2008. 100(11): p. -.
5. Zheng, Y., et al., Gate-controlled nonvolatile graphene-ferroelectric memory. Applied
Physics Letters, 2009. 94(16).
6. Ghosh, S., et al., Dimensional crossover of thermal transport in few-layer graphene.
Nature Materials, 2010. 9: p. 4.
7. Graphene: The Next Wonder Material? ; Available from:
http://www.acs.org/content/acs/en/education/resources/highschool/chemmatters/past-i
ssues/archive-2012-2013/graphene.html.
8. Sutter, P., EPITAXIAL GRAPHENE How silicon leaves the scene. Nature Materials,
2009. 8(3): p. 171-172.
9. Li, X.S., et al., Large-Area Synthesis of High-Quality and Uniform Graphene Films on
Copper Foils. Science, 2009. 324(5932): p. 1312-1314.
10. Li, D., et al., Processable aqueous dispersions of graphene nanosheets. Nature
Nanotechnology, 2008. 3(2): p. 101-105.
11. Stankovich, S., et al., Synthesis of graphene-based nanosheets via chemical reduction
of exfoliated graphite oxide. Carbon, 2007. 45(7): p. 1558-1565.
12. Eda, G. and M. Chhowalla, Chemically Derived Graphene Oxide: Towards Large-Area
Thin-Film Electronics and Optoelectronics. Advanced Materials, 2010. 22(22): p.
2392-2415.
13. Schniepp, H.C., et al., Functionalized single graphene sheets derived from splitting
graphite oxide. Journal of Physical Chemistry B, 2006. 110(17): p. 8535-8539.
14. Stankovich, S., et al., Stable aqueous dispersions of graphitic nanoplatelets via the
reduction of exfoliated graphite oxide in the presence of poly(sodium
4-styrenesulfonate). Journal of Materials Chemistry, 2006. 16(2): p. 155-158.
15. Yang, D., et al., Chemical analysis of graphene oxide films after heat and chemical
treatments by X-ray photoelectron and Micro-Raman spectroscopy. Carbon, 2009.
47(1): p. 145-152.
16. Jung, I., et al., Effect of Water Vapor on Electrical Properties of Individual Reduced
Graphene Oxide Sheets. Journal of Physical Chemistry C, 2008. 112(51): p.
20264-20268.
17. Periasamy, M. and P. Thirumalaikumar, Methods of enhancement of reactivity and
selectivity of sodium borohydride for applications in organic synthesis. Journal of
Organometallic Chemistry, 2000. 609(1-2): p. 137-151.
18. Wu, Z.S., et al., Synthesis of high-quality graphene with a pre-determined number of
layers. Carbon, 2009. 47(2): p. 493-499.

184
19. McAllister, M.J., et al., Single sheet functionalized graphene by oxidation and thermal
expansion of graphite. Chemistry of Materials, 2007. 19(18): p. 4396-4404.
20. Li, X.L., et al., Highly conducting graphene sheets and Langmuir-Blodgett films.
Nature Nanotechnology, 2008. 3(9): p. 538-542.
21. Lu, G.H., L.E. Ocola, and J.H. Chen, Gas detection using low-temperature reduced
graphene oxide sheets. Applied Physics Letters, 2009. 94(8).
22. Zhou, X.Z., et al., In Situ Synthesis of Metal Nanoparticles on Single-Layer Graphene
Oxide and Reduced Graphene Oxide Surfaces. Journal of Physical Chemistry C, 2009.
113(25): p. 10842-10846.
23. Li, Y.J., et al., Catalytic performance of Pt nanoparticles on reduced graphene oxide
for methanol electro-oxidation. Carbon, 2010. 48(4): p. 1124-1130.
24. Williams, G., B. Seger, and P.V. Kamat, TiO2-graphene nanocomposites. UV-assisted
photocatalytic reduction of graphene oxide. Acs Nano, 2008. 2(7): p. 1487-1491.
25. Zhu, J.X., et al., Facile synthesis of metal oxide/reduced graphene oxide hybrids with
high lithium storage capacity and stable cyclability. Nanoscale, 2011. 3(3): p.
1084-1089.
26. Joung, D., et al., Anchoring Ceria Nanoparticles on Reduced Graphene Oxide and
Their Electronic Transport Properties. Journal of Physical Chemistry C, 2011. 115(50):
p. 24494-24500.
27. Ghosh, S., et al., One pot synthesis of RGO/PbS nanocomposite and its near infrared
photoresponse study. Applied Physics a-Materials Science & Processing, 2012. 107(4):
p. 995-1001.
28. Balazs, A.C., T. Emrick, and T.P. Russell, Nanoparticle polymer composites: Where
two small worlds meet. Science, 2006. 314(5802): p. 1107-1110.
29. Bashyam, R. and P. Zelenay, A class of non-precious metal composite catalysts for fuel
cells. Nature, 2006. 443(7107): p. 63-66.
30. Capadona, J.R., et al., A versatile approach for the processing of polymer
nanocomposites with self-assembled nanofibre templates. Nature Nanotechnology,
2007. 2(12): p. 765-769.
31. Paek, S.M., E. Yoo, and I. Honma, Enhanced Cyclic Performance and Lithium Storage
Capacity of SnO2/Graphene Nanoporous Electrodes with Three-Dimensionally
Delaminated Flexible Structure. Nano letters, 2009. 9(1): p. 72-75.
32. Wu, Z.S., et al., Graphene Anchored with Co(3)O(4) Nanoparticles as Anode of
Lithium Ion Batteries with Enhanced Reversible Capacity and Cyclic Performance.
ACS Nano, 2010. 4(6): p. 3187-3194.
33. Zhu, X.J., et al., Nanostructured Reduced Graphene Oxide/Fe(2)O(3) Composite As a
High-Performance Anode Material for Lithium Ion Batteries. ACS Nano, 2011. 5(4): p.
3333-3338.
34. Zhou, G.M., et al., Graphene-Wrapped Fe(3)O(4) Anode Material with Improved
Reversible Capacity and Cyclic Stability for Lithium Ion Batteries. Chemistry of
Materials, 2010. 22(18): p. 5306-5313.
35. Joung, D., et al., High yield fabrication of chemically reduced graphene oxide field
effect transistors by dielectrophoresis. Nanotechnology, 2010. 21(16).

185
36. Ghosh, S., et al., Position dependent photodetector from large area reduced graphene
oxide thin films. Applied Physics Letters, 2010. 96(16).
37. Kou, R., et al., Enhanced activity and stability of Pt catalysts on functionalized
graphene sheets for electrocatalytic oxygen reduction. Electrochemistry
Communications, 2009. 11(5): p. 954-957.
38. Williams, G. and P.V. Kamat, Graphene-Semiconductor Nanocomposites:
Excited-State Interactions between ZnO Nanoparticles and Graphene Oxide. Langmuir,
2009. 25(24): p. 13869-13873.
39. Gomez-Navarro, C., et al., Atomic Structure of Reduced Graphene Oxide. Nano Letters,
2010. 10(4): p. 1144-1148.
40. Mkhoyan, K.A., et al., Atomic and Electronic Structure of Graphene-Oxide. Nano
Letters, 2009. 9(3): p. 1058-1063.
41. Dreyer, D.R., et al., The chemistry of graphene oxide. Chemical Society Reviews, 2010.
39(1): p. 228-240.
42. Park, S. and R.S. Ruoff, Chemical methods for the production of graphenes. Nature
Nanotechnology, 2009. 4(4): p. 217-224.
43. Mattevi, C., et al., Evolution of Electrical, Chemical, and Structural Properties of
Transparent and Conducting Chemically Derived Graphene Thin Films. Advanced
Functional Materials, 2009. 19(16): p. 2577-2583.
44. Erickson, K., et al., Determination of the Local Chemical Structure of Graphene Oxide
and Reduced Graphene Oxide. Advanced Materials, 2010. 22(40): p. 4467-4472.
45. Kudin, K.N., et al., Raman spectra of graphite oxide and functionalized graphene
sheets. Nano Letters, 2008. 8(1): p. 36-41.
46. Hass, J., W.A. de Heer, and E.H. Conrad, The growth and morphology of epitaxial
multilayer graphene. Journal of Physics-Condensed Matter, 2008. 20(32).
47. Wang, X., L.J. Zhi, and K. Mullen, Transparent, conductive graphene electrodes for
dye-sensitized solar cells. Nano letters, 2008. 8(1): p. 323-327.
48. Seger, B. and P.V. Kamat, Electrocatalytically Active Graphene-Platinum
Nanocomposites. Role of 2-D Carbon Support in PEM Fuel Cells. Journal of Physical
Chemistry C, 2009. 113(19): p. 7990-7995.
49. Lu, T., et al., Electrochemical behaviors of graphene-ZnO and graphene-SnO2
composite films for supercapacitors. Electrochimica Acta, 2010. 55(13): p. 4170-4173.
50. Yu, A.P., et al., Ultrathin, transparent, and flexible graphene films for supercapacitor
application. Applied Physics Letters, 2010. 96(25).
51. Guo, P., H.H. Song, and X.H. Chen, Electrochemical performance of graphene
nanosheets as anode material for lithium-ion batteries. Electrochemistry
Communications, 2009. 11(6): p. 1320-1324.
52. Kim, H., et al., SnO2/Graphene Composite with High Lithium Storage Capability for
Lithium Rechargeable Batteries. Nano Research, 2010. 3(11): p. 813-821.
53. Kim, H., et al., Highly reversible Co3O4/graphene hybrid anode for lithium
rechargeable batteries. Carbon, 2011. 49(1): p. 326-332.
54. Lian, P.C., et al., Large reversible capacity of high quality graphene sheets as an anode
material for lithium-ion batteries. Electrochimica Acta, 2010. 55(12): p. 3909-3914.

186
55. Magasinski, A., et al., High-performance lithium-ion anodes using a hierarchical
bottom-up approach. Nature Materials, 2010. 9(4): p. 353-358.
56. Pan, D.Y., et al., Li Storage Properties of Disordered Graphene Nanosheets. Chemistry
of Materials, 2009. 21(14): p. 3136-3142.
57. Park, C.M., et al., Li-alloy based anode materials for Li secondary batteries. Chemical
Society Reviews, 2010. 39(8): p. 3115-3141.
58. Han, M.Y., et al., Energy band-gap engineering of graphene nanoribbons. Physical
Review Letters, 2007. 98(20): p. -.
59. Lui, C.H., et al., Ultraflat graphene. Nature, 2009. 462(7271): p. 339-341.
60. Elias, D.C., et al., Control of Graphene's Properties by Reversible Hydrogenation:
Evidence for Graphane. Science, 2009. 323(5914): p. 610-613.
61. Szabo, T., et al., Evolution of surface functional groups in a series of progressively
oxidized graphite oxides. Chemistry of Materials, 2006. 18(11): p. 2740-2749.
62. Lerf, A., et al., Structure of graphite oxide revisited. Journal of Physical Chemistry B,
1998. 102(23): p. 4477-4482.
63. He, H.Y., et al., A new structural model for graphite oxide. Chemical Physics Letters,
1998. 287(1-2): p. 53-56.
64. Cai, W.W., et al., Synthesis and solid-state NMR structural characterization of
(13)C-labeled graphite oxide. Science, 2008. 321(5897): p. 1815-1817.
65. Gao, W., et al., New insights into the structure and reduction of graphite oxide. Nature
Chemistry, 2009. 1(5): p. 403-408.
66. Paredes, J.I., et al., Atomic Force and Scanning Tunneling Microscopy Imaging of
Graphene Nanosheets Derived from Graphite Oxide. Langmuir, 2009. 25(10): p.
5957-5968.
67. Gomez-Navarro, C., et al., Electronic transport properties of individual chemically
reduced graphene oxide sheets. Nano letters, 2007. 7(11): p. 3499-3503.
68. Pacile, D., et al., Electronic properties and atomic structure of graphene oxide
membranes. Carbon, 2011. 49(3): p. 966-972.
69. Mao, S., H.H. Pu, and J.H. Chen, Graphene oxide and its reduction: modeling and
experimental progress. Rsc Advances, 2012. 2(7): p. 2643-2662.
70. Nakajima, T., A. Mabuchi, and R. Hagiwara, A New Structure Model of Graphite Oxide.
Carbon, 1988. 26(3): p. 357-361.
71. Geim, A.K. and K.S. Novoselov, The rise of graphene. Nature Materials, 2007. 6(3): p.
183-191.
72. Schedin, F., et al., Detection of individual gas molecules adsorbed on graphene. Nature
Materials, 2007. 6(9): p. 652-655.
73. Geim, A.K., Graphene: Status and Prospects. Science, 2009. 324(5934): p. 5.
74. Pisana, S., et al., Breakdown of the adiabatic Born-Oppenheimer approximation in
graphene. Nature Materials, 2007. 6(3): p. 198-201.
75. Rao, C.N.R., et al., Graphene: The New Two-Dimensional Nanomaterial. Angewandte
Chemie-International Edition, 2009. 48(42): p. 7752-7777.
76. Jung, I., et al., Tunable Electrical Conductivity of Individual Graphene Oxide Sheets
Reduced at "Low" Temperatures. Nano Letters, 2008. 8(12): p. 4283-4287.

187
77. Becerril, H.A., et al., Evaluation of solution-processed reduced graphene oxide films as
transparent conductors. ACS Nano, 2008. 2(3): p. 463-470.
78. Eda, G., et al., Blue Photoluminescence from Chemically Derived Graphene Oxide.
Advanced Materials, 2010. 22(4): p. 505-+.
79. Wei, Z.Q., et al., Nanoscale Tunable Reduction of Graphene Oxide for Graphene
Electronics. Science, 2010. 328(5984): p. 1373-1376.
80. Luo, D.C., et al., Evaluation Criteria for Reduced Graphene Oxide. Journal of Physical
Chemistry C, 2011. 115(23): p. 11327-11335.
81. Lee, G., K.S. Kim, and K. Cho, Theoretical Study of the Electron Transport in
Graphene with Vacancy and Residual Oxygen Defects after High-Temperature
Reduction. Journal of Physical Chemistry C, 2011. 115(19): p. 9719-9725.
82. Eda, G., et al., Insulator to Semimetal Transition in Graphene Oxide. Journal of
Physical Chemistry C, 2009. 113(35): p. 15768-15771.
83. Lomeda, J.R., et al., Diazonium Functionalization of Surfactant-Wrapped Chemically
Converted Graphene Sheets. Journal of the American Chemical Society, 2008. 130(48):
p. 16201-16206.
84. Liu, H., et al., Processing of Graphene for Electrochemical Application: Noncovalently
Functionalize Graphene Sheets with Water-Soluble Electroactive Methylene Green.
Langmuir, 2009. 25(20): p. 12006-12010.
85. Meryl D. Stoller, S.P., Yanwu Zhu, Jinho An and Rodney S. Ruoff, Graphene-Based
Ultracapacitors. Nano letters, 2008. 8(10): p. 5.
86. Pham, V.H., et al., Fast and simple fabrication of a large transparent
chemically-converted graphene film by spray-coating. Carbon, 2010. 48(7): p.
1945-1951.
87. Robinson, J.T., et al., Reduced Graphene Oxide Molecular Sensors. Nano letters, 2008.
8(10): p. 3137-3140.
88. Tung, V.C., et al., High-throughput solution processing of large-scale graphene.
Nature Nanotechnology, 2009. 4(1): p. 25-29.
89. Park, S., et al., Aqueous Suspension and Characterization of Chemically Modified
Graphene Sheets. Chemistry of Materials, 2008. 20(21): p. 6592-6594.
90. Wang, Y., Y. Wan, and D. Zhang, Reduced graphene sheets modified glassy carbon
electrode for electrocatalytic oxidation of hydrazine in alkaline media.
Electrochemistry Communications, 2010. 12(2): p. 187-190.
91. Shao, Y.Y., et al., Facile and controllable electrochemical reduction of graphene oxide
and its applications. Journal of Materials Chemistry, 2010. 20(4): p. 743-748.
92. Wang, Z.J., et al., Direct Electrochemical Reduction of Single-Layer Graphene Oxide
and Subsequent Functionalization with Glucose Oxidase. Journal of Physical
Chemistry C, 2009. 113(32): p. 14071-14075.
93. An, S.J., et al., Thin Film Fabrication and Simultaneous Anodic Reduction of Deposited
Graphene Oxide Platelets by Electrophoretic Deposition. Journal of Physical
Chemistry Letters, 2010. 1(8): p. 1259-1263.
94. Ramesha, G.K. and S. Sampath, Electrochemical Reduction of Oriented Graphene
Oxide Films: An in Situ Raman Spectroelectrochemical Study. Journal of Physical
Chemistry C, 2009. 113(19): p. 7985-7989.

188
95. Microscopy, A.F., Atomic Force Microscopy. 2005.
96. Wang, D.W., et al., Electrochemical interfacial capacitance in multilayer graphene
sheets: Dependence on number of stacking layers. Electrochemistry Communications,
2009. 11(9): p. 1729-1732.
97. Ferraro, J.R. and K. Nakamoto, Introductory Raman Spectroscopy. 1994: Access
Online via Elsevier.
98. Zhou, M., et al., Controlled Synthesis of Large-Area and Patterned Electrochemically
Reduced Graphene Oxide Films. Chemistry-a European Journal, 2009. 15(25): p.
6116-6120.
99. Steinhardt, R.G. and E.J. Serfass, Surface Analysis with the X-Ray Photoelectron
Spectrometer. Analytical Chemistry, 1953. 25(5): p. 697-700.
100. Joshi, M., A. Bhattacharyya, and S.W. Ali, Characterization techniques for
nanotechnology applications in textiles. Indian Journal of Fiber and Textile Research,
2008. 33: p. 304-317.
101. Niyogi, S., et al., Solution properties of graphite and graphene. Journal of the
American Chemical Society, 2006. 128(24): p. 7720-7721.
102. Liu, Z.B., et al., Porphyrin and Fullerene Covalently Functionalized Graphene Hybrid
Materials with Large Nonlinear Optical Properties. Journal of Physical Chemistry B,
2009. 113(29): p. 9681-9686.
103. Lee, C., et al., Frictional Characteristics of Atomically Thin Sheets. Science, 2010.
328(5974): p. 76-80.
104. Kim, K.S., et al., Chemical Vapor Deposition-Grown Graphene: The Thinnest Solid
Lubricant. ACS Nano, 2011. 5(6): p. 5107-5114.
105. Chen, S.S., et al., Oxidation Resistance of Graphene-Coated Cu and Cu/Ni Alloy. ACS
Nano, 2011. 5(2): p. 1321-1327.
106. O'Hern, S.C., et al., Selective Molecular Transport through Intrinsic Defects in a Single
Layer of CVD Graphene. ACS Nano, 2012. 6(11): p. 10130-10138.
107. Lee, C.Y., et al., Coherence Resonance in a Single-Walled Carbon Nanotube Ion
Channel. Science, 2010. 329(5997): p. 1320-1324.
108. Zhu, Y.W., et al., Carbon-Based Supercapacitors Produced by Activation of Graphene.
Science, 2011. 332(6037): p. 1537-1541.
109. Holt, J.K., et al., Fast mass transport through sub-2-nanometer carbon nanotubes.
Science, 2006. 312(5776): p. 1034-1037.
110. Koenig, S.P., et al., Ultrastrong adhesion of graphene membranes. Nature
Nanotechnology, 2011. 6(9): p. 543-6.
111. Shin, Y.J., et al., Surface-energy engineering of graphene. Langmuir : the ACS journal
of surfaces and colloids, 2010. 26(6): p. 3798-802.
112. Goncalves, G., et al., Surface Modification of Graphene Nanosheets with Gold
Nanoparticles: The Role of Oxygen Moieties at Graphene Surface on Gold Nucleation
and Growth. Chemistry of Materials, 2009. 21(20): p. 4796-4802.
113. Wang, Y., et al., Application of graphene-modified electrode for selective detection of
dopamine. Electrochemistry Communications, 2009. 11(4): p. 889-892.
114. Rafiee, J., et al., Wetting transparency of graphene. Nature Materials, 2012. 11(3): p.
217-22.

189
115. Afshari, A., et al., Emission of phthalates from PVC and other materials. Indoor Air,
2004. 14(2): p. 120-128.
116. Fang, M., et al., Covalent polymer functionalization of graphene nanosheets and
mechanical properties of composites. Journal of Materials Chemistry, 2009. 19(38): p.
7098-7105.
117. Rosca, I.D., et al., Oxidation of multiwalled carbon nanotubes by nitric acid. Carbon,
2005. 43(15): p. 3124-3131.
118. Becker, L., R.J. Poreda, and T.E. Bunch, Fullerenes: An extraterrestrial carbon carrier
phase for noble gases. Proceedings of the National Academy of Sciences of the United
States of America, 2000. 97(7): p. 2979-2983.
119. Hummers, W.S. and R.E. Offeman, Preparation of Graphitic Oxide. Journal of the
American Chemical Society, 1958. 80(6): p. 1339-1339.
120. Kovtyukhova, N.I., et al., Layer-by-layer assembly of ultrathin composite films from
micron-sized graphite oxide sheets and polycations. Chemistry of Materials, 1999.
11(3): p. 771-778.
121. Marcano, D.C., et al., Improved Synthesis of Graphene Oxide. Acs Nano, 2010. 4(8): p.
4806-4814.
122. Pan, D.Y., et al., Hydrothermal Route for Cutting Graphene Sheets into
Blue-Luminescent Graphene Quantum Dots. Advanced Materials, 2010. 22(6): p.
734-+.
123. Wu, Z.S., et al., Synthesis of Graphene Sheets with High Electrical Conductivity and
Good Thermal Stability by Hydrogen Arc Discharge Exfoliation. Acs Nano, 2009. 3(2):
p. 411-417.
124. Li, X.L., et al., Simultaneous Nitrogen Doping and Reduction of Graphene Oxide.
Journal of the American Chemical Society, 2009. 131(43): p. 15939-15944.
125. Lopez, V., et al., Chemical Vapor Deposition Repair of Graphene Oxide: A Route to
Highly Conductive Graphene Monolayers. Advanced Materials, 2009. 21(46): p.
4683-+.
126. Gengler, R.Y.N., et al., Large-Yield Preparation of High-Electronic-Quatity Graphene
by a Langmuir-Schaefer Approach. Small, 2010. 6(1): p. 35-39.
127. Su, Q., et al., Composites of Graphene with Large Aromatic Molecules. Advanced
Materials, 2009. 21(31): p. 3191-+.
128. He, T.C., et al., Enhanced Optical Nonlinearity in Noncovalently Functionalized
Amphiphilic Graphene Composites. Chempluschem, 2012. 77(8): p. 688-693.
129. Dan Li, M.B.M., Scott Gilje, Richard B. Kaner & Gordon G. Wallace, Processable
aqueous dispersions of graphene nanosheets. Nature Nanotechnology, 2008. 3: p. 5.
130. Fernandez-Merino, M., et al., Vitamin C is an ideal substitute for hydrazine in the
reduction of graphene oxide suspensions. The Journal of Physical Chemistry C, 2010.
114(14): p. 6426-6432.
131. Gilje, S., et al., A chemical route to graphene for device applications. Nano letters,
2007. 7(11): p. 3394-3398.
132. Chen, H., et al., Mechanically strong, electrically conductive, and biocompatible
graphene paper. Advanced Materials, 2008. 20(18): p. 3557-+.

190
133. Zhu, Y.W., et al., Transparent self-assembled films of reduced graphene oxide platelets.
Applied Physics Letters, 2009. 95(10).
134. Kotov, N.A., I. Dekany, and J.H. Fendler, Ultrathin graphite oxide-polyelectrolyte
composites prepared by self-assembly: Transition between conductive and
non-conductive states. Advanced Materials, 1996. 8(8): p. 637-&.
135. Yin, Z.Y., et al., Electrochemical Deposition of ZnO Nanorods on Transparent
Reduced Graphene Oxide Electrodes for Hybrid Solar Cells. Small, 2010. 6(2): p.
307-312.
136. Robinson, J.T., et al., Wafer-scale Reduced Graphene Oxide Films for
Nanomechanical Devices. Nano Letters, 2008. 8(10): p. 3441-3445.
137. He, Q.Y., et al., Centimeter-Long and Large-Scale Micropatterns of Reduced
Graphene Oxide Films: Fabrication and Sensing Applications. Acs Nano, 2010. 4(6): p.
3201-3208.
138. Shin, H.J., et al., Efficient Reduction of Graphite Oxide by Sodium Borohydrilde and Its
Effect on Electrical Conductance. Advanced Functional Materials, 2009. 19(12): p.
1987-1992.
139. Pei, S., et al., Direct reduction of graphene oxide films into highly conductive and
flexible graphene films by hydrohalic acids. Carbon, 2010. 48(15): p. 4466-4474.
140. Wu, S.X., et al., Electrochemical Deposition of Semiconductor Oxides on Reduced
Graphene Oxide-Based Flexible, Transparent, and Conductive Electrodes. Journal of
Physical Chemistry C, 2010. 114(27): p. 11816-11821.
141. Wang, D., et al., Ternary Self-Assembly of Ordered Metal Oxide−Graphene
Nanocomposites for Electrochemical Energy Storage. ACS Nano, 2010. 4(3): p.
1587-1595.
142. Wu, Z.S., et al., Graphene/metal oxide composite electrode materials for energy
storage. Nano Energy, 2012. 1(1): p. 107-131.
143. Dong, L.F., et al., Graphene-supported platinum and platinum-ruthenium
nanoparticles with high electrocatalytic activity for methanol and ethanol oxidation.
Carbon, 2010. 48(3): p. 781-787.
144. Paek, S.M., E. Yoo, and I. Honma, Enhanced Cyclic Performance and Lithium Storage
Capacity of SnO(2)/Graphene Nanoporous Electrodes with Three-Dimensionally
Delaminated Flexible Structure. Nano letters, 2009. 9(1): p. 72-75.
145. Chang, H.X., et al., Quantum dots sensitized graphene: In situ growth and application
in photoelectrochemical cells. Electrochemistry Communications, 2010. 12(3): p.
483-487.
146. Dong, H.F., et al., Fluorescence Resonance Energy Transfer between Quantum Dots
and Graphene Oxide for Sensing Biomolecules. Analytical Chemistry, 2010. 82(13): p.
5511-5517.
147. Wang, K., et al., Graphene enhanced electrochemiluminescence of CdS nanocrystal for
H2O2 sensing. Talanta, 2010. 82(1): p. 372-376.
148. Jin, E., et al., Fabrication of graphene/prussian blue composite nanosheets and their
electrocatalytic reduction of H2O2. Electrochimica Acta, 2010. 55(24): p. 7230-7234.

191
149. Wang, H.L., et al., Ni(OH)(2) Nanoplates Grown on Graphene as Advanced
Electrochemical Pseudocapacitor Materials. Journal of the American Chemical
Society, 2010. 132(21): p. 7472-7477.
150. Petit, C. and T.J. Bandosz, Graphite Oxide/Polyoxometalate Nanocomposites as
Adsorbents of Ammonia. Journal of Physical Chemistry C, 2009. 113(9): p. 3800-3809.
151. Chen, S., J.W. Zhu, and X. Wang, One-Step Synthesis of Graphene-Cobalt Hydroxide
Nanocomposites and Their Electrochemical Properties. Journal of Physical Chemistry
C, 2010. 114(27): p. 11829-11834.
152. Rempel, J.Y., et al., Properties of the CdSe(0001), (0001), and (1120) single crystal
surfaces: Relaxation, reconstruction, and adatom and admolecule adsorption. Journal
of Physical Chemistry B, 2005. 109(41): p. 19320-19328.
153. Kelly, K.L., et al., The optical properties of metal nanoparticles: The influence of size,
shape, and dielectric environment. Journal of Physical Chemistry B, 2003. 107(3): p.
668-677.
154. Choi, D., et al., Fully Rollable Transparent Nanogenerators Based on Graphene
Electrodes. Advanced Materials, 2010. 22(19): p. 2187-+.
155. Wu, Z.S., et al., Field Emission of Single-Layer Graphene Films Prepared by
Electrophoretic Deposition. Advanced Materials, 2009. 21(17): p. 1756-+.
156. Li, Y., et al., Palladium nanoparticle-graphene hybrids as active catalysts for the
Suzuki reaction. Nano Research, 2010. 3(6): p. 429-437.
157. Wu, J.B., et al., Organic solar cells with solution-processed graphene transparent
electrodes. Applied Physics Letters, 2008. 92(26).
158. Zhang, H., et al., P25-Graphene Composite as a High Performance Photocatalyst. Acs
Nano, 2010. 4(1): p. 380-386.
159. Dimitrakakis, G.K., E. Tylianakis, and G.E. Froudakis, Pillared Graphene: A New 3-D
Network Nanostructure for Enhanced Hydrogen Storage. Nano Letters, 2008. 8(10): p.
3166-3170.
160. Neto, A.H.C. and K. Novoselov, Two-Dimensional Crystals: Beyond Graphene.
Materials Express, 2011. 1(1): p. 10-17.
161. Kim, K.S., et al., Large-scale pattern growth of graphene films for stretchable
transparent electrodes. Nature, 2009. 457(7230): p. 706-710.
162. Bae, S., et al., Roll-to-roll production of 30-inch graphene films for transparent
electrodes. Nature Nanotechnology, 2010. 5(8): p. 574-578.
163. Dikin, D.A., et al., Preparation and characterization of graphene oxide paper. Nature,
2007. 448(7152): p. 457-460.
164. Stankovich, S., et al., Graphene-based composite materials. Nature, 2006. 442(7100):
p. 282-286.
165. Liang, M.H. and L.J. Zhi, Graphene-based electrode materials for rechargeable
lithium batteries. Journal of Materials Chemistry, 2009. 19(33): p. 5871-5878.
166. Yoo, E., et al., Large reversible Li storage of graphene nanosheet families for use in
rechargeable lithium ion batteries. Nano letters, 2008. 8(8): p. 2277-2282.
167. Winter, M., et al., Insertion electrode materials for rechargeable lithium batteries.
Advanced Materials, 1998. 10(10): p. 725-763.

192
168. Masarapu, C., et al., Long-Cycle Electrochemical Behavior of Multiwall Carbon
Nanotubes Synthesized on Stainless Steel in Li Ion Batteries. Advanced Functional
Materials, 2009. 19(7): p. 1008-1014.
169. Yoon, S.H., et al., Novel carbon nanofibers of high graphitization as anodic materials
for lithium ion secondary batteries. Carbon, 2004. 42(1): p. 21-32.
170. Wang, G.X., et al., Graphene nanosheets for enhanced lithium storage in lithium ion
batteries. Carbon, 2009. 47(8): p. 2049-2053.
171. Poizot, P., et al., Nano-sized transition-metaloxides as negative-electrode materials for
lithium-ion batteries. Nature, 2000. 407(6803): p. 496-499.
172. Qi, X.Y., et al., Amphiphilic Graphene Composites. Angewandte Chemie-International
Edition, 2010. 49(49): p. 9426-9429.
173. Qi, X.Y., et al., Conjugated-Polyelectrolyte-Functionalized Reduced Graphene Oxide
with Excellent Solubility and Stability in Polar Solvents. Small, 2010. 6(5): p. 663-669.
174. He, Q.Y., et al., Transparent, Flexible, All-Reduced Graphene Oxide Thin Film
Transistors. Acs Nano, 2011. 5(6): p. 5038-5044.
175. Jeong, H.K., et al., Thermal stability of graphite oxide. Chemical Physics Letters, 2009.
470(4-6): p. 255-258.
176. Yao, J., et al., In situ chemical synthesis of SnO2-graphene nanocomposite as anode
materials for lithium-ion batteries. Electrochemistry Communications, 2009. 11(10): p.
1849-1852.
177. Zhang, L.S., et al., Mono dispersed SnO2 nanoparticles on both sides of single layer
graphene sheets as anode materials in Li-ion batteries. Journal of Materials Chemistry,
2010. 20(26): p. 5462-5467.
178. Du, Z.F., et al., In situ synthesis of SnO2/graphene nanocomposite and their
application as anode material for lithium ion battery. Materials Letters, 2010. 64(19): p.
2076-2079.
179. Zhang, M., et al., Fast synthesis of SnO2/graphene composites by reducing graphene
oxide with stannous ions. Journal of Materials Chemistry, 2011. 21(6): p. 1673-1676.
180. Wang, X.M., et al., Manipulation of Graphene Properties by Interface Engineering.
2011 International Conference on Semiconductor Technology for Ultra Large Scale
Integrated Circuits and Thin Film Transistors (Ulsic Vs. Tft), 2011. 37(1): p. 133-139.
181. Lian, P.C., et al., High reversible capacity of SnO2/graphene nanocomposite as an
anode material for lithium-ion batteries. Electrochimica Acta, 2011. 56(12): p.
4532-4539.
182. Ding, S.J., et al., SnO2 nanosheets grown on graphene sheets with enhanced lithium
storage properties. Chemical Communications, 2011. 47(25): p. 7155-7157.
183. Zhao, B., et al., Bivalent tin ion assisted reduction for preparing graphene/SnO2
composite with good cyclic performance and lithium storage capacity. Electrochimica
Acta, 2011. 56(21): p. 7340-7346.
184. Wu, Z.S., et al., Graphene Anchored with Co3O4 Nanoparticles as Anode of Lithium
Ion Batteries with Enhanced Reversible Capacity and Cyclic Performance. Acs Nano,
2010. 4(6): p. 3187-3194.
185. Zhang, B.A., et al., SnO2-graphene-carbon nanotube mixture for anode material with
improved rate capacities. Carbon, 2011. 49(13): p. 4524-4534.

193
186. Chen, S.Q. and Y. Wang, Microwave-assisted synthesis of a Co3O4-graphene
sheet-on-sheet nanocomposite as a superior anode material for Li-ion batteries.
Journal of Materials Chemistry, 2010. 20(43): p. 9735-9739.
187. Wang, X., et al., Synthesis and Lithium Storage Properties of Co3O4
Nanosheet-Assembled Multishelled Hollow Spheres. Advanced Functional Materials,
2010. 20(10): p. 1680-1686.
188. Zhou, W.W., et al., A general strategy toward graphene@metal oxide core-shell
nanostructures for high-performance lithium storage. Energy & Environmental
Science, 2011. 4(12): p. 4954-4961.
189. Hsieh, C.T., C.Y. Lin, and J.Y. Lin, High reversibility of Li intercalation and
de-intercalation in MnO-attached graphene anodes for Li-ion batteries.
Electrochimica Acta, 2011. 56(24): p. 8861-8867.
190. Yang, S.B., et al., Fabrication of Graphene-Encapsulated Oxide Nanoparticles:
Towards High-Performance Anode Materials for Lithium Storage. Angewandte
Chemie-International Edition, 2010. 49(45): p. 8408-8411.
191. Zhu, N., et al., Graphene as a conductive additive to enhance the high-rate capabilities
of electrospun Li4Ti5O12 for lithium-ion batteries. Electrochimica Acta, 2010. 55(20):
p. 5813-5818.
192. Zhu, X.J., et al., Nanostructured Reduced Graphene Oxide/Fe2O3 Composite As a
High-Performance Anode Material for Lithium Ion Batteries. Acs Nano, 2011. 5(4): p.
3333-3338.
193. Zhang, M., et al., Magnetite/graphene composites: microwave irradiation synthesis
and enhanced cycling and rate performances for lithium ion batteries. Journal of
Materials Chemistry, 2010. 20(26): p. 5538-5543.
194. Wang, G., et al., Preparation of Fe2O3/graphene composite and its electrochemical
performance as an anode material for lithium ion batteries. Journal of Alloys and
Compounds, 2011. 509(24): p. L216-L220.
195. Behera, S.K., Enhanced rate performance and cyclic stability of Fe3O4-graphene
nanocomposites for Li ion battery anodes. Chemical Communications, 2011. 47(37): p.
10371-10373.
196. Su, J., et al., Fe3O4-Graphene Nanocomposites with Improved Lithium Storage and
Magnetism Properties. Journal of Physical Chemistry C, 2011. 115(30): p.
14469-14477.
197. Zhou, J.S., et al., Magnetite/graphene nanosheet composites: interfacial interaction
and its impact on the durable high-rate performance in lithium-ion batteries. Rsc
Advances, 2011. 1(5): p. 782-791.
198. Huang, H.J. and X. Wang, Graphene nanoplate-MnO2 composites for supercapacitors:
a controllable oxidation approach. Nanoscale, 2011. 3(8): p. 3185-3191.
199. Li, B.J., et al., Superparamagnetic Fe3O4 nanocrystals@graphene composites for
energy storage devices. Journal of Materials Chemistry, 2011. 21(13): p. 5069-5075.
200. Kottegoda, I.R.M., et al., Synthesis and characterization of graphene-nickel oxide
nanostructures for fast charge-discharge application. Electrochimica Acta, 2011.
56(16): p. 5815-5822.

194
201. Choi, D.W., et al., Li-ion batteries from LiFePO4 cathode and anatase/graphene
composite anode for stationary energy storage. Electrochemistry Communications,
2010. 12(3): p. 378-381.
202. Ding, S.J., et al., Graphene-supported anatase TiO2 nanosheets for fast lithium storage.
Chemical Communications, 2011. 47(20): p. 5780-5782.
203. Wang, B., et al., Synthesis of CuO/graphene nanocomposite as a high-performance
anode material for lithium-ion batteries. Journal of Materials Chemistry, 2010. 20(47):
p. 10661-10664.
204. Yang, S.B., et al., Graphene-Based Nanosheets with a Sandwich Structure.
Angewandte Chemie-International Edition, 2010. 49(28): p. 4795-4799.
205. Yu, A.P., et al., Free-Standing Layer-By-Layer Hybrid Thin Film of Graphene-MnO2
Nanotube as Anode for Lithium Ion Batteries. Journal of Physical Chemistry Letters,
2011. 2(15): p. 1855-1860.
206. Guo, C.X., et al., A Hierarchically Nanostructured Composite of MnO2/Conjugated
Polymer/Graphene for High-Performance Lithium Ion Batteries. Advanced Energy
Materials, 2011. 1(5): p. 736-741.
207. Mai, Y.J., et al., CuO/graphene composite as anode materials for lithium-ion batteries.
Electrochimica Acta, 2011. 56(5): p. 2306-2311.
208. Liu, H.D., et al., Li3V2(PO4)(3)/graphene nanocomposites as cathode material for
lithium ion batteries. Chemical Communications, 2011. 47(32): p. 9110-9112.
209. Wang, D.H., et al., Self-Assembled TiO2-Graphene Hybrid Nanostructures for
Enhanced Li-Ion Insertion. ACS Nano, 2009. 3(4): p. 907-914.
210. Wang, G., et al., Prepartion and electrochemical performance of a cerium
oxide-graphene nanocomposite as the anode material of a lithium ion battery. Scripta
Materialia, 2011. 65(4): p. 339-342.
211. Xu, C., et al., Fabrication of a graphene-cuprous oxide composite. Journal of Solid
State Chemistry, 2009. 182(9): p. 2486-2490.
212. Yang, S.B., X.L. Feng, and K. Mullen, Sandwich-Like, Graphene-Based Titania
Nanosheets with High Surface Area for Fast Lithium Storage. Advanced Materials,
2011. 23(31): p. 3575-+.
213. Shi, Y., et al., Nanosized Li4Ti5O12/graphene hybrid materials with low polarization
for high rate lithium ion batteries. Journal of Power Sources, 2011. 196(20): p.
8610-8617.
214. Li, N., et al., Battery Performance and Photocatalytic Activity of Mesoporous Anatase
TiO2 Nanospheres/Graphene Composites by Template-Free Self-Assembly. Advanced
Functional Materials, 2011. 21(9): p. 1717-1722.
215. Zhou, G.M., et al., Graphene-Wrapped Fe3O4 Anode Material with Improved
Reversible Capacity and Cyclic Stability for Lithium Ion Batteries. Chemistry of
Materials, 2010. 22(18): p. 5306-5313.
216. Sun, Y.M., et al., Self-Assembled Hierarchical MoO2/Graphene Nanoarchitectures
and Their Application as a High-Performance Anode Material for Lithium-Ion
Batteries. Acs Nano, 2011. 5(9): p. 7100-7107.

195
217. Liu, H.M. and W.S. Yang, Ultralong single crystalline V2O5 nanowire/graphene
composite fabricated by a facile green approach and its lithium storage behavior.
Energy & Environmental Science, 2011. 4(10): p. 4000-4008.
218. Wang, J.Z., et al., Graphene-Encapsulated Fe3O4 Nanoparticles with 3D Laminated
Structure as Superior Anode in Lithium Ion Batteries. Chemistry-a European Journal,
2011. 17(2): p. 661-667.
219. Chen, D.Y., et al., Graphene-Encapsulated Hollow Fe3O4 Nanoparticle Aggregates As
a High-Performance Anode Material for Lithium Ion Batteries. Acs Applied Materials
& Interfaces, 2011. 3(8): p. 3078-3083.
220. Qiu, Y.C., et al., Synthesis of Size-Tunable Anatase TiO2 Nanospindles and Their
Assembly into Anatase@Titanium Oxynitride/Titanium Nitride-Graphene
Nanocomposites for Rechargeable Lithium Ion Batteries with High Cycling
Performance. Acs Nano, 2010. 4(11): p. 6515-6526.
221. Zou, Y.Q. and Y. Wang, NiO nanosheets grown on graphene nanosheets as superior
anode materials for Li-ion batteries. Nanoscale, 2011. 3(6): p. 2615-2620.
222. Wu, Z.S., et al., Anchoring Hydrous RuO2 on Graphene Sheets for High-Performance
Electrochemical Capacitors. Advanced Functional Materials, 2010. 20(20): p.
3595-3602.
223. Prakash, A.S., et al., Solution-Combustion Synthesized Nanocrystalline Li4Ti5O12 As
High-Rate Performance Li-Ion Battery Anode. Chemistry of Materials, 2010. 22(9): p.
2857-2863.
224. Zhou, X.F., et al., Graphene modified LiFePO4 cathode materials for high power
lithium ion batteries. Journal of Materials Chemistry, 2011. 21(10): p. 3353-3358.
225. Zuo, P.P., et al., Fabrication of biocompatible and mechanically reinforced graphene
oxide-chitosan nanocomposite films. Chemistry Central Journal, 2013. 7.
226. Mixed Cellulose Ester Membranes. Available from:
http://www.whatman.com/MixedCelluloseEsterMembranes.aspx.
227. Anodisc pore structure. Available from:
http://www.whatman.com/PRODAnoporeInorganicMembranes.aspx.
228. Holey carbon films - Nickel. Available from:
http://www.agarscientific.com/tem/coated-grids/holey-carbon-films-7087.html.
229. Thermal Oxide Wafer: 300 nm SiO2 Layer on Si (100), 2" dia x 0.50 mm t, P type , 1
side polished,R:<0.005 ohm.cm. Available from:
http://www.mtixtl.com/si-so-ba50d300nm.aspx.
230. Giessibl, F.J., Advances in atomic force microscopy. Reviews of Modern Physics, 2003.
75(3): p. 949-983.
231. Smith, W.F. and J. Hashemi, Foundations of materials science and engineering. 5th ed.
2010, Boston, Mass.: McGraw-Hill. xviii, 1068 p.
232. Donald, A.M., The use of environmental scanning electron microscopy for imaging wet
and insulating materials. Nature Materials, 2003. 2(8): p. 511-516.
233. Scheme TEM en.
234. Spence, J.C.H., Experimental high-resolution electron microscopy. Monographs on the
physics and chemistry of materials. 1981, Oxford New York: Clarendon Press ; Oxford
University Press. xii, 370 p.

196
235. Vickerman, J.C. and I.S. Gilmore, Surface analysis : the principal techniques. 2nd ed.
2009, Chichester, U.K.: Wiley. xix, 666 p.
236. Buschow, K.H.J., Encyclopedia of materials : science and technology. 2001,
Amsterdam ; New York: Elsevier.
237. Martin, P.M. and Books24x7 Inc., Handbook of deposition technologies for films and
coatings science, applications and technology, third edition. 2010, William
Andrew/Elsevier,: Oxford, U.K. ; Burlington, Mass.
238. Hüfner, S., Photoelectron spectroscopy : principles and applications. 3rd ed. Advanced
texts in physics. 2003, Berlin ; New York: Springer. xv, 662 p.
239. Smith, B.C., Fundamentals of Fourier transform infrared spectroscopy. 2nd ed. 2011,
Boca Raton, FL: CRC Press. xiii, 193 p.
240. Faix, O., Fourier transform infrared spectroscopy, in Methods in lignin chemistry.
1992, Springer. p. 83-109.
241. Hind, A.R., S.K. Bhargava, and A. McKinnon, At the solid/liquid interface: FTIR/ATR
- the tool of choice. Advances in Colloid and Interface Science, 2001. 93(1-3): p.
91-114.
242. Pauw, L.J.v.d., A new method of measuring the resistivity and Hall coefficients on
lamellae of arbitrary shape. Philips technical review, 1958. 20: p. 220-224.
243. Sze, S.M. and M.K. Lee, Semiconductor devices, physics and technology. 3rd ed. 2012,
Hoboken, N.J.: Wiley. ix, 578 p.
244. Kwok, D.Y., et al., Contact Angle Measurements and Contact Angle Interpretation. 1.
Contact Angle Measurements by Axisymmetric Drop Shape Analysis and a Goniometer
Sessile Drop Technique. Langmuir, 1997. 13(10): p. 2880-2894.
245. Buschow, K.H.J., et al., Encyclopedia of Materials - Science and Technology, Volumes
1-11. 2001, Elsevier.
246. Woodward, R.P., FTÅ200 Measurement Capabilities.
247. Drelich, J., J.S. Laskowski, and K.L. Mittal, Apparent and Microscopic Contact Angles.
2000, VSP - An imprint of BRILL. p. 15-18.
248. Ru, L., et al., Principles of Surface-Enhanced Raman Spectroscopy and Related
Plasmonic Effects. 2009, Elsevier.
249. Sgro, L., et al., UV-visible spectroscopy of organic carbon particulate sampled from
ethylene/air flames. Chemosphere, 2001. 42(5): p. 671-680.
250. Gfroerer, T.H., Photoluminescence in Analysis of Surfaces and Interfaces, in
Encyclopedia of Analytical Chemistry. 2006, John Wiley & Sons, Ltd.
251. Suryanarayana, C. and M.G. Norton, X-Ray diffraction : a practical approach. 1998,
New York: Plenum Press. xiii, 273 p.
252. Brundle, C.R., C.A. Evans, and S. Wilson, Encyclopedia of materials characterization :
surfaces, interfaces, thin films. Materials characterization series. 1992, Boston
Greenwich, CT: Butterworth-Heinemann ; Manning. xix, 751 p.
253. Eda, G., G. Fanchini, and M. Chhowalla, Large-area ultrathin films of reduced
graphene oxide as a transparent and flexible electronic material. Nature
Nanotechnology, 2008. 3(5): p. 270-274.

197
254. Zhang, L.M., et al., Functional Graphene Oxide as a Nanocarrier for Controlled
Loading and Targeted Delivery of Mixed Anticancer Drugs. Small, 2010. 6(4): p.
537-544.
255. Wassei, J.K., et al., Stenciling Graphene, Carbon Nanotubes, and Fullerenes Using
Elastomeric Lift-Off Membranes. Advanced Materials, 2010. 22(8): p. 897-+.
256. Dubin, S., et al., A One-Step, Solvothermal Reduction Method for Producing Reduced
Graphene Oxide Dispersions in Organic Solvents. ACS Nano, 2010. 4(7): p.
3845-3852.
257. Khan, U., et al., High-Concentration Solvent Exfoliation of Graphene. Small, 2010.
6(7): p. 864-871.
258. Jung, I., et al., Simple approach for high-contrast optical imaging and characterization
of graphene-based sheets. Nano Letters, 2007. 7(12): p. 3569-3575.
259. Lambacher, A. and P. Fromherz, Fluorescence interference-contrast microscopy on
oxidized silicon using a monomolecular dye layer. Applied Physics a-Materials Science
& Processing, 1996. 63(3): p. 207-216.
260. Ni, Z.H., et al., Graphene thickness determination using reflection and contrast
spectroscopy. Nano Letters, 2007. 7(9): p. 2758-2763.
261. Ward, L., The optical constants of bulk materials and films. 2nd ed. Optics and
optoelectronics series. 1994, Bristol ; Philadelphia: Institute of Physics Pub. xvii, 293 p.
262. Blake, P., et al., Making graphene visible. Applied Physics Letters, 2007. 91(6).
263. Wu, B., et al., Equiangular Hexagon-Shape-Controlled Synthesis of Graphene on
Copper Surface. Advanced Materials, 2011. 23(31): p. 3522-+.
264. Huang, P.Y., et al., Grains and grain boundaries in single-layer graphene atomic
patchwork quilts. Nature, 2011. 469(7330): p. 389-+.
265. Ferrari, A.C., Raman spectroscopy of graphene and graphite: Disorder,
electron–phonon coupling, doping and nonadiabatic effects Solid State
Communications, 2007. 143(1-2): p. 11.
266. Meyer, J.C., et al., On the roughness of single- and bi-layer graphene membranes.
Solid State Communications, 2007. 143(1-2): p. 101-109.
267. Chen, R.J., et al., Noncovalent sidewall functionalization of single-walled carbon
nanotubes for protein immobilization. Journal of the American Chemical Society, 2001.
123(16): p. 3838-3839.
268. Meyer, J.C., et al., The structure of suspended graphene sheets. Nature, 2007.
446(7131): p. 60-63.
269. Joung, D., L. Zhai, and S.I. Khondaker, Coulomb blockade and hopping conduction in
graphene quantum dots array. Physical Review B, 2011. 83(11).
270. Bagri, A., et al., Structural evolution during the reduction of chemically derived
graphene oxide. Nature Chemistry, 2010. 2(7): p. 581-587.
271. Zhang, Y.B., et al., Experimental observation of the quantum Hall effect and Berry's
phase in graphene. Nature, 2005. 438(7065): p. 201-204.
272. Li, X.L., et al., Chemically derived, ultrasmooth graphene nanoribbon semiconductors.
Science, 2008. 319(5867): p. 1229-1232.
273. Hernandez, Y., et al., High-yield production of graphene by liquid-phase exfoliation of
graphite. Nature Nanotechnology, 2008. 3(9): p. 563-568.

198
274. Liu, Z.H., et al., Intercalation of organic ammonium ions into layered graphite oxide.
Langmuir, 2002. 18(12): p. 4926-4932.
275. Park, S., et al., Graphene oxide papers modified by divalent ions - Enhancing
mechanical properties via chemical cross-linking. Acs Nano, 2008. 2(3): p. 572-578.
276. Cote, L.J., F. Kim, and J.X. Huang, Langmuir-Blodgett Assembly of Graphite Oxide
Single Layers. Journal of the American Chemical Society, 2009. 131(3): p. 1043-1049.
277. Jeong, H.K., et al., Evidence of graphitic AB stacking order of graphite oxides. Journal
of the American Chemical Society, 2008. 130(4): p. 1362-1366.
278. Xu, Y.X., et al., Flexible graphene films via the filtration of water-soluble noncovalent
functionalized graphene sheets. Journal of the American Chemical Society, 2008.
130(18): p. 5856-+.
279. Yumitori, S., Correlation of C-1s chemical state intensities with the O-1s intensity in
the XPS analysis of anodically oxidized glass-like carbon samples. Journal of Materials
Science, 2000. 35(1): p. 139-146.
280. Joung, D. and S.I. Khondaker, Efros-Shklovskii variable-range hopping in reduced
graphene oxide sheets of varying carbon sp(2) fraction. Physical Review B, 2012.
86(23).
281. Shin, H.J., et al., Tailoring electronic structures of carbon nanotubes by solvent with
electron-donating and -withdrawing groups. Journal of the American Chemical Society,
2008. 130(6): p. 2062-2066.
282. Graupner, R., et al., Doping of single-walled carbon nanotube bundles by Bronsted
acids. Physical Chemistry Chemical Physics, 2003. 5(24): p. 5472-5476.
283. Liang, Y.Y., et al., TiO2 Nanocrystals Grown on Graphene as Advanced
Photocatalytic Hybrid Materials. Nano Research, 2010. 3(10): p. 701-705.
284. Principe, E.L. and B.A. Shaw, Observations regarding the effects of nitrogen addition
to the aluminum-tungsten system by reactive sputter deposition. Corrosion, 1997. 53(9):
p. 675-678.
285. Liao, H.M., R.N.S. Sodhi, and T.W. Coyle, Surface-Composition of Aln Powders
Studied by X-Ray Photoelectron-Spectroscopy and Bremsstrahlung-Excited
Auger-Electron Spectroscopy. Journal of Vacuum Science & Technology a-Vacuum
Surfaces and Films, 1993. 11(5): p. 2681-2686.
286. Moulder, J.F. and J. Chastain, Handbook of X-Ray Photoelectron Spectroscopy: A
Reference Book of Standard Spectra for Identification & Interpretation of XPS Data.
1992: Perkin-Elmer.
287. Tuinstra, F. and J.L. Koenig, Raman Spectrum of Graphite. Journal of Chemical
Physics, 1970. 53(3): p. 1126-&.
288. Pimenta, M.A., et al., Studying disorder in graphite-based systems by Raman
spectroscopy. Physical Chemistry Chemical Physics, 2007. 9(11): p. 1276-1291.
289. Bourlinos, A.B., et al., Graphite oxide: Chemical reduction to graphite and surface
modification with primary aliphatic amines and amino acids. Langmuir, 2003. 19(15):
p. 6050-6055.
290. Stankovich, S., et al., Synthesis and exfoliation of isocyanate-treated graphene oxide
nanoplatelets. Carbon, 2006. 44(15): p. 3342-3347.

199
291. Dillon, A.C., et al., Surface-Chemistry of Al2o3 Deposition Using Al(Ch3)(3) and H2o
in a Binary Reaction Sequence. Surface Science, 1995. 322(1-3): p. 230-242.
292. Morterra, C., et al., X-Ray-Diffraction, High-Resolution Transmission
Electron-Microscopy and Fourier-Transform Infrared Study of Ca-Doped Al2o3.
Journal of the Chemical Society-Faraday Transactions, 1993. 89(1): p. 135-150.
293. Chun, D.H., et al., Catalytic properties of Ni3Al foils for methanol decomposition.
Catalysis Letters, 2006. 106(1-2): p. 71-75.
294. Su, Z.X. and W.Z. Zhou, Formation Mechanism of Porous Anodic Aluminium and
Titanium Oxides. Advanced Materials, 2008. 20(19): p. 3663-+.
295. Campbell, T., et al., Dynamics of oxidation of aluminum nanoclusters using variable
charge molecular-dynamics simulations on parallel computers. Physical Review
Letters, 1999. 82(24): p. 4866-4869.
296. Wang, X.R., S.M. Tabakman, and H.J. Dai, Atomic layer deposition of metal oxides on
pristine and functionalized graphene. Journal of the American Chemical Society, 2008.
130(26): p. 8152-+.
297. Muszynski, R., B. Seger, and P.V. Kamat, Decorating graphene sheets with gold
nanoparticles. Journal of Physical Chemistry C, 2008. 112(14): p. 5263-5266.
298. Scheuermann, G.M., et al., Palladium Nanoparticles on Graphite Oxide and Its
Functionalized Graphene Derivatives as Highly Active Catalysts for the
Suzuki-Miyaura Coupling Reaction. Journal of the American Chemical Society, 2009.
131(23): p. 8262-8270.
299. Tan, Y.W., et al., Measurement of scattering rate and minimum conductivity in
graphene. Physical Review Letters, 2007. 99(24).
300. Martin, J., et al., Observation of electron-hole puddles in graphene using a scanning
single-electron transistor. Nature Physics, 2008. 4(2): p. 144-148.
301. Wehling, T.O., et al., Molecular doping of graphene. Nano letters, 2008. 8(1): p.
173-177.
302. Boukhvalov, D.W. and M.I. Katsnelson, Modeling of graphite oxide. Journal of the
American Chemical Society, 2008. 130(32): p. 10697-10701.
303. Das, A., et al., Monitoring dopants by Raman scattering in an electrochemically
top-gated graphene transistor. Nature Nanotechnology, 2008. 3(4): p. 210-215.
304. Adamson, A.W., The physical chemistry of surfaces. Abstracts of Papers of the
American Chemical Society, 2001. 221: p. U320-U320.
305. Ismach, A., et al., Direct Chemical Vapor Deposition of Graphene on Dielectric
Surfaces. Nano letters, 2010. 10(5): p. 1542-1548.
306. Taherian, F., et al., What Is the Contact Angle of Water on Graphene? Langmuir, 2013.
29(5): p. 1457-1465.
307. Choi, K., T.J. Eom, and C. Lee, Comparison of the removal efficiency for organic
contaminants on silicon wafers stored in plastic boxes between UV/O-3 and ECR
oxygen plasma cleaning methods. Thin Solid Films, 2003. 435(1-2): p. 227-231.
308. Smith, P.J. and P.M. Lindley, Analysis of organic contamination in semiconductor
processing. Characterization and Metrology for Ulsi Technology, 1998. 449: p.
133-139.

200
309. Kurokawa, A., et al., Diagnosis and Cleaning of Carbon Contamination on SiO2 Thin
Film. Journal of Surface Analysis, 2009. 15(3): p. 337-340.
310. Zubkov, T., et al., Ultraviolet light-induced hydrophilicity effect on TiO2(110)(1x1).
Dominant role of the photooxidation of adsorbed hydrocarbons causing wetting by
water droplets. Journal of Physical Chemistry B, 2005. 109(32): p. 15454-15462.
311. Robertson, J. and E.P. Oreilly, Electronic and Atomic-Structure of Amorphous-Carbon.
Physical Review B, 1987. 35(6): p. 2946-2957.
312. Paci, J.T., T. Belytschko, and G.C. Schatz, Computational studies of the structure,
behavior upon heating, and mechanical properties of graphite oxide. Journal of
Physical Chemistry C, 2007. 111(49): p. 18099-18111.
313. Kim, M.C., G.S. Hwang, and R.S. Ruoff, Epoxide reduction with hydrazine on
graphene: A first principles study. Journal of Chemical Physics, 2009. 131(6).
314. Gao, X.F., J. Jang, and S. Nagase, Hydrazine and Thermal Reduction of Graphene
Oxide: Reaction Mechanisms, Product Structures, and Reaction Design. Journal of
Physical Chemistry C, 2010. 114(2): p. 832-842.
315. Bang, S., et al., Al2O3 buffer in a ZnO thin film transistor with poly-4-vinylphenol
dielectric. Semiconductor Science and Technology, 2009. 24(2).
316. Fan, J.P., et al., Preparation and microstructure of multi-wall carbon
nanotubes-toughened Al2O3 composite. Journal of the American Ceramic Society,
2006. 89(2): p. 750-753.
317. Tadanaga, K., J. Morinaga, and T. Minami, Formation of
superhydrophobic-superhydrophilic pattern on flowerlike alumina thin film by the
sol-gel method. Journal of Sol-Gel Science and Technology, 2000. 19(1-3): p. 211-214.
318. Qie, L., et al., Nitrogen‐Doped Porous Carbon Nanofiber Webs as Anodes for Lithium
Ion Batteries with a Superhigh Capacity and Rate Capability. Advanced Materials,
2012. 24(15): p. 2047-2050.
319. Wang, H., et al., Mn3O4− graphene hybrid as a high-capacity anode material for
lithium ion batteries. Journal of the American Chemical Society, 2010. 132(40): p.
13978-13980.
320. Fan, Z.J., et al., Nanographene-constructed carbon nanofibers grown on graphene
sheets by chemical vapor deposition: high-performance anode materials for lithium ion
batteries. ACS Nano, 2011. 5(4): p. 2787-94.
321. Shin, Y.J., et al., Surface-Energy Engineering of Graphene. Langmuir, 2010. 26(6): p.
3798-3802.
322. Wu, Z.S., et al., Doped Graphene Sheets As Anode Materials with Superhigh Rate and
Large Capacity for Lithium Ion Batteries. Acs Nano, 2011. 5(7): p. 5463-5471.
323. Fan, J.P., et al., Notice of dual publication "preparation and microstructure of
multi-wall carbon nanotubes-toughened Al2O3 composite" (vol 89, pg 750, 2006).
Journal of the American Ceramic Society, 2006. 89(8): p. 2674-2674.
324. Jiang, Z.Q. and Z.J. Jiang, Effects of carbon content on the electrochemical
performance of LiFePO4/C core/shell nanocomposites fabricated using
FePO4/polyaniline as an iron source. Journal of Alloys and Compounds, 2012. 537: p.
308-317.

201
325. Wang, C.Y., et al., Electrochemical Properties of Graphene Paper Electrodes Used in
Lithium Batteries. Chemistry of Materials, 2009. 21(13): p. 2604-2606.
326. Shen, L., et al., Design and Tailoring of a Three-Dimensional TiO2–Graphene–Carbon
Nanotube Nanocomposite for Fast Lithium Storage. The Journal of Physical Chemistry
Letters, 2011. 2(24): p. 3096-3101.
327. Li, S., et al., Vertically Aligned Carbon Nanotubes Grown on Graphene Paper as
Electrodes in Lithium‐Ion Batteries and Dye‐Sensitized Solar Cells. Advanced
Energy Materials, 2011. 1(4): p. 486-490.
328. Wang, Z.L., et al., Facile, mild and fast thermal-decomposition reduction of graphene
oxide in air and its application in high-performance lithium batteries. Chemical
Communications, 2012. 48(7): p. 976-978.
329. Bhardwaj, T., et al., Enhanced Electrochemical Lithium Storage by Graphene
Nanoribbons. Journal of the American Chemical Society, 2010. 132(36): p.
12556-12558.
330. Wen, Z.H., et al., Binding Sn-based nanoparticles on graphene as the anode of
rechargeable lithium-ion batteries. Journal of Materials Chemistry, 2012. 22(8): p.
3300-3306.
331. Xiang, H.F., et al., Graphene sheets as anode materials for Li-ion batteries:
preparation, structure, electrochemical properties and mechanism for lithium storage.
Rsc Advances, 2012. 2(17): p. 6792-6799.
332. Vinayan, B.P., et al., Synthesis of graphene-multiwalled carbon nanotubes hybrid
nanostructure by strengthened electrostatic interaction and its lithium ion battery
application. Journal of Materials Chemistry, 2012. 22(19): p. 9949-9956.
333. Kim, H., et al., Graphene-Based Hybrid Electrode Material for High-Power
Lithium-Ion Batteries. Journal of the Electrochemical Society, 2011. 158(8): p.
A930-A935.
334. Zhou, H.S., et al., Lithium storage in ordered mesoporous carbon (CMK-3) with high
reversible specific energy capacity and good cycling performance. Advanced Materials,
2003. 15(24): p. 2107-+.
335. Aurbach, D., Review of selected electrode-solution interactions which determine the
performance of Li and Li ion batteries. Journal of Power Sources, 2000. 89(2): p.
206-218.
336. Balandin, A.A., et al., Superior thermal conductivity of single-layer graphene. Nano
letters, 2008. 8(3): p. 902-907.
337. Mukherjee, R., et al., Photothermally Reduced Graphene as High-Power Anodes for
Lithium-Ion Batteries. ACS Nano, 2012. 6(9): p. 7867-7878.
338. Xing, W.B. and J.R. Dahn, Study of irreversible capacities for Li insertion in hard and
graphitic carbons. Journal of the Electrochemical Society, 1997. 144(4): p. 1195-1201.
339. Wu, Y.P., et al., Effects of catalytic oxidation on the electrochemical performance of
common natural graphite as an anode material for lithium ion batteries.
Electrochemistry Communications, 2000. 2(4): p. 272-275.
340. Liu, T., et al., Effect of vacuum carbonization treatment on the irreversible capacity of
hard carbon prepared from biomass material. Materials Letters, 2010. 64(1): p. 74-76.

202
341. Concheso, A., et al., Electrochemical improvement of low-temperature petroleum cokes
by chemical oxidation with H2O2 for their use as anodes in lithium ion batteries.
Electrochimica Acta, 2006. 52(3): p. 1281-1289.
342. Chang, Y.C., et al., Anodic performances of coke from coals. Carbon, 1998. 36(11): p.
1653-1662.
343. Concheso, A., et al., Influence of the oxidative stabilisation treatment time on the
electrochemical performance of anthracene oils cokes as electrode materials for
lithium batteries. Journal of Power Sources, 2006. 161(2): p. 1324-1334.
344. Chen, X.C., et al., A graphene-based nanostructure with expanded ion transport
channels for high rate Li-ion batteries. Chemical Communications, 2012. 48(47): p.
5904-5906.
345. Xiao, X.C., P. Lu, and D. Ahn, Ultrathin Multifunctional Oxide Coatings for Lithium
Ion Batteries. Advanced Materials, 2011. 23(34): p. 3911-+.
346. Zhao, X., et al., Flexible Holey Graphene Paper Electrodes with Enhanced Rate
Capability for Energy Storage Applications. ACS Nano, 2011. 5(11): p. 8739-8749.
347. Wu, H., et al., Stable cycling of double-walled silicon nanotube battery anodes through
solid-electrolyte interphase control. Nature Nanotechnology, 2012. 7(5): p. 309-314.
348. Luo, Z.T., et al., Photoluminescence and band gap modulation in graphene oxide.
Applied Physics Letters, 2009. 94(11).
349. Peng, X.S., et al., Photoluminescence and infrared properties of alpha-Al2O3
nanowires and nanobelts. Journal of Physical Chemistry B, 2002. 106(43): p.
11163-11167.


![Magnetization of TiO /Reduced Graphene Oxide Nano ...Graphene oxide was prepared from natural graphite powder using a modified Hummer method [11]. Then, 0.2 g of graphene oxide was](https://static.fdocuments.us/doc/165x107/612a156a520c975cd44a4b88/magnetization-of-tio-reduced-graphene-oxide-nano-graphene-oxide-was-prepared.jpg)