Lithuania: Economy Overview by Lithuanian Confederation of Industrialists
29
Meeting with Embassies of EU countries: overview of economic trends in the light of the Russian sanctions. Osvaldas Čiukšys Deputy Director General, Lithuanian Confederation of Industrialists 2014-10-30
-
Upload
osvaldas-ciuksys -
Category
Business
-
view
178 -
download
1
Transcript of Lithuania: Economy Overview by Lithuanian Confederation of Industrialists

Meeting with Embassies of EU countries:overview of economic trends
in the light of the Russian sanctions.
Osvaldas Čiukšys
Deputy Director General, Lithuanian Confederation of Industrialists
2014-10-30
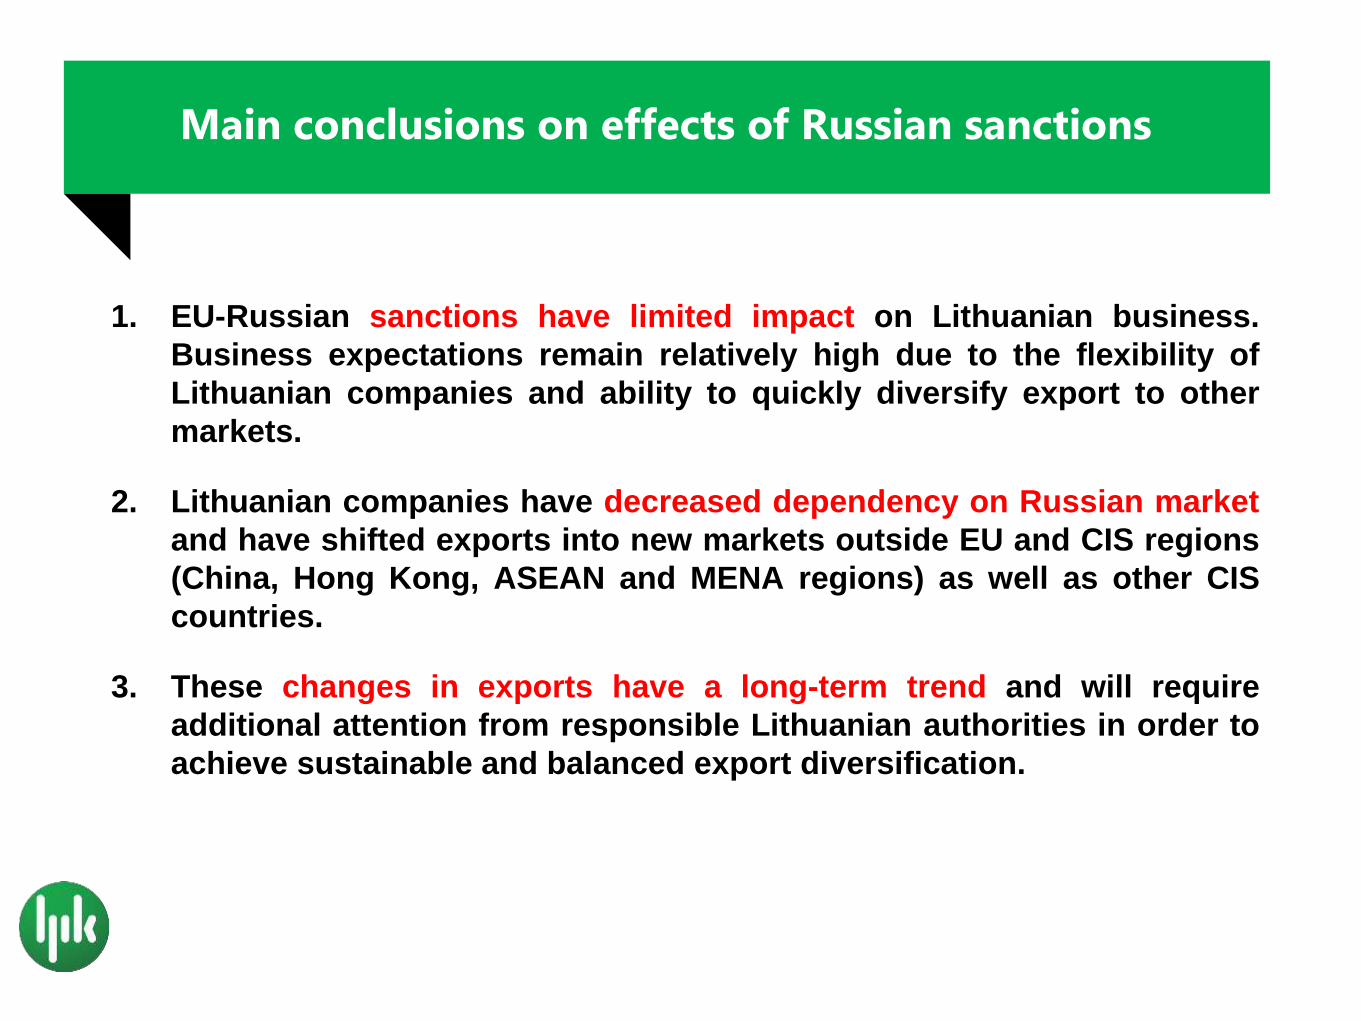
Main conclusions on effects of Russian sanctions
1. EU-Russian sanctions have limited impact on Lithuanian business.
Business expectations remain relatively high due to the flexibility of
Lithuanian companies and ability to quickly diversify export to other
markets.
2. Lithuanian companies have decreased dependency on Russian market
and have shifted exports into new markets outside EU and CIS regions
(China, Hong Kong, ASEAN and MENA regions) as well as other CIS
countries.
3. These changes in exports have a long-term trend and will require
additional attention from responsible Lithuanian authorities in order to
achieve sustainable and balanced export diversification.
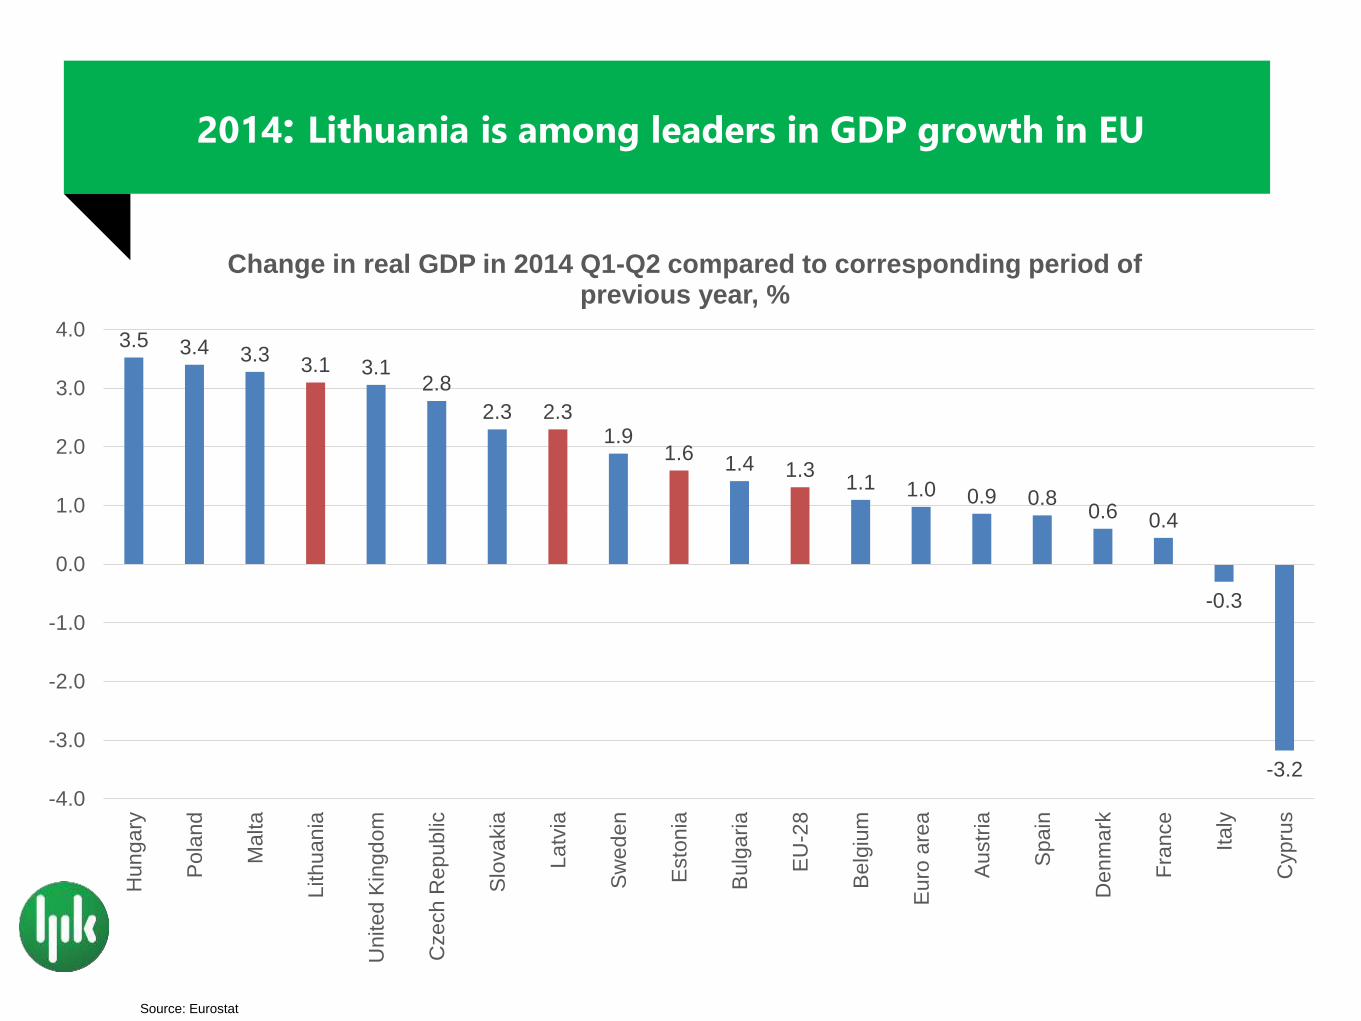
2014: Lithuania is among leaders in GDP growth in EU
Source: Eurostat
3.5 3.4 3.33.1 3.1
2.8
2.3 2.31.9
1.61.4 1.3
1.1 1.0 0.9 0.80.6 0.4
-0.3
-3.2
-4.0
-3.0
-2.0
-1.0
0.0
1.0
2.0
3.0
4.0
Hun
gary
Pola
nd
Malta
Lithuan
ia
United K
ingd
om
Czech R
ep
ublic
Slo
va
kia
Latv
ia
Sw
ed
en
Esto
nia
Bulg
aria
EU
-28
Belg
ium
Euro
are
a
Austr
ia
Spain
De
nm
ark
Fra
nce
Italy
Cypru
s
Change in real GDP in 2014 Q1-Q2 compared to corresponding period of previous year, %
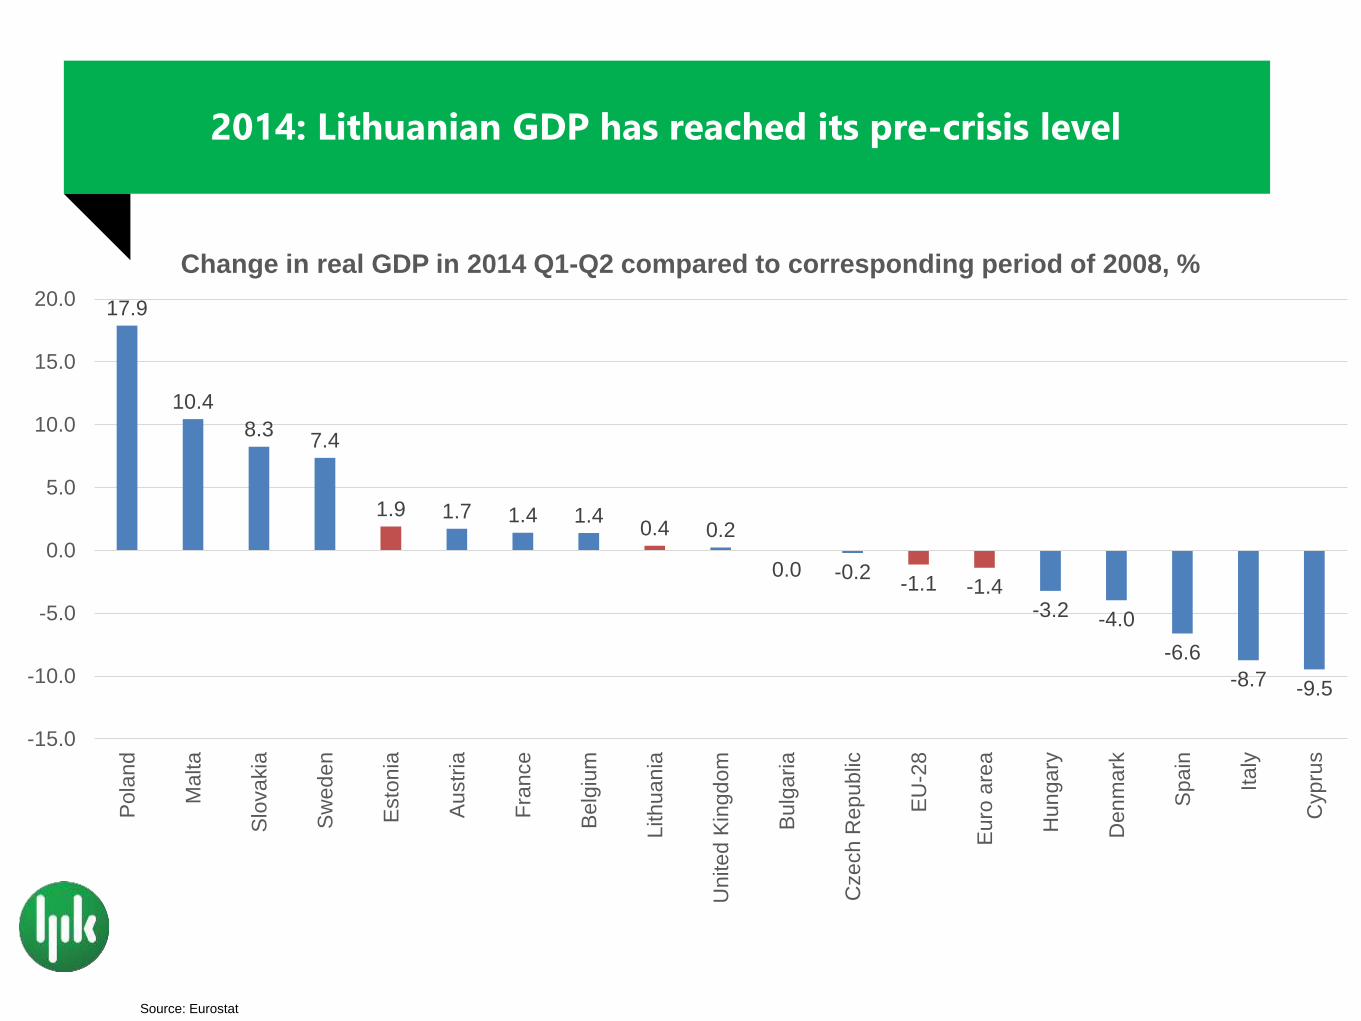
2014: Lithuanian GDP has reached its pre-crisis level
Source: Eurostat
17.9
10.4
8.37.4
1.9 1.7 1.4 1.40.4 0.2
0.0 -0.2-1.1 -1.4
-3.2 -4.0
-6.6
-8.7 -9.5
-15.0
-10.0
-5.0
0.0
5.0
10.0
15.0
20.0
Pola
nd
Malta
Slo
va
kia
Sw
ed
en
Esto
nia
Austr
ia
Fra
nce
Belg
ium
Lithuan
ia
United K
ingd
om
Bulg
aria
Czech R
ep
ublic
EU
-28
Eu
ro a
rea
Hun
gary
Den
mark
Spa
in
Italy
Cyp
rus
Change in real GDP in 2014 Q1-Q2 compared to corresponding period of 2008, %
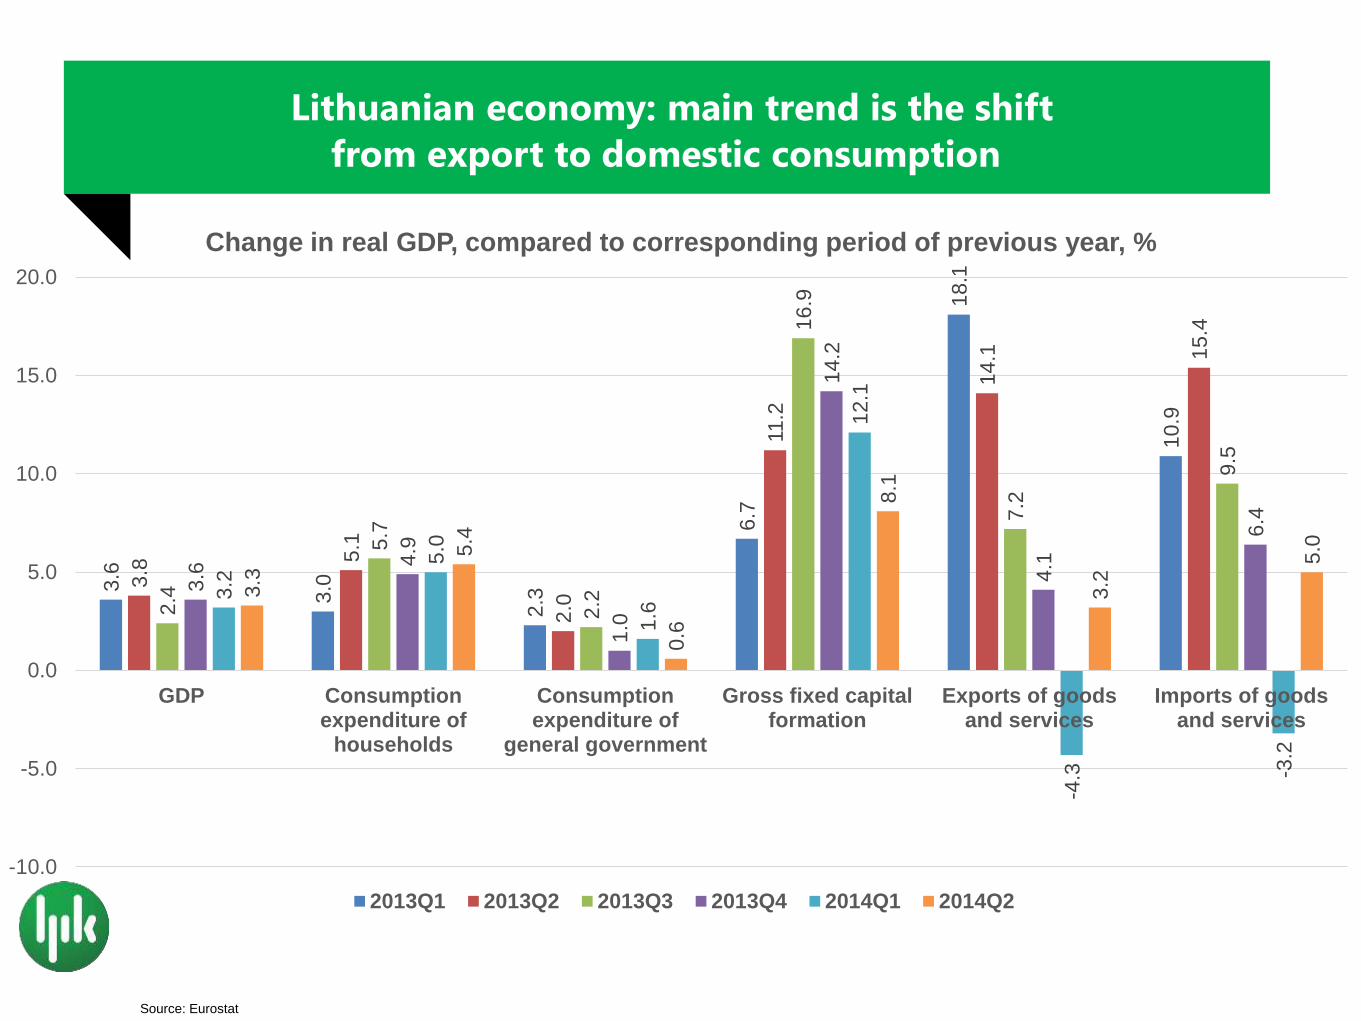
Lithuanian economy: main trend is the shift
from export to domestic consumption
Source: Eurostat
3.6
3.0
2.3
6.7
18
.1
10
.9
3.8
5.1
2.0
11.2
14.1 1
5.4
2.4
5.7
2.2
16
.9
7.2
9.5
3.6
4.9
1.0
14
.2
4.1
6.4
3.2
5.0
1.6
12
.1
-4.3 -3
.2
3.3
5.4
0.6
8.1
3.2
5.0
-10.0
-5.0
0.0
5.0
10.0
15.0
20.0
GDP Consumptionexpenditure of
households
Consumptionexpenditure of
general government
Gross fixed capitalformation
Exports of goodsand services
Imports of goodsand services
Change in real GDP, compared to corresponding period of previous year, %
2013Q1 2013Q2 2013Q3 2013Q4 2014Q1 2014Q2

Worsening consumer expectationspose a threat to growth in consumption
Source: Lithuanian Statistics Department
-60
-50
-40
-30
-20
-10
0
200
8M
01
200
8M
05
200
8M
09
200
9M
01
200
9M
05
200
9M
09
201
0M
01
201
0M
05
201
0M
09
201
1M
01
20
11
M0
5
201
1M
09
201
2M
01
201
2M
05
201
2M
09
201
3M
01
201
3M
05
201
3M
09
201
4M
01
201
4M
05
201
4M
09
Consumer Confidence Index
-70
-60
-50
-40
-30
-20
-10
0
10
20
200
8M
01
200
8M
05
200
8M
09
200
9M
01
200
9M
05
200
9M
09
201
0M
01
201
0M
05
201
0M
09
201
1M
01
201
1M
05
201
1M
09
20
12
M0
1
201
2M
05
201
2M
09
201
3M
01
201
3M
05
201
3M
09
201
4M
01
201
4M
05
201
4M
09
Economic projections
-40
-20
0
20
40
60
80
100
200
8M
01
200
8M
05
20
08
M0
9
200
9M
01
200
9M
05
20
09
M0
9
201
0M
01
201
0M
05
20
10
M0
9
201
1M
01
201
1M
05
20
11
M0
9
201
2M
01
201
2M
05
201
2M
09
201
3M
01
201
3M
05
201
3M
09
201
4M
01
201
4M
05
201
4M
09
Labor market projections

Level of productive investment must be increased
Source: Eurostat
10.7 10.7
9
7.5 7.4 7.37 7 6.9 6.9 6.7
6.2 6.1 5.95.6 5.4
5 4.9
0
2
4
6
8
10
12
Cze
ch
Re
pu
blic
Esto
nia
Slo
va
kia
Austr
ia
Luxem
bu
rg
Slo
ve
nia
Italy
Sw
ed
en
Den
mark
Malta
Lithuan
ia
Euro
zo
ne
Spain
EU
-28
Latv
ia
Ne
the
rla
nd
s
Fin
land
Fra
nce
Share of investments into machinery and equipment to GDP, 2014, %

Export will continue to grow, but export geography will change:Business Expectations - Purchasing Managers Index by LPK for Q4, 2014
Source: Lithuanian Confederation of Industrialists
79
53
58
36
0
10
20
30
40
50
60
70
80
90
2014 Q3 (2014 first half) 2014 Q4 (2014 second half)
Export projections
Manufacturing Transport
76
55
62
47
0
10
20
30
40
50
60
70
80
Manufacturing Transport
Business expectations index
2014 Q3 2014 Q4
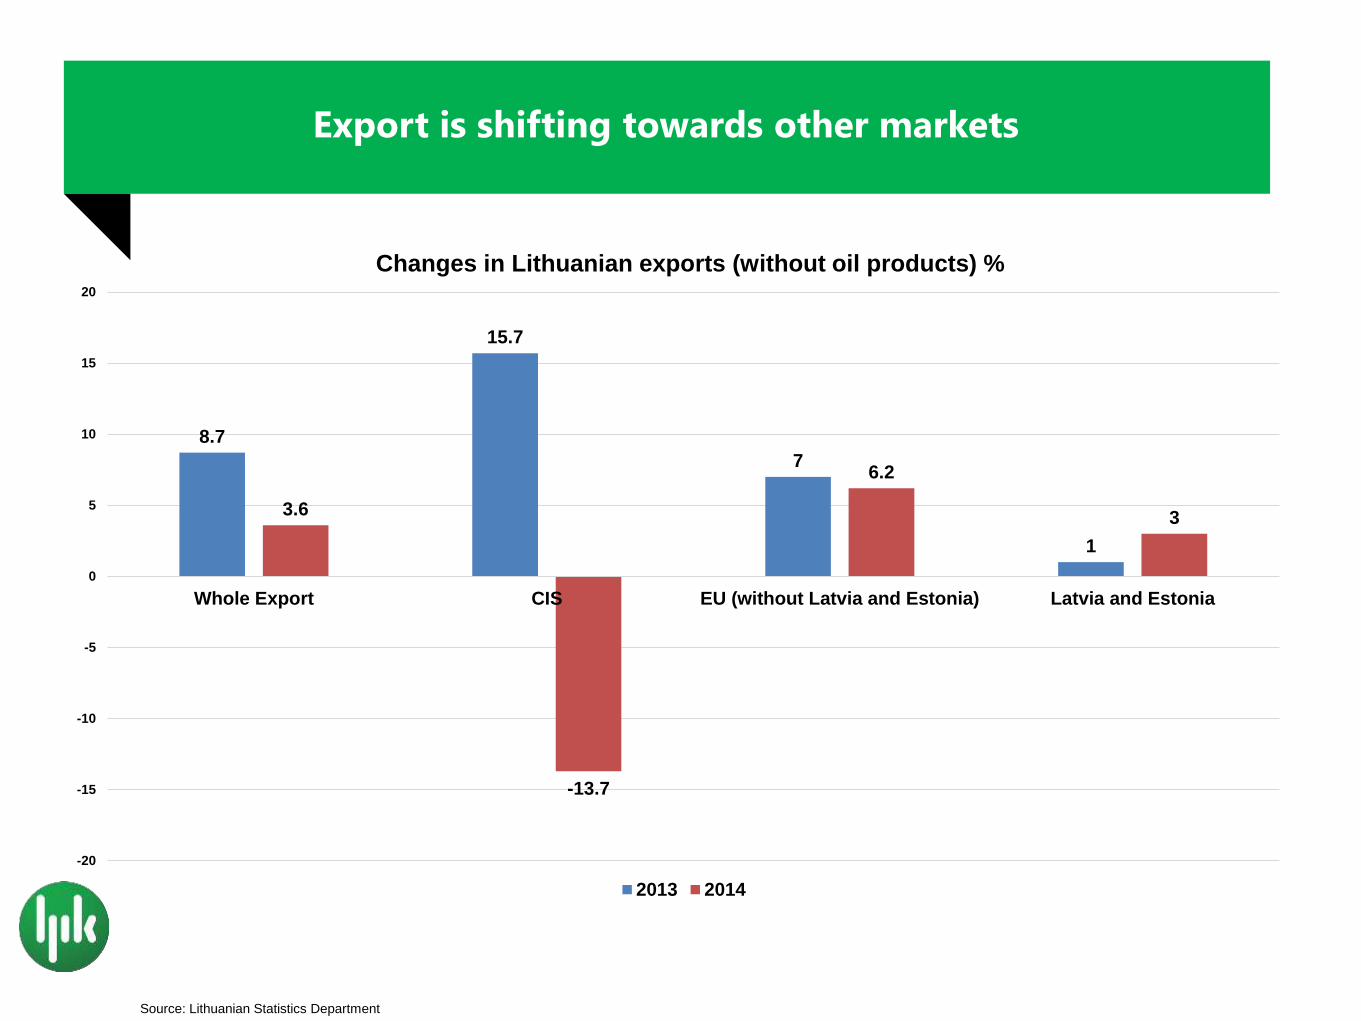
Export is shifting towards other markets
Source: Lithuanian Statistics Department
8.7
15.7
7
1
3.6
-13.7
6.2
3
-20
-15
-10
-5
0
5
10
15
20
Whole Export CIS EU (without Latvia and Estonia) Latvia and Estonia
Changes in Lithuanian exports (without oil products) %
2013 2014

Export to Russia is affected by sanctions andearlier long term negative economic trends in Russia
Source: Lithuanian Statistics Department
21.2%
11.8%20.3%
64.8%
-5.0%-1.4%
3.0%
13.6%
-14.00% -12.60%-6.20%
-30.30%
13.90%
-55.80%
-0.10%
-11.60%
-80.00%
-60.00%
-40.00%
-20.00%
0.00%
20.00%
40.00%
60.00%
80.00%
Foodproduction
Chemicalproduction,
plastics
Wood Textile andleather
Metals,machinery
Vehicle Other products Total Export
Change in export of goods of Lithuanian origin to Russia in 2014, compared to corresponding period of previous year, %
2013 2014

Impact of EU-Russia sanctions will be felt more in transport sector due to the influence of re-export
Source: Lithuanian Confederation of Industrialists
39%
65%
61%
35%
0%
10%
20%
30%
40%
50%
60%
70%
80%
90%
100%
Manufacturing Transport
Will Russian sanctions and general economic situation in CIS region have
an impact on your company’s business? %
YES NO
17.70%
46.90%
82.30%
53.10%
0%
10%
20%
30%
40%
50%
60%
70%
80%
90%
100%
Manufacturing Transport
Do EU sanctions against Russia have an impact on your company?
YES NO

2014 EU-Russia sanctions: effect on business
Source: Lithuanian Confederation of Industrialists
41.4%
31.0%
20.7%
3.4%3.4%
How sanctions and general situation in CIS region have affected your company?
Decrease in turnover
Decrease in turnover through third countries
Comodity prices and final prices scissors
Contract termination
Devaluation of Russian Ruble
• Revenue not received till the end of the
year 2014: ~ 200 mln EUR
• Profit not received till the end of the
year 2014: ~10 mln EUR
• Profit/Revenue not received means
money that would have been received
under normal trade conditions between
Lithuania and Russia
• Business will remain profitable despite
sanctions but with less profit margins

Lithuanian business is diversifying geography of exports:other CIS markets and new markets outside EU and CIS
Source: Lithuanian Confederation of Industrialists
62.5%12.5%
12.5%
12.5%
What actions does your company take to reduce the effect of sanctions?
Search for new markets outside CISand EU bordersSearch for new markets in CISregionLimit investments
Increase in efficiency, reduction incosts

Lithuanian business rediscovers new markets in other CIS countries
Source: Lithuanian Statistics Department
153.63
136.29
27.8 26.0219.29
1.610
20
40
60
80
100
120
140
160
180
Arm
enia
Kir
ghiz
ia
Azerb
aija
n
Ta
dzh
ikis
tan
Tu
rkm
enia
Uzbekis
tan
Change in export of Lithuanian origin (excl. oil products) in 2014, compared to corresponding
period of previous year, %
Armenia: beginning of wooden products
exports, increasing exports of food and
chemical products
Kirghizia: promising beginning of sugar
exports
-13.9-15.1
17.9
-20
-15
-10
-5
0
5
10
15
20
CIS Traditional CIS New CIS markets
Change in export of Lithuanian origin (excl. oil products) in 2014, compared to corresponding period of previous
year, %

New export markets for diary products: Hong Kong, China, ASEAN region, MENA region, Kazakhstan, Azerbaijan
Source: Lithuanian Statistics Department
11.5% 12.7%
-9.5%
153.2%
20.8%
41.2%
16.0% 17.3%
-11.3%
49.3%
-20.0%
0.0%
20.0%
40.0%
60.0%
80.0%
100.0%
120.0%
140.0%
160.0%
180.0%
To
tal m
ilk e
xp
ort
EU
-28
CIS
Re
st of th
e w
orl
d
Cen
tral E
uro
pe
Scandin
avia
n m
ark
et
Peri
ph
ery
EU
cou
ntr
ies
Latv
ia a
nd E
sto
nia
Tra
ditio
nal C
IS m
ark
ets
New
CIS
mark
ets
Changes in export of diary products in 2014, compared to corresponding period of previous year, %

New export markets for meat producers: Hong Kong, China, ASEAN region, MENA region, Kazakhstan
Source: Lithuanian Statistics Department
3%
16%
-27%
165%
17%22%
40%
2% -27%
49%
-50%
0%
50%
100%
150%
200%
To
tal m
eat e
xport
EU
-28
CIS
Rest of th
e w
orl
d
Cen
tral E
uro
pe
Scandin
avia
n m
ark
et
Peri
phe
ry E
U c
ountr
ies
Latv
ia a
nd E
sto
nia
Tra
ditio
nal C
IS m
ark
ets
New
CIS
mark
ets
Changes in export of meat products in 2014, compared to 2013, %

Export diversification: business recommendations to Lithuanian authorities
Source: Lithuanian Confederation of Industrialists
36
21
13
13
8
8
3
What actions are expected from the Government?
Export promotion to markets outside EUand CIS
Reduce costs of energy
Take steps to stabilise geopolitical andbusiness environment in CIS
Improve Lithuanian business environment(taxation, beurocrasy, labor relations)
Implement responsible social policy
Faster utilisation of 2014-2020 EU structuralfunds
Support from Lithuanian embasies

Export diversification and Economic Diplomacy Council:joint effort of Government and Business
1. 27 priority markets identified;
2. Focus must shift to new markets outside EU and CIS regions in order to
achieve smooth and sustainable export diversification: up to 5-7 further
priority markets selected;
3. Export strategy and exact recommendations how to develop priority markets
should be developed;
4. Lithuanian diplomatic representation outside EU and CIS regions will be
strengthened;
5. Financial schemes on export promotion and export insurance must be
introduced and expanded;
6. LPK-DI and LPK-Business Sweden initiative. The goal is creating a platform
and synergy for deeper cooperation between Lithuanian as well as Danish
and Swedish companies, use DI and Business Sweden network and
services abroad to develop new and emerging markets.

Lithuanian economy: main challenges and recommendations (1)
1. Demographic challenges (declining workforce, low fertility rates, rising dependency
ratio, aging population)
• It is time to start implementing smart immigration policy.
2. Education: current education system is not reflecting the needs of business and
challenges of global economy.
3. :Export structure: dominated by EU (60% of Lithuanian export) and CIS (30% of
Lithuanian export) regions, while export to emerging markets outside EU and CIS
regions remains relatively very low:
• Lithuanian diplomatic representation in emerging markets (China, ASEAN,
MENA) must be strengthened and expanded;
• Export promotion schemes must be expanded in order to achieve sustainable
export diversification.

Lithuanian economy: main challenges and recommendations (2)
4. Chronic problems of business environment (taxation, bureaucracy, labor relations).
Taxation:
• Labor taxation is too high – unemployment trap in Lithuania has reached 70%;
• Tax administration in Lithuania is too difficult. Number of tax payments a year
– Lithuania: 11; Latvia: 7; Estonia: 7. In Lithuania it takes 170 hours a year to
declare taxes and make tax payments;
• Lithuania must climb into top 25 countries based on paying taxes criteria
(Latvia occupies 24th place, Lithuania – 44th place, Estonia – 28th place;
• Taxation system must be competitive and stimulate FDI and domestic
investment growth. Amount of tax payments and time required to pay taxes
must be decreased;
• Labor taxation must be decreased.

Lithuanian economy: main challenges and recommendations (3)
4. Chronic problems of business environment (taxation, bureaucracy, labor relations).
Bureaucracy:
• Bureaucratic burden in Lithuania is the biggest among Baltic states - World
Economic Forum’s Competitiveness index places Lithuania in 105th place on
bureaucratic burden criteria. Latvia and Estonia – 79th and 19th place
respectively among 144 countries;
• World Economic Forum’s Competitiveness index places Lithuania in 101th
place on bureaucratic burden impact on FDI criteria. Latvia and Estonia – 36th
and 17th place respectively among 144 countries;
• Lithuania must climb into top 20 countries based on bureaucracy burden
criteria.

Lithuanian economy: main challenges and recommendations (4)
4. Chronic problems of business climate (taxation, bureaucracy, labor relations). Labor
relations:
• Lithuanian labor market relations are not flexible enough, and make it more
difficult for business to react to changing economic conditions;
• World Economic Forum’s Competitiveness index places Lithuania in 125th
place on hiring and firing criteria. Latvia and Estonia – 50th and 12th place
respectively among 144 countries;
• Unemployment trap in Lithuania has reached 70%;
• Regulations on working hours, hiring and firing rules must be relaxed and
simplified. Labor taxation must be decreased;
• Lithuania must climb into top 15 countries based on hiring and firing practice
criteria – flexibility of labor market

Lithuanian economy: main challenges and recommendations (5)
4. High level of shadow economy:
• Implement smart and sensible taxation policies – unproportionally high
consumption taxation (e.g. alcohol, fuel excise duties) stimulate consumers to
move into illegal consumption
5. Trends in energy costs pose a threat to overall competitiveness of economy:
• Energy price must not be higher compared to neighboring countries;
• Business must be further included into development and analysis of energy
strategies;
• Integration of Lithuanian energy system into European must be completed.

Ačiū už dėmesį!Thank you for the attention!

Additional information

Domestic consumption is the main driver of GDP growth
Source: Lithuanian Statistics Department
3.8
-19.1
-10
5.1
3.4
4.96.2
-25
-20
-15
-10
-5
0
5
10
2008K2 2009K2 2010K2 2011K2 2012K2 2013K2 2014K2
Change in retail trade compared to corresponding period of previous year, %
6.2
5.1
3.6
10.9
4.1 4
5.6
3.6
0
2
4
6
8
10
12
201
4M
01
201
4M
02
201
4M
03
201
4M
04
201
4M
05
20
14
M0
6
201
4M
07
201
4M
08
Change in retail trade compared to corresponding period of previous year, %

Sanctions will have small impact on employment
Source: Lithuanian Statistics Department, Lithuanian Confederation of Industrialists
5% 5%4%
14%
17%
11%
18%
22%
14%16%
19%
13%13%
16%
11%12%
13%
10%11%
13%
9%
0
0.05
0.1
0.15
0.2
0.25
Totalunemployment
Male Female
Unemployment rate
2008Q2 2009Q2 2010Q2 2011Q2
2012Q2 2013Q2 2014Q217
59
49
100
22
40
0
20
40
60
80
100
120
Railroadsinfrastructure
Roadinfrastructure
Portinfrastructure
Air transportinfrastructure
Other transportservices
Transport
Transport: employment projections
65
56
7076
52
6459
26
58
87
6469 70
59
0
10
20
30
40
50
60
70
80
90
100
Food andbeverageindustry
Textile andclothingindustry
Wood andfurnitureindustry
Metal andmachinery
industry
Chemicalindustry
Electricsindustry
Manufacturing
Manufacturing: employment projections
2014 Q3 2014 Q4

Rising uncertainty has impacted investment
Source: Lithuanian Statistics Department
2.5
10.1
12.1
17.116
18.2
15.1
16.8
23.4
27.4
5.2
2.1
0
5
10
15
20
25
30
Total investments Acquisition of equipment, machinery, transport vehicles
Change in investment, compared to corresponding period of previous year, %
2013K1 2013K2 2013K3 2013K4 2014K1 2014K2

Wages continue to increase
Source: Lithuanian Statistics Department, Lithuanian Confederation of Industrialists
93
66
58
78
65
7572
44
53
100
30
60
0
20
40
60
80
100
120
Railroadsinfrastructure
Roadinfrastructure
Port infrastructure Air transportinfrastructure
Other transportservices
Transport
Transport: wage projections
2014 m. Q1Q2 2013 m. Q3Q4
76
67
8882
79
68
78
45
7075
5754
67
55
0
10
20
30
40
50
60
70
80
90
100
Food andbeverageindustry
Textile andclothingindustry
Wood andfurnitureindustry
Metal andmachinery
industry
Chemicalindustry
Electricsindustry
Manufacturing
Manufacturing: wage projections
2014 Q3 2014 Q4
5.4
2.9
5.4
3.8
7.46.66.2
5.5
4.2 4.54.9 5.2
0
2
4
6
8
Nominal Real
Change in wages, compared to corresponding period of previous year, %
(total economy)
2013Q1 2013Q2 2013Q3 2013Q4 2014Q1 2014Q2
4.8
2.4
3.9
2.4
6.25.4
54.3
3.9 4.25 5.3
0
1
2
3
4
5
6
7
Nominal Real
Change in wages, compared to corresponding period of previous year, %
(manufacturing)
2013Q1 2013Q2 2013Q3 2013Q4 2014Q1 2014Q2