Literacy Boost South Africa Baseline Report · Literacy Boost Baseline Report 1 . Literacy Boost...
29
Literacy Boost Baseline Report 1 Literacy Boost South Africa Baseline Report August 2012 Ntonto N. Vezi, Melinda van Zyl, Suzanne Wessels, , Lebohang Mokoena, David Onunda, and Amy Jo Dowd With special thanks to Save the Children staff and our team of enumerators: Mathulo Ramathe, Pule Hlatshwayo, Sithole Josy, Dumisi Krefisi, Moloi Lekgula, Dumisani Maphosa, Lebo Mokoena, Gatebe Nomvula, Mtshawe Nthabiseng, Radebe Paulosi, and Lizzie Xaba
Transcript of Literacy Boost South Africa Baseline Report · Literacy Boost Baseline Report 1 . Literacy Boost...

Literacy Boost Baseline Report
1
Literacy Boost South Africa Baseline Report
August 2012
Ntonto N. Vezi, Melinda van Zyl, Suzanne Wessels, , Lebohang Mokoena, David Onunda, and Amy Jo Dowd
With special thanks to Save the Children staff and our team of enumerators: Mathulo Ramathe, Pule Hlatshwayo, Sithole Josy, Dumisi Krefisi, Moloi Lekgula, Dumisani Maphosa, Lebo Mokoena, Gatebe Nomvula, Mtshawe Nthabiseng, Radebe Paulosi, and Lizzie Xaba

Literacy Boost Baseline Report
2
Executive Summary Between May 27th and June 7th, 2012, 275 grade 2 students in 14 primary schools in the Nketoana and Maluti A Phofung municipalities in the Free State of South Africa participated in a reading skills and habits survey. Children in seven of these schools will receive the Literacy Boost pilot program, so this report serves as the baseline. Literacy Boost includes teacher training, community reading activities, and age-appropriate local language material creation to support emergent literacy skills among early-grade children. Skills assessed include basic concepts about print, and letter awareness through reading fluency, accuracy, and comprehension in Sesotho, Isizulu and English. As part of Literacy Boost, students are periodically assessed in each of these skills through an adaptable assessment tool to inform programming and estimate program impact. This report investigates Literacy Boost schools and comparison school comparability, and trends in students’ reading skills and how to student background and home literacy environment affect them in ways important for shaping Literacy Boost programming. The comparison and Literacy Boost samples are similar on all reading skills measures as well as all but very few background variables, suggesting that the group of comparison students represents a satisfactory counterfactual for testing the impact of Literacy Boost. The data further highlight some of the strengths Literacy Boost can build upon and some of the challenges the program team will face in this population of children: 1. Few reading materials written for children (comics, coloring books, and stories) are available; 2. Between 25 and 40 percent of children are not routinely read to, told stories or helped with
homework; 3. A focus for many students on the mastery of all letters and sounds in their home language will be
central to ensuring children make progress in reading words; supporting children to tackle words with double consonants and vowels might be a useful focus for a model lesson on phonemic awareness during Literacy Boost teacher training implementation.
4. Literacy Boost should also aim help students expand their English vocabulary and support the weakest students to strengthen their English letters and decoding as well.
5. The most consistent predictor of reading skills at baseline was socioeconomic status as measured through possessions in the home and type of housing material in the child’s home. Each and every skill in both languages shows this positive relationship: the higher the child’s socioeconomic status, the higher his/her reading skill scores. Literacy Boost
6. Repetition was the next most consistent predictor of skills in a consistently negative relationship: if a child repeated first or second grade, his/her scores were lower.
7. Household literacy measures related to skills included the presence of materials, storytelling and encouraging children to study – but these were primarily predictive of skills in the mother tongue and not English.
8. Finally, knowing a child’s sex often contributed to the prediction of scores, often in conjunction with SES, revealing in many skills how challenged the poorest girls and boys are in these schools.
Through reading camps and parent workshops, Literacy Boost can promote the creation of reading materials to build home resources. Further, community and school book banks can promote borrowing to enhance variety of books in all children’s lives. If Literacy Boost can alter some of the key predictors – presence of materials, literacy interactions at home – for example, then at endline we can investigate whether these resources relate to greater skills and how well we served the poorest, the repeaters, and those with fewer literacy interactions before we started.

Literacy Boost Baseline Report
3
Table of Contents Introduction.............................................................................................................................................................4
Methods ....................................................................................................................................................................4
Sampling ................................................................................................................................................................4
Measurement ........................................................................................................................................................5
Analysis ..................................................................................................................................................................5
A Note about Benchmarks ..................................................................................................................................5
Analysis: Comparability between Literacy Boost and Comparison Students .........................................6
Analysis: Baseline Results of Reading Skills by Sub-Test ........................................................................... 10
Concepts about Print ........................................................................................................................................ 11
Letter Awareness ............................................................................................................................................... 11
Vocabulary: Most Used Words ........................................................................................................................ 11
Fluency, Accuracy and Comprehension in Home Language ....................................................................... 12
Fluency, Accuracy and Comprehension in English ........................................................................................ 13
Analysis: Relationships between student background, household literacy and reading skills ........... 15
Conclusion ............................................................................................................................................................ 24
Appendix A: Multilevel Regression Analysis of Reading Skills.................................................................. 25
Literacy Boost Baseline Report
4
Introduction This report examines the results of a student background survey and reading assessment conducted between May 27th and June 7th, 2012. The survey and reading assessment covered 273 grade 2 students in seven primary schools receiving Save the Children (SC)’s Literacy Boost program as well as seven nearby comparison primary schools in the Nketoana and Maluti A Phofung municipalities in the Free State of South Africa. The Literacy Boost pilot program includes teacher training, community reading activities, and age-appropriate local language material creation to support emergent literacy skills among early-grade children. These skills include concepts about print, letter awareness, reading fluency, reading accuracy, and reading comprehension. As part of Literacy Boost, students are periodically assessed in each of these skills through an adaptable assessment tool to inform programming and estimate program impact. The data gathered from these schools is analyzed to present a snapshot of the emergent literacy skills of grade 2 students in these schools and to inform the adaptation of SC’s Literacy Boost program to this context. The key research questions to be explored in this report include the following:
1. How comparable are students in Literacy Boost schools versus comparison schools, in terms of background characteristics and home literacy environment?
2. What can the baseline tell us about students’ emergent reading skills? What does this mean for Literacy Boost programming?
3. How do students’ reading skills vary by student background and home literacy environment? To investigate these questions, this report will first describe the research methods used; including sampling, measurement, and analysis. Next, the comparability of Literacy Boost and comparison students will be tested through clustered t-tests. The report will then examine students’ scores for each of the emergent literacy skills, investigating where students exhibit strengths and weaknesses in each skill. Finally, the report will explore current relationships between learning and student background or home literacy practices & environment using multilevel regression analysis and pose hypotheses for testing at endline. Methods Sampling The sample for this baseline assessment encompasses 275 grade 2 students, divided between seven Literacy Boost schools (n = 138) and six nearby government comparison schools (n = 137). The seven Literacy Boost schools chosen for baseline assessment were those selected by SC South Africa country office staff to receive the Literacy Boost program based on the finding from the 2010 Strengthening Our Schools needs assessment which indicated an urgent need to improve Foundation Phase Literacy outcomes. The seven comparison schools were selected based on their proximity to the target schools as well as the perceived similarity between the quality of instruction offered at schools, and learners’ home and socio-economic conditions. These schools generally share the same environment as Literacy Boost schools. Literacy Boost and comparison schools had received no intervention targeted at improving reading outcomes prior to this baseline. Target schools participate in Save the Children’s Strengthening Our Schools’ project, which aims to improve quality of teaching, learning environments, school management and governance and district authorities’ capacity to provide support to whole

Literacy Boost Baseline Report
5
school development. Comparison schools do not benefit from any intervention that aims to improve reading outcomes, other than routine state teacher training, as is the case for target schools. The data collection team set out to sample 20 children in grade 2 at each of the Literacy Boost and comparison schools. Students were randomly selected where there were more than 20 children in the classroom. This approach would stratify the sample by gender so that boys and girls would each comprise 50% of each school sample. However, this was the case in just six of fourteen schools, while in six schools the 20 children consist of all of the boys/girls (between 7-9) and enough of the other sex to make 20 (between 11-13); and in two schools there were not 20 children available. The smallest number of one sex in any classroom was 6, and only 11 boys were sampled for a census of that small classroom. Overall, there are 137 boys (68 in comparison and 69 in Literacy Boost schools) and 138 girls (69 each in Literacy Boost and comparison schools) in the sample. Measurement The students in the sample were asked about their background characteristics (age, household possessions, household building materials, etc.). Students were also asked whether or not they had eaten breakfast the morning of the assessment, and students’ height and weight were measured. Finally, students were asked about their family members and their reading habits in the week prior to the assessment (who they had seen reading, who had read to them, etc). After collecting this background data, all students were also given an emergent literacy test composed of six components administered through five sub-tests: concepts about print, letter awareness, vocabulary (reading of most used words), reading fluency & accuracy (words per minute read correctly and total percentage of passage read correctly, both within the same sub-test), and either reading comprehension questions for those who could read independently or oral comprehension questions for those who could not. The vocabulary, fluency & accuracy, and comprehension sub-tests were conducted in both the child’s home language (Sesotho or Isizulu) and English. Twenty-five children across two schools took the assessment in Isizulu; while the remaining children took it in Sesotho. All assessments instructions were given in the child’s home language. Analysis To test the comparability of Literacy Boost and comparison samples, this report will use comparison of means through t-tests with clustered standard errors to account for the grouping of students within schools. Summary statistics, accompanied by clustered t-tests, will be used to analyze students’ performance in each of the five literacy sub-tests. Finally, this report will look to multilevel regression models to explore relationships between literacy skills and student background characteristics and home literacy environment. A Note about Benchmarks While Save the Children has used this approach to reading assessment and intervention in Malawi, Nepal, Mali, Pakistan, Ethiopia, Uganda, Zimbabwe, Bangladesh, and Mozambique, comparison across countries and languages is less helpful than more detailed contextual information for setting expectations of impact. For each measure used in these assessments, the upper end of the range of scores can be used to consider what is currently possible among these children. Table 3 in the analysis section presents the scores at the 75th percentile of each measure from this baseline assessment. These

Literacy Boost Baseline Report
6
75th percentile scores will constitute the benchmarks which the Literacy Boost program will attempt to help students achieve by the time of endline assessment. Analysis: Comparability between Literacy Boost and Comparison Students First, this report will investigate the comparability of the two samples: comparison students and Literacy Boost students. For child background and home literacy environment characteristics, clustered t-tests reveal that both groups are statistically similar on all background measures and all but two home literacy environment measures: having newspapers and having coloring books at home. In each case, fewer Literacy Boost students have these than comparison school students. As these represent the only significant results found, in general it appears the comparison and Literacy Boost samples are comparable. Table 1 displays the mean student background values for each variable by sample group (comparison versus Literacy Boost students), none of which are significantly different between the groups. The students are about eight years old on average, more than three quarters have attended early-childhood development (ECD) programs, and between a quarter and a third have repeated at least one grade. The grade repetition difference between comparison students and Literacy Boost students is not significant, but does exhibit significance in multilevel analysis as will be discussed in subsequent sections.
Table 1: Background Characteristics by Sample Group Child Background Characteristics Comparison Literacy Boost N 137 138 Age 7.91 8.20 % female 50% 50% % native language is Sesotho 82% 100% % have attended ECD program 84% 74% % attend multigrade school 29% 37% % have repeated at least one grade 27% 33% Number of family members in household 3.49 3.69 Number of amenities (of 5) 3.90 3.51 % with iron household roof 66% 66% % who do chores at home 47% 45% time spent studying (in minutes) 9.17 12.56 Height in centimeters 122.37 123.73 Weight in kilograms 23.60 23.66 Body Mass Index 15.76 15.36 % stunted (height-for-age zscore<-2) 15% 17% % wasting (weight-for-age zscore<-2) 7% 9% % malnourished BMI-for-age zscore<-2) 5% 8% % had eaten breakfast 94% 86% % who report feeling healthy 84% 82%

Literacy Boost Baseline Report
7
All Literacy Boost students speak Sesotho as their native tongue, while 25 (18%) of comparison school students speak Isizulu at home. In terms of their household composition, students live with three or four other family members and three or four of five common amenities in the region (bike, electricity, refrigerator, toilet and television). Two thirds of students report living under a roof made of iron sheets. Finally, nearly half do chores, 18 percent spending less than a half hour and 19 percent spending more than an hour. On average they spend less than 15 minutes studying each day. Looking at their health status, the children stand 1.2 meters tall, and weigh 23.6 kilograms on average with a body mass index (BMI) between 15 and 16. Worrying, are the percentages of children whose height-for-age, weight-for-age and BMI-for-age falls two standard deviations below the WHO average for each age, 1 meaning that they are stunted (15% of comparison students, 17% of Literacy Boost students), wasting (7% of comparison students, 9% of Literacy Boost students) or malnourished (5% of comparison students and 8% of Literacy Boost students). These challenges are equally present in both groups. An increasing body of research links stunting to poor cognition,2 so Literacy Boost should aim to accommodate any special needs of the stunted child population in this area. Turning to the home literacy environment, Figure 1 shows that many children report having several different types of reading materials at home, although there are relatively fewer children’s materials like stories, coloring books and comics. The Materials Creation component of Literacy Boost can help households increase all types of reading materials, but can most effectively improve the home literacy environment by increasing the prevalence of the types of materials most engaging to children: comics, coloring books, and stories.
Figure 1. Percentage of children with each types of reading material at home by group
* indicates statistically significant difference from comparison group at the 5% level
1 See http://www.who.int/growthref/en/ 2 See, for example, Berkman et. al. (2002), Walker et. al. (2007), and Crookston et. al. (2010).
75%
83%
71%
70%*
50%
49%*
15%
60%
75%
61%
51%
41%
30%
8%
0% 10% 20% 30% 40% 50% 60% 70% 80% 90%
textbooks
religious books
magazines
newspapers
stories
coloring books
comics
Literacy Boost School Comparison School

Literacy Boost Baseline Report
8
In each set of bars, it is graphically clear that fewer children in Literacy Boost schools have each type of material at home and the difference for newspapers and coloring books is statistically significant. Overall, Literacy Boost school students report having 3.26 material types at home on average as compared to 4.11 material types on average in comparison school students’ homes. Table 2 reports average scores on home literacy environment measures. No statistical differences exist between comparison and LB students, further suggesting that the group of comparison students represents a satisfactory counterfactual for testing the impact of Literacy Boost.
Table 2: Home Literacy Environment by Sample Group Literacy interactions in the past week Comparison Literacy Boost % of family members seen reading 72% 73% % of family members who helped/encouraged study 72% 74% % of family members who read to child 60% 61% % of family members who told the child a story 61% 56%
Nearly three quarters of students have seen a family member read in the past week, and about 60% have been read to by a family member in the same time period. These numbers indicate that while many children have a rich literacy environment, between 25 and 40 percent of these children do not routinely have these supports in their homes. Literacy Boost can improve their opportunities to practice skills through encouraging more reading among community members, and offering more opportunities for reading. After presenting the skill levels for each group, we’ll consider current relationships between these indicators and reading skills in the multilevel analyses and what they mean for optimal reading development support through Literacy Boost. Considering boys and girls, there are no background or home literacy environment characteristics on which they differ significantly. To disaggregate by both sample group and gender, we use Tukey-Krammer post-hoc pairwise comparison tests, and find that significantly more comparison school girls have chores washing, cooking and cleaning than both Literacy Boost girls and all boys; and that Literacy Boost girls spend significantly more time on chores than all peer groups. In relation to possessions and reading materials in the home, in Figure 2, Literacy Boost boys report having significantly fewer reading materials than comparison peers, while Literacy Boost girls have significantly fewer possessions than comparison boys.

Literacy Boost Baseline Report
9
Figure 2. Reading materials and possessions group and gender
* indicates statistically significant difference from comparison group at the 5% level
All of these subgroup comparisons require testing in multilevel models to determine their possible relationship with current skill levels and implications for program targeting.
4.16
3.964.03
3.86
2.96*
3.563.543.45*
2.5
3.0
3.5
4.0
4.5
average types of reading materials at home
average possessions (of 5)
Comparison boys
Comparison girls
Literacy Boost boys
Literacy Boost girls
Literacy Boost Baseline Report
10
Analysis: Baseline Results of Reading Skills by Sub-Test Table 3 presents an overview of mean scores on each sub-test for comparison and Literacy Boost students. There is no Literacy Boost group that speaks Isizulu at home, so the gray boxes indicate the lack of group for comparison. Because in Sesotho and English, no differences between the two groups exist, we conclude that the Literacy Boost and comparison group are similar and an appropriate sample for testing the impact of Literacy Boost.
Table 3: Baseline Reading Scores by Sample Group and Benchmarks
Comparison Literacy Boost
75th Percentile Benchmark
Concepts about Print 8.68 8.79 11 Letters 33.96 34.19 40 Sesotho (n=248)
Most used words 14.77 14.47 20 Fluency 31.81 27.09 47 Accuracy 65.28 60.71 97.37 Comprehension 2.53 2.35 4
Isizulu (n=25) Most used words 15.26 20 Fluency 16.84 25 Accuracy 92.10 94.87 Comprehension 2.96 4
English (n= 273) Most used words 8.81 7.50 14 Fluency 20.62 10.72 27 Accuracy 39.12 26.58 88.99 Comprehension 1.22 1.12 2
Due to the lack of detailed benchmarks or competencies for the literacy skills of grade 2 children in South Africa, the upper range of scores is used to consider what is currently possible among these children. The final column of Table 3 presents the scores at the 75th percentile of this sample of students. This means that if you line up 100 children from the highest to the lowest score on an element of the assessment, the first child is above the 99th percentile; the 25th child on line is above the 75th percentile. This means that he/she has scored higher than 75 percent of the children in the line. As an initial goal for Literacy Boost, children should be performing at this level or better by the end of the school year. We’ll now review each skill and implications of analysis for programming.

Literacy Boost Baseline Report
11
Concepts about Print The first sub-test of the reading assessment consisted of 12 ‘concepts about print’ (CAP) questions. These questions concern familiarity with books – where to start, which way to read, what is a letter, what is a word, etc. As can be seen in Figure 3, Comparison and Literacy Boost students scored very similarly on this sub-test, answering nearly eighty percent of questions correctly on average. Thirty-seven percent of the students scored 100 percent correct. In general, most students are comfortable with the physical components of books and text, but more practice reading and having stories read to them and discussion of how stories are structured within books will support full mastery for more children by school year’s end. Letter Awareness The next sub-test examined students’ letter awareness. Students are shown a chart of all uppercase letters and asked to name the letter, pronounce the letter sound, or give a word that begins with that letter. Then the same is done with lowercase letters for a total of 52 possible. As with concepts about print, students in both comparison and Literacy Boost schools performed similarly on this sub-test, identifying two thirds of letters correctly on average. The most difficult letters appear to be uppercase Y, W, X, Q and C and lowercase q, x, y, w, and v. The most readily identified letters included uppercase L, M, A, B, S, as well as lowercase a, k, m, and e. No student demonstrated perfect mastery of the alphabet, and 15 percent know only half of all 52 letters. Literacy Boost will aim to help all students learn all of their letters so they can become more fluent decoders.
Vocabulary: Most Used Words The most used words (MUW) sub-test consists of a chart of twenty words that the student is asked to read. These words were identified as ‘most used’ by tabulating the number of times a word appeared in students’ Sesotho or Isizulu and English textbooks. There is a separate list for each language and the students took the test in both their home language and English. The results in Figure 4 indicate that students on average could read 60-80 percent of most used words in their home language but less than half of the 20 English words on average.
80%
66%
79%
65%
0%10%20%30%40%50%60%70%80%
Concepts about Print Letters
Figure 3. Percent Concepts about Print and Letters Correct
Literacy Boost Comparison

Literacy Boost Baseline Report
12
No statistically significant differences exist between comparison and Literacy Boost students. In Sesotho, shebile, titjhere, mmele and kreiti were the most difficult words read correctly by only 60-67 percent of students, and buka, sekolong, bala and rata were the easiest read correctly by nearly 80 percent of students. Note that the hard words have double consonants and vowels, while the latter do not. Supporting children to tackle such words might be a useful focus for a model lesson on phonemic awareness during Literacy Boost teacher training implementation. In Isizulu, ayikwazanga, epulazini, and engikwazi were the hardest read by 60-72 percent of students, while ijuba, funda, and uthisha were all read correctly by 88 percent of Isizulu speakers. In English, saw, eat, all and like were read correctly by fewer than a third of students, while the, don’t, swim, and school were read correctly by half of students. It is clear that Literacy Boost should aim help students expand their English vocabulary. Fluency, Accuracy and Comprehension in Home Language Fluency (words per minute read correctly) accuracy (total words read correctly), and comprehension (# of questions answered correctly of 5) are presented together here because they are measured together in a single sub-test in which students read a passage aloud and answer questions about it. The number of words students read correctly in a minute is tracked for fluency. As the student continues to read after the first minute, the total number of words read correctly from the passage as a whole, no matter how long it takes the student, is computed for accuracy. Figure 5 below shows that students in comparison schools outperformed those in Literacy Boost schools in Sesotho and English reading, but these differences were not statistically significant. On average, students read about 27-32 words per minute correct in Sesotho, and Isizulu speakers read 17 words per minute.
72%
38%
74% 76%
44%
0%
10%
20%
30%
40%
50%
60%
70%
80%
Sesotho (n=248) Isizulu (n=25) English (n= 273)
Figure 4. % of Most Used Words Read Correctly
Literacy Boost
Comparison

Literacy Boost Baseline Report
13
Students were able to accurately read a over 60 percent of the Sesotho passage on average, or about 68 words, and nearly all of the Isizulu passage. Interestingly, the isizulu speakers read their home language with 92 percent accuracy, much higher than their Sesotho-speaking peers; although their comprehension was only slightly higher at 59 percent. Fluency, Accuracy and Comprehension in English When it comes to English language skills, Figure 6 shows that these are developing more slowly than mother tongue skills as expected. While Literacy Boost students lag behind comparison students, the differences are not statistically significant. On this subtest, nearly half of the students were unable to read any words of the English passage at all.
27.1
60.7
47.0
31.8
65.3
50.6
16.8
92.1
59.2
0
10
20
30
40
50
60
70
80
90
100
Fluency (wpmc)
Accuracy(%)
Comprehension(%)
Fluency (wpmc)
Accuracy(%)
Comprehension(%)
Sesotho (n=248) Isizulu (n=25)
Figure 5. Sesotho and Isizulu fluency, accuracy and comprehension by group
Literacy Boost
Comparison
10.7
26.622.420.6
39.1
24.2
05
10152025303540
Fluency (wpmc)
Accuracy(%)
Comprehension(%)
English (n= 275)
Figure 6. English fluency, accuracy and comprehension by group
Literacy Boost
Comparison

Literacy Boost Baseline Report
14
Figure 7 shows that while the majority of comparison students were able to read at least one word from the passage, many fewer Literacy Boost students could do so. While the difference in Figure 7 is also not statistically significant, it is a clear call for Literacy Boost to support the weakest students to strengthen their English letters, decoding and vocabulary to begin to read
connected text with fluency and accuracy. Among the twenty-five students whose mother tongue is Isizulu, there was a marked difference in their English reading skills as compared to Sesotho-speaking peers as 68 percent had nonzero scores for fluency. Figure 8 details these differences in English fluency, accuracy and comprehension by home language.
While in this small sample the difference in accuracy is not statistically significant, this greater skill could be the result of more exposure, more practice or better teaching in English, a topic for further investigation. It could also be the result of school-specific factors relating to such greater exposure and not a relationship to which local language at all. Regardless of this source, it is clear that some children are struggling in this second language and that Literacy Boost should aim to support learners of all languages to master reading skills in both languages of instruction.
19.23
61.86
22.815.05
29.8 28.8
0
10
20
30
40
50
60
70
Fluency (wpmc)
Accuracy (%) Comprehension (%)
Figure 8. English fluency, accuracy and comprehension by home language
Isizulu-speakers
Sesotho-speakers
41%
57%
0%10%20%30%40%50%60%
English Fluency > 0
Figure 7. % of Students with Nonzero English Fluency Scores
Literacy Boost
Comparison

Literacy Boost Baseline Report
15
Analysis: Relationships between student background, household literacy and reading skills This final section explores the results of a series of multilevel regressions accounting for clustering of students within schools. Student background variables collected include: age, sex, socioeconomic status (SES), health status, repetition history, and chores/workload. Household literacy measures included both materials and current reading-related habits: reading aloud, seeing people read, helping with homework and telling stories. To arrive at the most relevant regression model, the significance of student background and home literacy environment variables was tested as in both univariate and combined multivariate models, using reading skill sub-tests as the dependent variables. The variables that did not demonstrate individual significance in these models were tested for joint significance through F-tests. Due to the sample of Isizulu-speakers is so small, no significant trends were uncovered and these subtests are not presented in this section. Appendix A presents the results of the final model for each skill excluding the variables that did not show either individual or joint significance. The following sections use these models to explore factors that influence reading skills and their implications for Literacy Boost programming. It should be noted that these relationships convey correlation, not causation: they are statistically related but we do not have evidence that these factors cause higher/lower scores. To establish such causation requires further research and/or endline analysis. The most consistent predictor of reading skills at baseline was socioeconomic status as measured through possessions in the home and type of housing material in the child’s home. Each and every skill in both languages shows this positive relationship: the higher the child’s socioeconomic status, the higher his/her reading skill scores. Repetition was the next most consistent predictor of skills in a consistently negative relationship: if a child repeated first or second grade, his/her scores were lower. The exception to this was Sesotho fluency among girls where a higher score is predicted if the girl has repeated second grade. Household literacy measures related to skills included the presence of materials, storytelling and encouraging children to study – but these were primarily predictive of skills in the mother tongue and not English. Finally, knowing a child’s sex often contributed to the prediction of scores, often in conjunction with SES, revealing in many skills how challenged the poorest girls and boys are in these schools. Figure 9 shows that home literacy and an interaction between socioeconomic status and sex predict concepts about print. This model controls for health status and explains 17.96 percent of the variation in CAP scores.

Literacy Boost Baseline Report
16
Boys of each category of socioeconomic status are predicted to demonstrate mastery of fewer concepts about print than girls of the same group. High SES boys (dark blue line) and medium SES girls (bright blue line) have very similar scores. The upward trend of each line shows that the more family members who tell stories to the child, the higher the predicted CAP score. All boys, especially those from economically challenged households, as well as children in homes where family members don’t tell stories regularly might benefit from access to more books and reading opportunities so that they become more familiar with books and master these concepts of print. Not depicted in Figure 9 above is a finding related to the importance of eating breakfast for girls: those who had no breakfast scored significantly lower than those who ate the day of the assessment. Literacy Boost parent workshops can promote eating a good breakfast consistently as one possible route to improved school performance among children, especially girls.3
3 Evidence of the cognitive and school achievement benefits of breakfast and breakfast programs has been observed in developing countries. See, for example, Powell, Walker, Chang, and Grantham-McGregor (1998) and Jacoby, Cueto, and Pollitt (1998).
55%
60%
65%
70%
75%
80%
85%
none one in three two in three
family members tell stories to child
Figure 9. Percent of concepts about print correct by sex, socioeconomic status and home literacy
girl hi ses
boy hi ses
girl med ses
boy med ses
girl low ses
boy low ses
7.397.91
8.43
5.37
0123456789
boy girl
Figure 10. Concepts About Print Score by sex and breakfast
breakfast
no breakfast
Literacy Boost Baseline Report
17
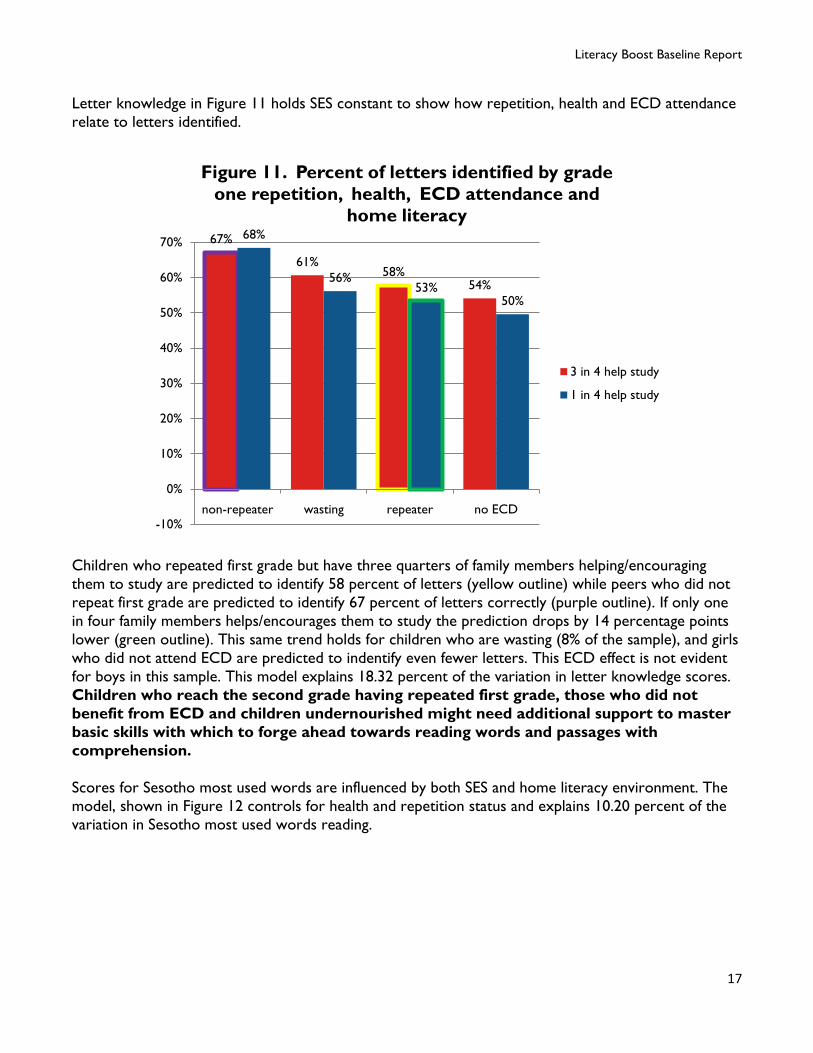
Letter knowledge in Figure 11 holds SES constant to show how repetition, health and ECD attendance relate to letters identified.
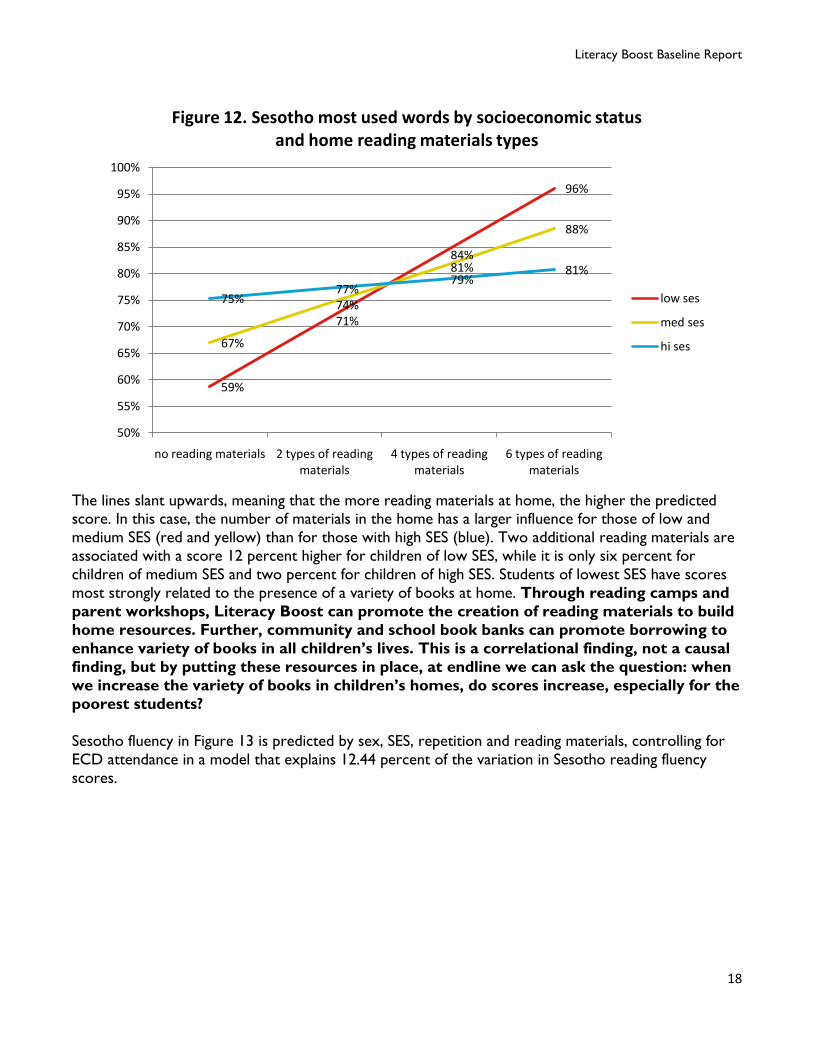
Children who repeated first grade but have three quarters of family members helping/encouraging them to study are predicted to identify 58 percent of letters (yellow outline) while peers who did not repeat first grade are predicted to identify 67 percent of letters correctly (purple outline). If only one in four family members helps/encourages them to study the prediction drops by 14 percentage points lower (green outline). This same trend holds for children who are wasting (8% of the sample), and girls who did not attend ECD are predicted to indentify even fewer letters. This ECD effect is not evident for boys in this sample. This model explains 18.32 percent of the variation in letter knowledge scores. Children who reach the second grade having repeated first grade, those who did not benefit from ECD and children undernourished might need additional support to master basic skills with which to forge ahead towards reading words and passages with comprehension. Scores for Sesotho most used words are influenced by both SES and home literacy environment. The model, shown in Figure 12 controls for health and repetition status and explains 10.20 percent of the variation in Sesotho most used words reading.
67%
61%58%
54%
68%
56%53%
50%
-10%
0%
10%
20%
30%
40%
50%
60%
70%
non-repeater wasting repeater no ECD
Figure 11. Percent of letters identified by grade one repetition, health, ECD attendance and
home literacy
3 in 4 help study
1 in 4 help study
Literacy Boost Baseline Report
18
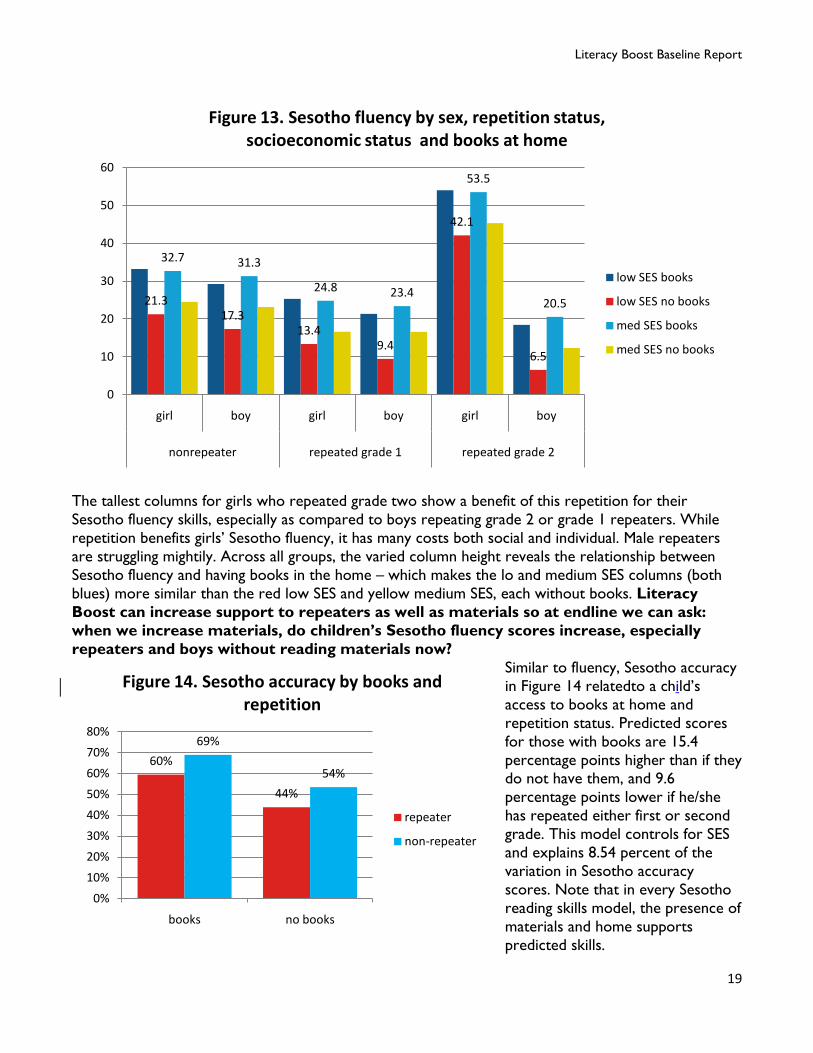
The lines slant upwards, meaning that the more reading materials at home, the higher the predicted score. In this case, the number of materials in the home has a larger influence for those of low and medium SES (red and yellow) than for those with high SES (blue). Two additional reading materials are associated with a score 12 percent higher for children of low SES, while it is only six percent for children of medium SES and two percent for children of high SES. Students of lowest SES have scores most strongly related to the presence of a variety of books at home. Through reading camps and parent workshops, Literacy Boost can promote the creation of reading materials to build home resources. Further, community and school book banks can promote borrowing to enhance variety of books in all children’s lives. This is a correlational finding, not a causal finding, but by putting these resources in place, at endline we can ask the question: when we increase the variety of books in children’s homes, do scores increase, especially for the poorest students? Sesotho fluency in Figure 13 is predicted by sex, SES, repetition and reading materials, controlling for ECD attendance in a model that explains 12.44 percent of the variation in Sesotho reading fluency scores.
59%
71%
84%
96%
67%
74%
81%
88%
75%77%
79%81%
50%
55%
60%
65%
70%
75%
80%
85%
90%
95%
100%
no reading materials 2 types of reading materials
4 types of reading materials
6 types of reading materials
Figure 12. Sesotho most used words by socioeconomic status and home reading materials types
low ses
med ses
hi ses
Literacy Boost Baseline Report
19
The tallest columns for girls who repeated grade two show a benefit of this repetition for their Sesotho fluency skills, especially as compared to boys repeating grade 2 or grade 1 repeaters. While repetition benefits girls’ Sesotho fluency, it has many costs both social and individual. Male repeaters are struggling mightily. Across all groups, the varied column height reveals the relationship between Sesotho fluency and having books in the home – which makes the lo and medium SES columns (both blues) more similar than the red low SES and yellow medium SES, each without books. Literacy Boost can increase support to repeaters as well as materials so at endline we can ask: when we increase materials, do children’s Sesotho fluency scores increase, especially repeaters and boys without reading materials now?
Similar to fluency, Sesotho accuracy in Figure 14 relatedto a child’s access to books at home and repetition status. Predicted scores for those with books are 15.4 percentage points higher than if they do not have them, and 9.6 percentage points lower if he/she has repeated either first or second grade. This model controls for SES and explains 8.54 percent of the variation in Sesotho accuracy scores. Note that in every Sesotho reading skills model, the presence of materials and home supports predicted skills.
21.317.3
13.49.4
42.1
6.5
32.7 31.3
24.8 23.4
53.5
20.5
0
10
20
30
40
50
60
girl boy girl boy girl boy
nonrepeater repeated grade 1 repeated grade 2
Figure 13. Sesotho fluency by sex, repetition status, socioeconomic status and books at home
low SES books
low SES no books
med SES books
med SES no books
60%
44%
69%
54%
0%10%20%30%40%50%60%70%80%
books no books
Figure 14. Sesotho accuracy by books and repetition
repeater
non-repeater

Literacy Boost Baseline Report
20
The final model of Sesotho reading skills echoes the factors that predict its predecessors: sex, socioeconomic status, reading materials, and home support. Held constant in Figure 15 are SES, ECD attendance, health status, classroom type and study time in a model that explains 16.27 percent of the variation in Sesotho comprehension scores. Interestingly, girls in multi-grade classrooms are expected to have Sesotho reading comprehension ten percentage points higher than those in single grade classrooms.
The greater the material variety and support to study from family members in a child’s home, the greater the predicted Sesotho comprehension score. Girls lag substantially behind boys, at this low level of SES and each respective level. Literacy Boost can support greater materials availability, and promote family involvement in learning to aim for enhanced Sesotho comprehension. Turning to English reading of words and texts, home literacy environment factors are no longer central, but repetition and SES continue to influence scores. In Figure 16, non-repeaters in the top two lines significantly outperform repeaters by 3.39 words (19%) on average (the distance between the red and light blue or yellow and dark blue lines).
9%
27%
16%
33%
18%
36%
25%
42%
27%
44%
34%
51%
0%
10%
20%
30%
40%
50%
60%
girl boy girl boy
1 in 4 help study 3 in 4 help study
Figure 15. Sesotho comprehension by sex, home material variety and support
no reading materials
2 types of reading materials
4 types of reading materials

Literacy Boost Baseline Report
21
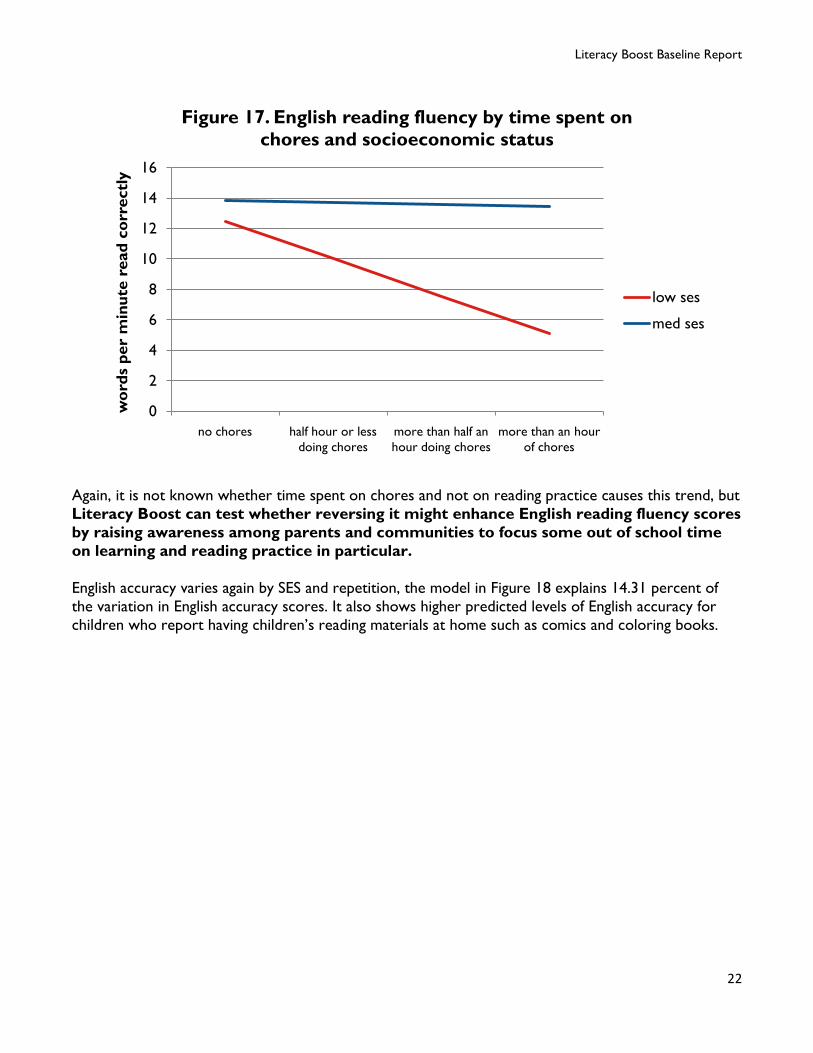
In addition, children of high SES are predicted to thrive in single grade classrooms, while those of low SES do so in multi-grade classrooms. For example, a non-repeater in a multi-grade classroom (dark blue line) reads 44 percent of the English words correctly if she is of low SES and 38 percent if of high SES. Her colleague in a single grade classroom (red line) reads 40 percent if of low SES and nearly 47 percent if of high SES. This analysis cannot detail the mechanism through which this operates. Perhaps in multi-grade classrooms all children are exposed to more readers of varying skills and more fluent readers of English than in a single grade classroom, or perhaps multi-grade classrooms are smaller allowing more teacher attention and access to materials. It is unclear why this is so, but it merits both further study and attention to better support for learning to read English for everyone since the highest level represented here is less than half of the 20 words correct. Overall, there is great progress to be made. Special attention for repeaters and the most economically challenged children in single grade classrooms can aim to reverse these trends. At endline we can ask: when we support repeaters and those economically challenged, especially in single grade classrooms, do English most used words reading scores improve? In predicting English fluency, sex, repetition and socioeconomic status again feature alongside an interaction between SES and time spent doing chores. Figure 17 shows that the predicted English reading fluency for children of medium SES is the same regardless of their time spent on chores. For children of low SES, the higher their reported time for chores each day, the lower their predicted English reading fluency.
40%
47%44%
38%
21%
28%26%
20%
15%
20%
25%
30%
35%
40%
45%
50%
low ses medium ses high ses
% r
ead
corr
ectl
y (o
f 20)
Figure 16. Percent English most used words correct by repetition, classroom type and SES
single grade classroom,non-repeater
multigrade classroom, non-repeater
single grade classroom, repeater
multigrade classroom, repeater
Literacy Boost Baseline Report
22
Again, it is not known whether time spent on chores and not on reading practice causes this trend, but Literacy Boost can test whether reversing it might enhance English reading fluency scores by raising awareness among parents and communities to focus some out of school time on learning and reading practice in particular. English accuracy varies again by SES and repetition, the model in Figure 18 explains 14.31 percent of the variation in English accuracy scores. It also shows higher predicted levels of English accuracy for children who report having children’s reading materials at home such as comics and coloring books.
0
2
4
6
8
10
12
14
16
no chores half hour or less doing chores
more than half an hour doing chores
more than an hour of chores
wor
ds p
er m
inut
e re
ad c
orre
ctly
Figure 17. English reading fluency by time spent on chores and socioeconomic status
low ses
med ses

Literacy Boost Baseline Report
23
Here too we see that older children are predicted to have lower fluency – 4.7 percentage points lower per year of age. Attention to older learners might be merited to ensure all children meet Literacy Boost’s 75th percentile goal. Finally, predicting English comprehension in Figure 19 features not only repetition and sex, but family member support in helping to study. Boys with more support at home are predicted to answer 28% of English comprehension questions correctly if they are non-repeaters and 17% if they are repeaters with great support or non-repeaters without support. The spread of reading models and supporters,
and English reading support across the community is important for both oral language development and reading skills. If this resource is scarce in some areas, then Literacy Boost can support camps and community gatherings to extend it as far as possible.
20.77
40.66
29.31
16.06
3.77
15.63
35.52
24.61
10.91
6.72
0
5
10
15
20
25
30
35
40
45
non-repeater comics coloringbooks 9 year old repeater
Figure 18. English accuracy by socioeconomic status, repetition reading materials and age
med ses
lo ses
26%
6%
17%
5%
27%
7%
28%
17%
0%
5%
10%
15%
20%
25%
30%
girl nonrepeater
girl repeater boy nonrepeater
boy repeater
Figure 19. English comprehension by sex, repetition and family support
1 in 4 family members help study
3 in 4 family members help study

Literacy Boost Baseline Report
24
Conclusion This baseline report finds that Literacy Boost groups are statistically similar on all measures of student background characteristics, all but two measures of home literacy environment. This suggests that the group of comparison students represents a satisfactory counterfactual for testing the impact of Literacy Boost. The data further highlight some of the strengths Literacy Boost can build upon and some of the challenges the program team will face in this population of children: 9. Few reading materials written for children are widely available for these children (comics, coloring
books, and stories); 10. Between 25 and 40 percent of children are not routinely read to, told stories or helped with
homework; 11. A focus for many students on the mastery of all letters and sounds in their home language will be
central to ensuring children make progress in reading words; supporting children to tackle words with double consonants and vowels might be a useful focus for a model lesson on phonemic awareness during Literacy Boost teacher training implementation.
12. Literacy Boost should also aim help students expand their English vocabulary and support the weakest students to strengthen their English letters and decoding as well.
13. The most consistent predictor of reading skills at baseline was socioeconomic status as measured through possessions in the home and type of housing material in the child’s home. Each and every skill in both languages shows this positive relationship: the higher the child’s socioeconomic status, the higher his/her reading skill scores. Literacy Boost
14. Repetition was the next most consistent predictor of skills in a consistently negative relationship: if a child repeated first or second grade, his/her scores were lower.
15. Household literacy measures related to skills included the presence of materials, storytelling and encouraging children to study – but these were primarily predictive of skills in the mother tongue and not English.
16. Finally, knowing a child’s sex often contributed to the prediction of scores, often in conjunction with SES, revealing in many skills how challenged the poorest girls and boys are in these schools.
Through reading camps and parent workshops, Literacy Boost can promote the creation of reading materials to build home resources. Further, community and school book banks can promote borrowing to enhance variety of books in all children’s lives. While this report shows a range of correlational findings, not causal findings, if Literacy Boost alters some of the predictors – presence of materials, literacy interactions at home – for example, then at endline we can ask whether these resources relate to greater skills and how well we served the poorest, the repeaters, and those with fewer literacy interactions before we started.
Literacy Boost Baseline Report
25
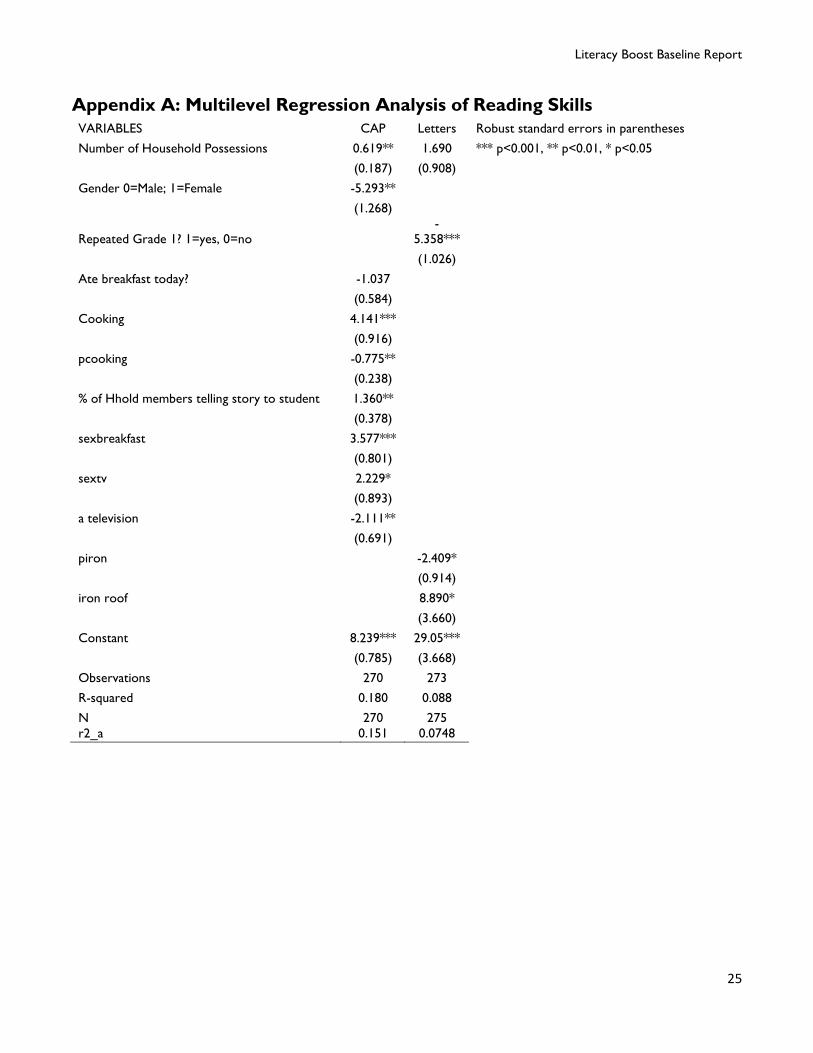
Appendix A: Multilevel Regression Analysis of Reading Skills VARIABLES CAP Letters Robust standard errors in parentheses
Number of Household Possessions 0.619** 1.690 *** p<0.001, ** p<0.01, * p<0.05
(0.187) (0.908)
Gender 0=Male; 1=Female -5.293**
(1.268)
Repeated Grade 1? 1=yes, 0=no
-5.358***
(1.026)
Ate breakfast today? -1.037
(0.584)
Cooking 4.141***
(0.916)
pcooking -0.775**
(0.238)
% of Hhold members telling story to student 1.360**
(0.378)
sexbreakfast 3.577***
(0.801)
sextv 2.229*
(0.893)
a television -2.111**
(0.691)
piron
-2.409*
(0.914)
iron roof
8.890*
(3.660)
Constant 8.239*** 29.05***
(0.785) (3.668)
Observations 270 273
R-squared 0.180 0.088
N 270 275 r2_a 0.151 0.0748

Literacy Boost Baseline Report
26
VARIABLES Sesotho MUW
Sesotho fluency
Sesotho accuracy
Sesotho comprehension
Number of Household Possessions 4.673*** 5.800** 0.173** 1.095**
(0.957) (1.827) (0.0495) (0.262)
Gender 0=Male; 1=Female
9.115
-1.648***
(5.284)
(0.348)
Repeated Grade 1? 1=yes, 0=no -3.367** -7.898**
(0.898) (2.462)
Repeated Grade 2? 1=yes, 0=no
-10.79*
(3.771)
Books at home?
19.34** 0.155*
(5.490) (0.0668)
Attended Creche/Preschool? 1=yes, 0=no
-11.17**
-0.596
(3.516)
(0.293)
roof + walls= house scale 2-8 2.814*
0.130* 0.544**
(1.053)
(0.0484) (0.162)
Multi-grade? 1=yes, 0=no
-0.631
(0.317)
Number of Household Members
0.0523**
(0.0145)
Number of reading materials at Home 2.315***
0.423*
(0.497)
(0.145)
pbooks
-3.721*
(1.351)
% of Hhold members helping study
0.651*
(0.254)
phouse -0.699*
-0.0385** -0.160**
(0.230)
(0.0118) (0.0437)
pnreadmats -0.534***
-0.0992*
(0.120)
(0.0384)
psex
-10.41***
(1.861)
psexecdattend
7.833***
0.387***
(1.374)
(0.0742)
pwasting
-0.523*
(0.223)
sexgr2rpt
31.61*
(10.41)
sexmultigrade
1.132**
(0.321)
How much time studying each day?
-0.0159*
(0.00651)
wasting, waz<-2
1.565*
(0.590)
Has Repeated a Grade
-0.0957*
(0.0431)
Constant -3.697 16.89* -0.233 -1.087
(4.308) (6.504) (0.241) (0.951)

Literacy Boost Baseline Report
27
Observations 249 244 243 241 R-squared 0.102 0.124 0.085 0.163 N 249 244 243 241 r2_a 0.0797 0.0868 0.0621 0.111 Robust standard errors in parentheses
*** p<0.001, ** p<0.01, * p<0.05

Literacy Boost Baseline Report
28
VARIABLES English MUW
English fluency
English accuracy
English comprehension
Number of Household Possessions 2.170** 7.757** 0.0515* 0.128
(0.594) (1.897) (0.0217) (0.0627)
Gender 0=Male; 1=Female
4.178 0.0646 0.703**
(3.183) (0.0644) (0.226)
Repeated Grade 1? 1=yes, 0=no -
3.688*** -
9.642**
(0.690) (2.660)
Repeated Grade 2? 1=yes, 0=no
5.959 0.0729
(6.465) (0.108)
Age
-0.0471*
(0.0190)
Do you do chores at home?
0.136*
(0.0530)
Time doing chores at home
-7.098*
(3.285)
Colouring books
0.0854
(0.0555)
Comics
0.199*
(0.0727)
house scale 2-8
1.759
(1.512)
Multi-grade? 1=yes, 0=no 3.504
(1.980)
Number of Household Members
0.749
(1.348)
% of Hhold members helping study
1.112*
(0.398)
pgr2rpt
-4.327* -0.0810*
(1.714) (0.0303)
phouse
-0.919*
(0.367)
psexrpt
-0.148**
(0.0438)
pwasting
-0.526***
(0.109)
sexcoloringbks
-0.184**
(0.0556)
sexpcthelpstudy
-0.997*
(0.342)
wasting, waz<-2
1.373**
(0.431)
piron -1.499*
(0.519)
iron roof 5.374*
(2.304)
Has Repeated a Grade
-0.563*
(0.209)
pmultigrade -1.301*

Literacy Boost Baseline Report
29
(0.529)
pchoretime
2.325*
(0.927)
psexnhhold
-0.675*
(0.227)
Constant 1.245 -4.720 0.430 0.172
(2.930) (10.58) (0.221) (0.464)
Observations 274 268 274 270 R-squared 0.107 0.147 0.143 0.141 N 274 268 274 270 r2_a 0.0865 0.110 0.114 0.115 Robust standard errors in parentheses
*** p<0.001, ** p<0.01, * p<0.05