LITCHI RESOURCE MAPPING B - :: State Horticulture...
89
1 Litchi Resource Mapping Final Report 23/3/2010 Submitted to State Horticulture Mission, Bihar Prepared By: IL&FS Clusters Development Initiative Limited LITCHI RESOURCE MAPPING, BIHAR
Transcript of LITCHI RESOURCE MAPPING B - :: State Horticulture...

1
Litchi Resource Mapping Final Report
23/3/2010
Submitted to State Horticulture Mission, Bihar
Prepared By: IL&FS Clusters Development Initiative Limited
LITCHI RESOURCE MAPPING, BIHAR

2
Litchi Resource Mapping Final Report
Table of Contents
Executive Summary ..........................................................................................................................5
1. Introduction ..........................................................................................................................8
2. Resource Mapping: Objectives ........................................................................................... 12
2.1 Objectives ........................................................................................................................... 12
3. Resource Mapping: Methodology ....................................................................................... 13
3.1 Design of the study .............................................................................................................. 13
3.1.1 Selection of clusters for the study .................................................................................................. 13
3.1.2 Sampling ........................................................................................................................................ 15
3.1.3 Initial Quick Assessment ................................................................................................................ 15
3.1.4 Focused Group Discussion (FGD) ................................................................................................ 16
3.1.5 Questionnaire ................................................................................................................................. 16
3.2 Data Collection ................................................................................................................... 16
3.3 Analysis and Reporting ....................................................................................................... 17
3.4 Limitations of the Study...................................................................................................... 18
4. Pre and Post Harvest Management of Litchi ...................................................................... 20
4.1 Farm Management ............................................................................................................. 20
4.2 Important Pre-harvest management practices .................................................................... 20
4.2.1 Plant spacing ................................................................................................................................. 20
4.2.2 Analysis of soil and leaf ................................................................................................................. 21
4.2.3 Ploughing & Mulching .................................................................................................................. 21
4.2.4 Irrigation ........................................................................................................................................ 22
4.2.5 Application of fertilizers and other nutrients ................................................................................. 24
4.2.6 Seasonality calendar of pre-harvest management practices for litchi cultivation......................... 26

3
Litchi Resource Mapping Final Report
4.3 Harvest and Post harvest Management ............................................................................... 27
4.3.1 Harvesting/plucking ....................................................................................................................... 27
4.3.2 Grading and Packaging ................................................................................................................. 27
4.3.3 Storage and transportation ............................................................................................................ 28
4.3.4 Other management practices ......................................................................................................... 29
5 Litchi Value Chain .............................................................................................................. 30
5.1 Marketing channel .............................................................................................................. 30
5.1.1 Pre-harvest Contractors ................................................................................................................ 30
5.1.2 Direct Selling in local markets & to Processors ............................................................................ 31
5.2 Litchi Markets .................................................................................................................... 33
5.3 Litchi processing in Bihar ................................................................................................... 34
5.4 Economics of Litchi Production and Trade ......................................................................... 34
5.4.1 Cost of litchi Cultivation ................................................................................................................ 35
5.4.2 Consumer pricing of litchi (in Value Chain) ................................................................................. 36
6 Muzaffarpur ....................................................................................................................... 38
6.1 Overview of the district ....................................................................................................... 38
6.2 Litchi Area in Muzaffarpur ................................................................................................ 39
6.3 Litchi Varieties in Muzaffarpur .......................................................................................... 44
6.4 Production and Productivity in Muzaffarpur ..................................................................... 46
6.5 Litchi Orhcard Profile in Muzaffarpur .............................................................................. 47
7 Samastipur ......................................................................................................................... 48
7.1 Overview of the district ....................................................................................................... 48
7.2 Litchi Area in Samastipur .................................................................................................. 49
7.3 Litchi Varieties in Samastipur ............................................................................................ 52
7.4 Production and Productivity in Samastipur ........................................................................ 53

4
Litchi Resource Mapping Final Report
7.5 Litchi Orchard Profile in Samastipur ................................................................................. 54
8. Vaishali ............................................................................................................................... 56
8.1 Overview of the District ...................................................................................................... 56
8.2 Litchi Area in Vaishali ........................................................................................................ 57
8.3 Litchi varieties in Vaishali .................................................................................................. 60
8.4 Production and Productivity in Vaishali ............................................................................. 60
8.5 Litchi Orchard Profile in Vaishali ...................................................................................... 61
9 East Champaran ................................................................................................................. 63
9.1 Overview of the District ...................................................................................................... 63
9.2 Litchi Area in East Champaran .......................................................................................... 65
9.3 Litchi varieties in East Champaran .................................................................................... 67
9.4 Production and Productivity in East Champaran ............................................................... 67
9.5 Litchi Orchard Profile in East Champaran ........................................................................ 68
10 West Champaran, Darbhanga and Sitamarhi ..................................................................... 69
10.1 Overview of West Champaran ............................................................................................ 69
10.2 Litchi Resources in West Champaran ................................................................................. 70
10.3 Sitamarhi ............................................................................................................................ 72
10.4 Darbhanga .......................................................................................................................... 74
11 Conclusion and Recommendations ..................................................................................... 76
11.1 Estimate for the districts ..................................................................................................... 76
11.2 Recommendations ............................................................................................................... 77
Appendix I: Database of Farmers
Appendix III: Questionnaires
Appendix III: Case Studies

5
Litchi Resource Mapping Final Report
Executive Summary
Litchi may be regarded as one of the most prominent agricultural produces of Bihar in terms of
both visibility and the share of state in the national production. It is also a highly perishable
produce with harvesting season of hardly a month. Unlike the food grains, investment in
orchards is demanding as it involves vast resources and long gestation period. It is also felt that
litchi plantation and production have not been showing expected growth in recent years. It was
therefore decided by the Department of Agriculture, Government of Bihar to take up resource
mapping of Litchi. This is aimed at getting detailed information on various aspects of litchi
production and thus come up with effective measures to increase productivity and benefit litchi
growers
Detailed field work has been conducted in seven districts viz. Muzaffarpur, Vaishali, Samastipur,
East Champaran, West Champaran, Sitamarhi and Darbhanga to identify the extent and volume
of production. Viability of this sub sector has been gauged by assessing aspects like productivity,
existing inadequacies in the pre& post harvest stages, infrastructure, etc if any. The choice of
blocks (39 in total) and clusters has been made based on an initial quick assessment followed by
focus group discussions at the district level. Samples have been random and yet representative.
Various stakeholders like farmers, traders, pre harvest contractors, Department of Horticulture
(DoH) officials have been consulted and in-depth discussions held at various stages of the
exercise. The study confronted limitations due to lack of information on the basis of varieties,
poor cost estimates as function of weight and high temporal variations in the yield. Also, the fact
that most of the farm owners were not managing the farm has posed challenges in information
seeking.
The findings of the study can be broadly studied as general findings (covering the qualitative
aspects ranging from planting, land preparation, fertilizer application, irrigation to farm
management, marketing channels and price build up along the value chain) and findings specific
to the districts (quantitative data on production, area, etc) . It is found that most of the practices

6
Litchi Resource Mapping Final Report
pertaining to cultivation and marketing remain the same. The reason attributed to this being same
set of constraints across the districts. The main impediments in agricultural practice are stated
below.
• Lack of awareness among the farming community
• Varying interests of Farm Owners and farm managers Pre Harvest Contractors (PHCs) in
majority of the orchards. Almost, 70% of the orchards are leased out to PHCs at the time
of flowering.
• Far from satisfactory performance of extension machinery in most of the blocks.
The declining productivity is a matter of concern and the prime reason identified during the
study is plant spacing. The deviation from the recommendations in case of plant density is as
high as 50% in some of the districts.
The estimate of total acreage in all the 39 blocks studied stands at 13, 325 Ha while the total
number of plants is 17, 26,275 and total production is 1, 20,186 MT. The average productivity in
all these blocks is estimated as 9 MT/ Ha and per plant productivity is about 69.6 kg. The
estimate for Muzaffarpur is for the entire district as all the blocks were considered for resource
mapping while for other six districts, estimate is only for the blocks considered for study.
District Area
(Ha)
Number of
Plants
Production
(MT)
Productivity
per plant (Kg)
Productivity
(MT/Ha)
Muzaffarpur 7535 9,39,473 68027 72.4 9.0
Samastipur 1387 1,90,695 13583 71.2 9.8
Vaishali 2721 3,74,115 24033 64.2 8.8
East
Champaran
1117 1,53,602 10471 68.2 9.4
West
Champaran
343 41,140 2400 58.3 7.0
Sitamarhi 125 15,000 900 60.0 7.2
Darbhanga 98 12,250 772 63.0 7.9
Total 13,325 17,26,275 1,20,186 69.6 9.0

7
Litchi Resource Mapping Final Report
The overall estimate for the seven districts comprising all the blocks is 16,095 Ha for area and 1,
44, 882 MT for production and 9 MT/Ha for productivity as compared to the DoH data of 18,426
Ha, 1, 40,362 MT and 7.54 MT/Ha respectively.
It may be concluded from the study that there is immense scope for improving the production
and productivity of Litchi in Bihar. Also, the study points out a vast potential for exploring the
markets within and outside the country. Hence a need to plug the identified gaps in cultivation
aspects and infrastructure along the value chain is felt. Recommendations are made towards
strengthening the information dissemination.
Strengthening the extension machinery in order to educate farming community on best package
of practices is found to be essential. The data base built during this exercise could be utilized to
streamline field visits. Orchard owners could be organized into groups and field visits could be
organized to those blocks which are making headway in terms of technology adaptation and
scientific orchard management. The farmers in a few survey blocks are skeptical about adopting
soil and leaf testing and other recommended practices like spacing of plants, etc. Information
dissemination by the department shall play a crucial role in eliminating the skepticism. In order
to encourage the entrepreneurs and other players for venturing into sector specific interventions
like reefer vans, pack houses, processing facilities, etc timely availability of finance and
incentives is required. Information on the distant markets, export markets available, product
specifications, etc needs to be disseminated through awareness campaigns. Demand projections
and price trends could be shared with the trading community through specific information
dissemination kiosks.
It is recognized that this resource mapping exercise is just an effort to highlight issues which are
of utmost importance to various players. The set of recommendations mentioned in this report
though not exhaustive, will prove to be instrumental in providing the necessary direction for
policy interventions.

8
Litchi Resource Mapping Final Report
1. Introduction
The cultivation of Litchi is restricted to very few countries in the world, India being one among
them. India and China account for 91 percent of the world litchi production. According to
National Horticulture Board, in India about 428,900 MT of litchi is produced annually from
56,200 hectares. Within India too, the climatic requirements of this crop are exacting in nature
making the production limited to select states. Litchi occupies an important place in the
Horticulture landscape of Bihar owing to its geographic confinement and the magnitude of its
share to the overall production in the country.
Litchi cultivation provides both On-Farm and off farm employment to millions in Bihar and is
critical to the economy which is predominantly agrarian. Considering that Bihar is one of the
most populous states, such sub-sector which can intervene and promote livelihood sustenance
needs to be viewed with utmost importance.
According to the Directorate of Horticulture (DoH) database, Litchi is produced in 27 districts in
Bihar. Muzaffarpur is the largest litchi producing district with a production of 56,006 MT
followed by Vaishali at 26, 498 MT and Sitamarhi at 15,518 MT. West Champaran, East
Champaran and Katihar are other three districts having production of more than 10, 000 MT.
Figure 1.1 provides data on area and production of litchi in all the 27 litchi producing districts in
the state. Based on this information, these districts could be divided in four broad segments. The
first segment comprises of six districts, five of which are in Muzaffarpur region while one i.e.,
Katihar is in North Eastern region. These districts typically have more than 1300 Ha under Litchi
cultivation with Production over 10000 MT. The Second segment has districts with production
between 5000 and 10,000 MT and area between 600-1300 Ha. There are eight districts in this
segment. Third and fourth segments have ten and three districts respectively. The area and
production limits for these segments are given in figure 1.2.

9
Litchi Resource Mapping Final Report
Figure 1.1: Districts Producing Litchi in Bihar (Year: 2007-08)
Source: Directorate of Horticulture, Bihar
Figure 1.2: Litchi Regions in Bihar
Area (Ha) Production (MT) Districts
More than 1300 More than 10000 Muzaffarpur, Vaishali, Sitamarhi, East Champaran, West Champaran, Katihar
600-1300 5000-10000 Samastipur, Purnea, Siwan, Gopalganj, Saran, Sheohar, Darbhanga, Madhubani
100-600 1000-5000 Begusarai, Bhagalpur, Sharasa, Araria, Kishanganj, Khagaria, Munger, Jamui, Madhepur, Supaul
Less than 100 Less than 1000 Sheikhpura, Lakhisarai, Banka
Source: Directorate of Horticulture, Bihar

10
Litchi Resource Mapping Final Report
National Horticulture Board
database shows a declining trend
over a decade in volume of
production and almost constant trend
in area of cultivation for litchi in
Bihar. (Fig: 1.3 and Fig 1.4). While
the area under litchi cultivation
slightly increased from 23.5
thousand hectare in 1996-97 to 29.8
thousand hectare in 2007-08,
production fell by almost 20% from
282 thousand MT to 223 thousand
MT during this period due to
decrease in productivity from 12
MT per Ha to 7.2 MT per Ha. This
is an alarming trend considering the
significance of this crop.
At the post harvest stage, the various key players involved in the Litchi Value chain are faced
with myriad challenges owing to the nature of the produce, infrastructural inadequacies and
Market related aberrations. Few of the challenges are listed below.
• Short Window Period for Harvesting: Market arrival of Litchi begins in the last week of
April and ends by mid June.
• Price Discovery and Spread: Pre harvest contract of orchard is predominant. Since it is
short duration crop and there are storage constraints for the final produce, buyers
including processors try to cover maximum quantity during the peak season.
Accordingly, price spread is low and remain at the higher level during one month season
• Infrastructural gaps: Litchi requires low temperature atmosphere for transportation to
consumer market for which cold chain facilities are almost non-existent in Bihar.
Protecting the final produce from temperature shocks is critical to fetch better price in

11
Litchi Resource Mapping Final Report
distant markets. This is often cited as one of the major bottlenecks in marketing of Litchi.
Also, the current processing capacity is insufficient to cater to the value added market
and prolonging the shelf life.
• Untapped Export Potential: The Estimated export market of litchi is about 100,000 MT,
of which Europe, Hong Kong and Singapore account for about 35% of the market. Both
fresh and processed forms of litchi are in high demand and fetch very high price.
However, Bihar has been unable to tap the vast potential of both domestic and export
market due to various constraints.
In the light of the above discussion it can be deduced that information gaps both at macro
(declining production trends, untapped export markets, infrastructural gaps, etc) and micro
(technology adaptation in orchards, price discovery, etc) levels is the foremost challenge which
needs to be addressed. At present, information available about litchi is insufficient to provide a
clear understanding of the status of litchi as a product in terms of volume of production, acreage,
production practices, post-harvest handling, trading volumes and prevalent marketing system.
The government of Bihar recognizes the significance of Litchi Sector in the state and realizes the
existing informational gaps in the sector. At this critical juncture, a need for mapping relevant
resources in the sector and plugging the gaps has been felt. IL&FS CDI shares the vision of
Govt. of Bihar for the sector and conducted a resource mapping of litchi in seven districts in the
state. The ensuing section describes the key objectives and methodology of this exercise in
detail.
12
Litchi Resource Mapping Final Report
2. Resource Mapping: Objectives
Resource mapping is a system-building process that enables to identify existing resources and
match those resources to a specific purpose. This is aimed at facilitating suggestions for required
interventions for optimal utilization of resources for production, promotion of modern post-
harvest management and marketing facilities for litchi. The idea is to organize information and
provide direction for various organizations/ decision makers.
2.1 Objectives The study mainly focused on collecting and organizing information about production, acreage
under litchi cultivation, varieties being cultivated, productivity of the orchards, harvesting, post
harvest management, existing forward and backward linkages and suggesting a plan for optimum
utilization of the resources.
The main objectives of the study are:
• Mapping of major litchi producing districts/blocks and villages in the identified clusters
• Developing a status report on production in terms of region-wise acreage, volume,
varieties and age of the orchards
• Assessment of the existing practices vis-à-vis the recommended practices in -litchi
cultivation viz., planting, fertilizer and pesticide usage and irrigation
• Assessment of harvesting practices and post harvest handling of the produce
• Understanding the Current marketing channel with respect to number of intermediaries
involved and their roles; major markets for different varieties in terms of volume and
price.
• Ascertain infrastructural requirements and need for strengthening of linkages for
production system

13
Litchi Resource Mapping Final Report
3. Resource Mapping: Methodology
The methodology for litchi resource mapping consisted of various qualitative and quantitative
techniques. The study methodology can be discussed under three heads: design of the study,
data collection & analysis and reporting.
3.1 Design of the study
Designing the study methodology was the first and one of the most crucial stages of the resource
mapping exercise. This involved identification of the survey area, finalizing the blocks to be
studied, sample size and sampling methodology. Many deliberations were made at this stage
with the state government to arrive at the final blue print for the study. A two stage
assessment/survey with triangulation of information at each stage was agreed upon to be suitable
for the resource mapping exercise. This is primarily because of the complexity involved in
identification of the sample lack of historical data at block level. The two stages of the exercise
can be explained as below:
Stage I: Information from secondary sources formed the basis for identification of districts and
blocks at this stage. Quick assessment on the aptness of the blocks identified was made at this
stage. This was carried out by administering a one page questionnaire randomly and holding
Focus Group Discussions (FGD) at block Level
Stage II: Based on the findings from Stage I further changes in the sample areas (Inclusion/
Deletion of blocks/villages) and survey questionnaire were made.
3.1.1 Selection of clusters for the study
Muzaffarpur traditionally has been the nucleus of litchi production in this region. Almost all the
surrounding districts viz. Vaishali, Samastipur, Sheohar, East and West Champaran, Sitamarhi,

14
Litchi Resource Mapping Final Report
Darbhanga, produce litchi
in the areas adjacent to
Muzaffarpur. For this
study, six districts in
addition to Muzaffarpur
are selected.
It is emphasized that litchi
production is spread
throughout Muzaffarpur
district whereas in other
six districts, the production is concentrated only in few blocks. Hence, the mapping was
suggested for few selected blocks from six districts. Overall there are 34 blocks selected from 7
districts initially. Later, five more blocks were added after initial quick assessment and focused
group discussions in these districts.
Below mentioned is the list of blocks selected for the resource mapping of litchi:
Figure 3.1: Blocks Covered in Resource Mapping
Districts Blocks Blocks added after Initial Quick Assessment
Muzaffarpur Mushahari, Muraul, Sakara, Bandara, Gaighat, Bochahan, Aurai, Katara, Minapur, Sahebgun, Motipur, Kanti, Paroo, Saraiya, Madwan, Kudhani
Vaishali Bhagwanpur, Goraul, Lalganj, Vaishali, Mahua Belsar
Samastipur Pusa, Samastipur, Vibhutipur, Tajpur, Sarairanjan Rosera, Kalyanpur
East Champaran Mahesi, Chakiya Kalyanpur, Madhuban
Sitamarhi Dumra, Ruisaidpur
West Champaran Barian, Narkatiyaganj
Darbhanga Jale, Bahadurpur

15
Litchi Resource Mapping Final Report
3.1.2 Sampling
Two stage cluster sampling method was used to select orchards for the detailed survey. The
districts were divided into major blocks and the blocks selected for study were further grouped
into clusters. For geographical spread and sample representation, these clusters were further
divided at panchayat level as sub clusters. The samples were selected so as to obtain about 12-15
random samples from each of the sub clusters. Randomization was done at sub cluster level
without controlling for factors such as orchard size and random samples were collected at
farmer’s level.
Initial Quick assessment and Focus Group discussion formed the basis for adjusting the samples
and modifying the design in line with the research objectives. These are discussed in detail in
subsequent sub sections.
3.1.3 Initial Quick Assessment
As discussed earlier, the main purpose of the quick assessment was to confirm the choice of
blocks and aptness of sample for further stages of the study. A brief survey form was designed
and investigators were trained to administer the same. The initial assessment was conducted in
34 blocks in seven districts.
“Snow Ball” technique was adopted to identify the orchard owners. In this method, initial
contact was made with two traders in the region and leads of orchard owners were collected from
them. Each orchard owner contacted thereafter was requested to name 3-4 other orchard owners,
who were then contacted as per the availability. At this stage about 140 orchard owners were
contacted by the survey team.
The criterion for classification of orchards was revised after the initial quick assessment. The
orchards were classified on the basis of acreage in case of Muzaffarpur (as < 1 acre; 1-3 acre; 3-
10 acre and 10+ acres) and on the basis of no. of trees per orchard in case of the other six
districts (<50 trees, 50-200 trees, 200-500 trees and 500+ trees). Analysis of the data gathered
during this assessment formed the basis for focused group discussion and detailed survey.

16
Litchi Resource Mapping Final Report
3.1.4 Focused Group Discussion (FGD)
Focused Group Discussion was done with major stakeholders; farmers, traders, horticulture
officials at district level. The main outcomes of FGD are enlisted below:
• In Samastipur the initial list of blocks for study did not include Rosera and Kalyanpur
while both these are large litchi producing blocks of the district. Similarly, Belsar was
included in Vaishali whereas Madhuban and Kalyanpur were included in East
Champaran after FGD.
• The FGD in West Champaran portrayed that litchi cultivation in the district was picking
up at a very fast rate and farmers were planting new orchards for commercial purposes.
Hence two blocks were included for detailed survey. The field survey on the contrary
showed that mango is successfully grown and one or two litchi trees were planted for
domestic consumption purpose.
3.1.5 Questionnaire
The Agriculture experts designed the questionnaire based on the objectives of the study. To the
extent possible, the questionnaire was structured with close ended questions so as to minimize
the errors in data handling and analysis. Feedback of the experts from the Department of
Horticulture was sought before initiating the survey and the feedback was incorporated into the
questionnaire.
3.2 Data Collection
The important parameters covered in data collection are orchard size, production, productivity of
litchi cultivation, popular litchi varieties grown in the study area, farmers experience in litchi
cultivation, trend in area cultivated under litchi crops, production practices and technologies
adopted in litchi cultivation, gap in technology adoption and economic viability. The study
covered in detail the marketing and post harvest management practices. Farm to Farm survey of
Litchi growers is one of the main components of data collection wherein a structured

17
Litchi Resource Mapping Final Report
questionnaire was administered to 356 farmers in seven districts. In addition, discussion with
traders and few processors was also conducted. Figure 3.2 summarises the number of
respondents and average Litchi orchard size in each district covered during the survey.
Figure 3.2: District wise Respondent summary
District Number of Respondents Mean of Litchi Area (Acre)
Muzaffarpur 100 2.50
Samastipur 82 2.82
Vaishali 70 2.74
East Champaran 58 3.14
West Champaran 17 3.02
Darbhanga 15 1.50
Sitamarhi 14 1.75
356
3.3 Analysis and Reporting
Data collected at different levels from various sources was collated and consolidated for analysis.
MS Excel and statistical tools like SPSS were used extensively to analyse the data. Since the
primary data collected was mostly cross section data, the trend available is mostly from
secondary sources. The steps involved in arriving at estimators for area and production are
described below.
• Data collected at farmer’s level was consolidated for total area, average litchi orchard
size, number of plants (age wise), production/ productivity statistics.
• Secondary data was collected from Panchayati Raj Department for estimation of Total
area and Cultivable land in each block.
• Primary data was used to arrive at an estimate of proportion of Litchi area to the total
cultivable land in each block
• Estimates on production and productivity were arrived at by averaging the no. of plants
and average fruit weight and thereby yield per plant in each of the blocks.

18
Litchi Resource Mapping Final Report
IL&FS Clusters has submitted a draft final report enumerating the study on litchi resource
mapping and its findings. Feedback was sought from the department of Horticulture,
Government of Bihar. Feedback from the same has been incorporated in this document which is
the final report.
3.4 Limitations of the Study
While the primary objective of this study is to develop a strong database of various resources in
the Litchi Sub sector, the study team confronted some limitations during the mapping exercise.
The limitations are described in this section in order to sensitize those aspects which are to be
borne in mind while interpreting the findings of this study.
• Majority of the orchards are leased out on contract basis well before harvesting. While
few farmers manage the pre harvest operations there are many whose role ends after the
contract. Eliciting information during the interviews with orchard owners/ farmers was a
challenge as not all the respondents were aware of the current orchard management.
• Considering the diversity in the varieties being cultivated, information on the input usage
could have been more specific and customized as per the varieties. This is dimension was
captured only in general.
• Since the unit of sale at farm level is either no. of trees/ no. of fruits information on yield
is near to being accurate. Also, determination of price as a function of weight remained a
challenging task.
• The temporal yield variations are high. For example, the yield in 2009 is considered to be
low by 40% when compared to the previous year which recorded one of the all time high
yields. Averaging method was used to the extent possible to eliminate out liars. In some
instances it was observed that the respondents were confused over the yields.

19
Litchi Resource Mapping Final Report
Part II: Survey Findings

20
Litchi Resource Mapping Final Report
4. Pre and Post Harvest Management of Litchi
4.1 Farm Management
Farm management of orchard comprises of the entire process from plantation of sapling, pre-
harvest management to post harvest management and any other practice which is aimed at
improving the productivity of litchi. The productivity of litchi depends on a number of factors
like age of plants, variety, and quality of land and cultivation practices followed by farmers. The
cultivation practices followed by farmers in the pre harvest phase play an important role in
determining the overall productivity of orchard. To understand the practices adopted by the
farmers, mapping of management practices was made an integral part of the survey.
4.2 Important Pre-harvest management practices
Pre harvest phase practices affect the overall output of litchi. A fully grown, healthy litchi plant
can yield about 100 -120Kgs of litchi. However, this figure of plant productivity was very rare in
the field survey. Some of the main management practices which have been analyzed in detail
under this section include, plant spacing, soil & leaf analysis, ploughing and tillage operations,
irrigation and nutrition management.
4.2.1 Plant spacing
Proper plant spacing is one of the important factors for optimising returns from litchi orchards.
The standard recommendation is to have at least a spacing of 10*10 metre (100 plants per Ha)
irrespective of the variety selected. However, it was found that most of the farmers don’t adhere
to this practice and intend to have higher plant density. It was found across districts that they
plant about 25%- 50% more number of plants in the available space. This results in fewer
nutrients for plant, sub optimal growth which hampers productivity.

21
Litchi Resource Mapping Final Report
As per the survey overall average plant density for the selected districts is 128 plants per hectare
– the range is from 104 to 153. This is significantly higher than the recommended plant density
of 100.
4.2.2 Analysis of soil and leaf
Soil characteristic is one of the most important factors in determining Litchi productivity. For
farmers, it is crucial to understand the soil type, its properties and requirement of crop to
augment it further with additional nutrients, especially micronutrients. However, as observed
during the field survey, farmers tend to overlook the need for soil analysis and apply manure and
other nutrients in unscientific way. Mostly, it was observed that they follow the old practices or
get influenced by the various options available in the market without realising the suitability of
those particular nutrients for their orchard. As a result plants don’t get desired type and level of
nutrients restricting proper growth of the plant.
Most of the deficiency in the soil can be easily identified by the analysis of litchi leaf. However,
in the survey, it was observed that farmers’ awareness is quite low in this regard. Less than 0.5 %
of the farmers interviewed had some knowledge about scientific analysis of leaf and its
importance on the quality of orchards, rest were unaware. Few farmers have undergone training
by APEDA and NLRC but adaptation of the suggested practice was almost negligible.
The entire process of soil and leaf testing is considered to be tedious and time consuming. This
factor combined with a belief that they are aware of the package of practices dissuades the
farmers from taking up soil and leaf analysis.
4.2.3 Ploughing & Mulching
Proper ploughing is a must for ensuring proper growth of the plants and maintaining its health.
This practice is followed by most of the farmers. Mulching of soil helps in maintaining good
sanitary conditions at orchard level, which is a must for keeping the orchard healthy, and in
disease free condition. Besides this it also helps plants in taking nutrients from soil effectively

22
Litchi Resource Mapping Final Report
and efficiently. The pictures above show mulching of litchi trees in Bhagwanpur block of
Vaishali district. Majority of farmers covered during the survey undertake ploughing at least
once a year between August and December, while some do it as late as January.
4.2.4 Irrigation
Litchi being an evergreen plant requires optimum soil moisture for growth and development of
the plants and fruit production. Young plants up to 3-4 years of age need irrigation to favour
rapid vegetative growth and the schedule is to have irrigation at an interval of 15 days during
Oct-Nov, at one month interval during Dec- Feb, and at one week interval during March-July.
The schedule changes when trees come into bearing stage and the trees don’t require water till
flowering stage and fruits setting, i.e. from Nov to March. Thereafter, trees need regular watering
up to harvesting stage, i.e. May-June.
In most of the areas covered under the resource mapping, farmers followed regular irrigation
practice for young plants but don’t irrigate the mature plants as required. However, farmers from
high productivity blocks are more careful about irrigation and they try to follow the practices
whenever possible. In the study, it was found that about 95 per cent farmers irrigated the litchi
orchards at least once while only 30% irrigated twice and 23 % irrigated the litchi crop thrice.
There have been scientific studies that demonstrated the benefits of drip irrigation in growth of
Mulching in a Litchi Orchard Mulching in a Licthi Orchard

23
Litchi Resource Mapping Final Report
0
20
40
60
Rains Own Pumpsets
Pumpset on Rent
State Bore Wells
Canals Other Sources
Figure 4.1
Irrigation Sources
litchi plants1. However, in our study no farmer has reported using drip irrigation and there is a
wide variation in the irrigation practices, indicating that farmers are neither knowledgeable nor
concerned about the role of irrigation in litchi cultivation.
According to a study conducted by
EDA Rural Systems, about 68% of
farmers use pump - sets for irrigation
purpose. About 17% of the farmers use
their own pump sets while the other
51% take pump sets on rent from other
farmers. The capital cost of pump set is
also restrictive for use by farmers and
they get it on rent (Rs. 55- Rs. 65 per
hour of usage, fuel cost extra)
In order to irrigate 1 acre of land through a pump set about 4 to 5 hours is required.
Though cost of irrigation emerges as very important factor for non adherence to good irrigation
practice, other factors as explained by them are as follows:
• Poor irrigation infrastructure at the farm level: Poor working conditions of state bore
wells and canal support systems (water is rarely released on time in Gandak canal
systems developed by the government)
• Lack of awareness among farmers about importance of regular irrigation practices and
its impact on the production level
• Unavailability of labour in the peak season
• Management of orchards are generally by pre-harvest contractors who lack the
ownership to maintain the quality of orchards
1 Response of Young Shahi Litchi Trees to Drip Irrigation: Ray P.K.*, Rani Ruby, Singh A.K., Department of
Horticulture, Rajendra Agricultural University, Pusa 848 125, Samastipur, Indian Journal of Horticulture, Year :
2006, Volume : 63, Issue : 2
Source: EDA Rural Systems
Source: EDA Rural Systems

24
Litchi Resource Mapping Final Report
• Location of the orchards: In most of the cases orchards are generally located away from
the main agricultural land and so it becomes difficult to cover these orchards even by
private irrigation sources.
4.2.5 Application of fertilizers and other nutrients
Litchi responds to exogenously applied manure and fertilizers and the response varies depending
upon agronomic conditions and soil type. Fertilizers and other micronutrients are applied in most
of the blocks of the study but farmers lacked clarity on the composition (proportion of Nitrogen,
Phosphorous and Potassium-NPK) and quantity of fertilizers to be applied. It was observed that
the farmers spend significant amount on purchase of various nutrients/micronutrients available
in the market but do not have the technical awareness of suitability of the products for their
requirement.
Application of fertilizers to the orchards is recommended after a month of harvesting season
(July-August) but most of the respondents were not adhering to any specific schedule and it was
observed that farmers were applying fertilizers even in December and January. Another
widespread practice observed in all the districts was application of Urea after the irrigation,
Though uniformity was observed in types of fertilizers applied, variations were observed in
terms of quantity of fertilizers applied in all the districts. The quantity of fertilizers
recommended by the scientists has been explained in the Table 10.1 below
Figure 4.2: Recommended Dosages of Fertilizers per plant
Source: Scientists from NLRC, Dr Saket Bihari Sharma (Ex. Professor, Department of Horticulture, RAU)
Fertilizers (Amount in Kg)
Plant age 1 year Up to 10 years Up to 15 years >20 years
FYM 5 50 75 100 Oil cake 0.2 2 3 4 Urea 0.1 1 1.5 2 SSP 0.15 1.5 2.25 3 Mo P 0.50 0.5 0.75 1 Thimet 0.05 0.08

25
Litchi Resource Mapping Final Report
An average of 10 to 20 Kg of FYM per mature tree was applied by most of the farmers. Oil cake
of Neem and Castor are also applied but is generally done in alternate years or in a gap of 2 to 3
years. Urea is the most common chemical fertilizer used by the farmers. About 200 to 500
grams of urea per mature tree is usually applied by the farmers after the first irrigation. Many
farmers repeat the dosage of urea after the irrigation. Around 1 to 1.5 Kg of DAP per plant mixed
with 0.5 Kg of MoP is applied in Sep-Oct. Though scientists recommend of spraying micro
nutrients like Zinc and Boron this practice was not prevalent among respondents.
There is also practice of spraying the plants with insecticides like Endosulfan at the time of
flowering and when the fruits matured but not ripened.

26
Litc
hi
Re
sou
rce
Ma
pp
ing
F
ina
l R
ep
ort
4.2.
6 Se
ason
alit
y ca
lend
ar o
f pr
e-ha
rves
t m
anag
emen
t pr
acti
ces
for
litch
i cul
tiva
tion
Act
ivit
ies
Jan
Feb
M
ar
Apr
M
ay
Jun
Jul
Aug
Se
p O
ct
Nov
D
ec
1 So
il te
stin
g
2 L
eaf
test
ing
3 P
loug
hing
4 Ir
riga
tion
5 A
pplic
atio
n of
fer
tiliz
ers
6 Sp
ray
of
mic
ronu
trie
nts/
inse
ctic
ide
7 W
eed
cont
rol
and
inte
rcul
turi
ng
8 M
anag
emen
t an
d co
ntro
l of
in
sect
s an
d di
seas
es
9 F
ruit
plu
ckin
g
10
Supp
ly o
f fr
uits
in
the
loca
l as
wel
l as
outs
tati
on m
arke
t
11
Pru
nnin
g an
d sh
apin
g of
tr
ees
Sou
rce:
Nat
iona
l Litc
hi R
ese
arch
Cen
tre,
Mus
hha
ri,
Muz
affa
rp
ur

27
Litchi Resource Mapping Final Report
4.3 Harvest and Post harvest Management
Harvesting and post harvest phase are predominantly managed by pre-harvest contractors. Once
the deal between farmers and pre-harvest contractors is finalized the litchi orchards are given
away to these contractors who are then fully responsible for management of the orchards. These
pre-harvest contractors agree on pre-determined terms and a price per tree is arrived at and
settled at the time of plucking, grading, packaging, storage and the transportation. The farmers
have a very little or no say in this process.
4.3.1 Harvesting/plucking
Litchi is a non-climacteric fruit and so the quality, color and flavor are all determined at the time
of harvest. The decision on harvest time is made primarily by the pre-harvest contractors based
on their convenience. Maturity of the fruits is indicated by the redness of the fruit and its size
which should be at least 22-25mm in diameter. The maturity of the fruit is also indicated when
tubercles become somewhat flattened and the shells become smooth. Litchi fruits are harvested
in bunches along with a portion of the branch and a few leaves as it prolongs the storage life of
fruits. Fruit harvesting starts early in the morning and gets over by 10 a.m. However, in those
cases where the orchard is managed by the pre-harvest contractors, the decision on harvest time
is made by them at their convenience.
Plucking is done carefully without damaging the branches of the tree. The labour employed for
harvesting are often unskilled and are not trained properly for harvesting. It often results in
damaging the tree. Tools such as blades, knife, pruning scissors & shears are used but this has
not been in common practice.
4.3.2 Grading and Packaging
At the farm level, fruit is graded mainly on the basis of colour and size and for any damage
/injury to the fruit. Damaged, sun burnt and cracked fruits are sorted out and the other fruits are
packaged in bunches along with the twig and leaf.

28
Litchi Resource Mapping Final Report
Proper packing of fruits is important in maintaining freshness and quality and in preventing fruit
decay during transit to distant places. Before packaging, attention is given to the drying of fruits
and fruits are packed only if they have has dried completely.
Bamboo baskets and wooden crates are generally used for packaging. The type and size of
packaging depend upon the market to which the fruit is being supplied. The fruit is mostly
packed in wooden boxes of 4-6 kg with dried leaves for cushioning for sending it to the markets
outside the state. In some cases, when the fruits are being supplied to premium markets, the pack
size is even smaller at 2 kg of paper cartons. However, for local markets of shorter distances,
bamboo baskets, and plastic crates are used for packaging and transportation.
4.3.3 Storage and transportation
As litchi is highly perishable in nature, storage is not done at farm level. Since it requires low
temperature and humidity conditions to have longer shelf life, proper cool chain has to be
Grading, Packaging of Litchi at Farm

29
Litchi Resource Mapping Final Report
maintained for storage. Very few such cool chain storage and transportation infrastructure are
available in the state. Therefore, storage of litchi fruits by farmers was not observed during the
survey and Litchi is dispatched to the destination market/ or to processors as soon as graded and
packaged to avoid loss in shelf life. However, there are few traders who also have their own cold
storage units and processors with pack houses and processing units.
The mode of transportation varies by the distance to the destination. For local markets, wheel
carts or pick up are used while trucks and trains are used for large quantity and far off markets.
Refrigerated vans also used by traders for products heading to distant markets in Mumbai,
Chennai etc which enjoys premium price.
4.3.4 Other management practices
Intercropping: Litchi is a slow-growing tree and takes at least six years for initial flowering and
fruiting. Intercropping ensures an adequate return from the orchard in pre-bearing phase and also
provides a supplementary source of income to the farmers even at the later stage. All the
districts, especially Muzaffarpur, Vaishali, Samastipur and East Champaran, were found to have
instances of intercropping. This practice was mainly in the small and medium level farmers
whereas it was not observed in the large orchards despite them having less plant density.
Apiculture: Apiculture or bee keeping is a good practice for getting a regular return from the
litchi orchards. It has developed in last few years in Muzaffarpur and surrounding districts
where mainly e four types of honey is produced– litchi, karanj, mustard and sarguja are
produced.

30
Litchi Resource Mapping Final Report
5 Litchi Value Chain
5.1 Marketing channel
Marketing of Litchi to local as well as distant markets is predominantly observed in two
channels. Pre harvest Contractors are the key players in one such channel and direct selling being
the other marketing channel.
5.1.1 Pre-harvest Contractors
Pre-harvest contractors (PHC) are the most important players in the existing marketing channel
of litchi. In all the seven districts covered during the survey, PHCs are an integral part of the
system and more than 75% of the litchi is marketed through them. Historically, the PHC came
into existence to aid large farmers in managing and marketing of litchi orchards. Their role was
later strengthened by the absence of proper marketing infrastructure. Most of the APMC markets
were located at far off places from orchards and there were no local mandis to facilitate the
marketing.
The PHCs can be categorized as small, medium and large based on the volume handled and
location. Smaller PHC’s are mostly located at interior villages, take smaller orchard on contract
and for a longer period while the medium ones are relatively closer to mandis, and take medium
orchards on contract. Most of the large PHCs play multiple roles as farmers, PHC’s and as
traders. Many of the medium and large PHCs work with traders located in distant cities like,
Delhi, Mumbai, Kanpur, Gorakhpur, Chennai, Lucknow.
PHCs start surveying the litchi orchards from December every year and start purchasing the
orchards on lease which is usually informal (no legal documents are signed by the associated
parties) at the time of flowering season (February-March). At the time of purchase, the
contractors make an on-the-spot assessment of the expected produce from the orchard on the
basis of the size of orchard, location and quality of flowering. The lease amount is then mutually

31
Litchi Resource Mapping Final Report
agreed upon by the contractor and the farm owner and an advance is given to the owner as an
agreement.
Generally the lease is for one year but in some cases, the lease duration could be up to five years.
However, a farmer in Samastipur was found to have given orchard on 29 years lease. This works
on risk and return trade-off. For famers, longer period of contract means low risk, low return
while small contract results in high risk and high return.
Majority of the farmers do not want to go into hassles of marketing due to perishable nature of
the produce and risk associated with it. Additionally, the awareness level of farmers is very low
on other marketing methods that could be adopted for marketing or any sort of value addition
that could be undertaken at the farm level.
5.1.2 Direct Selling in local markets & to Processors
Other methods used by the litchi growers include direct selling to outside buyers, selling in local
markets, supply to local processing units and retail. After APMC act was repealed in the state,
many private mandis have come up in different districts, especially in Vaishali and Muzaffarpur,
and are emerging as preferred choice of farmers for marketing of litchi. This has mostly affected
one year contracts where farmers who take high risk are finding alternative channels to sell their
produce. Though the PHC’s are here to stay for their different roles and benefits, their extent of
control on litchi marketing may reduce in the new system. A marketing channel of litchi is
shown below in Fig 5.1.

32
Litchi Resource Mapping Final Report
Figure 5.1: Marketing Channel for Litchi
Litchi
Processors
Consumer
Retailers
Outside
Traders
Commission
AgentsLocal Markets
(Mandis)
PHC*
Exporters/
Distributors
*PHC: Pre-Harvest Contractors
Litchi Farmers
The most preferred mode of selling for the litchi growers is through the pre-harvest contractors
in all the districts. In Muzaffarpur, the sale to PHC is about 75% while the second mode which is
direct selling to outstation traders is about 12%).About 8% of the farmers sell in the local market
and bout 3% of the farmers sell their produce directly to a few local processing units in the state.
Similarly, in Samastipur and Vaishali also, channel constituting PHC takes a lion’s share of
(about 75%) litchi marketing. In Samastipur, the second preferred mode is direct selling to
outside traders (10%). Few of the farmers have well established linkages and for last few years
they are packaging litchi in retail packs of 2 kgs and sending to markets like Mumbai and
Bangalore. Rest of the litchi is sold to local markets and processors. However, in Vaishali second
preferred mode is direct sale in local markets. In last few years after repealing APMC act, private
markets in Katarmala, Lalganj, Vaishali, Belsar etc are attracting traders from outside the state
during litchi season. Farmers have also found an alternative channel and they get better price by
selling in these markets.

33
Litchi Resource Mapping Final Report
For, East Champaran, selling via PHC is about 80%. Few blocks, Mahesi and Chakiya situated
on Muzaffarpur- Raxual Highway (NH- 28 A) have better access to market outside the state as
well as markets in Muzaffarpur while farmers in interior blocks mostly rely on PHCs. However,
blocks bordering Nepal have access to a lager market through Raxaul exit and this has induced
litchi cultivation in these blocks in big way. Though a detailed survey was not conducted in these
blocks it was found that the orchard size is quite large in these areas.
5.2 Litchi Markets
Litchi being a temperature sensitive fruit, the access to market is constrained by unavailability of
cool chain facilities to transport it to distant markets. It is important to reach the produce to
distant locations at ambient temperature within 24-36 hours after plucking, in order to retain its
desired colour. The supply chain from farm to final consumers outside the state market is not so
efficient to maintain the timings. Hence refrigerated trucks and cool chain facilities are essential
for targeting larger markets. For export markets, litchi requires some processing to increase its
shelf life. Additionally, litchi is also processed for pulp, juices, canned litchi etc for preservation.
Currently, there are about 5 pack houses/ litchi processors in the state.
Litchi markets can be broadly classified into three categories
• Domestic Market in Bihar
• National Market
• Export market
According to the survey estimates, about 80% of litchi produced in the state is marketed out of
the state. Major markets are Delhi, Lucknow, Kanpur, Varanasi, Mumbai, Chandigarh, Kolkata
and Bangalore. Around 30 MT of fresh produce is also exported from the state to Nepal, UAE
etc., which accounts for only 18% of the total volume of litchi exported out of the country.

34
Litchi Resource Mapping Final Report
5.3 Litchi processing in Bihar
The region has five pack houses which are operated by private litchi processors. Around 1600-
1700 MT of produce, is handled by them annually. The pack houses handle fresh as well as
processed litchi where about 500-600 MT of fresh litchi is traded and around 1000-1200 MT is
processed into pulp, juices etc. The pack houses have facility for pre-cooling and cold storage
(around 100 MT each). Mostly, the pre-coolers are of 4-10 MT capacity and their maintenance is
far from being satisfactory.
As litchis are highly perishable, the cold stores
are used by pack house operators to store litchi
for 10-15 days only and thus for transit purpose
alone. Around 50 -60% of fresh litchi is
transported through reefer trucks as its
availability is of a huge concern. Some of the
pack house operators also hire reefer trucks
from Delhi. Rest of the produce is transported
through normal trucks. The installed capacity of
pulping units is around 7 MT/hr and the pulped
products are stored in deep freezers at -18 to -22 degree Celsius. Other products manufactured by
them include litchi shreds/whole in sugar syrup. The same facility is also used by the processors
for processing tomatoes, strawberry, pineapple etc during the rest of the year.
5.4 Economics of Litchi Production and Trade
Most of the farmers, who sell their orchards, are paid a price per tree. The price offered to
farmers is mostly in the range of Rs300 to Rs1000 per plant which varies on factors like plant
age, canopy of the trees, variety and most importantly the negotiation ability of the farmers.
Though the average productivity is 70 kg/plant, the production of litchi in one tree may go up to
80 kg to about 100 kg in their prime bearing age and price realized for such type of trees are
from Rs600-1000 per tree. Trees, which are in the age of 5 to 10 years, fetch a price of around

35
Litchi Resource Mapping Final Report
Rs300-500 to the growers. Figure 5.4 shows the analysis of returns from one tree to the growers
interviewed during the survey.
5.4.1 Cost of litchi Cultivation
The average number of plants in litchi orchard varies from 100-130 trees per hectare, are planted
in a hectare. Cost of orchard establishment by farmers is about Rs 15,000 in which fruit bearing
starts from 5-6 years of age. The cost of establishment of orchard in a hectare is represented in
table.
Figure 5.2- Cost of Cultivation per Hectare.
Besides the initial establishment cost, farmers
incur a cost of Rs 7000-12,000/ha annually on
maintenance of orchard. The average yield per
tree is around 70 kg. Yield of litchi depends
upon the age of orchard, variety, locality, agro
climatic conditions as well as management of
orchard. Thus, there is wide variation in yield
which varies from 40-100 kg per tree. The cost
of maintenance (Rs 7000-12,000 per ha) of
orchard, which mainly comprises of irrigation,
pruning and spraying costs, is borne by the farmer. Considering mature plants, farmers get a
Activity Cost per Ha (in Rs)
Cost of sapling (120 sapling) 1800
Labour cost (levelling, digging, weeding, sapling plantation, manure spread, filling etc)
1800
Cost of irrigation (8 times for 6 hours each day) 4320
Compost and fertilizers 4800
Pesticide application 600
Others (Thimet, Folderol application) 1560
Total in Rs 14880
Economics of Litchi Cultivation
No. of Litchi trees in 1 Ha 120
Average Yield per tree(kg) 70
Total Yield per (Ha) 8400
Price received by farmers (Rs/kg) 10
Total income from litchi sale (Rs) 84000
Annual Cost of Maintenance (per Ha) 10000
Net Income per Ha (Rs) 74000
Net Income per kg (Rs) 9

36
Litchi Resource Mapping Final Report
price of Rs 600-1000 per tree. Thus farmer’s net income is around Rs74, 000/ha only, without
taking into account his initial spending on establishment of orchard. On per kg basis, farmer’s
net realization is around Rs 9 to 14/kg.
5.4.2 Consumer pricing of litchi (in Value Chain)
A value chain indicating the
various activities and cost build-up
at every step has been mapped for
1 kg of litchi. Some of the
assumptions of the price build up
are:
• The most commonly
observed trade channel has
been selected for the price
build up of litchi, i.e.
Farmer-PHC-Wholesaler-
Retailer.
• Farmer’s margin has been calculated based on his annual cost of maintenance of orchard.
The cost of establishment of orchard has not been taken into account.
• The cost of interstate transportation has been calculated for New Delhi.
Figure 5.2: Litchi Value Chain
Particulars Farmer Pre-harvest Contractor
Wholesaler Retailer
Cost of maintenance/ Purchase price (Rs/Kg)
1 12 30 35
Cost of marketing, transport, wastage (Rs/Kg)
0 15 3 5
Selling price(Rs/Kg) 12 30 35 50
Price spread 11 3 2 10

37
Litchi Resource Mapping Final Report
The cost of retailing, which includes the cost of shop, wages, rent etc, has not been considered.
As described earlier, a litchi farmer receives a price of Rs 10-15/kg and he spends around Rs
1/kg in maintenance of the orchard. If the farmer’s price is Rs 12/kg (as depicted above), his net
margin is around Rs 11/kg. The pre-harvest contractor has an important role to play and he bears
the cost of plucking, pooling, packaging, interstate transportation expenses and commission at
the wholesale market. The commission agent facilitates trade between contractor and wholesaler,
for which it charges a commission of 6-8%. While the wholesale price of litchi is around Rs 30-
40/kg (APMC Mumbai/Delhi), retail price in Mumbai/Delhi varies from Rs 55- 70/kg. In case of
litchi sold in retail markets of Bihar, retail price varies from Rs 25- 50 during the season.
Some of the salient features of the price build up are mentioned below:
• There are 4 intermediaries between the farmer and the consumer in the litchi supply
chain.
• The price build up from farmer to consumer is more than four times.
• Pre-harvest contractor incurs a cost of about Rs 12 in various activities such as plucking,
packaging, transportation etc. Besides this, around 10% produce is wasted in transit that
also adds up to his cost. Thus the total cost incurred by the contractor is around Rs 15 per
kg. The contractor earns a margin of Rs 3 per kg that is around 7 paisa of a consumer
rupee.
• The commission paid by the contractor to the commission agent constitutes 5 paisa of a
consumer rupee.

38
Litchi Resource Mapping Final Report
6 Muzaffarpur
6.1 Overview of the district
Muzaffarpur is a prominent district in North Bihar and is a major centre for agriculture trade in
the region. It is situated between 24o 54’N and 26o23’ and 84o53’E and 85o53’ longitude and at
an altitude of 51.81 metres. Muzaffarpur district has subtropical climate characterized by hot
summer, wet monsoon and dry winter. The climate conditions prevailing in various tracts of the
district are suitable for commercial cultivation of both varieties of litchi (Shahi and China).
However, the production sometimes gets affected (in a few patches) due to occasional weather
changes like cold wave, untimely rains and storms.
This district comes under the northwest alluvial plain zone which mainly consists of the basins
formed by river Burhi Gandak, Gandak, Baghmati and other small rivers flowing through the
district. The soil of the district is alluvial in nature and good in terms of fertility but the flood
always affects some parts of the district.
The total geographic area of this district is about 3.16 lakh hectares (3,172 sq km) with a
population of 37.4 lakh (Census 2001). The district is bounded on north by East Champaran and
Sitamarhi districts, on the south by Vaishali, east by Darbhanga and some parts of Samastipur
district and from the west by Saran and Gopalganj district. This district consists of 2
subdivisions and 16 blocks. This district has been a hub for horticultural commodities especially
in fruits like litchi, mango, and guava. Muzaffarpur district is famous for litchi not only in India
but also internationally for the Shahi variety that is grown extensively in this district. The
district is the top producer of litchi in India. The production details of litchi in Muzaffarpur
district since 1970 is presented in Table 6.1

39
Litchi Resource Mapping Final Report
Table 6.1: Production of Litchi in Muzaffarpur District
Year Area (ha) Production (mt) Productivity (mt/ha) 1970 1,330 5,320 4.0 1975 1,876 8,629 4.5 1980 2,522 11,349 4.5 1985 2,702 16,212 6.0 1990 6,045 36,270 6.0 1995 7,088 44,643 6.3 1998 7,288 44,653 6.1 1999 7,467 43,804 5.9 2000 7,467 61,000 8.0 2001 7,517 74,000 10.0 2002 7,667 53,000 6.0 2003 7,667 75,000 9.7 2004 7,173 85,548 11.9 2005 7,139 57,096 7.9 2006 7,157 52,687 7.3 2007 7,206 55,826 7.7
Source: www.muzaffarpur.nic.in
The district has shown some consistency in terms of growth of area under litchi cultivation.
However, in terms of productivity (litchi production in mt/ha) the performance has been
inconsistent. In some of the years (in 1999 and 2002) the fall in productivity has been alarming.
This inconsistency can be mainly attributed to factors like climate condition in that particular
year, timing of rainfall in early summer season, infestation of pests and insects, orchard
management by the farmer in that particular year. There are other factors like quality of
saplings, age, and variety but generally as these factors affect production over a prolonged
period, these fluctuations observed can be attributed mainly to the unfavourable agro climatic
conditions in these years.
6.2 Litchi Area in Muzaffarpur
As discussed in the previous sections, Litchi is extensively grown in almost all the blocks of the
district. The table below provides list of panchayats in all the blocks of Muzaffarpur. It is to be
noted that many other panchayats have sizable quantity of litchi production.

40
Litchi Resource Mapping Final Report
Figure 6.2: Litchi Panchayats in Muzaffarpur
Blocks Main Villages Aurai Adhampur Bhawani, Taraigwar, Rampur
Bandara Harpur, Bagahi, Pirapur, Rampur Dayal
Bochahan Bochahan, Goin, Karanpur, Bhagwanpur
Gaighat Maithi, Basantpur, Janta, Bakhri, Ramnagar
Kanti Sain, Lasgaripur, Dhamauli Ramnath Toli, Chapra Dharampur, Harchanda
Katra Dhanaur, Changel, Hathauri,Katai, Lakhanpur
Kurhani Chajjan, Harishankar, Maniyarpur, Maripur
Muraul Markan, Pilakhi, Gajpati, Mirapur
Marwan Kajra, Pratappur, Chatursi, Ghosaut
Minapur Madhuban, Kanti, Jamin, Mithiya, Mushahri Tola, Mushachak, Khemapatli, Dumaria
Motipur Rampur Ugan, Chakchuvar, Rampuri Sadan Mahima, Gopinathpur, Sadha
Mushahari Jhapan, Dhornpur, Jamalbad, Dwarikanagar, Bhikenpur, Rohua
Paroo Madhia, Paroo Bazar, Bajitpur, Jagdishpur, Anandpur
Sahebganj Madhubani, Navanpur, Prata patti, Ahiyapur, Guara, Halimpur
Sakra Repura, Mishraulia, Navalpur, Kateshar, Machain
Saraiya Saraiya, Basra, Ginjas, Berua, Chakna
Figure 6.3: Area and Production in Blocks

41
Litchi Resource Mapping Final Report
The following map in Figure 6.4 explains the overall condition of litchi growing area in the
district. On the basis of factors like area under litchi cultivation, farm productivity, overall
orchard management the whole Muzaffarpur region can be classified into three zones.
• High Productivity Zone: The first zone is of the high productivity areas consisting of
Kanti, Minapur, Mushhari, and Bochahan blocks. In these blocks the condition of litchi
orchards is much better than that in other blocks, in terms of orchard quality, orchard
management and overall productivity, and can offer a good scope for further
interventions such as collective marketing and value addition due greater economies of
scale.
• Average Productivity Zone: The second zone is of average productivity areas consisting
of Kurahni, Gaighat, Paroo, Motipur, Saraiya, Bandra and Muraoul blocks where
productivity, area and management of orchards are of average level. These blocks have
high potential of becoming high productivity blocks with focussed interventions
(particularly financial and market linkages).
• Below Average Productivity Zone: The third zone consists of below-average
productivity areas viz., Aurai, Katra, Sahebganj and Sakra blocks. Here the
concentration of litchi orchards is very thin in terms of area under litchi cultivation.
Also, the overall condition of litchi orchards was relatively poor as compared to that in
other blocks. These blocks require both technical (farm management practices) and post
harvest (market linkages) inputs for a sustained period of time in order to improve the
condition of litchi orchards in these blocks.
The map clearly shows that the areas closer to Muzaffarpur city are in high productivity zone
while the productivity falls as one move away from the center. The reason could be attributed to
better access to markets for farmers and accordingly incentives to produce quality products and
hence better orchard management.

42
Litchi Resource Mapping Final Report
Figure 6.4: Litchi Map of Muzaffarpur
Source: EDA Rural Systems
The following table provides block wise area under litchi cultivation and number of plants in Muzaffarpur.
Figure 6.5: Area and Number of Plants
Blocks Total Area Under Litchi (Ha) Number of Plants
Aurai 141.00 18606.00
Bandara 342.00 49717.50
Bochahan 876.00 120097.50
Gaighat 504.00 56850.00
Kanti 1015.50 136815.00
Katra 91.50 12603.00
Kudhani 438.00 49242.00

43
Litchi Resource Mapping Final Report
Maraul 226.50 33114.00
Marwan 111.00 16881.00
Minapur 1380.00 152823.00
Motipur 307.50 40689.00
Mushahari 943.50 97747.50
Paroo 333.00 39942.00
Sahebganj 153.00 21019.50
Sakra 436.50 61015.50
Saraiya 235.50 32310.00
Total 7534.50 939472.50
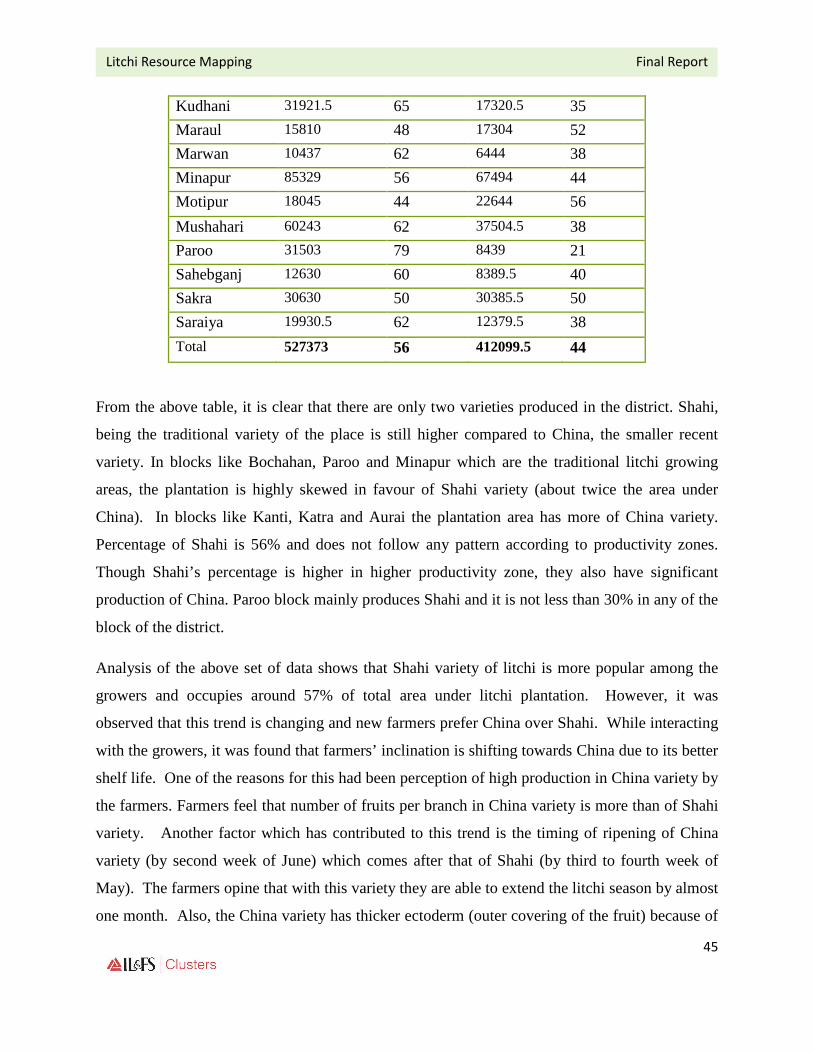
Minapur emerges as the block with largest area under litchi in Muzaffarpur with 1380 Ha while
Kanti comes second in place with 1015.5 Ha. Third and fourth position is held by Mushari and
Bochahan. All the four blocks fall under high productivity zone and constitute 56% of the total
litchi area in Muzaffarpur.
Katra is last in position in terms of litchi area with just 91 Ha, preceded by Marwan, Auri and
Sahebganj at 111 Ha, 143 Ha and 153 Ha respectively.
Numbers of litchi plants are also highest in Minapur at 152823 and the four main blocks together
have more than 54% of litchi plants of the district. Litchi plants in each of the blocks, Auri,
Katra, Marwan and Sahebganj are less than 20, 000. Minapur has the largest number of plants.
Figure 6.6: Litchi Plants in Muzaffarpur

44
Litchi Resource Mapping Final Report
Figure 6.7: Plant Spacing
Spacing of Litchi: The average figure for
orchards in Muzaffarpur is 130 plants per
hectare which is much above the standard
recommendation of 100 plants per hectare.
Mushahari block has the lowest plant
spacing of 100 plants per Ha while Minapur,
Gaighat and Kudhani are very close to
optimum number of plant density. Most
other blocks have plant density more than
130. In Marwan, there are 150 plants per
hectare which is 50% more than the
recommended spacing. Plant spacing plays
important role in productivity of the tree and
hence reason for low productivity of litchi
could also be attributed to high plant density.
6.3 Litchi Varieties in Muzaffarpur
Figure 6.8 shows the Variety of Litchi Plants in Muzaffarpur
Blocks Shahi Shahi (%) China China (%)
Aurai 5718 31 12888 69
Bandara 29670 60 20047.5 40
Bochahan 81427.5 68 38670 32
Gaighat 43774.5 77 13075.5 23
Kanti 45526.5 33 91288.5 67
Katra 4777.5 38 7825.5 62
45
Litchi Resource Mapping Final Report
Kudhani 31921.5 65 17320.5 35
Maraul 15810 48 17304 52
Marwan 10437 62 6444 38
Minapur 85329 56 67494 44
Motipur 18045 44 22644 56
Mushahari 60243 62 37504.5 38
Paroo 31503 79 8439 21
Sahebganj 12630 60 8389.5 40
Sakra 30630 50 30385.5 50
Saraiya 19930.5 62 12379.5 38
Total 527373 56 412099.5 44
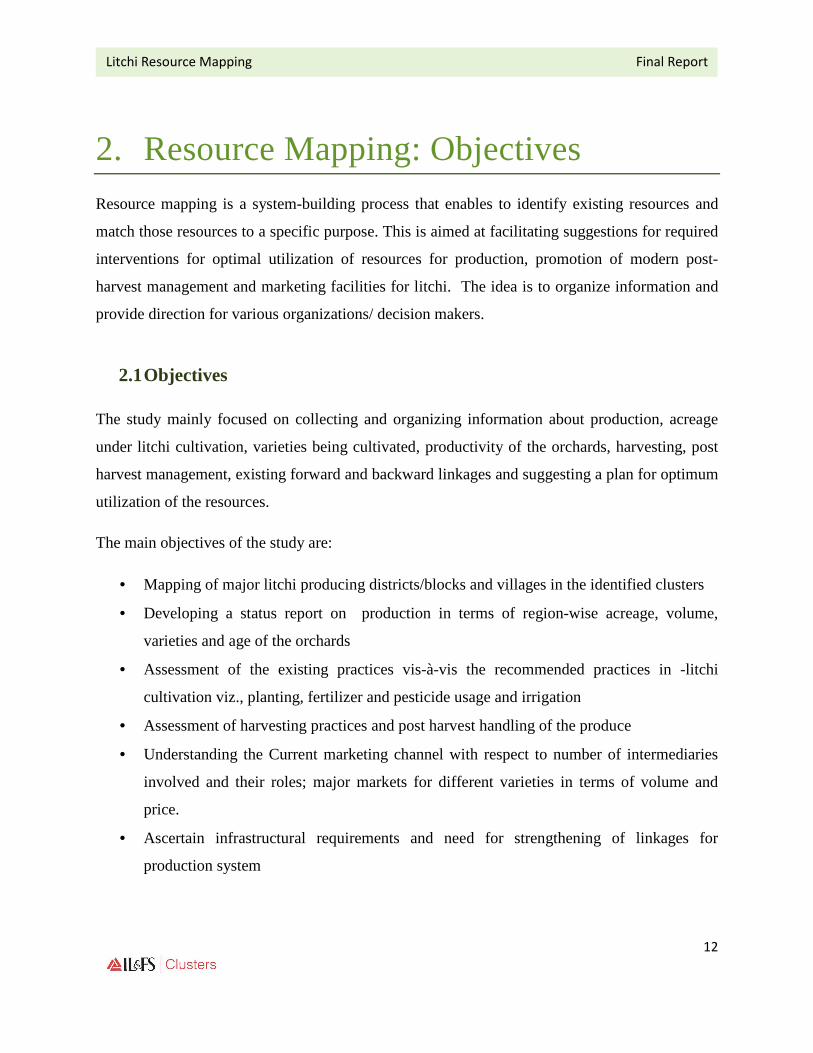
From the above table, it is clear that there are only two varieties produced in the district. Shahi,
being the traditional variety of the place is still higher compared to China, the smaller recent
variety. In blocks like Bochahan, Paroo and Minapur which are the traditional litchi growing
areas, the plantation is highly skewed in favour of Shahi variety (about twice the area under
China). In blocks like Kanti, Katra and Aurai the plantation area has more of China variety.
Percentage of Shahi is 56% and does not follow any pattern according to productivity zones.
Though Shahi’s percentage is higher in higher productivity zone, they also have significant
production of China. Paroo block mainly produces Shahi and it is not less than 30% in any of the
block of the district.
Analysis of the above set of data shows that Shahi variety of litchi is more popular among the
growers and occupies around 57% of total area under litchi plantation. However, it was
observed that this trend is changing and new farmers prefer China over Shahi. While interacting
with the growers, it was found that farmers’ inclination is shifting towards China due to its better
shelf life. One of the reasons for this had been perception of high production in China variety by
the farmers. Farmers feel that number of fruits per branch in China variety is more than of Shahi
variety. Another factor which has contributed to this trend is the timing of ripening of China
variety (by second week of June) which comes after that of Shahi (by third to fourth week of
May). The farmers opine that with this variety they are able to extend the litchi season by almost
one month. Also, the China variety has thicker ectoderm (outer covering of the fruit) because of
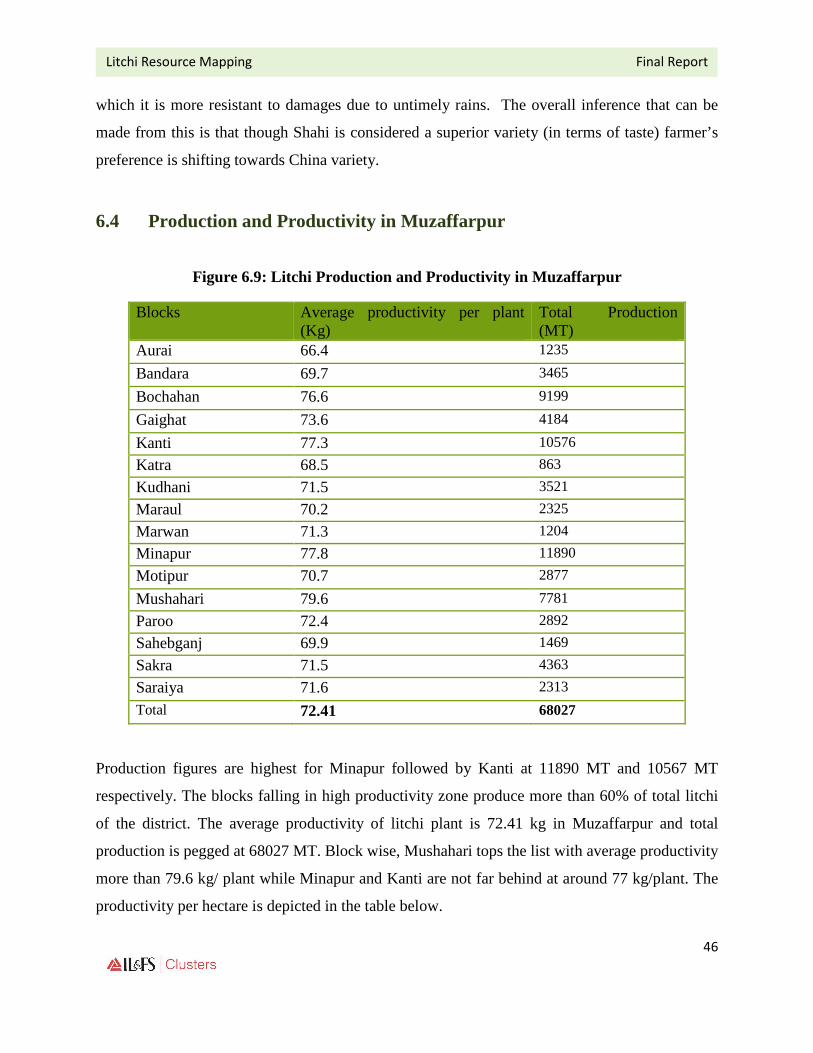
46
Litchi Resource Mapping Final Report
which it is more resistant to damages due to untimely rains. The overall inference that can be
made from this is that though Shahi is considered a superior variety (in terms of taste) farmer’s
preference is shifting towards China variety.
6.4 Production and Productivity in Muzaffarpur
Figure 6.9: Litchi Production and Productivity in Muzaffarpur
Blocks Average productivity per plant (Kg)
Total Production (MT)
Aurai 66.4 1235
Bandara 69.7 3465
Bochahan 76.6 9199
Gaighat 73.6 4184
Kanti 77.3 10576
Katra 68.5 863
Kudhani 71.5 3521
Maraul 70.2 2325
Marwan 71.3 1204
Minapur 77.8 11890
Motipur 70.7 2877
Mushahari 79.6 7781
Paroo 72.4 2892
Sahebganj 69.9 1469
Sakra 71.5 4363
Saraiya 71.6 2313
Total 72.41 68027
Production figures are highest for Minapur followed by Kanti at 11890 MT and 10567 MT
respectively. The blocks falling in high productivity zone produce more than 60% of total litchi
of the district. The average productivity of litchi plant is 72.41 kg in Muzaffarpur and total
production is pegged at 68027 MT. Block wise, Mushahari tops the list with average productivity
more than 79.6 kg/ plant while Minapur and Kanti are not far behind at around 77 kg/plant. The
productivity per hectare is depicted in the table below.

47
Litchi Resource Mapping Final Report
As shown, productivity varies between 8.0 MT/ Ha to 10.8 MT/ Ha. Marwan has the highest
productivity at 10.84 MT/Ha while Kudhani has the lowest productivity per hectare.
6.5 Litchi Orchard Profile in Muzaffarpur
Out of the total 7,467 orchards in Muzaffarpur district 9 % of the orchards are below 5 years of
age and 12 % between 5 to 10 years of age. About 65% of the orchards are between 10 to 30
years of age and the rest 14 % of the orchards are above 30 years of age.
Majority of the orchards which are below 10
years old belong to the new growers.
Growers of Bochahan, Minapur and
Mushahri block are traditional litchi growers
and a very small percentage of all the litchi
growers are new to litchi cultivation in these
blocks. Most of the litchi growers from
blocks like Bandara, Aurai and Sakra have
taken up litchi cultivation recently.
Source: NABCONS Report
In Motipur and Muraul blocks the proportion of new litchi growers is quite significant. The
proportion of new growers is least in Minapur block while it is most in Bandara block. In all the
blocks other than Minapur about 20% of the litchi growers can be considered as new growers. In
Muzaffarpur district about 17 to 18 % of the growers can be considered to be new growers.

48
Litchi Resource Mapping Final Report
7 Samastipur
7.1 Overview of the district
Samastipur is located centrally in Bihar and it covers an area of 2904 sq. km. The district is
bordered by River Baghmati on the north separating it from Darbhanga district. River Ganges
forms the southern border of the district while on the east it is bounded by the districts of
Begusarai and parts of Khagaria and on the west by Vaishali and some parts of Muzaffarpur.
Apart from Ganges and Baghmati, other rivers that flow through the district are Budhi Gandak
and Kamala Balaan.
The district has 20 blocks
and the head quarter is
located at Samastipur
town. The population of
the district is 33.94 lakhs
(2001 Census) with a
population density of
1196/sq. km. The ratio of
rural population is very
high with only 3.64% of
the population staying in
urban areas. The literacy
rate is 45.13% which is
lower than the national average.
Samastipur has rich fertile alluvial soil and agriculture is the major economic activity of the
district. The major crops which are grown in the district are paddy, wheat, mango, banana and
potato. In 1997-98, the gross irrigated area in Samastipur was 1.07 lakh ha although the main
source of irrigation is tube wells.

49
Litchi Resource Mapping Final Report
Samastipur has similar climate as Muzaffarpur and is suitable for litchi cultivation. It has been a
traditional litchi producer. However, the spread of cultivation here is not as wide as that in
Muzaffarpur. Fig 7.1 shows the declining trend of litchi production in the district though the
area remains almost constant. The productivity sharply decreased after 2003-04 and is hovering
around 7.5 since last few years.
Fig 7.1: Litchi Area and Production Trend in Samastipur
Source: National Horticulture Mission
7.2 Litchi Area in Samastipur
Five blocks were identified for litchi resource mapping in Samsatipur. However, during the
initial focus group discussion it was found that has been a selection bias at beginning of the study
and two important blocks- Rosera & Kalyanpur- in terms of litchi production have not been
selected while two insignificant blocks- Tajpur & Sarairanjan- have been included in the study.
For reliability of the study, both the blocks were included and hence the study was for seven
blocks.

50
Litchi Resource Mapping Final Report
Figure 7.2: Blocks and Villages in Samastipur
Blocks Main Villages
Rosera Sahyardih, Dhatiah, Mirzapur, Sonepur
Vibhitipur Narhan, Bairiya, Shankmohan, Manthi
Pusa Mahmada, Dighara, Harper, Jagdishpur
Kalyanpur Malinagar, Hazpurva, Saidpur, Barahata, Tara, Mohanpur
Samastipur Shambhipatti, Chatauna, Karpurigram, Bisanpur, Dudhpura
Tajpur Sadipur, Tajpur, Baghi
Sarairanjan Bhagwatipur, Sahjapur, Sarai
In Samastipur district, litchi production is spread across three different regions. Rosera and
Bibhutipur are found to be the regions with large production, Kalyanpur, Pusa and Samastipur
would be medium production region and Tajpur & Sarairanjan comprise of low production
region.
Within the blocks also, litchi is concentrated in few panchayats more than others, sometimes a
single panchayat having around 40-50% of the total litchi area of block.
The major litchi growing panchayats in Samastipur are listed below:
• Sonepur & Dhatia in Rosera block
• Narhan in Bibhutipur block
• Berhata and Malinagar in Kalyanpur
• Pradhantola &Mohmada in Pusa
Figure below provides total litchi area and number of plants in these seven blocks in Samastipur.

51
Litchi Resource Mapping Final Report
Figure 7.4: Block wise details of Litchi Area and Number of Plants in Samastipur
Blocks Total Area Under Litchi (Ha)
Number of Plants
Rosera 225.1 30957
Vibhitipur 285.0 39192
Pusa 106.3 14613
Kalyanpur 306.6 42152
Samastipur 240.3 33039
Tajpur 31.7 4359
Sarairanjan 191.9 26383
Total 1386.9 190695
Kalyanpur is the largest litchi producing block in the district. It has largest area under
agricultural land and litchi is spread in about 306 Ha in Kalyanpur. Bibhutipur and Samastipur
are at second and third positions with 285 Ha and 240 Ha. These three blocks account for more
than 69% of total litchi acreage of the district. A graphical representation of litchi acreage and
production is shown below. Figure 7.5: Area and Production of litchi in
Samastipur

52
Litchi Resource Mapping Final Report
Sarairanjan, Pusa and Rosera account for the rest of the acreage while Tajpur has least acreage.
Rosera despite being a small block, litchi production is concentrated in most of the panchayats of
the block. Tajpur has small litchi area at 31.7 Ha. However, the advantage of the block lies in
being located along the National Highways.
Kalyanpur block has the highest number of plants with more than 40,000 plants. Four blocks of
Kalyanpur, Bibhutipur, Sarairanjana and Samastipur have more than 90% of the plants from
these seven blocks.
Tajpur has the least number of plants with around 4300 plants while Pusa and Rosera have
around 9600 plants.
Figure 7.6: Number of Plants in Samastipur
7.3 Litchi Varieties in Samastipur
In terms of varieties being grown it is found that Shahi Litchi is grown more than China in
Samastipur. Overall percentage of Shahi Litchi in these 7 blocks is 59% while China is at 41%.
During the field work, other varieties were not found.

53
Litchi Resource Mapping Final Report
Figure 7.7: Litchi Varieties and Number of Plants in Samastipur
Blocks Shahi Shahi (%) China China (%)
Rosera 17026 55 13931 45
Vibhitipur 31354 80 7838 20
Pusa 9498 65 5114 35
Kalyanpur 29506 70 12646 30
Samastipur 8260 25 24779 75
Tajpur 1744 40 2615 60
Sarairanjan 20315 77 6068 23
Total 117703 59 72992 41
7.4 Production and Productivity in Samastipur
The total production figure for Samastipur is estimated to be 13,583 MT with average
productivity being 71.2 Kg per plant. The productivity is highest in Kalyanpur block at 77.1 kg/
plant followed by Rosera and Bibhutipur at 75 kg and 74 Kg per plant respectively.
Figure 7.8: Production and Productivities in Samastipur
Blocks Average productivity per plant (Kg)
Total Production (MT) Productivity (MT/Ha)
Rosera 75 2322 10.31
Vibhitipur 74 2900 10.18
Pusa 72.4 1058 9.96
Kalyanpur 77.1 3250 10.60
Samastipur 63 2081 8.66
Tajpur 59 257 8.11
Sarairanjan 65 1715 8.94
The three major blocks, Kalyanpur, Bibhutipur and Rosera contribute more than 70% of litchi of
the district.

54
Litchi Resource Mapping Final Report
Figure 7.9: Productivity of Litchi in Samastipur
Average productivity per hectare in Samastipur is 9.54 MT/ Ha and for all the blocks it lies
between 8.1 MT/ Ha to 10.6 MT/Ha. Kalyanpur has the highest productivity with 10.66 MT/ Ha.
Rosera, Bibhutipur and Pusa are close to 10 MT/ Ha while Samastipur, Sarairanjan and Tajpur
have poor productivity.
7.5 Litchi Orchard Profile in Samastipur
The scatter plot shows the area under litchi cultivation for respondents in Samastipur district.
About 69 % of the farmers have litchi area less than 5 Ha.

55
Litchi Resource Mapping Final Report
Largest number of orchards, (57% ) in
Samstipur district are in the range of 1
Ha to 3 Ha accounting for about 800 Ha
area. Medium sized orchards of 3Ha to 5
Ha comprise of about 150 Ha. There are
more number of orchards of size above 5
Ha than those of less than 1 Ha size.
About 270 Ha area is made up of large
sized orchards of more than 5 Ha. The
smaller orchards of less than 1 ha make
up about 180 Ha in the district.

56
Litchi Resource Mapping Final Report
8. Vaishali
8.1 Overview of the District
Vaishali is centrally located in Bihar and spread over an area of 2036 Sq. Km. The district is
bordered by River Ganga on the south which separates Vaishali from Patna District. River
Gandak in the west separates it from Saran district while on the east and north it is bounded by
Samastipur and Muzaffarpur districts respectively.
The district has 16 blocks and the head quarter is located at Hajipur. The population of the
district is about 23.42 Lakh (2001 census) with a population density of 1222 persons per sq km.
The ratio of rural population is very high with only 7.3% of the population staying in urban
areas. The literacy rate is 48.55% which is lower than the national average.
The district has fertile alluvial soil. The sole source of irrigation is private tube wells. In 1998-99
about 0.75 lakh ha was irrigated from tube wells. Paddy, wheat, vegetables, banana, watermelon,
litchi and potato are the major crops cultivated in the district. With a total area of 1.8 lakh ha
under grain crops, Vaishali
produces close to 3 lakh MT of
various grains. The fruit and
vegetable production is close
to 7.5 lakh MT.
Vaishali is the second largest
producer of litchi after
Muzaffarpur. Like
Muzaffarpur and Samastipur,
Vaishali has also been a
traditional litchi growing
region and the climate and soil

57
Litchi Resource Mapping Final Report
is suitable for litchi cultivation. However, according to the NHM data in last few years, the
production seems to have sharply declined from about 40 thousands MT to about 26 thousands
MT while area has remained fairly constant at about 3500 Ha. (Fig 8.1)
Fig 8.1: Litchi Area and Production Trend in Vaishali
Source: National Horticulture Mission
8.2 Litchi Area in Vaishali
For the resource mapping, five blocks that were traditional litchi growing areas were considered,
Bhagwanpur, Goraul, Mahua, Lalganj and Vaishali. However, during quick survey and FGD, it
was found that Belsar also produces good quantity of litchi and hence the detailed survey
included Belsar as one of the blocks for Vaishali. . Figure 8.2 provides a detail of major litchi
producing Panchayats in the selected blocks.
Figure 8.2: Litchi Villages in Vaishali
Blocks Main Villages
Bhagwanpur Warispur, Bhagwanpur, Harbanspur, Manganpur
Goraul Katarmala, Mohamadur, Adampur, Islampur, Pirapur

58
Litchi Resource Mapping Final Report
Mahua Fulwaria, Chawkmujahid, Mirzanagar
Lalganj Jalalpur, Namidih, Parmanandpur
Belsar Sien, Karnejee, Paterah, Kataru, Rikhar, Raudi Pokhar
Vaishali Hussaina, Kamtauliya, Nawada, Simra
Lalganj merges as the block with largest area of litchi in Vaishali district with an estimated
acreage of 527 Ha followed by Bhagwanpur having an estimate 508 Ha and Mahua at an
estimate of 492 Ha. Following table has details of total litchi area and number of plants in the
selected blocks. Lalganj has the highest number of plants in the district.
Figure 8.3: Litchi Area and Number of Plants in Vaishali
Blocks Total Area Under Litchi (Ha)
Number of Plants
Bhagwanpur 508.70 69947
Goraul 451.01 62014
Mahua 492.18 67674
Lalganj 526.98 72459
Belsar 280.15 38521
Vaishali 461.82 63501
Total 2720.84 374115
Distribution of litchi area and production in Vaishali is shown in figure 8.4.1. The production is
highest in Bhagwanpur at 4756 MT due to larger productivity figure for the block as compared to
Lalganj which has the largest litchi area. Bhagwanpur, Goraul, Vaishali and Mahua command
more than 75% of the total area and production.

59
Litchi Resource Mapping Final Report
Figure 8.4 Area and Production in Vaishali
Total area in Vaishali in these six blocks is estimated to be 2720 Ha and total estimated
production is 24032 MT.
Figure 8.5: Number of Plants in Vaishali
Total number of litchi plants estimated in Vaishali district is 3, 74,115. Three blocks, Lalganj,
Bhagwanpur, and Mahua have close to seventy thousands plants. Lalganj has highest number

60
Litchi Resource Mapping Final Report
with about 72,459 plants followed by Bhagwanpur at 69,947 plants and Mahua ay 67,674 Plants.
Goraul and Vaishali have close to 63,000plants each.
8.3 Litchi varieties in Vaishali
Vaishali is slightly different from Muzaffarpur and Samastipur in with respect to varieties of
litchi grown. In Vaishali, the numbers of plants of China variety are more than that of Shahi
variety as shown in the figure below. However in the specific blocks of Bhagwanpur and Goraul,
Shahi is the major variety grown.
Figure 8.6 Varieties of Litchi in Vaishali
Blocks Shahi Shahi (%) China China (%)
Bhagwanpur 45465 65 24481 35
Goraul 33487 54 28526 46
Mahua 29100 43 38574 57
Lalganj 44925 62 27535 38
Belsar 13482 35 25038 65
Vaishali 19685 31 43816 69
186145 48 187970 52
8.4 Production and Productivity in Vaishali
The average productivity in Vaishali is about 64 kg per plant. The block wise productivities are
given in the figure below.
Figure 8.7: Productivity of Litchi in Vaishali
Blocks Average productivity per plant (Kg)
Total Production (MT)
Productivity (MT/Ha)
Bhagwanpur 68 4756 9.4 Goraul 70 4341 9.6 Mahua 65 4399 8.9 Lalganj 62 4492 8.5

61
Litchi Resource Mapping Final Report
Belsar 58 2234 8.0 Vaishali 60 3810 8.3 63.83 24033 8.8
Average productivity in Vaishali is 8.8 MT/Ha, far below Muzaffarpur and Samastipur. The
figure below shows that the productivity is highest in Goraul block at 9.6 MT/ Ha and it is least
in Belsar at 8.0 MT/ Ha. The productivity figure for Bhagwanpur is 9.4 MT/ Ha.
Figure 8.8 Productivity of Litchi in Vaishali
8.5 Litchi Orchard Profile in Vaishali
Figure 8.9 Scatter plot for Litchi Areas

62
Litchi Resource Mapping Final Report
The scatter plot for litchi areas of respondents in Vaishali shows the pattern of orchard size. It is
evident that majority of the orchards are smaller than 5 Ha. Very few of the orchard are large
sized between 5 and 10 Ha while out there is just one respondent out of 50 with larger than 10
Ha litchi area.
Figure 8.10 Orchard Profile in Vaishali
The figure 8.10 below shows that the largest
number of orchards, (56% ) in Vaishali district
are in the range of 1 Ha to 3 Ha accounting for
about 1523 Ha area. The second largest area,
435 Ha is of orchard size less than 1 Ha. While
both large orchard size, between 3Ha to 5 Ha
and more than 5 Ha account for equal area at
380 Ha.

63
Litchi Resource Mapping Final Report
9 East Champaran
9.1 Overview of the District
East (Purbi) Champaran, popularly known as Motihari, is located at the North Western end of
Bihar. It is spread across 3968.0 square kilometer divided into 27 administrative blocks. It is
surrounded by Sheohar and Sitamarhi in East, West Champaran in West, Muzaffarpur in South
and Gopalganj in South Western side. It shares international border with Nepal in the North.
Great Gandak and Baghmati are the two main rivers flowing through the district. According to
the census 2001, overall literacy is 37.5%; male literacy is 49.3% while that of women is 24.3%.
Agriculture is the main occupation in the district with primary crops being paddy, sugar cane,
jute and pulses. The total cultivable land in the district is 303,923 Hectare of which 176,115 Ha
is irrigated while rest 127,808 Ha is non irrigated land.
The district is famous for sugar
cane cultivation and has a
number of sugar mills in
erstwhile Champaran district.
However, with the demise of
sugar industry in Bihar,
sugarcane production was not
very profitable and farmers
started exploring other
alternatives. Being close to
Muzaffarpur and having similar
climate, Litchi cultivation
became one of the options and many farmers moved to litchi from sugarcane. The blocks closer
to Muzaffarpur, Mahesi, Chakiya, Madhuban were more influenced and they have good amount
of litchi production. According to the study conducted, these four blocks produce about 10,000
MT of litchi.

64
Litchi Resource Mapping Final Report
Litchi cultivation in East Champaran being a recent phenomenon, a majority of the orchards is
about 2 decades old. The estimated numbers of plants are 153602. Infrastructure for litchi
marketing and storage in the district has not developed and hence supply chain is not efficient.
The following sections discuss litchi resources in the district in detail.
The NHM data shows a very high figure for area and production of litchi in East Champaran
over last ten years. The area is constantly increasing in the district and so the level of production.
The resource mapping was commissioned only for two blocks which was later increased to four
blocks after FGD. It was also found that Litchi has come up as one of the most preferred crop in
flood resistant high and medium lands. Litchi is being cultivated in interior blocks as well which
includes Pakhri Dayal, Motihari, Ghorasahan, Pipra Kothi, Areraj, Turkauliya, Madhuban,
Harsidhi and other blocks.
Figure 9.1: Litchi Area and Production Trend on East Champaran
Source: National Horticulture Mission
The estimate for entire district may not be accurate in absence of the data from other than four
blocks. However, the survey result estimates 1100 Ha litchi area and about 10,000 of litchi from
these four blocks alone making East Champaran as a dark horse in Litchi Map surpassing
Vaishali and Samastipur. When considered for other blocks, the number may be much higher for
the entire district. .

65
Litchi Resource Mapping Final Report
9.2 Litchi Area in East Champaran
As mentioned earlier litchi cultivation has picked up in East Champaran over the last two
decades. Most of the litchi orchards are about 20- 25 years old. Though four blocks close to
Muzaffarpur, Mahesi, Chakiya, Kalyanpur and Madhuban have huge acreage, the areas farther
also seems to have significant number of orchards.
For the current study, only Mahesi and Chakiya were selected while Kalyanpur and Madhuban
were added after FGD. The table below shows important panchayats in four blocks and other
blocks of litchi production.
Figure 9.2 Litchi Blocks and Important Villages in East Champaran
Blocks Main Villages
Mahesi Bhurkundwa, Mahesi, Kataha, Salempur, Nonimahal
Chakiya Baragobind, Baisaha, Tarania
Kalyanpur Shambhuchak, Madan Sirsia, Rajpur
Madhuban Madhuban, Keepapur, Dihu Tola, Math, Saungia
Pakhri Dayal, Motihari, Ghorasahan, Pipra Kothi, Areraj, Turkauliya, Madhuban, Harsidhi
Figure 9.3 shows litchi resources in East Champaran. Total area under litchi in these four blocks
is estimated to be 1117 Ha. Mahesi commands the largest area and has about 397 Ha while
Kalyanpur closely follows with 377 Ha. Chakiya has about 204Ha and Madhuban has about 139
ha. Total number of plants in all these blocks is estimated to be about 1, 53,602.
Figure 9.3: Litchi Area and Number of Plants in East Champaran
Blocks Total Area Under Litchi (Ha)
Number of Plants
Mahesi 397 54607
Chakiya 204 28033 Kalyanpur 377 51882

66
Litchi Resource Mapping Final Report
Madhuban 139 19080
Total 1117 1,53,602
Figure 9.4 depicts the area and production of litchi in the district. As shown above, Mahesi leads
in both area and production followed by Kalyanpur. Mahesi produces about 4200 MT while
Kalyanpur produces about 3200 MT of litchi
Figure 9.4 Litchi area and Production in East Champaran
Total number of litchi plants is estimated to be 1, 53,602 in the district. Mahesi has about 54
thousand litchi plants while Kalyanpur has around 52 thousand litchi plants. Chakiya has about
28 thousand and Madhuban has a small number of 19 thousands plants. (Fig 8.3)
Figure 9.5 Number of Litchi Plants in East Champaran

67
Litchi Resource Mapping Final Report
9.3 Litchi varieties in East Champaran
East Champaran has more China varieties than Shahi, the ratio being almost 60:40. In all the
blocks, we surveyed China is in majority, Madhuban having largest percentage of China variety
of litchi plants at 70% and Mahesi has close to 60%. Figure 9.6 shows the number of plants and
variety wise percentage.
Figure 9.6: Litchi Variety in East Champaran
Blocks Shahi Shahi (%) China China (%)
Mahesi 21843 40 32764 60
Chakiya 12615 45 15418 55
Kalyanpur 23347 45 28535 55
Madhuban 5724 30 13356 70
63529 40 90074 60
9.4 Production and Productivity in East Champaran
The average productivity in East Champaran is 9.14 MT/ Ha.
Figure 9.7: Productivity of Litchi in East Champaran
Blocks Average productivity per plant (Kg)
Total Production (MT)
Productivity (MT/Ha)
Mahesi 78 4259 10.73
Chakiya 66 1850 9.08
Kalyanpur 62 3217 8.53 Madhuban 60 1145 8.25 66.5 10471 9.14
The figure below shows that the productivity is highest in Mahesi at 10.73 MT/ Ha followed by
Chakiya at 9.08 MT/ Ha.

68
Litchi Resource Mapping Final Report
Figure 9.8: Productivity of Litchi in East Champaran
9.5 Litchi Orchard Profile in East Champaran
The scatter plot of litchi area of farmers (figure 9.9) is more evenly spread than other districts.
Figure 9.9: Scatter plot of Litchi area of farmers.
Figure 9.10: Profile of Orchards in East Champaran
The figure below shows that there are a large
number of farmers having litchi area less than
4 Ha; about 60% of the farmers have less than
less than 3 Ha of litchi area. The share of the
medium sized litchi orchard (between 3Ha – 5
Ha) is 18% while the share of the largest size
orchards is 22%.

69
Litchi Resource Mapping Final Report
10 West Champaran, Darbhanga and Sitamarhi
10.1 Overview of West Champaran
West Champaran is located at western end of Bihar. It shares international border with Nepal in
the North, Gopalganj and East Champaran in the south, Padarua and Deoria district of Uttar
Pradesh in West and East Champaran in east. Total area of the district is 5228 square kilometer
of which only 43% is agricultural land. West Champaran is the only district in Bihar with a
sizable forest area of 18% of total land. Gandak or Narayani and Sikrahana or little Gandak are
the two important rivers of this district.
Agriculture is the main occupation of the district. Tirhut, Tribeni and Done canals are the most
prominent canals operating in this district. They get their water supply from Gandak river at
Valmikinagar, the northern most part of the district bordering Nepal.
West Champaran is not a
traditional litchi growing
area. It is famous for
sugarcane production,
which has drastically
reduced due to poor
conditions of sugar mills.
It is expected that and
commonly perceived by
the government sources
that litchi has replaced
sugarcane and hence has
acquired a prominent position as important fruit crop. And the available data from NHM also
shows the similar trend citing a very huge area of litchi in the district. (Fig 10.1)

70
Litchi Resource Mapping Final Report
Fig 10.1: Litchi Area and Production Trend on West Champaran
Source: National Horticulture Mission
However, field level studies showed a completely different picture for West Champaran and it
was found that the district has very low acreage of litchi. The trend showed a very high level of
production around 2002-03 which decreased recently with production coming down to 13,000
MT. Though various schemes of NHM implemented in the district are promoting litchi
cultivation in last three years, the area under litchi is still not as high as other litchi producing
districts.
10.2 Litchi Resources in West Champaran
Two blocks of West Champaran, Barian and Narkatiyaganj were identified for resource
mapping. During FGD stage it was suggested that a large number of litchi plants have been
planted in last 2-3 years and hence the number of blocks for detailed survey were increased.
However, the detailed survey revealed that most of the new litchi plants have been sown for
domestic purpose. In fact, mango orchards are coming up in large numbers as a result of
initiatives of National Horticulture Mission.

71
Litchi Resource Mapping Final Report
Figure 10.2: Main Litchi blocks and Panchayats in West Champaran
Districts Blocks Villages
West Champaran
Narkatiyaganj, Bairia, Chanpatiya, Nautan, Manjhaulia
D.K.Sikarpur, Dumaria, Pakadiya, Jagdishpur, Pipra, Saria, Tumkaria
In addition to Narkatiyaganj and Barian, the blocks adjoining East Champaran, Nautan and
Manjhaulia have some litchi orchards. Chanpatiya also have some orchards. Most of the old
orchards of litchi are in D.K.Sikarpur, Dumaria, Pakadiya, Jagdishpur, Pipra, Saria, Tumkaria
Villages.
The total litchi acreage in the district including all the blocks is estimated to be about 350 Ha
while the estimate for number of plants is around forty thousand based on an average of 120
plants per hectare. The production is estimated to be around 2500 MT. Productivity is about 7
MT/ Ha which is low compared to other districts.
Figure 10.3: Litchi Resources in West Champaran
District Area (Ha) Number of Plants Production (MT) Productivity (MT/Ha)
West Champaran 343 41,140 2400 7
The scatter plot for litchi area of farmers shows that most of the orchard size are small, 41% of
them are less than 1 Ha size while 24% of them are between 1Ha and 3Ha. As mentioned above,
there are few large farms traditionally owned by the families.

72
Litchi Resource Mapping Final Report
10.3 Sitamarhi
Sitamarhi is one of the most
backward districts of Bihar. It is
surrounded by Nepal in North, East
Champaran in west, Madhubani and
Darbhanga in east and Muzaffarpur
in south. The main occupation in the
district is agriculture the district is
affected by flood every year which
forces people to abandon their
villages during flood time.
Baghmati river which changes its
course every year is the main reason
for floods.
Looking at NHM data, Sitamarhi is touted as having the third largest litchi area in the state with
2097 Ha, after Muzaffarpur and Vaishali. In terms of production also, it is much above other
districts at more than 15,000 MT. (Fig 10.4)
Figure 10.4: Litchi Area and Production Trend in Sitamarhi
Source: National Horticulture Mission

73
Litchi Resource Mapping Final Report
Strikingly, the field survey revealed a completely different picture as described below. Two
blocks of Sitamarhi adjoining Muzaffarpur-Dumra and Runisaidpur were selected for litchi
resource mapping. However, during quick assessment and FGD, it was found that Sitamarhi
district has insignificant litchi acreage. Even blocks adjoining Muzaffarpur do not cultivate much
litchi. The main reason cited for the above is vagaries of nature in terms of devastating flood
every year. Litchi plants may not be able to sustain continuous floods and hence it was found that
litchi cultivation may not be suitable for this district.
There is however a panchayat, Janipur in Nanpur block which has some significant litchi
production. The others are mostly scattered in few blocks which remain relatively unaffected by
floods.
The estimate for litchi in Sitamarhi district is very low at about 125 Ha and number of plants
about 15,000. The total production of litchi in the district is about 630 MT.
Figure 10.5: Litchi Resources in Sitamarhi
Districts Blocks Villages Area (Ha)
Number of Plants
Production (MT)
Sitamarhi Nanpur, Dumra, Runisaidpur
Janipur, Rewari, Athari
125 15000 630

74
Litchi Resource Mapping Final Report
10.4 Darbhanga
Darbhanga is surrounded in north
by Madhubani district, on the south
by Samastipur district, on the east
by Saharsa district and on the west
by Sitamarhi and Muzaffarpur
districts. The total area of the
district is 2279 square kilometer. It
is divided into three subdivisions,
eighteen blocks, 329 panchayats
and 1269 villages. Three important
rivers of North Bihar, Kosi, Gandak
and Baghmati flows throw Darbhanga.
The District of Darbhanga can be divided into four natural divisions. The eastern portion
contains fresh silt deposited by the Kosi River. This region was under the influence of Kosi
floods till the construction of Kosi embankment in the Second Five Year Plan. It contains large
tracts of sandy land covered with wild marsh. The second division comprised of the anchals
lying south of the Burhi Gandak river and is the most fertile area in the district. It is also on
higher level than the other parts of the district and contains very few marshes. It is well suited to
the rabi crops. The third natural region is the doab between the Burhi Gandak and Baghmati and
consists of the low-lying areas dotted over by chaur and marshes. It gets floods every year. The
fourth division covers the Sadar sub-division of the district. This tract is watered by numerous
streams and contains some up-lands.
According to NHM data, Darbhanga has about 800 Ha of Litchi areas and about 6000 MT
production (Fig 10.6)

75
Litchi Resource Mapping Final Report
Figure 10.6: Litchi Area and Production Trend in Darbhanga
Source: National Horticulture Mission
As in the case of Sitamarhi, the field survey revealed that both area and production under litchi
have drastically gone down in Darbhanga. Two blocks of the district, Jale and Bahadurpur were
selected for resource mapping of litchi. However, it was found that the district does not have
significant acreage under litchi. Litchi is cultivated in few pockets and mainly in the orchards of
small size in blocks Bahadurpur, Dekuli and Jale
The estimate for litchi acreage in Darbhanga is about 100 Ha, for plants are 12500 and
production is about 525 MT.
Figure 10.7: Litchi Resources in Darbhanga
Districts Blocks Villages Area (Ha)
Number of Plants
Production (MT)
Darbhanga Bahadurpur, Dekuli, Jale
Baraura, Maniyari, Khairpur, Jalwara
100 12500 525

76
Litchi Resource Mapping Final Report
11 Conclusion and Recommendations
The resource mapping exercise has been instrumental in reiterating the huge potential of Litchi
sub sector in Bihar. It also underscores the inefficiencies and gaps at various levels both in
cultivation aspects as well as the post harvest stage along the entire value chain. This chapter
aims at summarizing the findings of the study, drawing attention to the gaps and recommending
strategies which would provide impetus to the sub sector.
11.1 Estimate for the districts
Based on the study conducted, an estimate is provided for the districts and state with following
assumptions:
• Samastipur & Vaishali: The blocks covered in the study constitutes about 80% of the area
and production
• East Champaran &West Champaran: The blocks covered in the study constitutes about
50% of the area and production
• Darbhanga & Sitamarhi: The blocks covered in the study constitutes about 80% of the
area and production
These seven districts together have litchi area of about 16095 Ha and production of about
144882 MT, about 3% more than the data from National Horticulture Mission (NHM). This is
closer to the data from Department of Horticulture which puts the overall value of these districts
at 18426 Ha and 140362 MT for 2007-08. However, the major difference lies in the estimate for
three districts, Sitamarhi, West Champaran, and Darbhanga. The figures are compared in Table
12.1 below. The percentage in parenthesis shows variation of estimate w.r.t the government
figures.
We can observe that the largest variations at 92%, both for area and production are for
Sitamarahi district followed by Darbhanga at 83%.

77
Litchi Resource Mapping Final Report
Figure 11. 1: Estimates for the districts
Estimation for the districts DoH Data
District Area (Ha) Production (MT) Area (Ha) Production (MT)
Muzaffarpur 7535 (+4%) 68,027 (+21%) 7206 56006
Samastipur 1734 (+56%) 16,979 (+96%) 1107 8634
Vaishali 3628 (+3%) 32,044 (+20%) 3513 26489
East Champaran 2234 (+15%) 20,942 (+42%) 1887 14718
West Champaran 686 (-62%) 4,800 (-63%) 1808 13118
Sitamarhi 156 (-92%) 1,125 (-92%) 2097 15518
Darbhanga 123 (-84%) 965 (-83%) 808 5879
Total 16095 (-14%) 144882 (+3%) 18426 140362
Further, for the state, the estimated total litchi area is about 22532 Ha with a production of about
2,02,934 MT based on the assumption that these seven districts have about 60% of total litchi
area of state. There are other areas centered in around Bhagalpur which are emerging as major
litchi production hubs which supply to Eastern India.
A fully grown, healthy litchi plant should yield about 100 kg per. However, during survey it was
found that very few orchards have optimum yield and the productivity is much below. Average
production was about 69 kg per plant varying between 58 kg to 72 kg for the seven districts.
Hardly 4% of farmers are getting an average yield of more than 100 kg and about 5% of farmers
are not able to get even 50 kg of yield per plant.
11.2 Recommendations
The study recognizes the immense scope for development in production and productivity of
Litchi in the identified regions to take the advantage of favorable agro climatic conditions unique

78
Litchi Resource Mapping Final Report
to Litchi cultivation. A lot of emphasis is given to the information dissemination and awareness
on the technical aspects pertaining to cultivation and post harvest practices considering the
exacting nature of the produce. A matrix detailing service specific recommendations is given in
this section. Also, an attempt has been made to suggest possible interventions and policy
implications relevant at this juncture.
The following are few pointers towards potential areas for intervention:
• Strengthen the extension machinery in order to educate orchard owners as well as PHCs
on best package of practices.
• Field Visits could be further streamlined utilizing the data base built during the exercise.
Orchard owners could be organized into groups and field visits could be organized to
those blocks which are making headway in terms of technology adaptation and scientific
orchard management.
• Information dissemination by the department shall play a crucial role in eliminating the
skepticism about adaptation of certain recommended practices like plant spacing, soil and
leaf testing, fertilizer application, etc
• Timely availability of finance and incentives, dovetailing with other available schemes
are the need of the hour for entrepreneurs venturing into sector specific interventions like
reefer vans, pack houses, processing facilities, etc.
• Awareness campaigns could be organized to disseminate information on the distant
markets, export markets available, product specifications, etc
• Mechanisms could be evolved to share information on Price trends and demand
projections to the farming and trading community at large.
• The success stories at various levels (For example successful farmers, PHCs, traders,
processors) could be documented and published in order to evoke a sense of pride within
the community. This could be a stepping stone in brand building exercise for this sub
sector.
.

79
Litc
hi
Re
sou
rce
Ma
pp
ing
F
ina
l R
ep
ort
Typ
e of
ser
vice
D
escr
ipti
on
Rec
omm
enda
tion
s
i. T
rain
ing
and
tech
nolo
gica
l as
sist
ance
to
farm
ers
Far
me
rs t
o be
mad
e aw
are
of
the
need
for
bet
ter
culti
vatio
n pr
actic
es fo
r
• P
lant
spa
cing
an
d sc
he
dule
of
plou
ghin
g,
mul
chin
g
• Ir
riga
tion
pra
ctic
es a
nd f
requ
ency
•
Usa
ge
of
fert
ilize
rs
and
othe
r nu
triti
onal
in
puts
•
Pos
t ha
rves
t m
anag
emen
t: p
luck
ing,
sor
ting,
gr
adin
g, p
acka
ging
etc
.
• T
o pr
ovid
e be
tter
in
stitu
tiona
l lin
kage
s of
fa
rmer
s w
ith e
xist
ing
inst
itutio
ns.
• O
rgan
izin
g tr
aini
ng f
or f
arm
ers
and
prov
idin
g ex
posu
re to
bet
ter
pra
ctic
es
ii.
Fac
iliti
es f
or s
oil
test
ing
and
othe
r la
b an
alys
is
Soi
l qu
ality
is
an i
mpo
rtan
t fa
ctor
in
det
erm
inin
g th
e ov
eral
l pr
oduc
tivity
. T
he
nutr
ition
al
requ
irem
ent
coul
d be
ass
esse
d on
ly s
oil
test
ing
but
th
e re
gion
ha
s sh
orta
ge
of
such
sh
ort
age
of
an
alyt
ical
labo
rato
ry.
• F
acili
ties
for
test
ing
sho
uld
be e
stab
lishe
d in
th
e re
gion
, ei
ther
by
gove
rnm
ent
or i
n pu
blic
pr
ivat
e pa
rtn
ersh
ip m
ode
iii.
Skill
up
grad
atio
n of
labo
rs in
pre
-ha
rves
t an
d po
st
harv
est
man
agem
ent
Man
y o
f th
e pr
e an
d po
st h
arve
st m
etho
ds r
equi
re
skill
ed
labo
rs
whi
ch
are
sc
antil
y av
aila
ble.
T
he
scar
city
is
felt
seve
rely
dur
ing
harv
estin
g se
ason
an
d it
adve
rsel
y af
fect
s th
e qu
ality
of
litch
i du
e to
im
prop
er p
luck
ing
and
han
dlin
g.
• G
over
nmen
t m
ay
cons
ider
est
ablis
hmen
t o
f sk
ill
scho
ols
for
impa
rtin
g a
gric
ultu
ral
trai
ning
to
labo
rers
. T
here
are
man
y sc
hem
es
of G
oI f
or
skill
impr
ovem
ent
in s
ervi
ce s
ecto
r w
hich
can
be
utili
zed
for
this
.
iv.
Bet
ter
sort
ing,
gr
adin
g an
d pa
ckag
ing
met
hods
Cur
rent
ly,
the
was
tage
le
vel
in
supp
ly
chai
n
is
abou
t 10
-15%
m
ostly
du
e to
im
prop
er
sort
ing,
gr
adin
g an
d pa
cka
ging
et
c.
Thi
s lo
ss
can
be
min
imiz
ed b
y ad
optin
g b
ette
r m
etho
ds.
Fum
igat
ion:
In
othe
r co
untr
ies,
oxa
lic a
cid
is a
lso
used
, whi
ch m
ay
be e
xplo
red
for
this
re
gion
. P
acka
ging
: Li
tchi
bu
nche
s m
ay
be
pack
ed
in
mod
ified
atm
osph
ere
pack
ing
(MA
P)
whi
ch a
llow
s fo
r br
eath
ing
port
and
ma
y be
sto
red
in c
old
stor
age
fo
r lo
nger
she
lf lif
e.

80
Litc
hi
Re
sou
rce
Ma
pp
ing
F
ina
l R
ep
ort
Fum
igat
ion:
F
umig
atio
n b
y su
lphu
r di
oxid
e is
us
ed
to
cont
rol
bro
wni
ng
of
peric
arp
an
d m
an
y pa
ck h
ouse
s a
re fu
mig
atin
g lit
chi.
.
As
thes
e fa
cilit
ies
requ
ired
bei
ng s
usta
inab
le i
n lo
ng
run,
th
ese
ma
y be
pr
om
oted
b
y pr
ivat
e se
cto
r in
co
llabo
ratio
n w
ith t
he g
ove
rnm
ent.
The
re a
re v
ario
us
sche
mes
of
Go
I and
GoB
whi
ch c
an b
e av
aile
d b
y th
e
entr
epre
neur
s.
v.
E
stab
lishm
ent
of
Coo
l cha
in
faci
litie
s
The
re a
re t
otal
of
5 pa
ck h
ouse
s in
the
are
a w
hich
co
uld
proc
ess
only
ab
out
1000
M
T-
1200
M
T
annu
ally
. T
his
is
insu
ffic
ient
to
gi
ven
the
larg
e
quan
tity
of li
tchi
trad
e in
the
sta
te.
Pac
k ho
uses
w
ith
pre-
cool
ing
cham
bers
at
fe
w
maj
or p
rodu
ctio
n cl
uste
rs m
ay
be
set
up t
o en
sure
fir
st c
oolin
g w
ithin
5-6
hou
rs o
f har
vest
. C
old
stor
age
& R
efer
Van
s/tr
ucks
: F
or lo
nge
r sh
elf
life
whi
ch m
ay
be
requ
ired
for
expo
rt,
litch
i pa
cked
in
MA
P c
an b
e st
ored
at 1
.5 d
egre
e C
elsi
us,
incr
eas
es
its s
helf
life
by
5 to
8 w
eeks
. F
or s
hort
ter
m s
tora
ge
i.e.
less
tha
n 2
wee
ks,
it m
ay
be s
tore
d at
7 d
egr
ee
C
elsi
us.
vi.
Mar
keti
ng
Infr
astr
uctu
re
The
ove
rall
effic
ienc
y of
litc
hi v
alue
ch
ain
ma
y in
crea
se w
ith m
ore
alte
rnat
ive
chan
nel
s fo
r lit
chi
selli
ng.
At
pres
ent,
PH
C’s
are
the
sin
gle
larg
est
chan
nels
w
hich
ha
s lo
ts
defic
ienc
y on
te
rms
of
qual
ity
and
pric
e re
aliz
atio
n to
fa
rmer
s.
The
po
pula
rity
of
priv
ate
mar
kets
is
an i
ndic
atio
n of
ne
ed fo
r su
ch m
ore
ma
rket
s.
In
free
un
regu
late
d m
arke
t fo
r a
gric
ultu
ral
and
hort
icul
tura
l pr
oduc
e,
mor
e m
ultip
urpo
se
mar
kets
sh
ould
be
enco
ura
ged
whe
re f
arm
ers
can
sel
l th
eir
prod
uce
and
also
ge
t ot
her
prod
uctio
n an
d po
st
prod
uctio
n re
late
d fa
cilit
ies.

81
Litchi Resource Mapping Final Report
Appendices I: Database of Farmers and contact numbers from the detailed survey
1. Muzaffarpur
Village Block Contact No No. of litchi trees
ANAND PUR PAROO 9934392819 500
MUSHACHAK MINAPUR 9939265151 1200
MURSHANDI TOLE MATHIA MINAPUR 9507270702 1020
LASGARIPUR KANTI 9430218763 300
SADHA MOTIPUR 9334729119 500
DRONPUR MUSHAHARI 9430865628 600
BAJITPUR PAROO 9931207823 250
KHEMAEPATIL MINAPUR 9852968084 200
MANIYARI KURHANI 9798966827 600
DHAMAULI RAMNATH
KANTI 9931667578 300
CHAPRA DHARMPUR KANTI 9708022143 165
RAMPURISDAN MOTIPUR 9431082986 250
JAMALABAD MUSHAHARI 9905224829 240
DRONPUR MUSHAHARI 9334531459 300

82
Litchi Resource Mapping Final Report
2. Samsatipur
Village Block Farmers Contact Number
Litchi Tree
Sonepur Rosra Ramakant Jha 9771121329 303
Sonepur Rosra Madan Kumar Jha 183
Dhatia Rosra Arun Kumar Singh 242
Dhatia Rosra Suman Pd. Singh 419
Dhatia Rosra Bidhushekhar Pd. Singh 543
Ramgarh Bibhutipur Govind Narayan Singh 325
Ramgarh Bibhutipur Indushekhar Narayan Singh 470
Ramgarh Bibhutipur Vinod Narayan Singh 487
Barheta Kalayanpur Ramchandra Dev 9931927397 500
Shambhupatti Samastipur Ripunjay Singh 9430242456 405

83
Litchi Resource Mapping Final Report
3. Vaishali
Village Blocks Farmers Contact Number Number of Plants
Katarmala Garaul Narendra Pandey 9947391028 500
Katarmala Garaul Jagganath Pandey 9934779907 400
Adampur Garaul Ashok Kumar Chaudhary 9931291611 700
Islampur Garaul Ramchandra Singh 250
Islampur Garaul Raghunath Singh 9955686867 130
Parmanandpur Lalganj Ramchandra Pd. Singh 9934211501 350
Bhagwanpur Bhagwanpur Harendra Kumar 9931659492 240
Bhagwanpur Bhagwanpur Ravindra Kumar 200
Harbanshpur Bhagwanpur Puroshottam Kumar 06224-245044 125
Harpur Kasturi Bhagwanpur Ramanand Singh 9835054323 120
Warispur Bhagwanpur Jagdish Prasad 0612-22383153 750
Manganpur Bhagwanpur Prabhat Kumar Singh 330
Warispur Bhagwanpur Krishna Kumar Singh 9835627789 700

84
Litchi Resource Mapping Final Report
4. East Champaran
Village Blocks Farmers Contact Number
Samadpurs (South) Mahesi Md. Kasim 9831777141
Salempur North Mahesi Umakant Saran
Salempur North Mahesi Mahendra Ray
Katha (West) Mahesi Virendra Kumar Virendra 9431466801
Katha (West) Mahesi Madan Mohan Prasad 06257-254592
Katha (East) Mahesi Nand Kishore Prasad 9504227950
Chapra gabil Mahesi 9431658126
Chapra gabil Mahesi Md. Ataul Rehman 9431410157
Bathna Mahesi Madan Bhagat 9939691189
Katha Mahesi Shyam Sunder Prasad 9431665637
Bathna Mahesi Ram Bhagat 9973655462
Kasba Mahesi sarai Mahesi Md. Badruddin Ansari 9934294341
Kasba Mahesi Chowk bazaar
Mahesi Sri Ashok Kumar 9431638189
Kasba Mahesi Chowk bazaar
Mahesi Sanjay Kumar 9771131832
Kasba Mahesi sarai Mahesi Mote urn Rehman 9931209848
Chakalalu Pipra kothi Javed Ahmad 9955057887
Saungia (East) Madhuban Sri Shyamnandan Prasad 9431204381
Madan Sirsia Kalyanpur Nath Singh
Siwan Kalyanpur Md. Umar Abdullah
Baragivind Chakia Shayam Kumar 9955545294
Chakia Chakia Deep Narayan Pd.

85
Litchi Resource Mapping Final Report
Appendix II: Questionnaire for Field Survey
1. QUESTIONNAIRE FOR ORCHARD OWNER
1. LOCATION INFORMATION LFkkuh; lwpukLFkkuh; lwpukLFkkuh; lwpukLFkkuh; lwpuk
Name of the Village xkWao dk ukexkWao dk ukexkWao dk ukexkWao dk uke
Name of the Block CykWd dk ukeCykWd dk ukeCykWd dk ukeCykWd dk uke
Name of the District ftys dk ukeftys dk ukeftys dk ukeftys dk uke
2. BACKGROUND INFORMATION i`"BHkwfe lwpuki`"BHkwfe lwpuki`"BHkwfe lwpuki`"BHkwfe lwpuk 2.1 Name of the Orchard Owner, address and phone number ckx ekfyd dk uke] irk vkSj eksckbZy uEcjckx ekfyd dk uke] irk vkSj eksckbZy uEcjckx ekfyd dk uke] irk vkSj eksckbZy uEcjckx ekfyd dk uke] irk vkSj eksckbZy uEcj
2.5 Total agriculture land area dqy [ksrh okyh tehu dqy [ksrh okyh tehu dqy [ksrh okyh tehu dqy [ksrh okyh tehu ________ Bigha ch?kkch?kkch?kkch?kk/
2.6 Total area under Litchi cultivation dqy [ksrh okyh tehu ftlesa yhph mxkrs gSadqy [ksrh okyh tehu ftlesa yhph mxkrs gSadqy [ksrh okyh tehu ftlesa yhph mxkrs gSadqy [ksrh okyh tehu ftlesa yhph mxkrs gSa ________ Bigha ch?kkch?kkch?kkch?kk/
3. ORCHARD INFORMATION (3 YEAR HISTORY) ckx dh fiNys 3 lkyksa dh lwpukckx dh fiNys 3 lkyksa dh lwpukckx dh fiNys 3 lkyksa dh lwpukckx dh fiNys 3 lkyksa dh lwpuk Harvest Year
2006 2007 2008
3.1 Total Area under Litchi Harvest (in Bigha) dqy [ksrh okyh tehu ftlesa yhph mxkbZ Fkh dqy [ksrh okyh tehu ftlesa yhph mxkbZ Fkh dqy [ksrh okyh tehu ftlesa yhph mxkbZ Fkh dqy [ksrh okyh tehu ftlesa yhph mxkbZ Fkh (ch?kk esach?kk esach?kk esach?kk esa)
3.2 Total number of Litchi Plants under harvesting dqy yhph ds isM+dqy yhph ds isM+dqy yhph ds isM+dqy yhph ds isM+
3.3 Total quantity of Litchi produced (in quintals) dqy yhph dh iSnkokj ek=k fDoUVy esadqy yhph dh iSnkokj ek=k fDoUVy esadqy yhph dh iSnkokj ek=k fDoUVy esadqy yhph dh iSnkokj ek=k fDoUVy esa
3.4 Total quantity of litchi produced by variety (in Quintals) yhph dh fdLeksa ds vuqlkj dqy iSnkoyhph dh fdLeksa ds vuqlkj dqy iSnkoyhph dh fdLeksa ds vuqlkj dqy iSnkoyhph dh fdLeksa ds vuqlkj dqy iSnkokj fDoUVy esakj fDoUVy esakj fDoUVy esakj fDoUVy esa
Shahi 'kkgh'kkgh'kkgh'kkgh
China pkbukpkbukpkbukpkbuk
Other (vU;vU;vU;vU;) ______
3.5 Litchi price received per quintal yhph dh feyh dher izfr fDoUVyyhph dh feyh dher izfr fDoUVyyhph dh feyh dher izfr fDoUVyyhph dh feyh dher izfr fDoUVy
Shahi 'kkgh'kkgh'kkgh'kkgh
China pkbukpkbukpkbukpkbuk
Other (vU;vU;vU;vU;) ______
3.6 Total number of new plants planted dqy u;s ikS/ks yxdqy u;s ikS/ks yxdqy u;s ikS/ks yxdqy u;s ikS/ks yxk;sk;sk;sk;s
3.7 Total number of plants that stopped producing fruits dqy ,sls isM+ ftUgksaus Qy nsuk cUn dj fn;kdqy ,sls isM+ ftUgksaus Qy nsuk cUn dj fn;kdqy ,sls isM+ ftUgksaus Qy nsuk cUn dj fn;kdqy ,sls isM+ ftUgksaus Qy nsuk cUn dj fn;k

86
Litchi Resource Mapping Final Report
4. CURRENT STATUS OF THE ORCHARD ckx dh orZeku fLFkfrckx dh orZeku fLFkfrckx dh orZeku fLFkfrckx dh orZeku fLFkfr 4. 1 Total number of plants by age isM+ dh mezisM+ dh mezisM+ dh mezisM+ dh mez No. of plants dqy isM+dqy isM+dqy isM+dqy isM+ Average Expected yield per plant (in Kgs)
vkSlr yhph izfr isM+ fdxzk esavkSlr yhph izfr isM+ fdxzk esavkSlr yhph izfr isM+ fdxzk esavkSlr yhph izfr isM+ fdxzk esa Shahi
'kkgh'kkgh'kkgh'kkgh China
pkbukpkbukpkbukpkbuk Other
vU;vU;vU;vU;
Shahi
'kkgh'kkgh'kkgh'kkgh China
pkbukpkbukpkbukpkbuk Other
vU;vU;vU;vU;
< 4 years
4 – 7 years
8 – 12 years
13-17 years
17-21 years
21+ years
Total (years)
4.2 Yield in 2009 harvest (in quintals) :Shahi = __ China = __ Others = __ quintals o"kZ 2009 esa yhph dh vuqekfur iSnkokjo"kZ 2009 esa yhph dh vuqekfur iSnkokjo"kZ 2009 esa yhph dh vuqekfur iSnkokjo"kZ 2009 esa yhph dh vuqekfur iSnkokj 'kkgh'kkgh'kkgh'kkgh pkbukpkbukpkbukpkbuk vU;vU;vU;vU;
4.3 Expected litchi prices in 2009 harvest (Rs. Per quintal) = Shahi = __ China = __ Others = __ quintals o"kZ 2009 esa yhph dk vuqekfur nke #i;s izfr fDoUVy 'kkgh pkbuko"kZ 2009 esa yhph dk vuqekfur nke #i;s izfr fDoUVy 'kkgh pkbuko"kZ 2009 esa yhph dk vuqekfur nke #i;s izfr fDoUVy 'kkgh pkbuko"kZ 2009 esa yhph dk vuqekfur nke #i;s izfr fDoUVy 'kkgh pkbuk vU;vU;vU;vU; 4.4. Litchi Production in Last 3 years (Q):
5. INFORMATION ON OTHER ORCHARDS vU; ckxksa ds ckjs esa tkudkjhvU; ckxksa ds ckjs esa tkudkjhvU; ckxksa ds ckjs esa tkudkjhvU; ckxksa ds ckjs esa tkudkjh
5.1 According to you how many orchards are currently harvesting Litchi in your block? vkids vuqlkj vkids CykWd esa dqy fdrus ckxksa esa vHkh yhph mxkbZ tk jghs gSvkids vuqlkj vkids CykWd esa dqy fdrus ckxksa esa vHkh yhph mxkbZ tk jghs gSvkids vuqlkj vkids CykWd esa dqy fdrus ckxksa esa vHkh yhph mxkbZ tk jghs gSvkids vuqlkj vkids CykWd esa dqy fdrus ckxksa esa vHkh yhph mxkbZ tk jghs gS\\\\
Orchard Size ckx dk ukickx dk ukickx dk ukickx dk uki
No. of Orchards ckxksa dh la[;kckxksa dh la[;kckxksa dh la[;kckxksa dh la[;k
<1 Acre
1 -3 Acre
3-10 Acre
10+ Acre
Name of Investigator: Signature: ANY OTHER INFORMATION SHARED BY THE RESPONDENT
_______________________________________________________________________

87
Litchi Resource Mapping Final Report
2. QUESTIONNAIRE FOR LITCHI TRADERS
1. LOCATION INFORMATION LFkkuh; lwpukLFkkuh; lwpukLFkkuh; lwpukLFkkuh; lwpuk
Questionnaire Code
Name of the Block CykWd dk ukeCykWd dk ukeCykWd dk ukeCykWd dk uke Block Code: CykWd dksM+CykWd dksM+CykWd dksM+CykWd dksM+
Name of the District ftys dk ukeftys dk ukeftys dk ukeftys dk uke District Code: ftyk dksM+ftyk dksM+ftyk dksM+ftyk dksM+
2. BACKGROUND INFORMATION i`"BHkwfe lwpuki`"BHkwfe lwpuki`"BHkwfe lwpuki`"BHkwfe lwpuk 2.1 Name of the Trader, address and phone number yhph fodzsrk dk uke] irk vkSj eksckbyhph fodzsrk dk uke] irk vkSj eksckbyhph fodzsrk dk uke] irk vkSj eksckbyhph fodzsrk dk uke] irk vkSj eksckbZy uEcjZy uEcjZy uEcjZy uEcj
2.2 Since when you are in this trade? vki dc ls bl O;olk; esa gSa vki dc ls bl O;olk; esa gSa vki dc ls bl O;olk; esa gSa vki dc ls bl O;olk; esa gSa
2.3 How much litchi did you trade in last harvest? fiNys ekSle esa vkius fdruh yhph dk O;olk; fd;k FkkfiNys ekSle esa vkius fdruh yhph dk O;olk; fd;k FkkfiNys ekSle esa vkius fdruh yhph dk O;olk; fd;k FkkfiNys ekSle esa vkius fdruh yhph dk O;olk; fd;k Fkk
________ Quintals/fDoUVyfDoUVyfDoUVyfDoUVy
2.4 How much litchi you expect to trade in this season? bl ekSle esa vki vUnkt fdruh yhph dk bl ekSle esa vki vUnkt fdruh yhph dk bl ekSle esa vki vUnkt fdruh yhph dk bl ekSle esa vki vUnkt fdruh yhph dk O;olk; dj ik;saxs O;olk; dj ik;saxs O;olk; dj ik;saxs O;olk; dj ik;saxs
________ Quintals/fDoUVyfDoUVyfDoUVyfDoUVy
3. MARKET INFORMATION:
3.1 Major Markets covered by traders
3.2 Marketing Cost incurred a. Transportation b. Packaging
d. Storage e. Labour charges e. Any other
3.3 How
3.4 Infrastructure facilities available
3.5 Other marketing issues

88
Litchi Resource Mapping Final Report
Appendix III: Case Studies
E m ergence of L ocal M arkets: V aishali D istrict
Aggregation of Litchi happens at the Village level haats or Collection centers.
Most of these aggregation points are located conveniently on the road side
thereby easing the transportation of the produce and have evolved as trading
points in the last few years. Each local market handles about 80% of the
production from the surrounding clusters on a daily basis.
Local markets at Katarmal, Lalganj, Belsar, etc are few of the success stories in
this context. During Litchi season many traders from outside the state visit
these mandis and stay over for about fortnight to capitalize upon supply
abundance and price advantage. These markets see traders from both nearby
markets like Muzaffarpur, Hajipur and distant markets like Delhi, Eastern
region, etc. Farmers from nearby clusters bring their produce either in thelas or
mini vans.
These markets are active from 5 A.M are open round the clock as the window
period for the crop is short. Majority of the trade transactions happen in cash.
The sample produce is checked for quality aspects and the produce is auctioned
or sold in these markets after minimal price negotiation. The produce either
arrives in standard packaging (2 kg, 5 kg boxes) or in crates or boxes. These lots
are then repacked into crates/ boxes wherever required by the trader.
Depending upon the volume, it is transported to the destination either by trucks
or on Bus top.
This is a classic example of responsiveness of various players in the market to
economic incentives and that the accepted notions of behavior do not apply in
case of traditional agriculture within the framework of economic rationality.

89
Litchi Resource Mapping Final Report
F arm M anagem ent: E ast Cham paran
In Mahesi village in East Champaran district IL&FS team talked to group of
framers to understand the package of practices adopted by the farmers. Most
of the farmers have leased out the orchards to pre-harvest contractors. They
have accepted the prevailing practice as a norm. However, one farmer stood
out in the crowd and tried to modify the arrangement to his advantage.
The farmer has about 500 trees orchard and manages his orchard by
employing an orchard manager who supervises the orchard in his absence.
He leased out his orchard like many other counter parts of his. However, the
orchard is jointly managed by him along with the PHC. The average yield in
his orchard is about 80-100 kgs per plant. While the PHC is responsible for
harvesting, sorting, grading and packaging of the produce, the farmer is
market savvy and has developed strong linkages with the traders in distant
markets. This helps him gather better information on demand and price
trends in the market. This enables him to negotiate better price with the
PHC. He also recognizes the role of PHC and agrees that associating with
PHC who has core competency in activities like harvesting, sorting,
packaging, transporting etc in a gainful manner has proved beneficial to him.
This case sets an example of how individual effort can gain out of the
synergies of various players who bring in their core competencies to a
common platform.