Lit Rev on MarineTranspo-Coastal Tourism_FINAL
55
Transcript of Lit Rev on MarineTranspo-Coastal Tourism_FINAL

8/8/2019 Lit Rev on MarineTranspo-Coastal Tourism_FINAL
http://slidepdf.com/reader/full/lit-rev-on-marinetranspo-coastal-tourismfinal 1/55

8/8/2019 Lit Rev on MarineTranspo-Coastal Tourism_FINAL
http://slidepdf.com/reader/full/lit-rev-on-marinetranspo-coastal-tourismfinal 2/55

8/8/2019 Lit Rev on MarineTranspo-Coastal Tourism_FINAL
http://slidepdf.com/reader/full/lit-rev-on-marinetranspo-coastal-tourismfinal 3/55
T ABLE OF CONTENTS\
LIST OF TABLES .................................................................................................................. II
LIST OF FIGURES ................................................................................................................ II ACRONYMS........................................................................................................................ III
I. INTRODUCTION.................................................................................................................1
II. THEORETICAL FRAMEWORK............................................................................................3
A. The Concept ........................................................................................................................ 3
B. Valuation Methods.............................................................................................................. 5
III. RELATED STUDIES .......................................................................................................15
A. Marine Transportation Valuation Studies ........................................................................ 15
1. Douglas-Westwood Limited. 2005. World Marine Markets. Douglas-Westwood
Limited, Canterbury. ............................................................................................................... 15 2. Mandale, Maurice et al. 1998. Estimating the Economic Value of Coastal and Ocean
Resources: The Case of Nova Scotia. Oceans Institute of Canada and AtlanticCoastal Zone Information, Canada............. .......... ........... .......... ........... .......... ........... .......... .... 16
3. The Allen Consulting Group. 2004. The Economic Contribution of Australia’s
Marine Industries .................................................................................................................... 18
4. Mandale, Maurice.2000. The Economic Value of Marine-Related Resources in New
Brunswick. New Brunswick of Fisheries and Aquaculture and Department of Fisheries and Oceans, New Brunswick................................................................................... 20
5. Canmac Economics, School for Resource and Environmental Studies, EnterpriseManagement Consultants and the Secretariat of the Atlantic Coastal ZoneInformation Steering Committee. 2002. The Value of the Ocean Sector to the
Economy of Prince Edward Island, prepared for the Government of Prince EdwardIsland and the Government of Canada, 114p.......................................................................... 21
6. Kildow, Judith and Colgan, Charles. 2005. California’s Ocean Economy, Report to
the Resources Agency, State of California. National Economics Program, California........... 22
7. United Nations. 2003. Review of Maritime Transport, 2003: Report by the UNCTADSecretariat. United Nations, New York and Geneva.......... ........... .......... ........... .......... ........... 23
B. Coastal Tourism ................................................................................................................ 23
1. Douglas-Westwood Limited. 2005. World Marine Markets. Douglas-WestwoodLimited, Canterbury. ............................................................................................................... 23
2. Mandale, Maurice et al. 1998. Estimating the Economic Value of Coastal and Ocean
Resources: The Case of Nova Scotia. Oceans Institute of Canada and AtlanticCoastal Zone Information, Canada............. .......... ........... .......... ........... .......... ........... .......... .... 24
3. The Allen Consulting Group. 2004. The Economic Contribution of Australia’s Marine Industries .................................................................................................................... 25
4. Mandale, Maurice.2000. The Economic Value of Marine-Related Resources in New
Brunswick. New Brunswick of Fisheries and Aquaculture and Department of Fisheries and Oceans, New Brunswick................................................................................... 25
5. King, Philip. Economic Analysis of Beach Spending and the Recreational Benefits of
Beaches in the City of San Clemente....................................................................................... 25
6. Kildow, Judith and Colgan, Charles. 2005. California’s Ocean Economy, Report to
the Resources Agency, State of California. National Economics Program, California........... 26
LITERATURE REVIEW ON M ARINE TRANSPORTATION AND COASTAL TOURISM I

8/8/2019 Lit Rev on MarineTranspo-Coastal Tourism_FINAL
http://slidepdf.com/reader/full/lit-rev-on-marinetranspo-coastal-tourismfinal 4/55
7. Samonte-Tan, G. PB., E. Tabara and C. Caballes. 2004. Coastal and Marine
Biodiversity Resource Economic Valuation: Bohol Marine Triangle. The CoastalConservation and Education Foundation, Inc. and Bohol Marine Triangle Project,Cebu City, 109 p. .................................................................................................................... 27
IV. PHILIPPINE MARITIME INDUSTRY..................................................................................29
A. Maritime Transportation Sector ........................................................................................ 29 1. Domestic Shipping.................................................................................................................. 29
2. Overseas Shipping................................................................................................................... 34
B. Port Sector......................................................................................................................... 36
V. PHILIPPINE COASTAL TOURISM ....................................................................................43
A. Status of Coastal Tourism in the Philippines and their Impacts ....................................... 43
B. Legal Framework .............................................................................................................. 44
REFERENCES....................................................................................................................48
LIST OF TABLES
Table 1. Resource Uses, Functions and Types of Value ............................................... 5Table 3. Valuation Methods........................................................................................... 6Table 3. Ports Key Data, 1994..................................................................................... 18Table 4. Input-Output Multipliers, 1996-1997 ............................................................ 19Table 5. Different Types of Tourist Spending in Nova Scotia .................................... 24Table 6. Tourism Key Data, 1994................................................................................ 24Table 7. Dive Shop Rates and Gross Revenues........................................................... 27Table 8. Number of Tourists........................................................................................ 28
Table 9. Annual Net Revenues from Tourism Businesses .......................................... 28Table 10. Annual Net Benefits from Tourism............................................................... 28Table 11. Shipping Industry Stakeholders..................................................................... 30Table 12. Domestic Shipping Sector Policies................................................................ 32Table 13. Overseas Shipping Sector Policies ................................................................ 35Table 14. Port Facilities and Services............................................................................ 36Table 15. Legal Authorities on Philippine Port System ................................................ 37Table 16. Port Sector Policies........................................................................................ 40Table 17. Indicators of Port Efficiency.......................................................................... 41Table 18. Coastal Tourism Economic Impacts.............................................................. 43Table 19. Coastal Tourism Issues, Applicable Policies and Responsible Agencies...... 44
LIST OF FIGURES
Figure 1. Total Economic Valuation Framework ........................................................... 3Figure 2. Philippine Port System .................................................................................. 39
II THEPHILIPPINEENVIRONMENTALGOVERNANCE2 PROJECT

8/8/2019 Lit Rev on MarineTranspo-Coastal Tourism_FINAL
http://slidepdf.com/reader/full/lit-rev-on-marinetranspo-coastal-tourismfinal 5/55
ACRONYMS
ABS - Australian Bureau of Statistics
AO - Administrative OrderBCDA - Bases Conversion Development AuthorityBMT - Bohol Marine TriangleCENRO - Community Environment and Natural Resources OfficeCHED - Commission on Higher EducationCRM - Coastal Resources ManagementCSRS - Cargo Service Rating SystemDENR - Department of Environment and Natural ResourcesECA - Environmentally Clinical AreaEIS - Environmental Impact StatementEMB - Environmental Management Bureau
FTE - Full-Time EquivalentGATS - General Agreement on Trade in ServicesGDP - Gross Domestic ProductGRT - Gross Registered TonnageHCPT - Harbor Center Port TerminalIACS - International Association of Classification SocietiesIEE - Initial Environmental ExaminationLGU - Local Government UnitMICT - Manila International Container TerminalMOA - Memorandum of AgreementMTC - Maritime Training Council
NEDC - National Ecotourism Development CouncilNRT - Net Registered TonnageNTC - National Telecommunications CommissionPAWB - Protected Area Wildlife BureauPD - Presidential DecreePFDA - Philippine Fisheries Development AuthorityPPA - Philippine Ports AuthorityPTA - Philippine Tourism AuthorityRA - Republic ActREC- - Regional Ecotourism CommitteeRORO - Roll-On Roll-Off
SIC - Standard Industrial ClassificationTESDA - Technical Education and Skills Development AuthorityTEV - Total Economic ValuationUNCTAD - United Nations Conference on Trade and DevelopmentUNIDO - United Nations Industrial Development OrganizationWTO - World Tourism Organization
LITERATURE REVIEW ON M ARINE TRANSPORTATION AND COASTAL TOURISM III

8/8/2019 Lit Rev on MarineTranspo-Coastal Tourism_FINAL
http://slidepdf.com/reader/full/lit-rev-on-marinetranspo-coastal-tourismfinal 6/55
IV THEPHILIPPINEENVIRONMENTALGOVERNANCE2 PROJECT

8/8/2019 Lit Rev on MarineTranspo-Coastal Tourism_FINAL
http://slidepdf.com/reader/full/lit-rev-on-marinetranspo-coastal-tourismfinal 7/55
LITERATURE REVIEW ON
M ARINE TRANSPORTATION AND COASTAL TOURISM
I. INTRODUCTION
Increasing governance in Coastal Resource Management (CRM) entails a comprehensiveunderstanding of all the economic activities supported by coastal resources and services.It requires calculation of benefits and costs derived from a particular resource use suchthat policy changes are directed towards maximized sustainable use of the said resource.Resource valuation, then, provides a framework by which to evaluate economic impactsof coastal resource uses. It is a guide for decision-makers to arrive at the most optimaluse of coastal resources. It attempts to quantify not only financial revenues fromresources uses but also positive externalities and foregone costs from the present resource
uses. In relation with this, the first section of this paper offers a glimpse of resourcevaluation which can be contextualized in studying coastal resources and their services. Itoutlines valuation techniques used, their advantages and disadvantages as well as theareas in which they are most applicable.
The second part of this paper provides a review of related coastal valuation studiesconducted for maritime transportation, port and coastal tourism. It seeks to present anoverview of the valuation techniques which have been used and available valuationfigures/data that can be used as reference for future studies. It should be noted that thispaper is primarily concerned with the latter coastal resource uses. Douglas-Westwood(2005) in the study “World Marine Markets” lists maritime activities involving the
following sectors:
1) Shipping and transport. This sector is categorized into: deep-sea transport (shippingon long sea routes); and short-sea shipping (between national or local ports);
2) Marine leisure and tourism. This includes activities like sailing and boating, watersports, recreational diving, sea angling and cruise holidays;
3) Marine equipment. These are the capital items of the civil and naval shipbuildingsector such as the propulsion systems and machinery;
4) Offshore oil and gas. This is comprised of floating and sub-sea production, andinvestments in offshore pipelines and onshore LNG plants;
5) Fish/seafood processing.
6) Fishing;7) Shipbuilding;8) Naval shipbuilding;9) Ports. These are important for fishing industry, shipping cargoes and, tourism and
recreation;10) Marine aquaculture;11) Yacht and boatbuilding. This is a component of the leisure boating sector, including
marina operations and other operational expenditure, chandlery, motor sales etc;
LITERATURE REVIEW ON M ARINE TRANSPORTATION AND COASTAL TOURISM 1
8/8/2019 Lit Rev on MarineTranspo-Coastal Tourism_FINAL
http://slidepdf.com/reader/full/lit-rev-on-marinetranspo-coastal-tourismfinal 8/55
12) Cruise industry;13) Research and Development (R & D);14) Marine services. Activities of the sector are ship operations, broking and insurance,
and specialist publications;15) Security and control. This is basically referring to maritime security which include,
among others, modifying ships and collecting security inspection fees;16) Education and training. These are conducted for seafarer training, offshore workertraining and higher education for marine courses;
17) Underwater technology. This encompasses manufacturing of high technologyequipment related with hydrographic survey, oceanographic research and all otherwater operations. Examples of these are underwater vehicles (ROVs, AUVs),oceanographic instrumentation and deployment systems, sonars and survey systemsand underwater navigation systems;
18) Underwater vehicle operations;19) Media which is instrumental in dissemination of the industry’s market and technical
information;
20) Arts and culture. This is for increasing public awareness on marine industries andforms part of leisure and tourism sector; and21) Coastal engineering.
The last part of the paper briefly introduces local maritime transport, port and coastaltourism activities. It describes the economic characteristics of each sector, its presentstatus, institutional/organizational structure, existing issues and challenges and policiesbeing implemented.
2 THEPHILIPPINEENVIRONMENTALGOVERNANCE2 PROJECT

8/8/2019 Lit Rev on MarineTranspo-Coastal Tourism_FINAL
http://slidepdf.com/reader/full/lit-rev-on-marinetranspo-coastal-tourismfinal 9/55
II. THEORETICAL FRAMEWORK
A. THE CONCEPT
Resource valuation is defined as “the process of assigning a measurable value, usuallymonetary, to a particular resource, product or activity.”1 It is an essential policy-makinginstrument that is based on the Total Economic Valuation (TEV) Approach, a significantdecision-making tool that calculates the total value of a resource, other than its usevalues. (Francisco, 2003). Thus, TEV considers a resource’s use and non-use values. Usevalues can either be direct or indirect. Direct use values refer to consumptive values of goods and services which can either be extractive and non-extractive. Industrialprocesses, agricultural, recreation and tourism benefits are some uses belonging to thiscategory. On the other hand, indirect use values mostly involve ecological servicesprovided by natural resource ecosystems. In the case of the coastal sector, thesefunctional gains are in the form of natural habitats, biological/ecosystem support,
physical protection, physical location and life support. (Bourassa et al)
On the other hand, non-use values are economic benefits gained from the resource evenwithout direct physical consumption. These can be existence, option or bequest value.Existence value is the value of the resource to person knowing that the resource exists (ispreserved) and can be used now and in the future. The value of protecting and/orconserving the resource for an option to use in the future is called option value. Bequestvalue is the value of a natural resource to a person desiring to bequest future generationwith the opportunity to benefit from it. Figure 1 below shows the over-all framework.
Total Economic Value
Use Value Non-Use Value
Direct-Use Indirect-UseOption Value Bequest
Existence/Preservation
Value
Future directand indirect
use
Value ofleaving useand non-use
values to
offspring
Value ofleaving useand non-use
values to
offspring
Functionalbenefits enjoyed
indirectly
Outputs/servicesthat can beconsumed
directly
Figure 1. Total Economic Valuation FrameworkSource: White and Trinidad. 2003. The Values of Philippine Coastal Resources: Why Protection and
Management are Critical
1 White, A. and Trinidad, A. 1998. The Values of Philippine Coastal Resources: Why Protection and Management areCritical. Coastal Resource Management Project, Cebu City.
LITERATURE REVIEW ON M ARINE TRANSPORTATION AND COASTAL TOURISM 3

8/8/2019 Lit Rev on MarineTranspo-Coastal Tourism_FINAL
http://slidepdf.com/reader/full/lit-rev-on-marinetranspo-coastal-tourismfinal 10/55
Essentially, TEV targets to measure the economic impacts and/or contribution of aresource, the effects of resource uses and in the end, develop strategies that will enhanceeconomic values and reduce degradation of the said resource. The valuation, in general,entails the following key activities:
1) Identification of valuation objectives. This is determining the reasons for the conductof the resource valuation. This is relevant in the succeeding decision-makingprocesses that will be undertaken based on the results of the valuation. A coastal citymay opt to conduct a valuation study to measure economic contributions of itsresources—fish, coral reefs, shore—and negative impacts of present resource uses forthe purpose of identifying management activities;
2) Identification of all uses and ecosystem functions. This is an essential step to capturethe total value of the resource. List the major uses and functions supported by theresource. A direct and/or indirect relationship of existing economic activities and,uses and functions must be established to set direction for policy-making. In more
details, however, actual and potential uses should be identified for a comprehensiveassessment of the value of the resource being studied;3) Data collection. Assuming that the parameters to be used in the valuation have
already been selected, data collection is the next step to be taken. For a successfuldata collection, it is necessary that the valuation method and corresponding necessaryvariables have been clearly identified and matched. In this way, establishinginterrelatedness and/or cause-effect relationships of factors involved becomes easier;
4) Identification of direct and/or indirect linkages between uses and functions. This isevaluating positive and negative impacts of resource uses on the functions supportedby the resource. For example, fishing activities should be assessed in reference to thecoastal habitat condition. Tourism activities, for one, affect water quality along thebeach. Actual and potential uses, again, should be considered;
5) Categorization of uses and determinants of value. This is classifying uses accordingto value. This is a prerequisite to identifying valuation technique to be used. A sampletable (Table 1) for a coastal valuation study is provided below.
6) Identify appropriate valuation techniques by uses. Given the uses of the resource, anappropriate valuation method should be determined vis-à-vis the valuation objectives.These valuation techniques will be discussed in the later section.
7) Compute for Total Economic Value. After identifying the values of a resource withthe selected valuation techniques, given the uses and functions supported by theresource, the TEV is, then, computed; and
8) Identify options for achieving program objectives. Valuation results have to beexamined in relation to the program objectives. Various options have to be identifiedfor choosing of the best preferred strategy. (Bourassa et al).
4 THEPHILIPPINEENVIRONMENTALGOVERNANCE2 PROJECT
8/8/2019 Lit Rev on MarineTranspo-Coastal Tourism_FINAL
http://slidepdf.com/reader/full/lit-rev-on-marinetranspo-coastal-tourismfinal 11/55
LITERATURE REVIEW ON M ARINE TRANSPORTATION AND COASTAL TOURISM 5
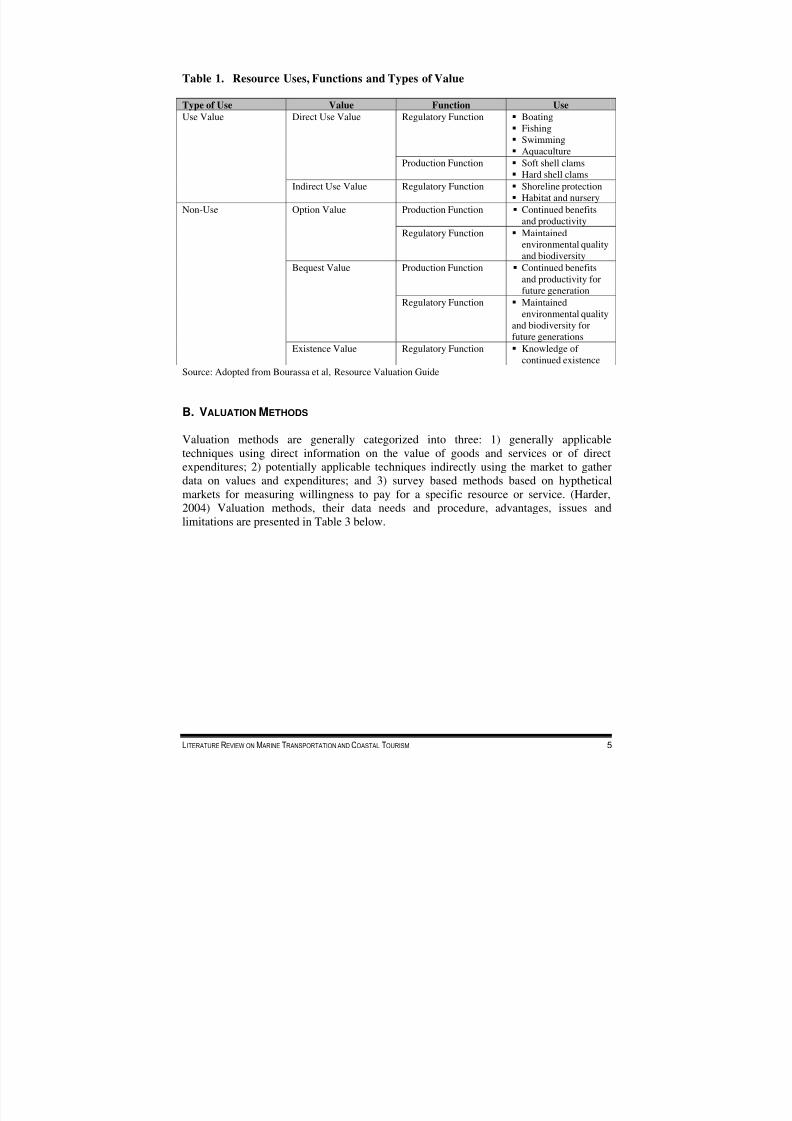
Table 1. Resource Uses, Functions and Types of Value
Type of Use Value Function UseRegulatory Function Boating
Fishing Swimming
Aquaculture
Direct Use Value
Production Function Soft shell clams Hard shell clams
Use Value
Indirect Use Value Regulatory Function Shoreline protection Habitat and nursery
Production Function Continued benefitsand productivity
Option Value
Regulatory Function Maintainedenvironmental qualityand biodiversity
Production Function Continued benefitsand productivity forfuture generation
Bequest Value
Regulatory Function Maintainedenvironmental quality
and biodiversity forfuture generations
Non-Use
Existence Value Regulatory Function Knowledge of continued existence
Source: Adopted from Bourassa et al, Resource Valuation Guide
B. VALUATION METHODS
Valuation methods are generally categorized into three: 1) generally applicable
techniques using direct information on the value of goods and services or of directexpenditures; 2) potentially applicable techniques indirectly using the market to gatherdata on values and expenditures; and 3) survey based methods based on hyptheticalmarkets for measuring willingness to pay for a specific resource or service. (Harder,2004) Valuation methods, their data needs and procedure, advantages, issues andlimitations are presented in Table 3 below.

8/8/2019 Lit Rev on MarineTranspo-Coastal Tourism_FINAL
http://slidepdf.com/reader/full/lit-rev-on-marinetranspo-coastal-tourismfinal 12/55

8/8/2019 Lit Rev on MarineTranspo-Coastal Tourism_FINAL
http://slidepdf.com/reader/full/lit-rev-on-marinetranspo-coastal-tourismfinal 13/55
General Category Valuation Method Data Needs and Procedure Advantages distortions
Commonly applied tofisheries and tourism
Compares actual yield overtime with sustainable yield
or yield which could havebeen realized without thedamaging activity
Estimates productivityeffects using the followingscenarios: with the projectand without the project;with and without thedamaging activity; andcomparison of actual yieldover time with the efficientand sustainable yield thatwould have been realized inthe absence of project or
damaging activity
of service (by volume orarea) as a result of theimpact
3rd step: Application of thecorresponding market value
per unit of service per area
Hedonic Pricing Method Applicable to computing
values for ecosystem orenvironmental servicesdirectly affecting marketprices; based on the premisethat the price of a marketedgood signals itscharacteristics or attributes
Typically used indetermining housing pricesas a function of local
environmental attributes Estimates economic
benefits or costs associatedwith environmental qualityand environmentalamenities
Data Needs
Cross-section and/or time-series on selling prices andlocations of residentialproperties
Property characteristicsaffecting selling prices
Neighborhoodcharacteristics affectingselling prices
Accessibility characteristicseffecting prices
Environmentalcharacteristics
Procedure
1st step: Data collection onresidential property sales inthe region for a specific
Allows estimation of values based on actualchoices
Property markets as gooindicators of value
Reliability of propertyrecords
Availability of propertysales data andcharacteristics
Flexibility of the method
LITERATURE REVIEW ON M ARINE TRANSPORTATION AND COASTAL TOURISM

8/8/2019 Lit Rev on MarineTranspo-Coastal Tourism_FINAL
http://slidepdf.com/reader/full/lit-rev-on-marinetranspo-coastal-tourismfinal 14/55

8/8/2019 Lit Rev on MarineTranspo-Coastal Tourism_FINAL
http://slidepdf.com/reader/full/lit-rev-on-marinetranspo-coastal-tourismfinal 15/55

8/8/2019 Lit Rev on MarineTranspo-Coastal Tourism_FINAL
http://slidepdf.com/reader/full/lit-rev-on-marinetranspo-coastal-tourismfinal 16/55
General Category Valuation Method Data Needs and Procedure Advantages property over a chosen periodof time3rd step: Estimation of eitherthe value of potential propertydamage or the amount that
people spend to avoid suchdamage
Replacement or Restoration
Value of the resource isequivalent replacement costsof the ecosystem and itsservices
Commonly used in valuingecosystem services of coastalprotection
Data Needs
Type, capacity andefficiency of pollutioncontrol devices
Installation date andannualized capital cost of pollution control device
Cost of operation andmaintenance of equipment
Procedure
1st step: Specification of thefollowing: Relevant services provided
by the resource Manner of providing these
resources Beneficiaries of services
provided by the resource Level of services provided
by the resource2nd step: Identification of theleast cost alternative of providing the services andestimation of the annualized
capital cost and annualoperating and maintenancecost of pollution control perunit of pollutant3rd step: Extrapolation of theentire industry cost bymultiplying unit cost to total
Rough indicator of economic value, inconsideration of dataconstraints and degree osimilarity orsubstitutability betweenrelated goods
Less data and resourceintensive due to easycomputation of costs
Limitations on data mayrule out valuation methofor estimation of willingness to pay
Provides for surrogatemeasures of value forservice difficult to valueby other means
10 THEPHILIP

8/8/2019 Lit Rev on MarineTranspo-Coastal Tourism_FINAL
http://slidepdf.com/reader/full/lit-rev-on-marinetranspo-coastal-tourismfinal 17/55
General Category Valuation Method Data Needs and Procedure Advantages volume of pollutants generatedby the industry (industry costequal to cost of pollutioncontrol)4th step: Adjustment of some
cost estimates to account forthe assimilative capacity of theenvironment and number of establishment complying withregulation and standards
Substitute CostsValue of the resource is equalto the costs of substituting thesaid resource and its services
Data Needs
Type, capacity andefficiency of pollutioncontrol devices
Installation date andannualized capital cost of pollution control device
Cost of operation andmaintenance of equipment
Procedure
1st step: Specification thefollowing: Relevant services provided
by the resource Manner of providing these
resources Beneficiaries of services
provided by the resource Level of services provided
by the resource2nd step: Identification of the
least cost alternative of providing the services andestimation of the annualizedcapital cost and annualoperating and maintenancecost of pollution control perunit of pollutant
Rough indicator of economic value, inconsideration of dataconstraints and degree osimilarity orsubstitutability betweenrelated goods
Less data and resourceintensive due to easycomputation of costs
Limitations on data mayrule out valuation methofor estimation of willingness to pay
Provides for surrogatemeasures of value forservice difficult to valueby other means
LITERATURE REVIEW ON M ARINE TRANSPORTATION AND COASTAL TOURISM

8/8/2019 Lit Rev on MarineTranspo-Coastal Tourism_FINAL
http://slidepdf.com/reader/full/lit-rev-on-marinetranspo-coastal-tourismfinal 18/55
General Category Valuation Method Data Needs and Procedure Advantages 3rd step: Extrapolation of theentire industry cost bymultiplying unit cost to totalvolume of pollutants generatedby the industry (industry cost
equal to cost of pollutioncontrol)4th step: Adjustment of somecost estimates to account forthe assimilative capacity of theenvironment and number of establishment complying withregulation and standards
3) Expressed Willingness toPay
Uses amount of moneypeople are willing to payfor the resource and itsservices
Contingent ValuationMethod
Used the amount people arewilling to pay for particularenvironmental services orthe amount they are willingto receive in giving-up suchenvironmental servicesunder a hypotheticalscenario
Data Needs
Extent of affectedpopulation or market forthe specific environmentalservices
Changes in environmentalservices related with anevent, program, investmentor policy choice involved inthe study
Realistic mechanism forpayment and manner of collection
Budget constraints of respondents
Availability of comparableservices from other sources,when the good is to beprovided and whether the
losses or gains aretemporary or permanent
Validation questions andpre-testing of questionnaire
Procedure
1st step: Definition of the
Flexibility in economicvalue estimation but moapplicable in measuringgoods and services easilidentified and understooby users and consumed idiscrete units
Most widely acceptedmethod for estimatingTEV
Easy analysis anddescription of results
Widely used and studiedmethod
12 THEPHILIP

8/8/2019 Lit Rev on MarineTranspo-Coastal Tourism_FINAL
http://slidepdf.com/reader/full/lit-rev-on-marinetranspo-coastal-tourismfinal 19/55
ITERATURE REVIEW ON M ARINE TRANSPORTATION AND COASTAL TOURISM
General Category Valuation Method Data Needs and Procedure Advantagesproblem
2nd step: Preliminarydecision on the survey
3rd step: Design surveytools
4
th
step: Testing of valuation approaches andpayment mechanisms
5th step: Conduct actualsurvey
6th step: Compilation,analysis and reporting of results
Contingent Choice Method Respondents asked to
choose between group of environmental services orcharacteristics at varyinglevels of prices andattributes
Useful for policymakingsince it considers differentoptions
Procedure
1st step: Definition of thevaluation problem; includeservices being values andrelevant population
2nd step: Finalization of survey design
3rd step: Conduct of actualsurvey
4th step: Compilation,analysis and reporting of survey results
Applicable to valuingoutcomes of an action
Easier to understand sinit involves trade-offsrather than monetaryvalues
Ease in response More applicable in
generating relative rathethan absolute values
Minimizes biases inherein open-ended contingenvaluation studies
L
8/8/2019 Lit Rev on MarineTranspo-Coastal Tourism_FINAL
http://slidepdf.com/reader/full/lit-rev-on-marinetranspo-coastal-tourismfinal 20/55
THEPHILIP
General Category Valuation Method Data Needs and Procedure Advantages
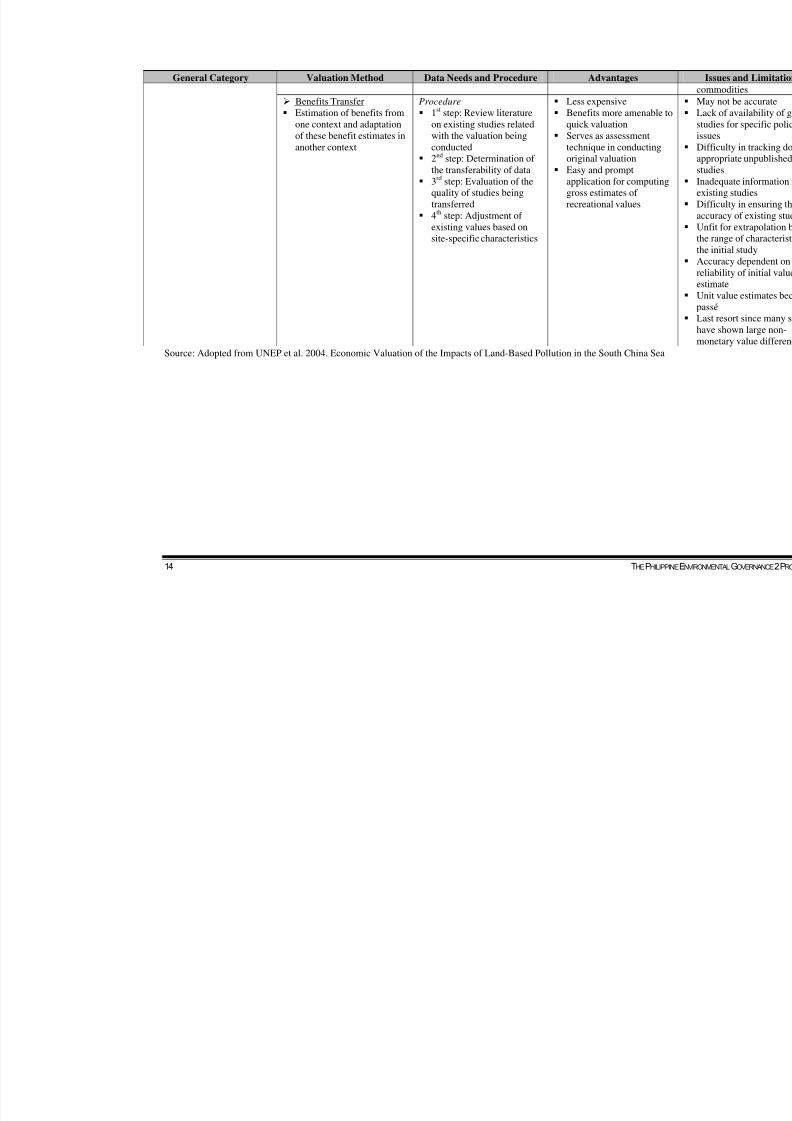
Benefits Transfer Estimation of benefits from
one context and adaptationof these benefit estimates in
another context
Procedure
1st step: Review literatureon existing studies relatedwith the valuation being
conducted 2nd step: Determination of the transferability of data
3rd step: Evaluation of thequality of studies beingtransferred
4th step: Adjustment of existing values based onsite-specific characteristics
Less expensive Benefits more amenable
quick valuation Serves as assessment
technique in conductingoriginal valuation Easy and prompt
application for computingross estimates of recreational values
Source: Adopted from UNEP et al. 2004. Economic Valuation of the Impacts of Land-Based Pollution in the South China Sea
14

8/8/2019 Lit Rev on MarineTranspo-Coastal Tourism_FINAL
http://slidepdf.com/reader/full/lit-rev-on-marinetranspo-coastal-tourismfinal 21/55
III. RELATED STUDIES
A. MARINE TRANSPORTATION VALUATION STUDIES
1. Douglas-Westwood Limited. 2005. World Marine Markets. Douglas-Westwood Limited, Canterbury.
The study aims to compute for a world market value for each marine sector and itsregional segmentation. It classifies the marine sector into shipping, marine tourism,offshore oil and gas, seafood processing, marine equipment, fishing, shipbuilding, navalshipbuilding, ports, marine aquaculture, yacht and boatbuilding, cruise, research anddevelopment, marine services, marine renewable energy security and control, oceansurvey, education and training, underwater technology and underwater vehiclesoperations.
Shipping Sector. The study defines the shipping sector as the UNCTAD estimate of percentage of total seaborne trade comprising the total cost of shipping. The UNCTADestimate is, then, segmented by the nationality of ‘beneficial owner’ of world tonnage.These are then compared with actual figures known. Forecasts are in reference toprojections of total seaboard world trade in ton-miles. Projections of ClarkSea shippingrates index are computed using own view of over-all shipping rates.
Major findings of the study on the shipping sector are the following:
There are 90,000 ships registered in 150 nations, 50,000 merchant ships tradinginternationally and more than a million seafarers of almost every nationality.
European and Southeast Asian shipping companies dominate the sector; Shipping industry is primarily dependent on the tonnage of seaborne trade (import
and export), volume and geographic distribution as a function of a country’s GDP; Marine transport constitutes 90% of world trade. A 9.1% of growth in world trade is
estimated by OECD; Volume of trade affects availability of vessels and vessel charter rates; Shipping rates in 2004 averaged $28,000, significantly higher than the previous ten-
year average of $13,800; Trade growth in the container sector is projected at 10.5% in 2005 and down to 9.7%
in 2006. On the other hand, supply of container vessel fleet is expected to increase by9.8% in 2005, 12.6% in 2006 and 8.8% in 2007.
In the European market, 14,000 companies were registered in 2001.A total addedvalue of €14.4bn was computed and 155,000 persons being employed;
UNCTAD estimates operation of merchant ships amounting to US$380bn (€292bn)in freight rates within the global economy. This is equal to 5% of the total worldtrade; and
Total world shipping revenue is estimates at 243bn. Values of the world shippingsector are estimated at €M 287,748 in 2005 and €M 325,826 in 2010. European
LITERATURE REVIEW ON M ARINE TRANSPORTATION AND COASTAL TOURISM 15

8/8/2019 Lit Rev on MarineTranspo-Coastal Tourism_FINAL
http://slidepdf.com/reader/full/lit-rev-on-marinetranspo-coastal-tourismfinal 22/55
values of the world shipping sector, on the other hand, is computed at €M 127,646 in2005 and €144,537 in 2010;
Ports Sector. The growth of this sector has been caused by increased shipping activitiesand the trend towards containerization. Major port areas are Europe, Asia and North
America. The study calculates port revenues using average prices per tonne of cargohandled.
The study uses data on tonnages handled by major ports and port operators and theirrevenues for computation of average cost per tonne. These are, then, applied to totalcargo volumes. Regional segmentation follows the UNCTAD ‘Review of MaritimeTransport in 2003’.Below are the major findings of the study on the ports sector:
There are 8,336 ports and terminals worldwide. Of these, more than 1,600 aresignificant ports;
In 2002, top 50 ports handled 5.8 billion tones of cargo;
Value of world ports sectors is computed at €M 24,827 in 2005 and €M 30, 496 in2010. In Europe, ports sector is valued at €M 10, 151 in 2005 and €M 12, 165 in2010;
Container sector of dry cargo ports world market is calculated at €22.7bn; There has been a shift from traditional bulk and break-bulk (non-containerized)
shipping to unitized cargoes (containerized and roll-on/roll-off) shipping; Annual reports record largest ports having rates per tonne of between €1.12 to €1.67
while the rate of smaller ones range from €2.82 to €3.78. Using these figures, worldports sector in 2003 is computed at €26.5bn which is expected to increase to €30bnin 2010;
Rotterdam port is estimated to employ 5,741 persons in cargo handling, 44,384persons for total direct port-related employment and 14, 391 in port industries such asoil refining, shipbuilding and repair etc. Indirect employment in the said port totaledto 250,000 people; and
Average costs of container handling in Europe is $100 (€77), $200 (€144) in US and$300 (€231) in Japan
2. Mandale, Maurice et al. 1998. Estimating the Economic Value of Coastal and
Ocean Resources: The Case of Nova Scotia. Oceans Institute of Canada andAtlantic Coastal Zone Information, Canada.
The study focuses on estimating the total economic contributions of coastal- and oceans-related industries to the over-all performance of Nova Scotia’s economy. It measures theeconomic value of Nova Scotia’s coastal and ocean activities using four indicators whichare: direct and indirect contributions of these activities to Gross Domestic Product(GDP); number of people employed by the industries; amount of wages and salariesreceived by the industries’ employees; and export values of outputs produced by theseindustries. Coastal industries, as defined by this study, refer to two groups: those usingthe coastal zones as a resource and those that use coastal zone as a “medium of movement, operation or innovation”. Further, using the United Nations Industrial
16 THEPHILIPPINEENVIRONMENTALGOVERNANCE2 PROJECT

8/8/2019 Lit Rev on MarineTranspo-Coastal Tourism_FINAL
http://slidepdf.com/reader/full/lit-rev-on-marinetranspo-coastal-tourismfinal 23/55
Development Organization (UNIDO), the study classifies the latter into: 1) marinesystem design and construction, including ship design, and offshore and coastalengineering; 2) marine operations and shipping, including transportation systems; and 3)marine-related equipment, including manufacturing, engineering and consulting inmarine electronics and instrumentation, telecoms, navigation systems, ocean research and
exploration, environmental monitoring and, training and education. Industries selectedare categorized as private (primary fishing, fish processing, aquaculture, shipbuilding andrepair, boatbuilding and repair, oil and gas, tourism and recreation, ports and, oceantechnologies and services) or public (Department of National Defense, Department of Fisheries and Oceans, Environment Canada, Nova Scotia Department of Fisheries andAquaculture, Nova Scotia Department of the Environment and Canada Nova ScotiaOffshore Petroleum Board).
Data gathered include: value of output or (for public sector agencies) spending; directemployment (full-time equivalent or person-years); direct payroll; and markets for output(split between Nova Scotia, other provinces of Canada and exports to the rest of the
world). Net direct and total (direct + indirect + induced) impacts are computed usingNova Scotia Input-Output tables for the private and public ocean-related industries.Indirect effects result from buying of inputs by an industry for operation support. On theother hand, induced impacts are brought about by re-spending of revenues earnedthroughout the economy.
Major findings in the estimation of economic values of coastal-related activities of NovaScotia are the following:
GDP Impacts. Direct GDP impact of the coastal sector amounts to $1.5 billion or9.6% of the total GDP while total GDP impact (direct + indirect + induced) iscalculated at $2.8 billion or 17.5% of the total GDP. In monetary terms, direct impactof coastal activities account for 10 cents of every $1 income generated by totaleconomy. Total impact, on the other hand, account for 17.5 cents for every $1 earnedby the total economy ;
Household Income Impacts. Direct household impact total to $1.3 billion or 12.3% of the total household income. Total impact, however, is doubled to $2.6 billion or24.8% of the total household income;
Employment Impacts. Direct employment impact is a generation of 34,800 jobs or9.4% of total employment. Total impact is increased to 93,500 jobs or 25% of totalemployment; and
Export Impacts. Revenues from coastal-related exports amount to $2.7 billion andcontribute $2.3 billion to household income.
The table showing these figures is in Excel files.
Ports Sector. In Nova Scotia, this is handled both by the private and public sector.Physical plants are mostly operated by governments while actual operations of these portsare managed by private or quasi-private institutions. These are important in Canada’soverseas trade. Below is the table using ports key data in 1994 for Nova Scotia.
LITERATURE REVIEW ON M ARINE TRANSPORTATION AND COASTAL TOURISM 17

8/8/2019 Lit Rev on MarineTranspo-Coastal Tourism_FINAL
http://slidepdf.com/reader/full/lit-rev-on-marinetranspo-coastal-tourismfinal 24/55
Table 3. Ports Key Data, 1994
Value of outputDirect employmentDirect payroll
Markets (NS:RoC:RoW)
$300 million2,520
$87.4 million
20:70:10
Computations of total economic impacts of ports are shown in the Excel files withelimination of double counting achieved through the Input-Output Model used by thestudy.
Other related tables are also in the Excel files.
3. The Allen Consulting Group. 2004. The Economic Contribution of Australia’s
Marine Industries
The purpose of the study is to measure economic contribution of marine-based industriesto Australia’s economy. The study, in particular, covers six marine-based industrieswhich are marine tourism, offshore oil and gas, fisheries and seafood, shipping,shipbuilding and port-based industries. It uses the concept of “value-added” in estimatingthe economic value of a specific activity. Value added is defined as the financial netincome before deduction of profit and wages. To put it differently, it measures the netimpact of an industry by deducting production costs from the total income. It should benoted, though, that this includes payments to labor (wages) and, capital andentrepreneurship (profits). Advantages of using this concept are: 1) it is not prone todouble counting; 2) it ensures relevant comparison across industries; and 3) it simplifiesanalysis of regional impacts. Economic contribution parameters used in this study are
assessment of economic activity, employment, taxation revenue and export revenue. Thestudy refers direct economic contributions as the direct value added, employment andexport estimates. On the other hand, indirect economic contributions are computed usingvalue added and employment multipliers provided by Australian Bureau of Statistics(ABS). These multipliers are taken from the 1996-1997 Input-Output tables. The indirectvalue added estimates is the necessary value added from other industries in the economyto enable the marine industries to produce a targeted value added amount. This is thesame for indirect employment estimate which is the required added value of manpowerfrom other industries in the economy to produce a specific value added amount.
Input-Output Multipliers used in the study for marine-based industries are given in thetable below.
18 THEPHILIPPINEENVIRONMENTALGOVERNANCE2 PROJECT

8/8/2019 Lit Rev on MarineTranspo-Coastal Tourism_FINAL
http://slidepdf.com/reader/full/lit-rev-on-marinetranspo-coastal-tourismfinal 25/55
Table 4. Input-Output Multipliers, 1996-1997
Industry Output EmploymentMarine TourismOffshore Oil and Gas
Fisheries and SeafoodShippingShip and Boat BuildingPort-Based Industries
2.500.88
2.272.922.841.10
2.377.38
2.192.786.652.51
Shipping. This covers water transport categorized into international sea transport, coastalwater transport and inland water transport of which value added and employmentassociated with water inland transportation are disregarded. Adjustments are made toeliminate double counting since water transportation is also a major component of marinetourism.
Major findings for the shipping sector in 2003 include:
The value added of sector contributes to: 1) 2% of marine industry direct value-added($0.5 billion); 2) 3.3% of indirect value-added (41.5 billion) and 3) 3% of turn-over($1.7 billion). A decline of an average annual rate of -3.7% is noted for the saidindustry between 1995-1996 and 2002-2003, For 1995-1996 and 1996-1997,however, the industry’s growth is reported to be 7.5% ;
The sector employs less than 5% of the total employed manpower in the marineindustries, resulting in the industry to be the least employment generator. Itcontributes 3.3% of direct employment for marine industries (8,390 persons) and3.4% of indirect employment (23,310 persons) with an average annual growth rate of
4.9%.
In Excel files are tables showing data used in the study.
Port-Based Industries. The study characterizes this sector as comprising stevedoring,water transport terminals, port operators and other services to water transport. Since thisis an essential industry for shipping activities, this has higher added value and directemployment benefits than the shipping industry. In fact, this is the third largest marineindustry during the study period 2002-2003.
Major findings for the port-based industries are as follows:
Marine tourism contributes: 6.4% value added ($1.7 billion); 4.1% indirect valueadded ($1.9 billion); and 4.0% turn-over ($2.8 billion) with an average annual growthrate of 6%; and
With an average annual growth rate of 2%, port-based industries are recorded tocontribute 4.6% of marine industry direct employment (11,540 persons) and 4.2% of marine industry indirect employment (28,930 persons).
LITERATURE REVIEW ON M ARINE TRANSPORTATION AND COASTAL TOURISM 19

8/8/2019 Lit Rev on MarineTranspo-Coastal Tourism_FINAL
http://slidepdf.com/reader/full/lit-rev-on-marinetranspo-coastal-tourismfinal 26/55
In Excel files are tables showing port-based data for 1995-1996 to 2002-2003.
4. Mandale, Maurice.2000. The Economic Value of Marine-Related Resources in
New Brunswick. New Brunswick of Fisheries and Aquaculture andDepartment of Fisheries and Oceans, New Brunswick.
This study is similar with the assessment conducted in measuring economic importanceof the marine sector in Nova Scotia which aims to provide support to policy formulationon economic development and marine management. Specifically, this is an estimation of the economic contributions of the marine sector to the over-all economy of NewBrunswick in term of its total direct and indirect contribution to Gross Domestic Product(GDP), total number of people employed by the industry and total amount of salaries andwages people earned from the said industry. The study divided the marine sector into twoindustries: private industries composed of traditional fishing, aquaculture, fishprocessing, shipbuilding and boatbuilding, marine technology manufacturing, ferryservices, marine-related ecotourism, marine construction, ports and, research and other
services; and government departments including New Brunswick Department of Fisheries and Aquaculture, New Brunswick Department of the Environment, Departmentof Fisheries and Oceans and Environment Canada. Total Net Economic Impact of themarine industry is computed using average of three years _ 1995, 1996 and 1997. Thisstudy uses an Input-Output model in estimating economic values for different marineindustries in New Brunswick. Data collected for the study are economic outputs (sales),employment and payroll (household income).
The study has led to the following major findings:
The marine sector directly contributes 4.3% ($610 million) to the total GDP of NewBrunswick. Total impact (direct + indirect + induced) of the sector scales itscontribution up to 7.2% (more than $1 billion) of the total GDP;
4.1% (almost $370 million) of the direct household income and 9.2% of totalhousehold income are attributed to the marine sector; and
Direct employment impact of the marine sector comprises 4.8% of all jobs (almost15,000) while total (direct + indirect + induced) employment impact of the sectorcomprises 8.5% (more than 26,550 jobs) of all jobs generated in New Brunswick.
The table showing the abovementioned figures is in the Excel files.
Ferry Services. For ferry transportation, this marine industry records an average outputof $33.5 million, 424 employed people and aggregate income of $9.8 million. See Excelfiles for table with these data.
Ports. Ports in New Brunswick are reported to have received an average of 23.4 milliontones, generated almost 2,700 jobs and given aggregate income of $77.3 million to itsemployees for the period covered 1995 to 1997. See Excel files for table with these data.
Related tables are in the Excel files.
20 THEPHILIPPINEENVIRONMENTALGOVERNANCE2 PROJECT

8/8/2019 Lit Rev on MarineTranspo-Coastal Tourism_FINAL
http://slidepdf.com/reader/full/lit-rev-on-marinetranspo-coastal-tourismfinal 27/55
5. Canmac Economics, School for Resource and Environmental Studies,
Enterprise Management Consultants and the Secretariat of the AtlanticCoastal Zone Information Steering Committee. 2002. The Value of the Ocean
Sector to the Economy of Prince Edward Island, prepared for the Government
of Prince Edward Island and the Government of Canada, 114p.
The study primarily targets to measure the impact of the marine sector to the economy of Prince Edward Island by estimating its direct and indirect contribution to Gross Domesticproduct (GDP), number of people employed by the sector and amount of wages andsalaries earned by workforce within the said sector using Input-Output Analysis. Data oneconomic output (sales), employment and payroll (household income) are based onaverage of the period covering 1997, 1998 and 1999. Similar with the studies discussedearlier, the sector is classified into those depending on the ocean as a resource and thosethat consider it as a medium of operation or movement. Ocean is used as encompassingestuarine, inshore, nearshore and offshore waters.
Further, the study categorized the sector into private (traditional fishing, aquaculture, fishprocessing, shipbuilding and boatbuilding, marine technology manufacturing, marinetransportation, marine construction services, ports and harbors, ocean related researchand other services and, ocean-related tourism) and government (PEI Department of Fisheries, Aquaculture and Environment, Tourism PEI, Department of Fisheries andOceans, Environment Canada and Parks Canada).
Conclusions of the study include the following:
The marine sector directly contributes 10% ($247 million) to the total GDP of PrinceEdward. This increases to 17.1% (more than $421 million) as the total GDP impact;
11.1% (almost $169 million) of direct household income is attributable to the sector.Its total household income impact, however, is increased to 19.8% ($302.4 million)when all effects (direct + indirect + induced) are considered; and
The sector has 11.2% (6,701 full-time equivalent (FTE)) total direct employmentimpact and 19.5% (11,722 FTE) total employment impact.
Summary of total economic impacts of the marine industry is in the Excel files.
Marine Transportation. This specific marine industry contributes $65 million output with130 employees hired on a full-time equivalent basis which receive $5 million aggregateincome. See Excel files for the table.
Ports. The ports receive 835,705 tonnes cargo with approximately 200 people employedwho earn aggregate income of more than $6 million. See Excel files for the table.
Tourism. In particular, this sector receives average annual expenditures of more than $96million with 1,600 people employed on a full-time equivalent basis whose aggregateannual income amount to $40.3 million. See Excel files for the table.
LITERATURE REVIEW ON M ARINE TRANSPORTATION AND COASTAL TOURISM 21

8/8/2019 Lit Rev on MarineTranspo-Coastal Tourism_FINAL
http://slidepdf.com/reader/full/lit-rev-on-marinetranspo-coastal-tourismfinal 28/55
Related tables are in Excel files.
6. Kildow, Judith and Colgan, Charles. 2005. California’s Ocean Economy,
Report to the Resources Agency, State of California. National Economics
Program, California.
This study measures the contribution of the economy coastal and ocean economy toCalifornia’s total economy across time and regions including the nations, state andcounties. Economic contributions are calculated in terms of output (Gross DomesticProduct or its related measures), employment and wages. It distinguishes the coastaleconomy from the ocean economy by defining the former as “all economic activities inthe coastal region, and is thus the sum of employment, wages and output in the region”.The latter, on the other hand, is referred as “all economic activity deriving all or part of its inputs from the ocean or Great Lakes.
The method used in this study is based on the ES-202 employment data collectedmonthly by each state’s Department of Labor and reported to the US Department of Labor. These data are at the establishment level which are ocean-related based onStandard Industrial Classification (SIC) codes and for specific industries, by the locationof a given establishment in a zip code adjacent to the shore.
The study covers six ocean sectors defined with their major activities: construction,including marine construction; living resources, including fish harvesting, aquacultureand seafood processing; minerals, including limestone, sand and gravel, oil and gasexploration, and, oil and gas production; ship and boat building, including boat buildingand ship building; tourism and recreation, including amusement and recreation servicesnot classified elsewhere, zoos and aquaria, boat dealers, eating and drinking places ,hotels and motels, marinas, recreation vehicle parks and campgrounds and sportinggoods; and transportation, including deep sea freight transportation, marine passengertransportation, marine transportation services, search and navigation equipment andwarehousing
Marine Transportation. California, considered as the single gateway services to the U.S.,has high significance to the economy of U.S. In 2000, value of traded in Los Angesles,Long Beach and Oakland Customs Districts is recoreded at $392 billion. Waterbornecommerce, specifically, accounts for 40% of the total national trade in the same year.Related tables are in the Excel files.
22 THEPHILIPPINEENVIRONMENTALGOVERNANCE2 PROJECT
8/8/2019 Lit Rev on MarineTranspo-Coastal Tourism_FINAL
http://slidepdf.com/reader/full/lit-rev-on-marinetranspo-coastal-tourismfinal 29/55
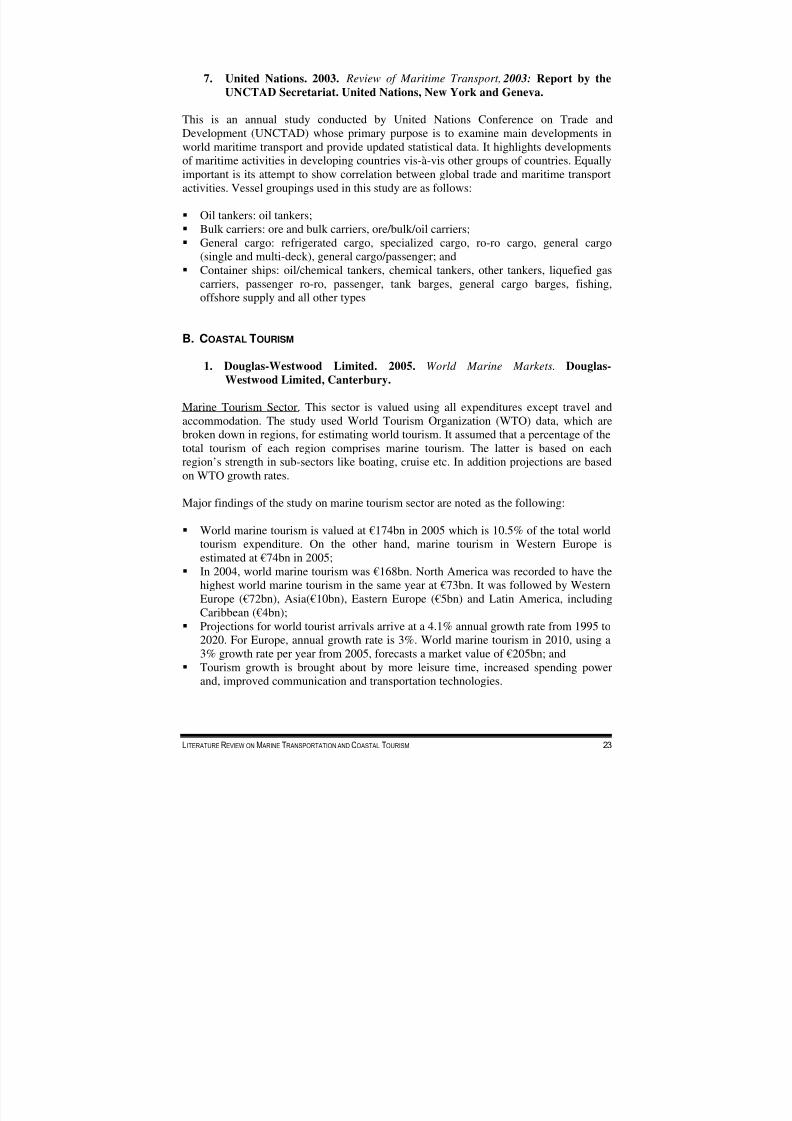
7. United Nations. 2003. Review of Maritime Transport, 2003: Report by theUNCTAD Secretariat. United Nations, New York and Geneva.
This is an annual study conducted by United Nations Conference on Trade andDevelopment (UNCTAD) whose primary purpose is to examine main developments in
world maritime transport and provide updated statistical data. It highlights developmentsof maritime activities in developing countries vis-à-vis other groups of countries. Equallyimportant is its attempt to show correlation between global trade and maritime transportactivities. Vessel groupings used in this study are as follows:
Oil tankers: oil tankers; Bulk carriers: ore and bulk carriers, ore/bulk/oil carriers; General cargo: refrigerated cargo, specialized cargo, ro-ro cargo, general cargo
(single and multi-deck), general cargo/passenger; and Container ships: oil/chemical tankers, chemical tankers, other tankers, liquefied gas
carriers, passenger ro-ro, passenger, tank barges, general cargo barges, fishing,
offshore supply and all other types
B. COASTAL TOURISM
1. Douglas-Westwood Limited. 2005. World Marine Markets. Douglas-Westwood Limited, Canterbury.
Marine Tourism Sector. This sector is valued using all expenditures except travel andaccommodation. The study used World Tourism Organization (WTO) data, which arebroken down in regions, for estimating world tourism. It assumed that a percentage of thetotal tourism of each region comprises marine tourism. The latter is based on eachregion’s strength in sub-sectors like boating, cruise etc. In addition projections are basedon WTO growth rates.
Major findings of the study on marine tourism sector are noted as the following:
World marine tourism is valued at €174bn in 2005 which is 10.5% of the total worldtourism expenditure. On the other hand, marine tourism in Western Europe isestimated at €74bn in 2005;
In 2004, world marine tourism was €168bn. North America was recorded to have thehighest world marine tourism in the same year at €73bn. It was followed by WesternEurope (€72bn), Asia(€10bn), Eastern Europe (€5bn) and Latin America, includingCaribbean (€4bn);
Projections for world tourist arrivals arrive at a 4.1% annual growth rate from 1995 to2020. For Europe, annual growth rate is 3%. World marine tourism in 2010, using a3% growth rate per year from 2005, forecasts a market value of €205bn; and
Tourism growth is brought about by more leisure time, increased spending powerand, improved communication and transportation technologies.
LITERATURE REVIEW ON M ARINE TRANSPORTATION AND COASTAL TOURISM 23

8/8/2019 Lit Rev on MarineTranspo-Coastal Tourism_FINAL
http://slidepdf.com/reader/full/lit-rev-on-marinetranspo-coastal-tourismfinal 30/55
Cruise Industry. The study limits valuation of the industry to revenues of cruise vesseloperators. Being a sub-area of marine tourism, cruise industry shows high growthpotential. Major findings on the said industry are the following:
North America ranks first in revenue-generation in the industry. This is followed by
Western Europe and South East Asia, though in general, data are not available; World market is €12bn. Total economic value is twice this figure; The US cruise industry was approximated to value at $7bn in 1997 annually and
$12.9bn but the total economic benefit was computed at $25.4bn with 294,000 jobsgenerated. An average of $240,000 is generated by a 2,000 passenger ship with 950crew members in on-shore sending per US port call. Average port-of-call passengerspending is $112 per visit; and
2. Mandale, Maurice et al. 1998. Estimating the Economic Value of Coastal and
Ocean Resources: The Case of Nova Scotia. Oceans Institute of Canada andAtlantic Coastal Zone Information, Canada.
Tourism Sector. The study assumes that 35% of the total tourism in Nova Scotiacomprises marine-related ones. This figure is taken from 1992 Exit Survey whichsuggests that 35% of the total tourism in Nova Scotia is nature-related activities. Due tounavailability of other figures, this data is used as the basis for the computations. Table 5shows spending on nature and non-nature related tourism activities.
Table 5. Different Types of Tourist Spending in Nova Scotia
Types of SpendingNature Tourist
Parties ($)Non-Nature Tourist
Parties ($)
AccommodationRestaurantsEntertainmentTaxi and car rentalShoppingGas and auto repairGroceries and liquorTotal (inc. others)
238.59221.1560.3956.25
144.02102.1666.77
825.20
128.27122.8127.4627.3277.4848.8828.03
468.53
Below is a table presenting key tourism data for 1994.
Table 6. Tourism Key Data, 1994
Value of output (tourism receipts)Direct employment (FTEs)Direct payrollMarkets (NS:RoC:RoW)
$308 million3,369
$86 million46:37:17
Note: Market proportions are 1996 values due to unavailability of 1994 values;NS-Nova Scotia; RoC-Rest of the Country; RoW-Rest of the World
24 THEPHILIPPINEENVIRONMENTALGOVERNANCE2 PROJECT

8/8/2019 Lit Rev on MarineTranspo-Coastal Tourism_FINAL
http://slidepdf.com/reader/full/lit-rev-on-marinetranspo-coastal-tourismfinal 31/55
The table in the Excel file presents economic impacts of coastal-related tourism.
3. The Allen Consulting Group. 2004. The Economic Contribution of Australia’s
Marine Industries
Marine Tourism. This is the biggest marine-related industry in terms of value-added andemployment contribution in Australia. In terms of exports, this sector ranks second tooffshore oil and gas. ABS Satellite Account suggests that more than 40% of this sector iscomposed of: travel agency and tour operator services; taxi transport; air and watertransport; accommodation; cafes, restaurants and food outlets; clubs, pubs, taverns andbars; and other retail trade. The study uses the survey results conducted by ABS. Usingtourism spending estimates of the same survey, estimates for domestic and internationalsurvey are 78% and 22%, respectively, of the total tourism. Following the ReviewCommittee on Marine Industries and Sciences Council guidelines, the study, then,assumes that marine tourism is 40% and 19% of domestic and international tourism,respectively.
Major findings in 2002-2003 for the marine tourism industry constitute the following:
Value-added contribution amounts to: 1) 42.3% of marine industry direct value added($11.3 billion); 2) 60.8% of indirect value added ($28.2 billion); and 3)44.6% of turn-over ($25.8 billion) with an average annual growth rate of 5.2%;
Employment benefits from the sector are attributable to 75.3% of direct employment(190,620 persons) and 65.3% of indirect employment (450,960) with an averageannual growth rate of 2.3% ; and
The sector ranks second in export activities totaling to 21.9% of the total value of allexports of the marine industries.
In Excel files are tables showing figures on marine tourism used in the study.
4. Mandale, Maurice.2000. The Economic Value of Marine-Related Resources in
New Brunswick. New Brunswick of Fisheries and Aquaculture andDepartment of Fisheries and Oceans, New Brunswick.
Tourism. The study estimates average sales of $25.9 million, 290 jobs generated andaggregated income to employees of $8.1 million. See Excel files for the table of thesedata.
5. King, Philip. Economic Analysis of Beach Spending and the Recreational
Benefits of Beaches in the City of San Clemente
This study is designed for the following purposes: 1) to conduct an economic analysis of the value of San Clemente’s beaches; 2) to profile visitors of San Clemente’s beachduring high season; 3) to conduct a fiscal impact analysis for the City; 4) to conduct aneconomic impact study of beach tourism of the City and the State; and 5) to evaluate cityhiking trail to enable residents and visitors to travel between all of San Clemente’s
LITERATURE REVIEW ON M ARINE TRANSPORTATION AND COASTAL TOURISM 25

8/8/2019 Lit Rev on MarineTranspo-Coastal Tourism_FINAL
http://slidepdf.com/reader/full/lit-rev-on-marinetranspo-coastal-tourismfinal 32/55
beaches without traveling on or near the railroad tracks. It makes use of the travel costmethod in valuating economic values of beaches in he said City.
Major findings of the study are listed below as:
$77.16 is the amount spent by a typical visitor per person per day on each beach trip.71% of this amount (or $54.70) is spent in San Clemente. Visitors who spendovernight spend more than day-trippers;
The City earns $1.65 million from beach-related spending which include parkingfees, permits and fines, transient occupancy taxes, concessions and the City’s hare of sales taxes from beach spending. On the other hand, the City’s expenditures areestimated to be $1.55 million for beach services and maintenance, police and publicsafety. Net revenues total to $92,776 from beaches or 5 cents per visitor per day;
Tax revenue from overnight visitors is $5.73 per visitor while day trippers, taxrevenue is $1.16;
Beach activity contributes $116 per person per day in economic activity or $132
million per year for the State of California; San Clemente’s beaches earn $4.16 per beach visitor in direct State taxes and $10.32in direct Federal taxes
Value of one beach day is estimated to be $30.58 per person per day during highseason. In total, the economic value of San Clemente’s beaches is more than $37million per year; and
A significant amount of revenues from the beaches of the City does not accrue to theCity itself but flows to the State and Federal income account
Related tables are in the Excel files.
6. Kildow, Judith and Colgan, Charles. 2005. California’s Ocean Economy,
Report to the Resources Agency, State of California. National EconomicsProgram, California.
Coastal Tourism and Recreation. The study defines coastal tourism and recreation asencompassing hotel and restaurant industry, marinas, coastal water sports industry,recreational boating harbors, recreational fishing facilities and stores, beaches and retailbusinesses. The coastal tourism and recreation sector also constitutes ecotourism andrecreational activities such as recreational boating, swimming, recreational fishing,surfing, kayaking, diving and snorkeling. The study, in particular, computes market andnon-market values of the said sector.
Coastal Recreation. Estimation of coastal recreation in California is calculated using dataon number of people and activity levels in ocean recreation gathered in a national surveyconducted in 2004 with the state data on use of key coastal resources. Recreationalactivities specifically covered in this study are beach activities, recreational fishing,recreational boating and other marine recreation. Table showing measure of participationin marine recreational activities is in the Excel files.
26 THEPHILIPPINEENVIRONMENTALGOVERNANCE2 PROJECT

8/8/2019 Lit Rev on MarineTranspo-Coastal Tourism_FINAL
http://slidepdf.com/reader/full/lit-rev-on-marinetranspo-coastal-tourismfinal 33/55
Beach Activities. Valuation of beach activities is measured using market expendituresand non-market consumer surplus values. Fiscal impact of beaches in California isrecorded to be $14 billion as direct revenues in 1998. A study in California beachesestimates that a person spends $23.19 for beach related items and expenditures in a trip in2000. Still, another study (by King) approximates that excluding gas and automobiles
costs, average beach related expenditure amount to $29.66.
Non-market valuation, on the other hand, is conducted using travel cost and contingentvaluation methods. Using an estimate of $15 value of a beach day with annual beachattendance of 150 million, California’s non-market value is accounted as totaling to $2.25billion. Related tables on consumer surplus value of beach visits are in the Excel files.
Values for other recreational activities are in the Excel files.
Travel and Tourism. This sector is the third largest employer in California. In 2001, thesector receives 287 million domestic travelers and approximately 9 million international
travelers. It accounts, specifically, for an 11.1% share of domestic travel market.Expenditures for the sector in the same period amount to $75.4 billion or 6% of theCalifornia’s total GSP. Over-all, the sector generates $4.8 billion in tax revenues for thesame period. Related tables are in the Excel files.
7. Samonte-Tan, G. PB., E. Tabara and C. Caballes. 2004. Coastal and Marine
Biodiversity Resource Economic Valuation: Bohol Marine Triangle. TheCoastal Conservation and Education Foundation, Inc. and Bohol MarineTriangle Project, Cebu City, 109 p.
The study covers tourism activities in the Bohol Marine Triangle (BMT) which includeSCUBA diving, whale and dolphin watching, swimming, snorkeling, beach combing,boating and sun bathing. These activities are significant sources of income of thecommunities in Baclayon, Dauis and Panglao with respect to tourist spending, sales,income, tax revenues and employment. Tables 7 and 8 show dive shop rates and grossrevenue, and number of tourists visiting the areas, respectively.
Table 7. Dive Shop Rates and Gross Revenues
Municipality Rate per DiverDivers per Dive
Shop/YearGross Revenue perDive Shop ($/Year)
Dauis $50 - $56a 390 – 420 $21,000 - $21,800
Panglao $23 - $55a 420 – 1,980 $10,500 - $45,540Source: Samonte-Tan et al, 2004
aRate is good for 2 divesbIncludes divers going to Pamilacan Island
LITERATURE REVIEW ON M ARINE TRANSPORTATION AND COASTAL TOURISM 27

8/8/2019 Lit Rev on MarineTranspo-Coastal Tourism_FINAL
http://slidepdf.com/reader/full/lit-rev-on-marinetranspo-coastal-tourismfinal 34/55
Table 8. Number of TouristsMonthly Tourists
Municipality Peak Monthsb Lean MonthscBMT Tourists
Year 2003
Baclayona 495 128 3,738
Dauis 1,875 906 16,686
Panglao 3,136 1,454 27,540Total 5,506 2,488 47,964
Source: Samonte-Tan et al, 2004
Sources of tourism revenues in the BMT are indirect or private sector revenues fromtourism-related businesses such as hotels, dive-operations, whales/dolphin tours andrestaurants. Average annual tourism net revenues range from P198,750 (boat operators)to P1.4 million (hotel operators). Tourism revenues are highest in Panglao due toextensive coral reefs within the municipality. No diver’s fee is collected from diversvisiting the BMT, thus, potential; revenues from diving are measured in biodiversity of coral reefs and based on diver’s willingness to pay and number of divers. These are
shown in Tables 9 and 10.
Table 9. Annual Net Revenues from Tourism BusinessesAverage Annual Net Revenue Per Tourism Entrepreneur
(PhP)Ecosystem Baclayona Dauis Panglao BMT
Coral Reef Dive Shop 942,480 1,142,753 1,042,617
Marine WatersBoat Operators 198,750 198,750
Beach
HotelRestaurants
1,620,0001,500,000
1,326,0001,200,000
1,473,0001,350,000
Source: Samonte-Tan et al, 2004aBased on monthly net revenues of surveyed respondentsbPamilacan Island
Table 10. Annual Net Benefits from TourismAverage Annual Net Revenue Per Tourism Enterpreneur
(PhP)Ecosystem Baclayona Dauis Panglao BMT
Coral Reef Dive Shop 1,884,960 22,855,067 24,740,027
Marine WatersBoat Operators 795,000 795,000
BeachHotelRestaurants
8,100,0003,000,000
37,128,0006,000,000
45,228,0009,000,000
Total 795,000 12,984,960 65,983,067 79,763,027Source: Samonte-Tan et al, 2004
28 THEPHILIPPINEENVIRONMENTALGOVERNANCE2 PROJECT

8/8/2019 Lit Rev on MarineTranspo-Coastal Tourism_FINAL
http://slidepdf.com/reader/full/lit-rev-on-marinetranspo-coastal-tourismfinal 35/55
IV. PHILIPPINE MARITIME INDUSTRY
A. MARITIME TRANSPORTATION SECTOR
Maritime industry plays a key role in the country’s trading activities. It is throughmaritime activities that 98% of materials and goods are transported as exports andimports. Marine transportation sector has three types of activities which are maritimetransport services, maritime auxiliary services and port services. (Austria, 2002). Marinetransport consists of the actual shipping of goods and/or passengers from one place to thefinal destination. Those involving cargo activities in ports and on ships, on the otherhand, are termed as marine auxiliary services. Under this type are cargo handling, storageand warehousing, custom clearance, container station and depot, maritime agency andfreight forwarding. Port services pertain to ship management in ports. General Agreementon Trade in Services (GATS) classification defines these services as comprising of pilotage, towing and tug assistance, provisioning, fuelling and watering, garbage
collecting and disposal, port captain’s services, navigation aids, shore-based operationalservices and emergency repair facilities.
1. Domestic Shipping
Profile
The domestic shipping transport is comprised of three sub-sectors namely, liner, trampand industrial carriage. (Austria, 2002). Liner shipping are characterized by domesticwater transportation servicing the public without discrimination, regular ports of call andfixed sailing schedules and frequency. It covers both the transport of passengers and
cargoes. Cargoes, in definition, are classified according to packing types: conventional ornon-containerized; and containerized. (PPA, 2004). The former, furthermore, iscategorized into two packing types: bulk or loose and break-bulk of those packed eitherin units, cartons, crates, drums, sacks etc. Freight vessel operations without a regularroute but enters into contractual agreement with shippers through and are usually bulk carriers constitute the tramp shipping sub-sector. On the other hand, industrial carriagesare shipping operations owned and managed by private companies. Among the three,liner shipping is the only regulated sub-sector of the domestic shipping transport. Llantoet al (2005), however, further divides the domestic shipping sector into liner shippingoperations, tramping, tanker services, ferry/fast craft operations, RORO shipping andbarging operations. Tankers are specialized vessels used in transporting oil, chemicals
and LPG. Fastcraft, ferry and wooden boats are those taking short distances which onlyserve passengers following a fixed schedule and regular route. ROROs are vesselsintended for short distances which cater to both passengers and vehicles (as cargoes).Like the former group, these ROROs have fixed schedule and regular route. A mainadvantage of this is the absence of cargo handling since the cargoes are moving “self propelled” cargoes. Lastly, those used in ship-to-shore loading and unloading of cargoesare tugs and barges.
LITERATURE REVIEW ON M ARINE TRANSPORTATION AND COASTAL TOURISM 29

8/8/2019 Lit Rev on MarineTranspo-Coastal Tourism_FINAL
http://slidepdf.com/reader/full/lit-rev-on-marinetranspo-coastal-tourismfinal 36/55
Liner shipping routes, in particular, are categorized into primary, secondary, tertiary anddevelopmental routes. (Austrial, 2002). Classification criteria used are ports being served,population and economic development in the area and cargo/passenger throughputattendant to the linkages fostered. Primary routes are those in charge of the domesticvolume which are nationally significant in nature. They usually include major ports of the
country. Those responsible for domestic volume with regional significance and linked toports with lesser throughputs than major ports are under the secondary routes whiletertiary routes include feeder routes carrying consolidated cargoes. The latter aretransported to primary and secondary routes. Developmental route, on the other hand,encompasses shipping routes without existing shipping operators but are potentiallyoperational, especially in agriculture, tourism or mining.
Types of services offered by domestic fleets are classified into passenger ferry,passenger-cargo, general cargo, container, liquid cargo/lighterage, barging, tanker,towing/salvage, pleasure and pilotage. (MARINA, 2003). Inventory of the fleetshighlights the general cargo ranking highest among the other groups. This is can be
attributed to the high scale of domestic trade using break-bulk mode of transportation.Shares of container vessels and tankers, on the other hand, have been observed to beincreasing. Passenger cargo vessels, also, have taken a relatively high percentage of themarket. Domestic shipping enterprises have also increased as more companies areseeking for accreditation. Moreover, vessel acquisitions have also gone up as morevessels have been approved by MARINA. (See Excel files for figures).
In the national economy, the marine transportation sector plays a significant role in itscontribution to the country’s Gross Domestic Product (GDP). In fact, the sector accountsfor half of the GDP throughout the 1990s. The increasing passenger traffic and volume of domestic cargo have resulted in the sustained growth of the sector. Trade activitiesrequiring transport of commodities for exports and imports have made the sector morevaluable as transit cargos have continued to increase. (See Excel files).
Institutional and Regulatory Framework
The table below presents all stakeholders that make-up the shipping industry.
Table 11. Shipping Industry Stakeholders
Institutions/Stakeholders Description/FunctionMaritime Industry Authority Oversees the development, regulation and promotion of
the shipping industry
Flag state administrator of International MaritimeOrganization (IMO) in the Philippines
Certifies Filipino seafarers
Philippine Coast Guard (with PPA andMARINA)
Implements safety shipping-related marine pollution rulesand standards
Maintains and operates aids to navigation Enforces maritime laws and regulations
Department of Environment and NaturalResources
Regulates all kinds of environmental pollution, includingmarine (oil spillage, garbage dunping etc.)
30 THEPHILIPPINEENVIRONMENTALGOVERNANCE2 PROJECT

8/8/2019 Lit Rev on MarineTranspo-Coastal Tourism_FINAL
http://slidepdf.com/reader/full/lit-rev-on-marinetranspo-coastal-tourismfinal 37/55
Institutions/Stakeholders Description/FunctionCommission on Higher Education(CHED), Maritime Training Council(MTC), TESDA and other private andpublic maritime schools
Regulates schools offering maritime education and trainingof various types of seamen
National Telecommunications
Commission (NTC)
Regulates all form of telecommunication, including grant
of radio frequencies for vessels whether ship-to-ship, shipto shore or ship to INMARSTAT and GMDSS
Professional RegulatoryCommission Licensure (marine engineering/marine transport)
Ship Classification Applies ship inspection rules for vessels 500GRT andabove in accordance with International Association of Classification Societies (IACS)
Shipping Companies Domestic and foreign shipping companies calling atPhilippine ports
Main organization: PISA Member Organizations of PISA: Liners – DSA; Trampers
– UTAP; Ferry Operators – VAFCSO; tankers – PhilippineTanker Operators; Ocean-going - FSA
Pilotage Service Companies Offers pilot services at major ports Association: United Harbor Pilot Association of the
Philippines
Shippers Private cargo owners Port users (exporter/importers, domestic manufacturers,
traders) Organizations: DMAP, PHILEXPORT, Federation of
Mindanao Shippers, PCCI, FPI
Seafarers Ship officers and crew Organization: Association of Maritime Officers and
Seafarers Union of the Philippines (AMOSUP)
Forwarding companies Provides cargo consolidation and freight forwardingservices
Trucking companies Inland trucking service providers Organization: CTAP
Forwarding companies, customs brokersand 4th Party Logistic providers
Provides services to shippers including tracking,documentation and customs clearance
Consumers/passengers General public
Source: Llanto et al, 2005
Fees and Charges
Fees and charges levied by MARINA are in the Excel file2
Policies
List of major policies in the sector is provided in Table 12.
LITERATURE REVIEW ON M ARINE TRANSPORTATION AND COASTAL TOURISM 31

8/8/2019 Lit Rev on MarineTranspo-Coastal Tourism_FINAL
http://slidepdf.com/reader/full/lit-rev-on-marinetranspo-coastal-tourismfinal 38/55
Table 12. Domestic Shipping Sector Policies
Policy Issuance Major ProvisionsRA 9295 or An Act Promoting theDevelopment of Philippine DomesticShipping, Shipbuilding, and Ship
Repair and Ship Breaking, OrdainingReforms in Government PoliciesTowards Shipping in the Philippines,and for other purposes
Deregulation of the shipping industry Improvement and upgrading of existing domestic merchant
fleet and Filipino crew
Provision of investment incentives through: VAT exemptionon importation of vessels, spare parts, materials for theconstruction and repair of ships, life-saving, safety, fire-fighting, cargo handling, communication, navigationequipment etc.; restrictions on vessel importation to promotelocal ship building; net loss carry over; and accelerateddepreciation
MARINA as the authority to impose,, fix, collect and receivecharges/fees collected
Establishment of MARINA Trust Fund comprising of allfees collected from licensing, supervision, regulation,inspection, approval and accreditation of domestic shipoperators and other related fees
MARINA MC No. 71
No monopolized routes adopted as a policy Entry of new additional operators in established routes/links allowed,if: cost-effective, competitive or superior service provided; andimproved quality of service and/or innovative/technologicallyadvanced shipping service introduced
No limit on vessel replacement capacities Flexibility for cargo liner operation for altering frequencies, ports of
call and swap/substitute vessels
MARINA MC No. 80, Executive OrderNo. 185 and MARINA MC No. 106
Minimum of 2 operators in any route Entry made easier in routes serviced for 5 years Newly-acquired vessels granted flexibility of entry into any route,
subject to certain conditions Entry into developmental routes encouraged by way of rates
incentives Liberalized vessel routing, amendment of frequencies/schedule,
vessel swapping/substitutionMARINA MC No. 161 Enhancement of some provisions of MC No. 106 in relation to
ruinous competition, protection on investments, financial capabilityevaluation and market survey
MARINA MC No. 46 Abolition of ad valorem rates/adoption of 3/10% valuationsurcharge to cover insurance premiums
Reclassification/upgrading of Basic Commodities Class(agricultural products) to Class C Basic
Deregulation of 2nd Class Passage Rates
MARINA MC No. 57 Deregulation of Reefer, Transit & Livestock rates Abolition of 3/10% valuation surcharge Adoption of Fork Tariff System, initially set at +5%/-5%
MARINA MC No. 67 Institution of Automatic Fuel Adjustment Mechanism Widening of Fork Tariff range to 10%/-15%
EO No. 213 and MARINA MC No. 117 Deregulation of all commodities Class A, B and C except for non-containerized Basic commodities
Exempting DOT-accredited vessels from allocating 50% of theirpassenger capacities to 3rd class accommodations; deregulation of passage rates for DOT-accredited vessels serving touristdestinations
MARINA MC No. 153 Further deliberalization through removal of DOSCCCONS in theprocess of rate determination
Domestic shipping Service MonitoringSystem (DOSSMONS)
This is a M & E database system of all contents andinformation recorded in operators Annual Reports.
32 THEPHILIPPINEENVIRONMENTALGOVERNANCE2 PROJECT
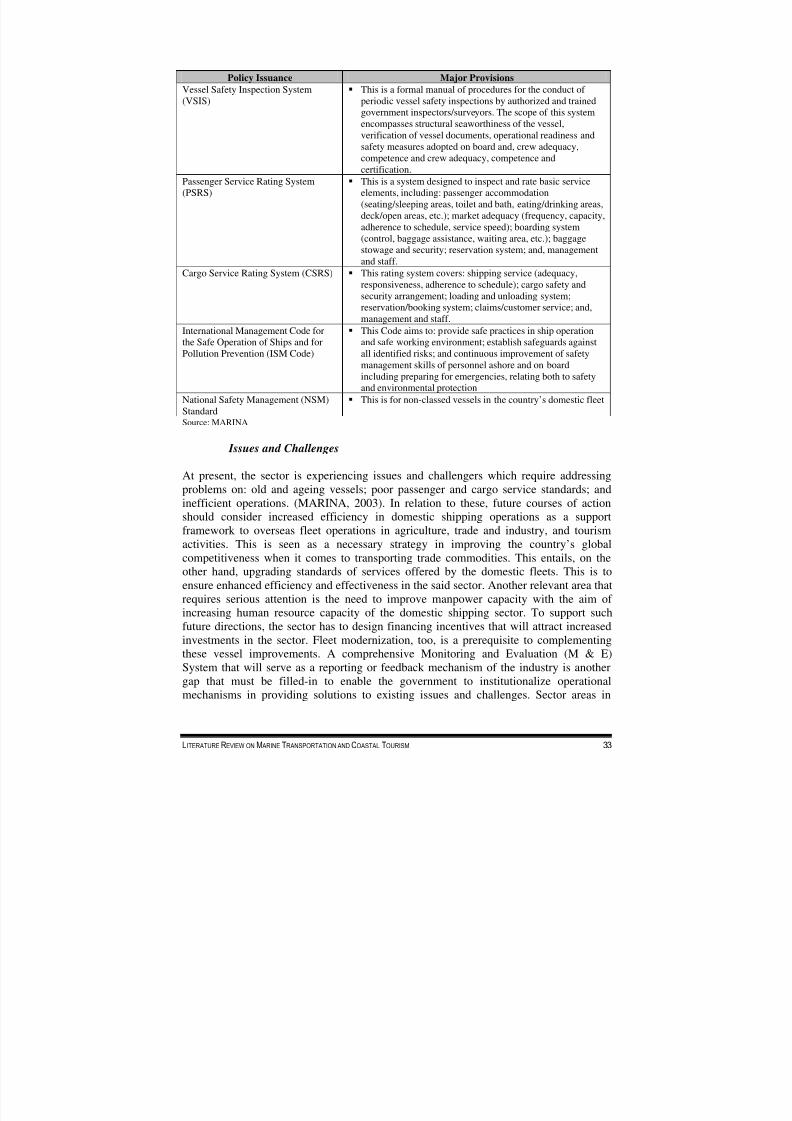
8/8/2019 Lit Rev on MarineTranspo-Coastal Tourism_FINAL
http://slidepdf.com/reader/full/lit-rev-on-marinetranspo-coastal-tourismfinal 39/55
Policy Issuance Major ProvisionsVessel Safety Inspection System(VSIS)
This is a formal manual of procedures for the conduct of periodic vessel safety inspections by authorized and trainedgovernment inspectors/surveyors. The scope of this systemencompasses structural seaworthiness of the vessel,verification of vessel documents, operational readiness and
safety measures adopted on board and, crew adequacy,competence and crew adequacy, competence andcertification.
Passenger Service Rating System(PSRS)
This is a system designed to inspect and rate basic serviceelements, including: passenger accommodation(seating/sleeping areas, toilet and bath, eating/drinking areas,deck/open areas, etc.); market adequacy (frequency, capacity,adherence to schedule, service speed); boarding system(control, baggage assistance, waiting area, etc.); baggagestowage and security; reservation system; and, managementand staff.
Cargo Service Rating System (CSRS) This rating system covers: shipping service (adequacy,responsiveness, adherence to schedule); cargo safety andsecurity arrangement; loading and unloading system;reservation/booking system; claims/customer service; and,management and staff.
International Management Code forthe Safe Operation of Ships and forPollution Prevention (ISM Code)
This Code aims to: provide safe practices in ship operationand safe working environment; establish safeguards againstall identified risks; and continuous improvement of safetymanagement skills of personnel ashore and on boardincluding preparing for emergencies, relating both to safetyand environmental protection
National Safety Management (NSM)Standard
This is for non-classed vessels in the country’s domestic fleet
Source: MARINA
Issues and Challenges
At present, the sector is experiencing issues and challengers which require addressingproblems on: old and ageing vessels; poor passenger and cargo service standards; andinefficient operations. (MARINA, 2003). In relation to these, future courses of actionshould consider increased efficiency in domestic shipping operations as a supportframework to overseas fleet operations in agriculture, trade and industry, and tourismactivities. This is seen as a necessary strategy in improving the country’s globalcompetitiveness when it comes to transporting trade commodities. This entails, on theother hand, upgrading standards of services offered by the domestic fleets. This is toensure enhanced efficiency and effectiveness in the said sector. Another relevant area thatrequires serious attention is the need to improve manpower capacity with the aim of increasing human resource capacity of the domestic shipping sector. To support suchfuture directions, the sector has to design financing incentives that will attract increasedinvestments in the sector. Fleet modernization, too, is a prerequisite to complementingthese vessel improvements. A comprehensive Monitoring and Evaluation (M & E)System that will serve as a reporting or feedback mechanism of the industry is anothergap that must be filled-in to enable the government to institutionalize operationalmechanisms in providing solutions to existing issues and challenges. Sector areas in
LITERATURE REVIEW ON M ARINE TRANSPORTATION AND COASTAL TOURISM 33

8/8/2019 Lit Rev on MarineTranspo-Coastal Tourism_FINAL
http://slidepdf.com/reader/full/lit-rev-on-marinetranspo-coastal-tourismfinal 40/55
which the government plays a critical role are vessel safety, passenger service standards,cargo service standards and regulated operational conditions and requirements. Inaddition to the above, basic issues requiring immediate solutions include the following:1) scale of deregulation to be adopted by the sector; 2) cap deregulation on Return onInvestments (ROI) on public utilities; 3) proposed liberalization of cabotage for increased
efficiency in transporting country’s exports and imports; 4) need to increase localshipbuilding capacity in response to growing tonnage demand; 5) planned deregulation of port operations to provide necessary port infrastructures and services; and 6) shift of focus to tertiary, developmental and ferry routes as a strategy in serving the majority.
2. Overseas Shipping
Profile
For the period 2002-2004, bulk carriers have ranked highest in terms of market share inthe overseas shipping sector with an average annual share of 48%. General cargo, on the
other hand, is second among all the other vessel types comprising the overseas fleet of thecountry. Types of service offered by overseas shipping sector include bulk carrier,general cargo, car carrier, livestock carrier, container, reefer, multi-purpose, tanker, Ro-Ro, LPG carrier, log carrier, passenger, dry cargo and vehicle carrier. Revenues of thesector come from MARINA collection on application fees, penalties, BIR collection onthe 4.5% withholding tax on charter hires for bareboat chartered vessels and remittancesfrom seafarers of RP flag vessels. In particular, in 2004, MARINA earned P7.82 millionfrom application fee and penalty charges. On the other hand, amount collected from the4.5% withholding tax totaled to P106.19 million. Remittances of Filipino seafarers alsocontribute significantly to the country’s economy with a recorded amount of P1,519.86million in 2004.
An important development in the sector is the establishment of regional shipping lines inthe Zamboanga - Sandakan (Malaysia), General Santos City – Bitung (Indonesia) andDavao – Muara (Brunei) shipping routes.
Eight hub centers identified in the Mindanao Region are Bongao, Cagayan de Oro City,otabato City, Davao City, General Santos City, Iligan City, Puerto Princesa andZamboanga City.
Policies
List of major policies in the sector is provided in Table 13.
34 THEPHILIPPINEENVIRONMENTALGOVERNANCE2 PROJECT

8/8/2019 Lit Rev on MarineTranspo-Coastal Tourism_FINAL
http://slidepdf.com/reader/full/lit-rev-on-marinetranspo-coastal-tourismfinal 41/55
Table 13. Overseas Shipping Sector Policies
Policy Issuance Major ProvisionsRA 9301 or An Act to Promote theDevelopment of Philippine OverseasShipping and for Other Purposes
Exemptions of overseas shipping companies fromincome taxes and import duties and and taxes on
ships, spare parts, machinery, equipment andmaterials used for shipbuilding, ship repair oralteration of ships owned and/or operated by them
Expansion of definition of Philippine OverseasShipping Sector to include all types of operation,including purchase of ships for operation and saleof ships after operation;
Granting of exemption from income tax foranother ten years;
Increase of allowable percentage deduction in theentire net income from 10% to 15% fordistribution of profits or declaration of dividendsunder certain conditions;
Provisions for cumulative amount to be reinvestedshall not be withdrawn from previous 10 years to 7years;
Penal provisions increasing the fine from P10,000to P100,000.
Port Tariff Policy under ResolutionNo. 1470
Defining ships trading in BIMP-EAGA as domestic ships andrequiring them to pay the equivalent of a domestic usage feewhen they call the country’s southern ports
MC No. 237 Exemption from payment of travel tax to all passengers by seaoriginating from all international ports in Mindanao
Source: MARINA
Issues and Challenges
A major challenge faced by the sector is the observed increasing downward trend in thenumber of overseas Philippine-registered ships from 1997 (322 ships) to 2003 (167ships). Related reasons for this downward number are re-flagging of ships and lowsalaries of seafarers of other neighboring countries. Another contributory factor in thepresent condition of the sector is the low participation in the carriage of the country’sforeign trade due to specialization of the country’s fleets in tramp vessels which hardlycall on Philippine ports since they are less involved in carrying Philippine cargoes. Arelated issue, also, is the existing Philippine trading arrangements where the foreigntrading partners elect the vessel which will move the cargoes. Similar with the domesticshipping sector, the overseas sector is also beset with inadequate financing and incentiveoptions that will bring-in more investments. Still, a policy challenge is the insufficientship mortage legislation being lobbied by MARINA and private overseas shippingindustry. (MARINA, 1998)
LITERATURE REVIEW ON M ARINE TRANSPORTATION AND COASTAL TOURISM 35

8/8/2019 Lit Rev on MarineTranspo-Coastal Tourism_FINAL
http://slidepdf.com/reader/full/lit-rev-on-marinetranspo-coastal-tourismfinal 42/55
B. PORT SECTOR
Profile
National Statistic Coordination Board (NSCB) defines port as “place where ships may
anchor or tie-up for the purpose of shelter, repair, loading or discharge of cargo, or forother such activities connected with water-borne commerce, and including all the landand water areas and structures, equipment and facilities related to these functions.”2 United Nations (2001) characterize ports as a “collection of physical resources, includingfacilities and land, and services designed to provide an interchange between water andland transport systems.”3 Seaport activities can, thus, be classified into: infrastructure;port services using infrastructure; and coordination of port activities such as sorting,manufacturing and distribution. Berths, docks and adjacent lands for ships and cargoesconstitute a port infrastructure. Also necessary to support such infrastructure are maritimeaccess (channels, locks and aids to navigation) and land access (connections to roads, railnetwork and inland waterways). Main facilities and services provided by ports for
cargoes are listed below.
Table 14. Port Facilities and Services
Cargoes Passengers Ships1) Ship arrival/departure: navigation
aids, approach channel, pilotagefrom outside the port, lock (if any),protected water, port pilotage,towage, berthing/unberthing
2) Quayside: opening/closing of hatches, breaking-out/stowage,cargo handling onboard ship
3) Cargo/container transfer to/fromquay: superstructure such as fixedand mobile equipment (cranes, vancariers, transtainers)
4) Cargo arrival/departure: cargohandling on quay, transport to/fromstorage, storage superstructure(sheds, fuel tanks, office buildingsetc.), delivery/receiving, road andrail shipment facilities and otherland transport access infrastructure
5) Services such as warehousing,security, weighting, lighterage and
rent of equipment
Similar with facilities andservices provided forcargoes
Services such as radarsurveillance and trafficmanagement, water, telephone,stores and fuel, police andsecurity, repairs, fire fighting,waste disposal and medicalservices
Source: United Nations, 2001
2 Ports Inventory Technical Notes, http://www.nscb.gov.ph/technotes/port_tech.asp3 United Nations. 2001. The Economic Regulation of Transport Infrastructure Facilities and Services: Principles andIssues. United Nations, New York.
36 THEPHILIPPINEENVIRONMENTALGOVERNANCE2 PROJECT

8/8/2019 Lit Rev on MarineTranspo-Coastal Tourism_FINAL
http://slidepdf.com/reader/full/lit-rev-on-marinetranspo-coastal-tourismfinal 43/55
Economic performance indicators for ports can be measured using these parameters:physical performance; factor productivity; and economic and financial factors. (UnitedNations, 2001). Physical performance can be defined using ship turnaround times, cargo-handling time, berth occupancy rates and cargo dwell times, depending on ship and cargotypes. Factor productivity, on the other hand, can be computed using tons of cargo
handled per worker or gang-hour, or per crane hour, or per berth meter. Total income of operating surplus per GRT/NRT or operating surplus per ton handled are the mostcommon indicators used for determining economic and financial impacts of portactivities.
The Philippine port system is comprised of four categories, namely: 1) Philippine PortsAuthority (PPA) system made up of public and private ports; 2) ports under the jurisdiction of independent port authorities (IPAs); 3) devolved public ports to LGUs,including fishing ports and wharves; and 4) Road Roll-On Roll-Off Terminal System(RRTS). (Llanto, 2005). The PPA port system is the biggest port network system in thecountry. It classifies its ports into base ports, terminal ports and other government ports.
There are 115 PPA-owned ports and more than 500 private (commercial and non-commercial/industrial) ports under PPA’s direct supervision. Private ports are usuallyintended for industrial purposes while there are also a number for commercial uses. Atpresent, there are 30 private commercial ports. These PPA ports are financiallyindependent from the government. Port revenues of these category come from:concession fees from the lease of South Harbor and Manila International ContainerTerminal (MICT); port charges such as wharfage, berthing and pilotage; and share of cargo handling revenues from private cargo-handling operators and from port charges of privately-operated ports. To mention, 50% of its net income is given to the nationalgovernment as dividends. In addition, these ports handle domestic and foreign cargo(containerized and bulk) and passengers. In some instances, RORO operations areallowed in PPA ports. Institutional and regulatory framework for PPA Ports is shown inthe table below.
Table 15. Legal Authorities on Philippine Port System
Port SystemPort Authority and Legal
Framework RegulationPPA Port System
LOLO and ROROoperations; containerizedand non-containerizedcargoes
PPA as the main authority inthe national port system perPresidential Decree No. 505 asamended by PD 857
PPA as a government-ownedand controlled corporation
(GOCC), an attached agencyto DOTC
Characterized by self-revenuegeneration, financialindependence from thegovernment and declaresdividends to governments
Public Ports- Development, ownership,
maintenance and regulation of itsports
- Setting and collection of portcharges such as wharfage dues,
berthing/usage fees and terminalhandling costs
- Approval of increases in cargohandling rates and receipt pf 10%and 20% from cargo handlingrevenues on domestic and foreigncargo, respectively
- Awarding of contracts to privateterminal operators and cargo
LITERATURE REVIEW ON M ARINE TRANSPORTATION AND COASTAL TOURISM 37

8/8/2019 Lit Rev on MarineTranspo-Coastal Tourism_FINAL
http://slidepdf.com/reader/full/lit-rev-on-marinetranspo-coastal-tourismfinal 44/55
Port Authority and LegalPort System Framework Regulation
handling operators (2 yearprobationary contract/10 yearcontract without public bidding);PPA sets port charges and cargo
handling rates
Private ports- Regulation of private ports through:
issuance of permit to construct andoperate the port; and approval of increases in cargo handling rates andport charges such as berthing/usagefees and wharfage dues; collectionof 50% share from port charges
Source: Llanto et al, 2005
For those outside of the jurisdiction of PPA, there are six independent port authorities
(IPAs) are:
1) Subic Bay Metropolitan Authority (SBMA) operating and managing the SubicBay Freeport in Zambales;
2) Cebu Port Authority (CPA) taking charge of all ports in Cebu Province;3) Cagayan Economic Zone Authority (CEZA) supervising Port Irene operations;4) Phividec Industrial Authroity (PIA) managing Mindanao Container Port Terminal
(MCPT) in the Phividec Industrial Estate in Cagayan de Oro;5) Autonomous Region of Muslim Mindanao (ARMM) for the devolve ports in
Polloc, Jolo and Bongao; and6) Bases Conversion Development Authroity (BCDA) overseeing port in San
Fernando, La Union and former US facility in Clark Field, Pampanga.
All these IPAs originated from the PPA port system. These independently set their ownrates following the PPA. Creation of IPAs is towards decentralization, increasedcompetition and increased LGU participation.
On the other hand, ports under the LGUs are those which have been built by the nationalgovernment but later transferred to the LGUs and those built by LGUs themselves.Records show that there are 427 fishing ports, landing stages and municipal feeder portsin the country. Fishing ports, in addition to basic fishing uses, also handle somecommercial cargo transfer under the agreement of PPA and Philippine Fisheries
Development Authority (PFDA). PFDA classifies its ports, to mention, into municipalfishing, commercial fishing and multi-purpose fishing.
The RORO system, established in 2003, has become a central function in the nationalhighway network and works towards upscaling to the PPA Port System. It has providedincreased access to island provinces and regions. It serves as an answer to increasedefficiency and lower costs in moving passengers and goods from Mindanao to Luzon.Existing Memoranda of Agreement (MOA) for establishing a network between LGUs
38 THEPHILIPPINEENVIRONMENTALGOVERNANCE2 PROJECT

8/8/2019 Lit Rev on MarineTranspo-Coastal Tourism_FINAL
http://slidepdf.com/reader/full/lit-rev-on-marinetranspo-coastal-tourismfinal 45/55
and private investors are: Cebu (Cordova) – Getafe (Bohol); Guadalupe (Southern Leyte)– Ubay (Bohol); Loay (Bohol) – Mambajao (Camiguin); Camiguin – Misamis Oriental;and Jasan (Misamis Oriental) – Loay (Bohol).
It is interesting to note that NSCB has other port classification types which are: 1)
commercial private ports owned and operated by private companies for their ownpurposes; 2) commercial public ports owned and operated by the government for thegeneral public and accommodate vessels of more than 30 tonnage; 3) fishing ports ownedand operated by government or private companies as central collection and distributioncenter for fish; and 4) feeder ports owned and operated by the government as linkagesamong neighboring small islands and nearby urban centers for small passenger andfishing boats.
Institutional and Regulatory Framework
The diagram below illustrates the present institutional and regulatory framework
discussed above.
Philippine Port System
PPA
CPA, SBMA,CEZA, PHIDEC,
ARMM
PublicPorts
IPA DOTC RRTS
PrivatePorts Municipal
Ports/FishingWharves
PrivateRORO
Terminals
LGURORO
Terminals
Philippine Port System
PPA
CPA, SBMA,CEZA, PHIDEC,
ARMM
PublicPorts
IPA DOTC RRTS
PrivatePorts Municipal
Ports/FishingWharves
PrivateRORO
Terminals
LGURORO
Terminals
Figure 2. Philippine Port System
Fees and Charges
For the facilities and services provided by ports, prices are generally categorized into:port dues or amount of money paid for the use of the port facilities as a whole; and porttariffs charged either to ship owners or cargo owners. (United Nations, 2001).Specifically, these two can further classified into:
1) Port dues. These are charges on cargo and ships. Cargo dues are based on the volumeor weight of the cargo while ship dues are computed in reference with grossregistered tonnage (GRT), net registered tonnage (NRT) or length of ship.
2) Port Tariffs- Berth Occupancy. Tonnage or ship and quay length are often used as bases for
additional charges. This is usually charged on a time basis, such as per day.
LITERATURE REVIEW ON M ARINE TRANSPORTATION AND COASTAL TOURISM 39

8/8/2019 Lit Rev on MarineTranspo-Coastal Tourism_FINAL
http://slidepdf.com/reader/full/lit-rev-on-marinetranspo-coastal-tourismfinal 46/55
- Aids to navigation. This is calculated on the basis of ship’s size and for a givenperiod of time or number of visits
- Berthing/unberthing. This depends on ship size or per operation- Pilotage. This is based on different parameters, including vessel draught, ship size
or a combination of tonnage and distance pioted-
Towage. This can be levied based on the characteristics of the ship such as size orof the tug such as its power. The tug cab also be defined per operation or per unit of time
- Storage and warehousing. This is usually computed based on the length of staycombined with either the characteristics of the cargo or area occupied
- Cargo handling. This is charged on the basis of weight or volume and by cargotype.
Fees and charges charged by PPA are in Excel file2.
Policies
The table below lists major policies concerning the port sector.
Table 16. Port Sector Policies
Policy Issuance Major Provisions1992 Law (still to research on this) 50% of PPA’s total income to accrue to national government
as dividends (Llanto et al, 2005)
MC 41-2002 Adoption of a universal government share of 10% fordomestic cargoes and 20% for foreign cargoes from therevenues of cargo handling operators nationwide
EO 170 Private sector and local government collaboration in theestablishment of RORO links as part of the national highway
network Privatization and/or devolution of existing public RORO
ports under the PPA or Cebu Ports Authority Encouragement of existing private port operators to convert
their operations to RORO Increased participation of LGUs and private investors in
developing nautical highway for private and publicobjectives.
Source: MARINA
Issues and Challenges
A serious problem which has to be addressed by the sector is its inefficiency in handlingforeign trade. (Llanto, 2005). In fact, the Philippine ports have proven to be the leastefficient when compared with other Asian ports. Major causes of this inefficiency are: 1)inadequate port vessel capacities; 2) ineffective port management and administration; and3) present anti-competitive policies and regulations. The table below shows efficiencyratings of some Asian ports.
40 THEPHILIPPINEENVIRONMENTALGOVERNANCE2 PROJECT

8/8/2019 Lit Rev on MarineTranspo-Coastal Tourism_FINAL
http://slidepdf.com/reader/full/lit-rev-on-marinetranspo-coastal-tourismfinal 47/55
Table 17. Indicators of Port Efficiency
CountryPort Efficiency Index
(1 – 7)Median Clearance time
(Days)Hong Kong 6.38 na
Malaysia 4.95 7Philippines 2.79 7
Singapore 6.76 2
Taiwan 5.18 na
The highly centralized port ownership and administration in relation to the functionsperformed by PPA also poses a challenge to the sector. (Llanto et al, 2005). PPA acts as adeveloper, operator, owner and regulator of ports. In the same way, it regulates privateports, awards contracts for cargo handling services to the private sector in ports owned byit and regulates entry of the private sector through the issuance of permits to constructand operate ports. As a result of conflicting interests, there has been limited competition
in the industry. For one, PPA works against full competition in the foreign containerizedmarket which has the potential of affecting income from Manila International ContainerTerminal (MICT) and South Harbor. In the same manner, the strategy of letting HarborCenter Port Terminal (HCPT) handle foreign break-bulk cargoes reduced the incomesources of South Harbor. This, then, affects the amount of dividends that PPA shouldremit to the national government. A more evident result, however, is the downward trendof financial resources that may be used for port development and maintenance activities.
Llanto et al (2005) concludes that financial sustainability of the sector is also a criticalconcern at present. JICA (2003) cites that existing port charges such as tariffs fordomestic berthing and cargo handling have been set very low to support the sector’s
operations and management. This brings about financial dependence of LGU-operatedports.
Another present challenge in port operations is the preference for multiple cargo handlingthan the RORO shipping. (Llanto et al, 2005). 18% of the total revenues, in 2001, wascontributed by multiple cargo handling activities. Revenues which may be gained fromthese by private investors undermine RORO’s benefits in decreased breakage anddeterioration of cargoes, increased security of cargoes and reduction in pilferage.
Israel and Roque (2000) underscore the challenges faced by regional fishing ports. Amajor finding of the study is the underutilization of existing regional fishing ports derived
by comparing projected usage and actual usage of the port samples. (See Excel files).Factors contributing to this underutilization are limited post-harvest facilities anddeclining fish catch landed on regional fishing ports. More than this, however, is theinadequacy of municipal fishing ports and facilities in the country. In 1997, national ratioof municipal ports to coastal municipalities accounted to 50% only. Another pressingissue in fishing ports is the need to improve environmental management practices.Construction of wastewater treatments plants have to be a priority in order to addresssuch problem.
LITERATURE REVIEW ON M ARINE TRANSPORTATION AND COASTAL TOURISM 41

8/8/2019 Lit Rev on MarineTranspo-Coastal Tourism_FINAL
http://slidepdf.com/reader/full/lit-rev-on-marinetranspo-coastal-tourismfinal 48/55
Given the above discussions, it is clear that there is a need to comprehensively review theregulatory framework of the port industry. (Llanto et al, 2005). The review should resultin distinction of PPA’s regulatory functions from its development and operationassignments. Related with this is the urgent solution to the lack of transparent guidelines
in granting or extending cargo handling contracts. In addition, PPA should considerleasing port facilities to port operators rather that collecting a percentage of revenues. Areview of the tariff setting procedures is also seen as a must as a preparatory step towardsrate deregulation.
For fishing ports, PFDA has to list options by which to maximize usage of these ports.Israel and Roque (2000) suggests that ports also be used as integrated fisheries-agriculture processing centers. Leasing these ports to private companies is also anoteworthy consideration in increasing usage of these ports. Post-harvest facilities havealso to be constructed to increase economic activities in these ports. Thus, agriculturaland fishery production of a municipality is a key factor influencing port usage.
42 THEPHILIPPINEENVIRONMENTALGOVERNANCE2 PROJECT

8/8/2019 Lit Rev on MarineTranspo-Coastal Tourism_FINAL
http://slidepdf.com/reader/full/lit-rev-on-marinetranspo-coastal-tourismfinal 49/55
V. PHILIPPINE COASTAL TOURISM
A. STATUS OF COASTAL TOURISM IN THE PHILIPPINES AND THEIR IMPACTS
Coastal tourism is a big industry in the Philippines due to the country’s archipelagiccharacteristics. 1996 EMB Report (cited in Torrel and Salamanca, 1997) shows that 18 of the top 25 tourist destinations are coastal. White sandy beaches, submarine gardens anddiving grounds are the most common natural attractions. The report estimates that of these, 246 or 70% are beaches, 77 or 22% are islands and 30 or 80% are fishing anddiving grounds, submarine gardens and bays.
Among the most popular coastal destinations are: Mabini/Tingloy in Batangas, PuertoGalera in Mindoro, Boracay Island, Northern Palawan Islands and Bays, Moalboal inCebu, Negros Oriental, Siquijor and Apo Islands, Donsol in Sorsogon, Mactan andOlango Islands in Cebu, Surigao and Siargao coasta, Panglao Island in Bohol, Camiguin
Island and Samal Island in Davao Gulf. (Huttche et al, 2002). Coastal tourism activitiesin the country revolve around resorts, hotels, recreation like scuba diving and snorkeling,beaches, nearby destination areas as well as residential and support services such astransportation, waste/effluent treatment, tour operations, sightseeing, businesses andhandicraft industries. (DENR et al, 2001).
A typical coastal tourism activity in the country is the development and operation of small resorts. Majority of these resorts, however, have been poorly planned in relation toresources—coral reefs, nearshore water quality and clean beaches. International resortchains, on the other hand, have just started to adopt stricter environmental practices.(Huttche et al, 2002). A major factor contributing to degradation of coastal resources due
to tourism activities is the lack of user fee systems. Since coastal resources are subject tofree access, users do not have the disincentive to employ harmful practices. Below is atable listing existing costs and benefits derived from coastal tourism activities in thecountry.
Table 18. Coastal Tourism Economic Impacts
BenefitsExpected Environmental
and Welfare ImpactsIncreased local economic/development activities Increased LGU revenues from local investments
Increased employment
Increased manpower capacity Enhancement of people skills
Increase entrepreneurship among locals
LITERATURE REVIEW ON M ARINE TRANSPORTATION AND COASTAL TOURISM 43

8/8/2019 Lit Rev on MarineTranspo-Coastal Tourism_FINAL
http://slidepdf.com/reader/full/lit-rev-on-marinetranspo-coastal-tourismfinal 50/55
CostsExpected Environmental
and Welfare Impacts
Increased solid waste generation Degraded water quality and habitats Public health risk Aesthetic losses
Increased SWM costsIncreased sewage disposal Degraded water quality
Species toxicity Habitat loss Public health risk Recreational losses Aesthetic losses Increased costs for wastewater management
Increased area development Water pollution Limited use of coastal areas for traditional
activities
Increased recreation activities such as sightseeing,reef walks and souvenir collection
Resource depletion
Employment of local residents and increasedimmigrant employees
Decreased labor force on non-tourism activities Increased population
Source: Adopted from Wells, 1997 and DENR et al, 2001
B. LEGAL FRAMEWORK
Philippine Tourism Authority (PTA) is the lead agency mandated to coordinate alltourism project plans as provided by Presidential Decrees (PDs) 189 and 564 whileDENR oversees the implementation of the Environmental Impact Statement (EIS)System and issuance of Administrative Orders (AOs) LGUs, on the other hand, formulateand implement ordinances addressing specific tourism issues within their jurisdiction.
Table 19 identifies coastal tourism issues, applicable policies and responsible agencies.
Table 19. Coastal Tourism Issues, Applicable Policies and Responsible Agencies
Coastal Tourism RelatedAspect Legislation and Responsibilities Responsible Agency
Environmental ImpactStatement (IES) System
DENR Administrative Order No. 96-37,providing: EIA done by the project proponent – the
tourism developer – within the EIS System Initially, conduct of Initial Environmental
Examination (IEE) For larger projects or projects with potentialsignificant environmental impacts within anEnvironmentally Critical Area (ECA), conductof a more detailed Environmental ImpactStatement (EIS)
Issuance of Environmental ComplianceCertificate (ECC) by the DENR afterevaluation and approval of IEE, EIS or
Environmental ManagementBureau (EMB) of DENR of Protected Areas and WildlifeBureau (PAWB) if aprotected area is concerned
44 THEPHILIPPINEENVIRONMENTALGOVERNANCE2 PROJECT

8/8/2019 Lit Rev on MarineTranspo-Coastal Tourism_FINAL
http://slidepdf.com/reader/full/lit-rev-on-marinetranspo-coastal-tourismfinal 51/55
Coastal Tourism RelatedAspect Legislation and Responsibilities Responsible Agency
checklistCritical habitats andendangered wildlife
Coral reef, mangrove and estuarine ecosystemsare critical habitats protected by the FisheriesCode and various other laws preventing
destruction, degradation or alteration Whales, dolphins, dugong, whale shark, sea
turtles, sea snakes, manta rays, milkfish, giantclams, Triton and Helmet shells and selectedother mollusks, all stony and precious coralsand the Coconut crab are protected fromcollection and alteration of habitat
DENR, BFAR RegionalOffices and LGUs
Foreshore Areas DENR Administrative Order No. 99-34governing foreshore areas specifies the processfor foreshore leases and limits the type of development
DENR Regional Offices
Shoreline Setback Water Code of the Philippines (PD 1067)
Article 51, providing:- The use of banks of rivers, lakes, streams andshores of seas, throughout their entire lengthand within a distance of 3 m in urban areas, 20m in agricultural areas and 40 m along theirmargins are subject to public easement wherebuilding of structures of any kind is prohibited.
DENR Administrative Order No. 97-05providing:- 20 m direct measurements from the edge of the high water line, to be excluded fromdevelopment and to be kept with vegetative
cover and planted with trees. Sufficientmeasures shall be undertaken to preventerosion.
DENR Regional Offices,
LGUs
Marine Protected Areas National Integrated Protected Areas (NIPAS)Act of 1992 mandates the protection of selectedareas under the direction of a Protected AreaManagement Board (PAMB) that is locallyconstituted and chaired by DENR
RA 7160 and RA 8550 mandates LGUs toestablish MPAs that regulate uses and activities
DENR Administrative Order No. 2000-51:“Guidelines and Principles in Determining Fees
for Access to and Sustainable Use of Resourcesin Protected Areas” provides guidelines todetermine fees for protected areas underNIPAS jurisdiction
PAWB of DENR, LGUs
Marine Tourism Areas PD 1801 declares many small islands astourism areas and limits other types of development in the specified areas
DENR Administrative Order No. 99-31:
Department of Tourism
PAWB of DENR
LITERATURE REVIEW ON M ARINE TRANSPORTATION AND COASTAL TOURISM 45

8/8/2019 Lit Rev on MarineTranspo-Coastal Tourism_FINAL
http://slidepdf.com/reader/full/lit-rev-on-marinetranspo-coastal-tourismfinal 52/55
Coastal Tourism RelatedAspect Legislation and Responsibilities Responsible Agency
“Ecological Destination DevelopmentGuidelines for Turtle Islands, Tawi-Tawi”details the types of development and activitiesallowed within the Turtle Islands Heritage
Protected AreaEcotourism Presidential Executive Order No. 111/1999:
Establishes an inter-agency NationalEcotourism Development Council (NEDC) aspolicy-making body for ecotourism
National ecotourism strategy, program,guidelines, etc.
Inter-agency Regional Ecotourism Committees(RECs) approve and monitor ecotourismprojects in the region
DENR Administrative Order 2001-04: Definesecological destinations and sets guidelines on
the establishment, development andmanagement of ecological destinations andenvironmental rest area parks
DOT and DENR
DENR Regional Offices,LGUs
Small Island Development DENR Administrative Order No. 2000-83concerning small island development
Refers to islands with an area of less than50,000 has
Islands less than 500 has are strict conservationareas, no renewal of leases allowed
Islands of 500 to 5,000 has are under restricteduse. For tourism: No construction and/oroperation of casinos, high rise hotels (3 storeys
and up), golf courses/driving range Islands of 5,000 to 50,000 has are open to
sustainable development within the prescribedcarrying capacity and subject to EIA
ECC needed for development Sets out lease/rental fees for islands
DENR Application toCENRO
Source: Huttche et al, 2002
It is important to note that most of the coastal tourism related-valuation studies conductedhave focused on valuing coral reefs as tourist attractions. Reef activities include scubadiving and underwater photography. Popular diving resorts with exceptional quality coralreefs are Mabini, Batangas, northern Palawan; Central Visayas areas of Mactan Island,Cebu; Panglao, Bohol; Negros Oriental; and selected areas of Mindanao Island. (Whiteand Trinidad, 1998). Another major area of study in coastal tourism is the valuation of marine sanctuaries as tourist destinations. Attached is an Excel file showing tourismvaluation results for corals and marine sanctuaries. Thus, there is a need for acomprehensive study on coastal tourism to include all coastal tourism activities and
46 THEPHILIPPINEENVIRONMENTALGOVERNANCE2 PROJECT

8/8/2019 Lit Rev on MarineTranspo-Coastal Tourism_FINAL
http://slidepdf.com/reader/full/lit-rev-on-marinetranspo-coastal-tourismfinal 53/55
corresponding services such as those mentioned earlier with the end in view of identifying all economic costs and benefits.
LITERATURE REVIEW ON M ARINE TRANSPORTATION AND COASTAL TOURISM 47

8/8/2019 Lit Rev on MarineTranspo-Coastal Tourism_FINAL
http://slidepdf.com/reader/full/lit-rev-on-marinetranspo-coastal-tourismfinal 54/55
REFERENCES
Austria, Myrna. 2002. Philippine Domestic Shipping Industry: State of Competition and MarketStructure, PASCN Discussion Paper No. 2002-04. Philippine Institute for Development
Studies, Makati City. http://pascn.pids.gov.ph/DiscList/d02/s02-04.pdf Bourassa, Y. et al. Resource Valuation Guide. New Brunswick Department of Environment,
http://www.atl.ec.gc.ca/community/acap/pdf/resourceguidebook_e.pdf (accessed 5September 2005).
Canmac Economics, School for Resource and Environmental Studies, EnterpriseManagement Consultants and the Secretariat of the Atlantic Coastal ZoneInformation Steering Committee. 2002. The Value of the Ocean Sector to the Economyof Prince Edward Island, prepared for the Government of Prince Edward Island andthe Government of Canada, 114p, http://www.gov.pe.ca/photos/original/fae_oceans_e.pdf (accessed 12 September 2005)
Department of Environment and Natural Resources, Bureau of Fisheries and AquaticResources and Department of Interior and Local Government. 2001.PhilippineCoastal Management Guidebook Series No. 7: Managing Impacts of Development in the Coastal Zone. Coastal Resource Management Project. CebuCity.
Francisco, Herminia. 2003. Economic Analysis of Allocating Forests and Forest Lands (TotalEconomic Valuation Approach). Philippine Environmental Governance Project, PasigCity.
Harder, Dieldre. 2004. Economic Valuation of the Impacts of Land-Based Pollution in the
South China Sea used in the Third Meeting of the Regional Task Force on EconomicValuation for the UNEP/GEF Project: “Reversing Environmental DegradationTrends in the South China Sea and Gulf of Thailand”, April 18-21, 2005. UnitedNations Environment Programme, UNEP/GEF South China Sea Project and GlobalEnvironment Facility, http://www.unepscs.org/Documents/RTF-E-3/4-RTF-E-3-Valuation%20of%20LBP%20Impact-jp.pdf (accessed 12 September 2005)
Huttche, Carsten et al. 2002. Sustainable Coastal Tourism Handbook for the Philippines.Coastal Resource Management Project, Cebu City, http://www.oneocean.org/ download/20020628/coastal_tourism_handbook.pdf (accessed 6 October 2005)
Israel, Danilo and Roque, Ruchel Marie Grace. 2000. Analysis of Fishing Ports in the
Philippines. PIDS Discussion Paper Series, No. 2000-04, January.
Kildow, Judith and Colgan, Charles. 2005. California’s Ocean Economy, Report to theResources Agency, State of California. National Economics Program, California. ,http://noep.csumb.edu/Download/CalStudy.pdf (accessed 16 September 2005)
48 THEPHILIPPINEENVIRONMENTALGOVERNANCE2 PROJECT

8/8/2019 Lit Rev on MarineTranspo-Coastal Tourism_FINAL
http://slidepdf.com/reader/full/lit-rev-on-marinetranspo-coastal-tourismfinal 55/55
King, Philip. Economic Analysis of Beach Spending and the Recreational Benefits of Beaches in the City of San Clemente, http://userwww.sfsu.edu/~pgking/ sanclemente%20final%20report.pdf (accessed 12 September 2005)
Llanto, Gilberto. 2005. A Competition Policy and Efficient regulatory Framework for the PortSector: Getting It Unberthed. Policy Nottes, 2005-01, February.
Llanto, Gilbert et al. 2005. Competition Policy and Regulation in Ports and Shipping. PIDSDiscussion Paper Series, No. 2005-02, February.
Mandale, Maurice et al. 1998. Estimating the Economic Value of Coastal and Ocean Resources:The Case of Nova Scotia. Oceans Institute of Canada and Atlantic Coastal ZoneInformation Steering Committee, Canada.
Maritime Industry Authority. 2003. The Domestic Shipping Industry of the Philippines: ASituation Report, http://www.marina.gov.ph/report/ (accessed 29 September 2005)
Maritime Industry Authority. 1998. The Domestic Shipping Industry of the Philippines: ASituation Report, http://www.marina.gov.ph/report/ (accessed 29 September 2005)
Maritime Industry Authority. 2004. The Overseas Shipping Industry of the Philippines: ASituation Report, http://www.marina.gov.ph/report/ (accessed 29 September 2005)
Maritime Industry Authority. 2004. MARINA Annual Report, http://www.marina.gov.ph/report/ (accessed 29 September 2005)
Maritime Industry Authority, Domestic Shipping Sector, http://www.marina.gov.ph/report/ (accessed 29 September 2005)
National Statistics Coordination Board. Technical Notes on Ports Inventory, http://www.nscb.gov.ph/technotes/port_tech.asp (accessed 4 October 2005)
The Allen Consulting Group. 2004. The Economic Contribution of Australia’s MarineIndustries, http://www.oceans.gov.au/pdf/Economic%20reoprt.pdf (accessed 12September 2005)
Torell, M. and A.M. Salamanca, Editors. 1997. Institutional Issues and Perspectives in theManagement of Fisheries and Coastal Resources in Southeast Asia. ICLARMTechnical Report 60, 212 pages.
United Nations. 2001. The Economic Regulation of Transport Infrastructure Facilities andServices: Principles and Issues. United Nations, New York, http://www.unescap.org/
tctd/pubs/files/econregfulltext.pdf (accessed 22 September 2005)
Wells, Michael. 1997. Economic Perspectives on Nature Tourism, Conservation andDevelopment. Environment Department Paper, No. 55